
Abstract
Common-phase synchronization of neuronal oscillations is a mechanism by which distributed brain regions can be integrated into transiently stable networks. Based on the hypothesis that schizophrenia is characterized by deficits in functional integration within neuronal networks, this study aimed to explore whether psychotic patients exhibit differences in brain regions involved in integrative mechanisms. We report an electroencephalography (EEG)-informed functional magnetic resonance imaging analysis of eyes-open resting-state data collected from patients and healthy controls at two study sites. Global field synchronization (GFS) was chosen as an EEG measure indicating common-phase synchronization across electrodes. Several brain clusters appeared to be coupled to GFS differently in patients and controls. Activation in brain areas belonging to the default mode network was negatively associated to GFS delta (1–3.5 Hz) and positively to GFS beta (13–30 Hz) bands in patients, whereas controls showed an opposite pattern for both GFS frequency bands in those regions; activation in the extrastriate visual cortex was inversely related to GFS alpha1 (8.5–10.5 Hz) band in healthy controls, while patients had a tendency toward a positive relationship. Taken together, the GFS measure might be useful for detecting additional aspects of deficient functional network integration in psychosis.
Introduction
F
Studies of the human brain at rest increased dramatically after the discovery that anatomically separated but functionally connected regions display a high level of correlated blood oxygen level–dependent (BOLD) signal activity during rest, in the absence of a task. A network of brain regions becomes coactive during rest and the assumption has been that it reflects focus on internal tasks such as daydreaming, imagining the future, and reviewing the past (Greicius et al., 2003). As a result, it has been labeled the “default mode network” or DMN. We will use the term DMN here, while acknowledging that it reflects more than processes invoked during passive rest (Binder, 2012).
Patients with schizophrenia have been reported to have both hyper- and hypoconnectivity within the DMN, and between nodes of the DMN with other cortical and subcortical regions (for reviews, see Fornito et al., 2012; Whitfield-Gabrieli and Ford, 2012). The deviations seen in schizophrenia during rest are paralleled by EEG and MEG studies showing increased amplitudes in lower delta, theta, and higher beta frequencies, with decreased amplitude in alpha frequency during rest (Boutros et al., 2008; Galderisi et al., 2009; Siekmeier and Stufflebeam, 2010).
The simultaneous acquisition of EEG and functional magnetic resonance imaging (fMRI) provides a method to link these complementary neuroimaging methodologies. Consistent with alpha band amplitude reflecting a relaxed, alert “DMN-like” state, Jann and colleagues (2010b) reported positive associations between DMN activity and alpha amplitude. Importantly, there is a negative relationship between both alpha power and amplitude and sensory networks (Goldman et al., 2002; Jann et al., 2010b; Laufs et al., 2003b; Mantini et al., 2007).
Consistent with the suggestion that DMN reflects more than passive daydreaming and mind wandering (Binder, 2012), beta band amplitude and power correlated positively with activity in the DMN and negatively with sensory networks (Jann et al., 2010b; Mantini et al., 2007). In accordance with the fact that alpha band power depends on thalamic activity (de Munck et al., 2007; Tyvaert et al., 2008) and is dampened during visual tasks (Toscani et al., 2010), there is a positive correlation between amplitude and power in the alpha band and the BOLD response in the thalamus, along with negative correlations between alpha and the BOLD response in executive and visual areas of the brain (de Munck et al., 2007; Goldman et al., 2002; Goncalves et al., 2006; Jann et al., 2010b; Laufs et al., 2003a,b; Moosmann et al., 2003; Scheeringa et al., 2012).
Individual alpha frequency (IAF) is defined as the individual center of gravity in frequency of EEG power across all channels within the alpha range of 8–13 Hz (Jann et al., 2010a). The IAF has been found to be associated with various cognitive features such as task performance or working memory (Klimesch, 1997; Richard Clark et al., 2004). Using IAF, Jann and colleagues (2012) furthermore revealed a positive association between temporal IAF fluctuations and the DMN as well as left and right working memory networks (Jann et al., 2012). Thus, while there is a relationship between alpha power and DMN, it is not unique to either alpha or DMN.
It is unknown how spatially distributed brain areas are integrated into transiently stable neural networks, although studies on visual perception suggest integration is instantiated through common-phase synchronization of neurons across areas of the brain (Kottlow et al., 2012; Singer, 1999, 2001). In their review of the literature, Uhlhaas and Singer (2010) noted that schizophrenia was associated with reduced phase locking of beta and gamma band oscillations across electrodes or trials, especially in patients with more severe positive symptoms, such as hallucinations (Uhlhaas and Singer, 2010).
In resting-state data, the relative amount of EEG activity that can be explained by phase-synchronous brain activity can be quantified in frequency domain using a measure called global field synchronization (GFS). A GFS value of 1 indicates that at the given frequency, all brain processes observable to the EEG have a common phase, whereas a GFS value of 0 indicates the absence of any preferred phase across the entity of observable sources. In a study of medication-naive, first-episode patients with schizophrenia, GFS values in the theta band during rest were significantly decreased relative to healthy comparison (HC) subjects (Koenig et al., 2001). The authors argued that this finding of reduced functional connectivity in the theta frequency represents a loss of mutual interdependence of memory functions.
Interestingly, another study linking alpha band GFS to fMRI-BOLD signal changes identified regions overlapping with the DMN (Jann et al., 2009). In this study, we aimed to extend this important relationship between the EEG-based measure of GFS and fMRI-BOLD to understand psychosis in terms of abnormalities of integrative mechanisms that potentially underlie the formation of resting-state networks.
Materials and Methods
Participants
Data were collected at two sites: San Francisco Veterans Affairs Medical Center (SFVAMC) and University Hospital of Psychiatry and Psychotherapy of the University of Bern (PUK Bern), Switzerland.
At the SFVAMC, 20 patients with DSM-IV schizophrenia (N = 13 paranoid type [295.30], N = 4 disorganized type [295.10], N = 2 undifferentiated type [295.90], N = 1 residual type [295.60]) and 5 schizoaffective disorder (295.70; total N = 25), and 20 age- and gender-matched HC subjects were studied. At the PUK Bern, 17 psychotic patients (PP) and 17 age- and gender-matched HC subjects were studied. Nine patients were diagnosed according to the ICD-10 with schizophrenia [N = 6 paranoid type (F20.0), N = 2 undifferentiated type (F20.3), and N = 1 catatonic type (F20.2)], and eight patients with brief psychotic disorder (F23). Hereinafter, all patients across sites are referred to as PP.
At the SFVAMC, PP were referred by community outpatient clinicians, and both HC subjects and PP were recruited by advertisements and word-of-mouth. At the PUK Bern, PP were recruited at the hospital and HC subjects via word-of-mouth.
At both sites, exclusion criteria for HC subjects included having a history of, or current, psychiatric and neurologic disorder, or a first-degree relative with a psychotic disorder. For both groups, exclusion criteria were any past significant medical or neurological illness, head injury resulting in loss of consciousness, or substance abuse in the past 3 months. In addition, HC subjects had no history of substance dependence (except caffeine or nicotine), while PP did not meet criteria for substance dependence within the past year. A trained research assistant, psychiatrist, or clinical psychologist conducted all interviews.
Study procedures were approved by the University of California at San Francisco Institutional Review Board and SFVAMC as well as the Local Ethics Committee of the Canton of Bern, Switzerland (KEK No. 192/05), and all participants provided written informed consent. Clinical and demographic data are presented in Table 1.
Group difference: Significant p-values of group differences are indicated in bold.
A, ambidextrous; CPZE, chlorpromazine equivalence dosage; F, female; fMRI, functional magnetic resonance imaging; HC, healthy comparison; L, left-handed; M, male; PANSS, Positive and Negative Syndrome Scale; PP, psychotic patients; R, right-handed.
Procedures
At the SFVAMC site, simultaneous EEG-fMRI data were acquired during rest. Participants were instructed to keep their eyes open (EO) and fixated on a white cross (+) in the center of a black screen for 6 min. An Avotec projector behind the scanner was used to project the stimulus on a screen attached inside of the magnet bore, and subjects viewed the screen through a mirror attached to the head coil.
At the PUK Bern, simultaneous EEG-fMRI data were also acquired during rest. Unlike the SFVAMC site, EEG data were also collected outside the scanner for later artifact removal (see the EEG and fMRI Data Acquisition and Preprocessing section). Both inside and outside the scanner, participants alternated between 2 min of EO and 2 min of eyes closed (EC). During EO inside the scanner, they were instructed to fixate on a white cross on a black screen. During EC, the screen was fully black. Starting with EO, both conditions alternated twice for 2 min each, resulting in 8 min of total time. Three white flashes indicated a switch between conditions. The flashes were not too bright to disturb subjects during EO, but bright enough to be noticed in the EC condition. None of the participants reported any discomfort during the measurement. Stimuli were presented via goggles (Visual Stim Digital MR-compatible video goggles; Resonance Technology, Inc., Northridge, CA), with a visual angle of 60°, a resolution of 800 × 600 pixels and 60 Hz refresh rate. To deliver stimulus material, E-Prime (Version 2.0.10.553; Psychology Software Tools, Inc.) was used.
At both sites, trained personnel rated the severity of psychotic symptoms using the Positive and Negative Syndrome Scale (PANSS) (Kay et al., 1987).
EEG and fMRI data acquisition and preprocessing
As the EEG and fMRI acquisition and preprocessing steps were different, in this section, we describe the procedures for each site. At the SFVAMC, continuous EEG data were collected from 31 standard scalp sites (Fp1, Fp2, F3, F4, C3, C4, P3, P4, O1, O2, F7, F8, T7, T8, P7, P8, Fz, FCz, Cz, Pz, FC1, FC2, CP1, CP2, FC5, FC6, CP5, CP6, POz, TP9, TP10) and another electrode was placed on the lower back to monitor electrocardiograms (ECGs). At the Inselspital of Bern, Switzerland, a 92-channel cap was used and two additional channels each served the recording of the electrooculogram (below the eyes) and the ECG (below the clavicles). Both sites mounted the sintered Ag/AgCl ring electrodes in an MR-compatible electrode cap from Brain Products (Gilching, Germany; input range: 16.3 mV, resolution: 16 bit) according to the 10–10 system and with a sampling rate of 5 kHz. Electrode impedances below 10 kΩ were targeted at the SFVAMC and below 20 kΩ at the Inselspital Bern, while restricting full EEG preparation to 1 h avoiding possible tiring of participants, especially patients (SFVAMC: across all subjects, 89.0% of all electrodes had impedances below 25 kΩ, 10% were higher than 30 kΩ and mean impedance was 15.5 kΩ; PUK Bern: across subjects, 88.6% of all electrodes had impedances below 25 kΩ, 7% were higher than 30 kΩ and mean impedance was 17.5 kΩ). The nonmagnetic EEG amplifiers were fixed behind the head coil and powered by a rechargeable power pack placed in the bore of the scanner and stabilized with sandbags. The subject's head was immobilized using cushions. EEG data were transmitted via an MR-compatible fiber optic cable to a BrainAmp USB Adapter that synchronized the EEG acquisition clock to the MRI master clock via a SyncBox (Brain Products) before transferring data via USB to a laptop computer placed outside the scanner room.
To provide a better overview of EEG and fMRI acquisition parameters and preprocessing steps for each site, we assembled the information in Table 2 (for a detailed EEG preprocessing description, see Supplementary Data; Supplementary Data are available online at
CCA, canonical correlation analysis; ECG, electrocardiogram; EPI, echo planar imaging; ICA, independent components analysis; PUK Bern, University Hospital of Psychiatry and Psychotherapy of the University of Bern; SFVAMC, San Francisco Veterans Affairs Medical Center; TE, echo time; TR, repetition time; x, not performed.
GFS of EEG
To adjust analysis parameters between sites (SFVAMC and PUK Bern), the EEG montage of Bern was reduced from 92 channels to the same 31 channels as used by the SFVAMC site (see the EEG and fMRI Data Acquisition and Preprocessing section above). The GFS values of the Bern data with 92 versus 31 channels were highly correlated (HC subjects mean Pearson r = 0.96, SD = 0.019; PP r = 0.95, SD = 0.05). Consequently, we would not expect different results if we would have used all 92 channels of the Bern data set.
The procedures for the computation of GFS are described in previous articles from the PUK Bern (Jann et al., 2009; Koenig et al., 2001; Kottlow et al., 2012) and briefly described as follows: for each subject, EEG data were segmented into 2-sec-epochs in relation to the scan markers of each volume (SFVAMC: TR = 2 sec, segmentation onset = 0, length = 2 sec, total of 181 segments; PUK Bern: TR = 1.96 sec, segmentation onset = −0.048, length = 2.048 sec, total of 249 segments). Then, each epoch was frequency transformed using a complex fast Fourier transformation (maximum resolution = 0.48828 Hz, zero-padding). The retained sine and cosine values for each electrode and frequency bin could be visualized in a two-dimensional sine–cosine diagram with one point for each electrode at a given frequency. The resulting shape of clouds of all electrodes is an indicator of the amount of zero-lag phase synchronization across electrodes. More specifically, if the cloud is nearly circular, no predominant phase angle is present in the EEG, as opposed to an elongated cloud adverting a common phase across electrodes.
The quantification of the shape is done by means of a two-dimensional principal component analysis (PCA): GFS is then defined as the ratio of (E1 − E2) to (E1 + E2) of the two eigenvalues (E1 and E2; see Formula 1), with values ranging from 0 (absence of a common-phase angle, minimal synchronization) to 1 (maximal-phase synchronization; Koenig et al., 2001). For further analyses, the GFS values were averaged across epochs and frequencies for delta (1–3.5 Hz), theta (4–7.5 Hz), alpha1 (8.5–10.5 Hz), alpha2 (10.5–12.5 Hz), and beta (13–30 Hz) bands per subject.
Formula 1: Computation of EEG GFS according to Koenig and colleagues (2001).
E(f)1 and E(f)2 are the eigenvalues 1 and 2 obtained from the PCA.
EEG-informed fMRI analysis
To explore the anatomical correlates of GFS at different frequency bands (delta, theta, alpha1, alpha2, and beta) between groups, centered GFS values were used as parametric modulators for first-level fMRI analyses in SPM (SPM8; Welcome Department of Imaging Neuroscience) using in-house MATLAB scripts (Mathworks) that removed the serial orthogonalization default setting in SPM (Wood et al., 2008). Serial orthogonalization was disabled because within subjects the different GFS frequency bands were not highly correlated with each other (overall mean Pearson r = 0.0532, min = 0.0211, max = 0.0828).
First-level analyses were run separately for SFVAMC and PUK Bern sites due to differences in the resting-state acquisitions. We included the six-motion parameters resulting from the realignment of the fMRI data (see fMRI preprocessing in Table 2) as covariates of no interest into the design matrix of the general linear model to attenuate the variance induced by motion of each subject (Johnstone et al., 2006; Lund et al., 2005).
To exclude bad intervals previously flagged in the EEG data, GFS values were set to 0 (SFVAMC: mean = 5.7, SD = 2.4 of 181 total trials; PUK Bern: mean = 60.5, SD = 38.8 of 249 total trials; for EO trials: mean = 25.5, SD = 15.5 of 123 total trials; for different approaches at each site, see Table 2) and values were centered at each frequency band to get the variance of the GFS predicting BOLD fluctuations.
For the second-level analysis, only EO GFS-modulated betas were considered for the comparison of groups across both sites. To evaluate possible differences, the measuring site (SFVAMC, PUK Bern) was included in the statistical model as a covariate for the within- and between-group analyses.
Our analysis strategy was to explore EEG-fMRI coupled clusters that showed between-group differences first and then within-group effects. Our initial voxelwise, cluster-finding threshold was set to p = 0.01 (two sided).
Results
EEG-informed second-level fMRI analysis: group differences
The EEG-informed fMRI analysis revealed brain clusters that were coupled significantly differently in the two groups for three of the five GFS frequencies, namely in the delta (1–3.5 Hz), alpha1 (8.5–10.5 Hz), and beta (13–30 Hz) bands.
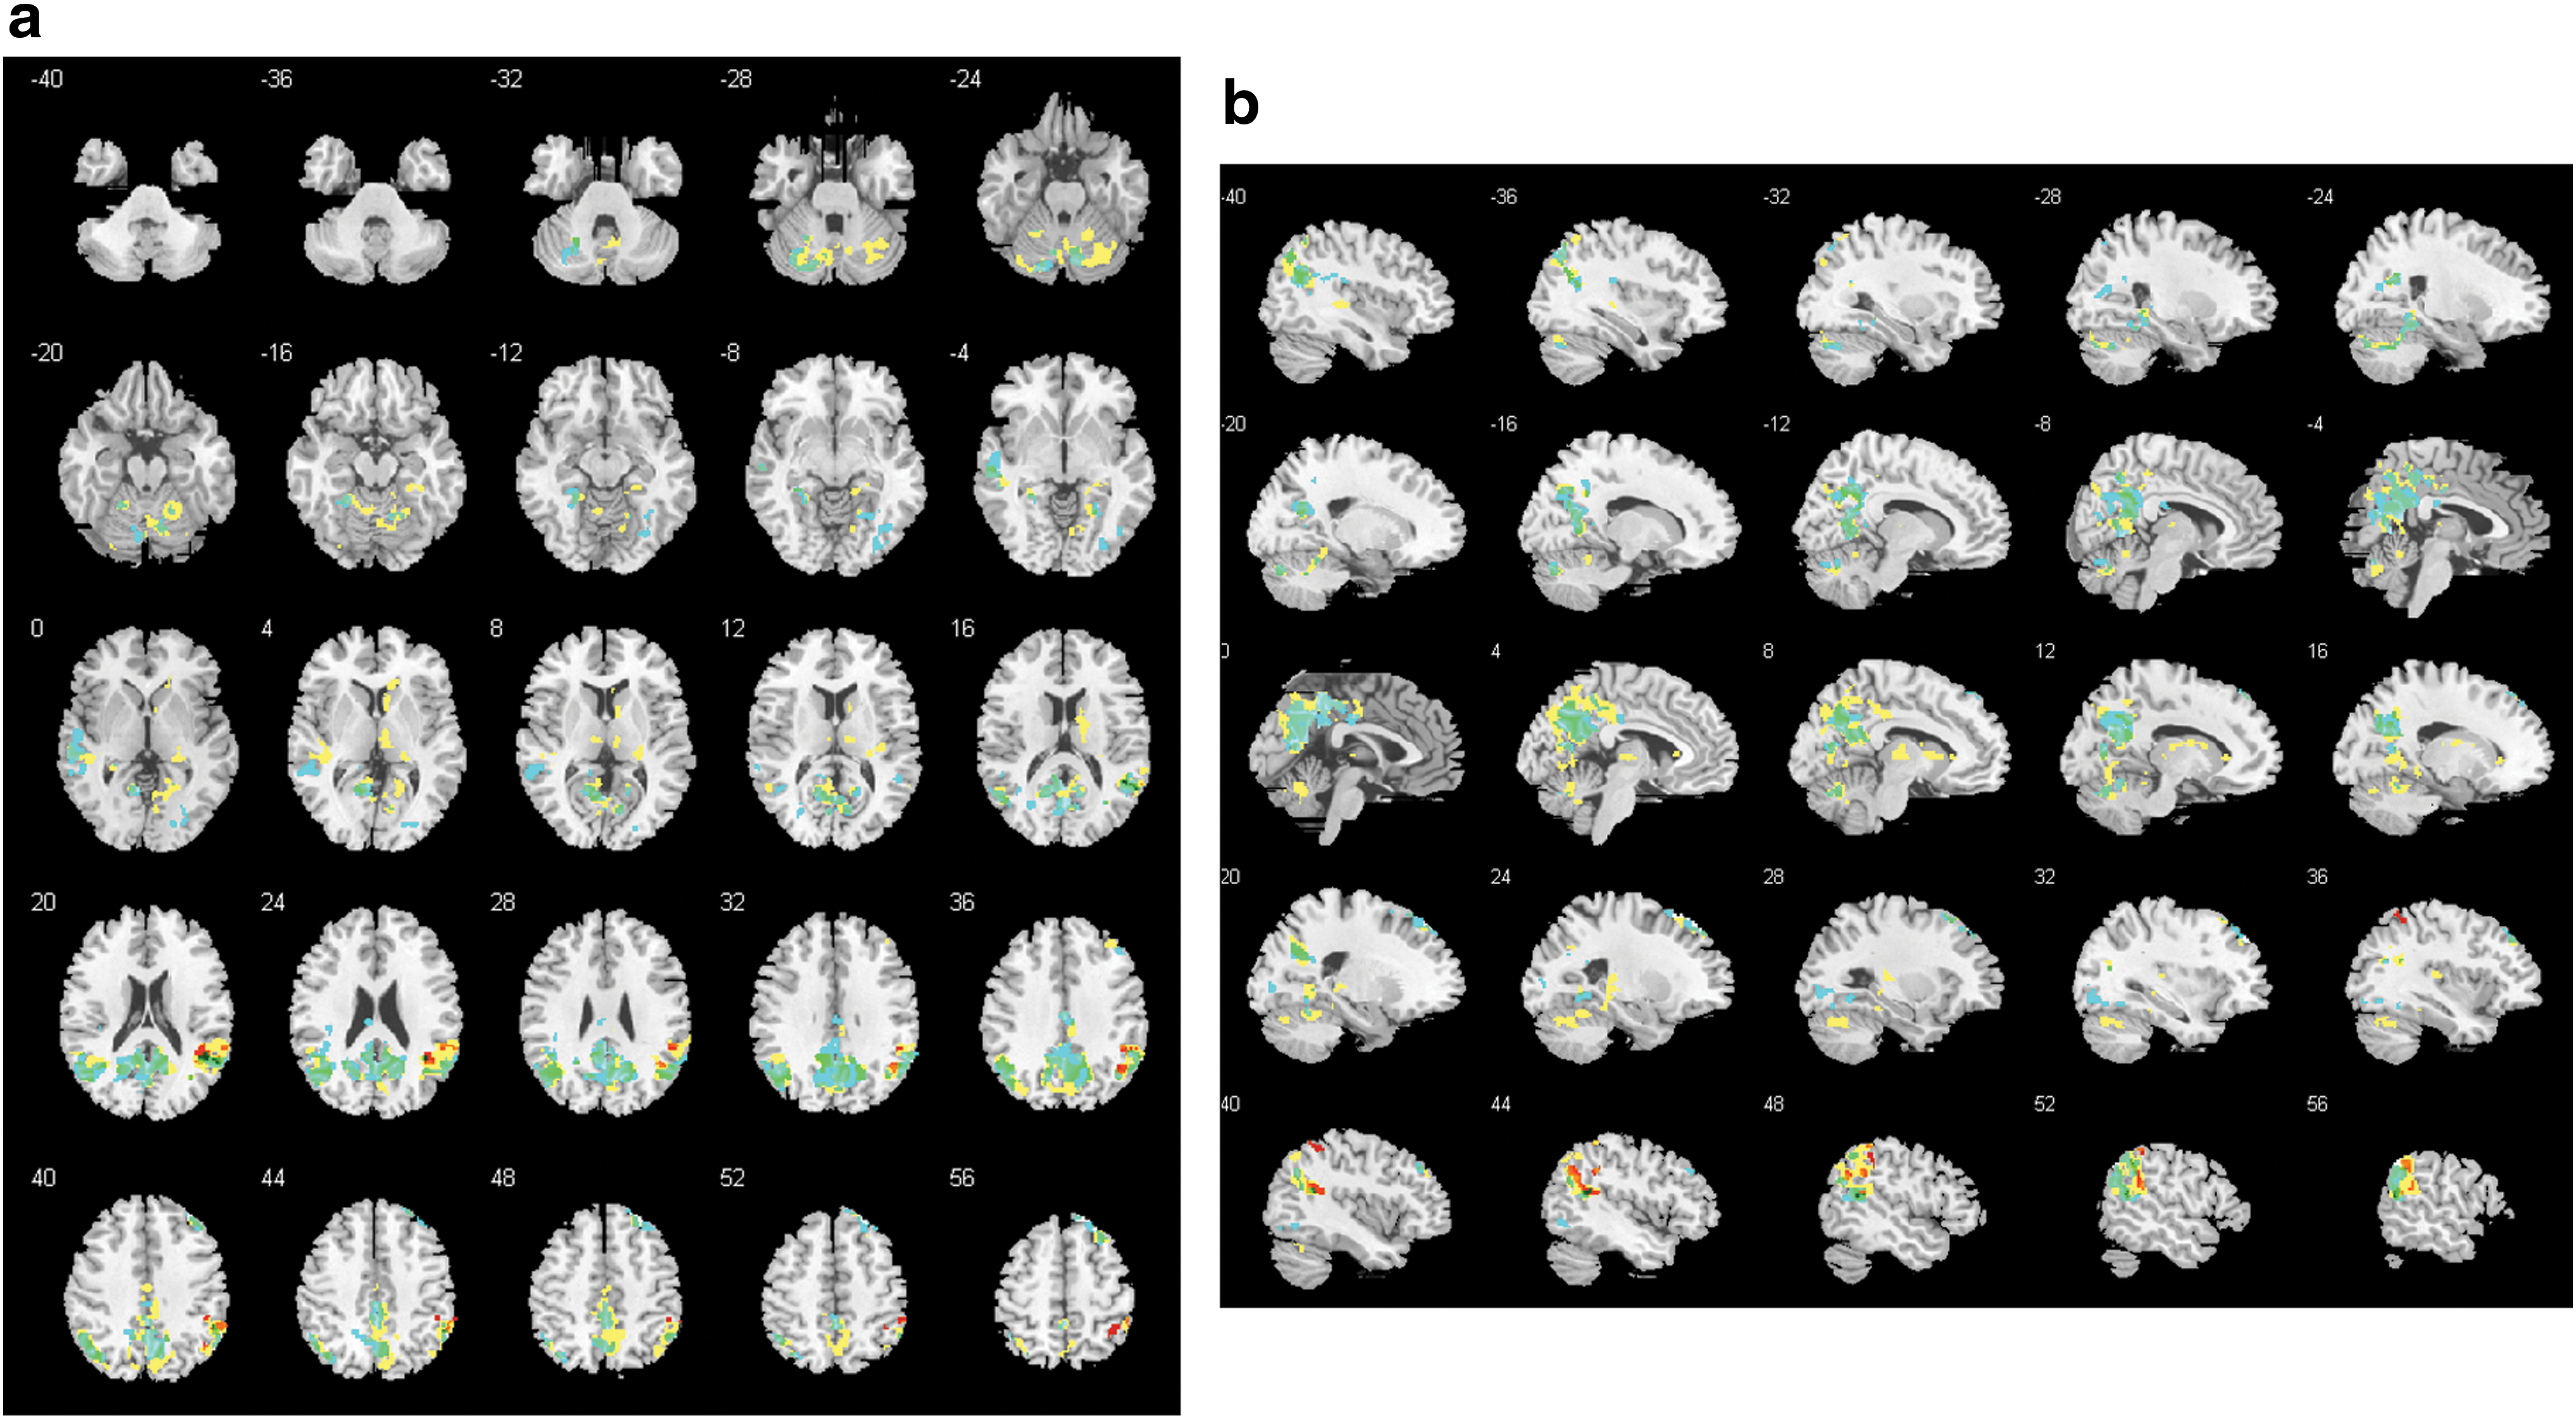
Delta band
In the delta band, there were seven clusters that differed between groups (cluster 1: 5506 voxels, family-wise error (FWE) p = <0.001; cluster 2: 1762 voxels, FWE p = <0.001; cluster 3: 1420 voxels, FWE p = <0.001; cluster 4: 308 voxels, FWE p = 0.004; cluster 5: 293 voxels, FWE p = 0.006; cluster 6: 232 voxels, FWE p = 0.022; cluster 7: 220 voxels, FWE p = 0.029; Fig. 1). Some clusters included regions of the DMN, such as the precuneus, the posterior cingulate gyrus, and the inferior parietal lobule. Other clusters included temporal, parietal, thalamic, cerebellar, and limbic regions (for details of regions, see Supplementary Table S1). Looking at the mean beta weights extracted from the between-group clusters for each group, all clusters had negative weights in patients and positive weights in controls (Fig. 2). Within-group analyses revealed two significant positive clusters in healthy controls and eight significant negative clusters in patients (Fig. 1).
GFS delta band:
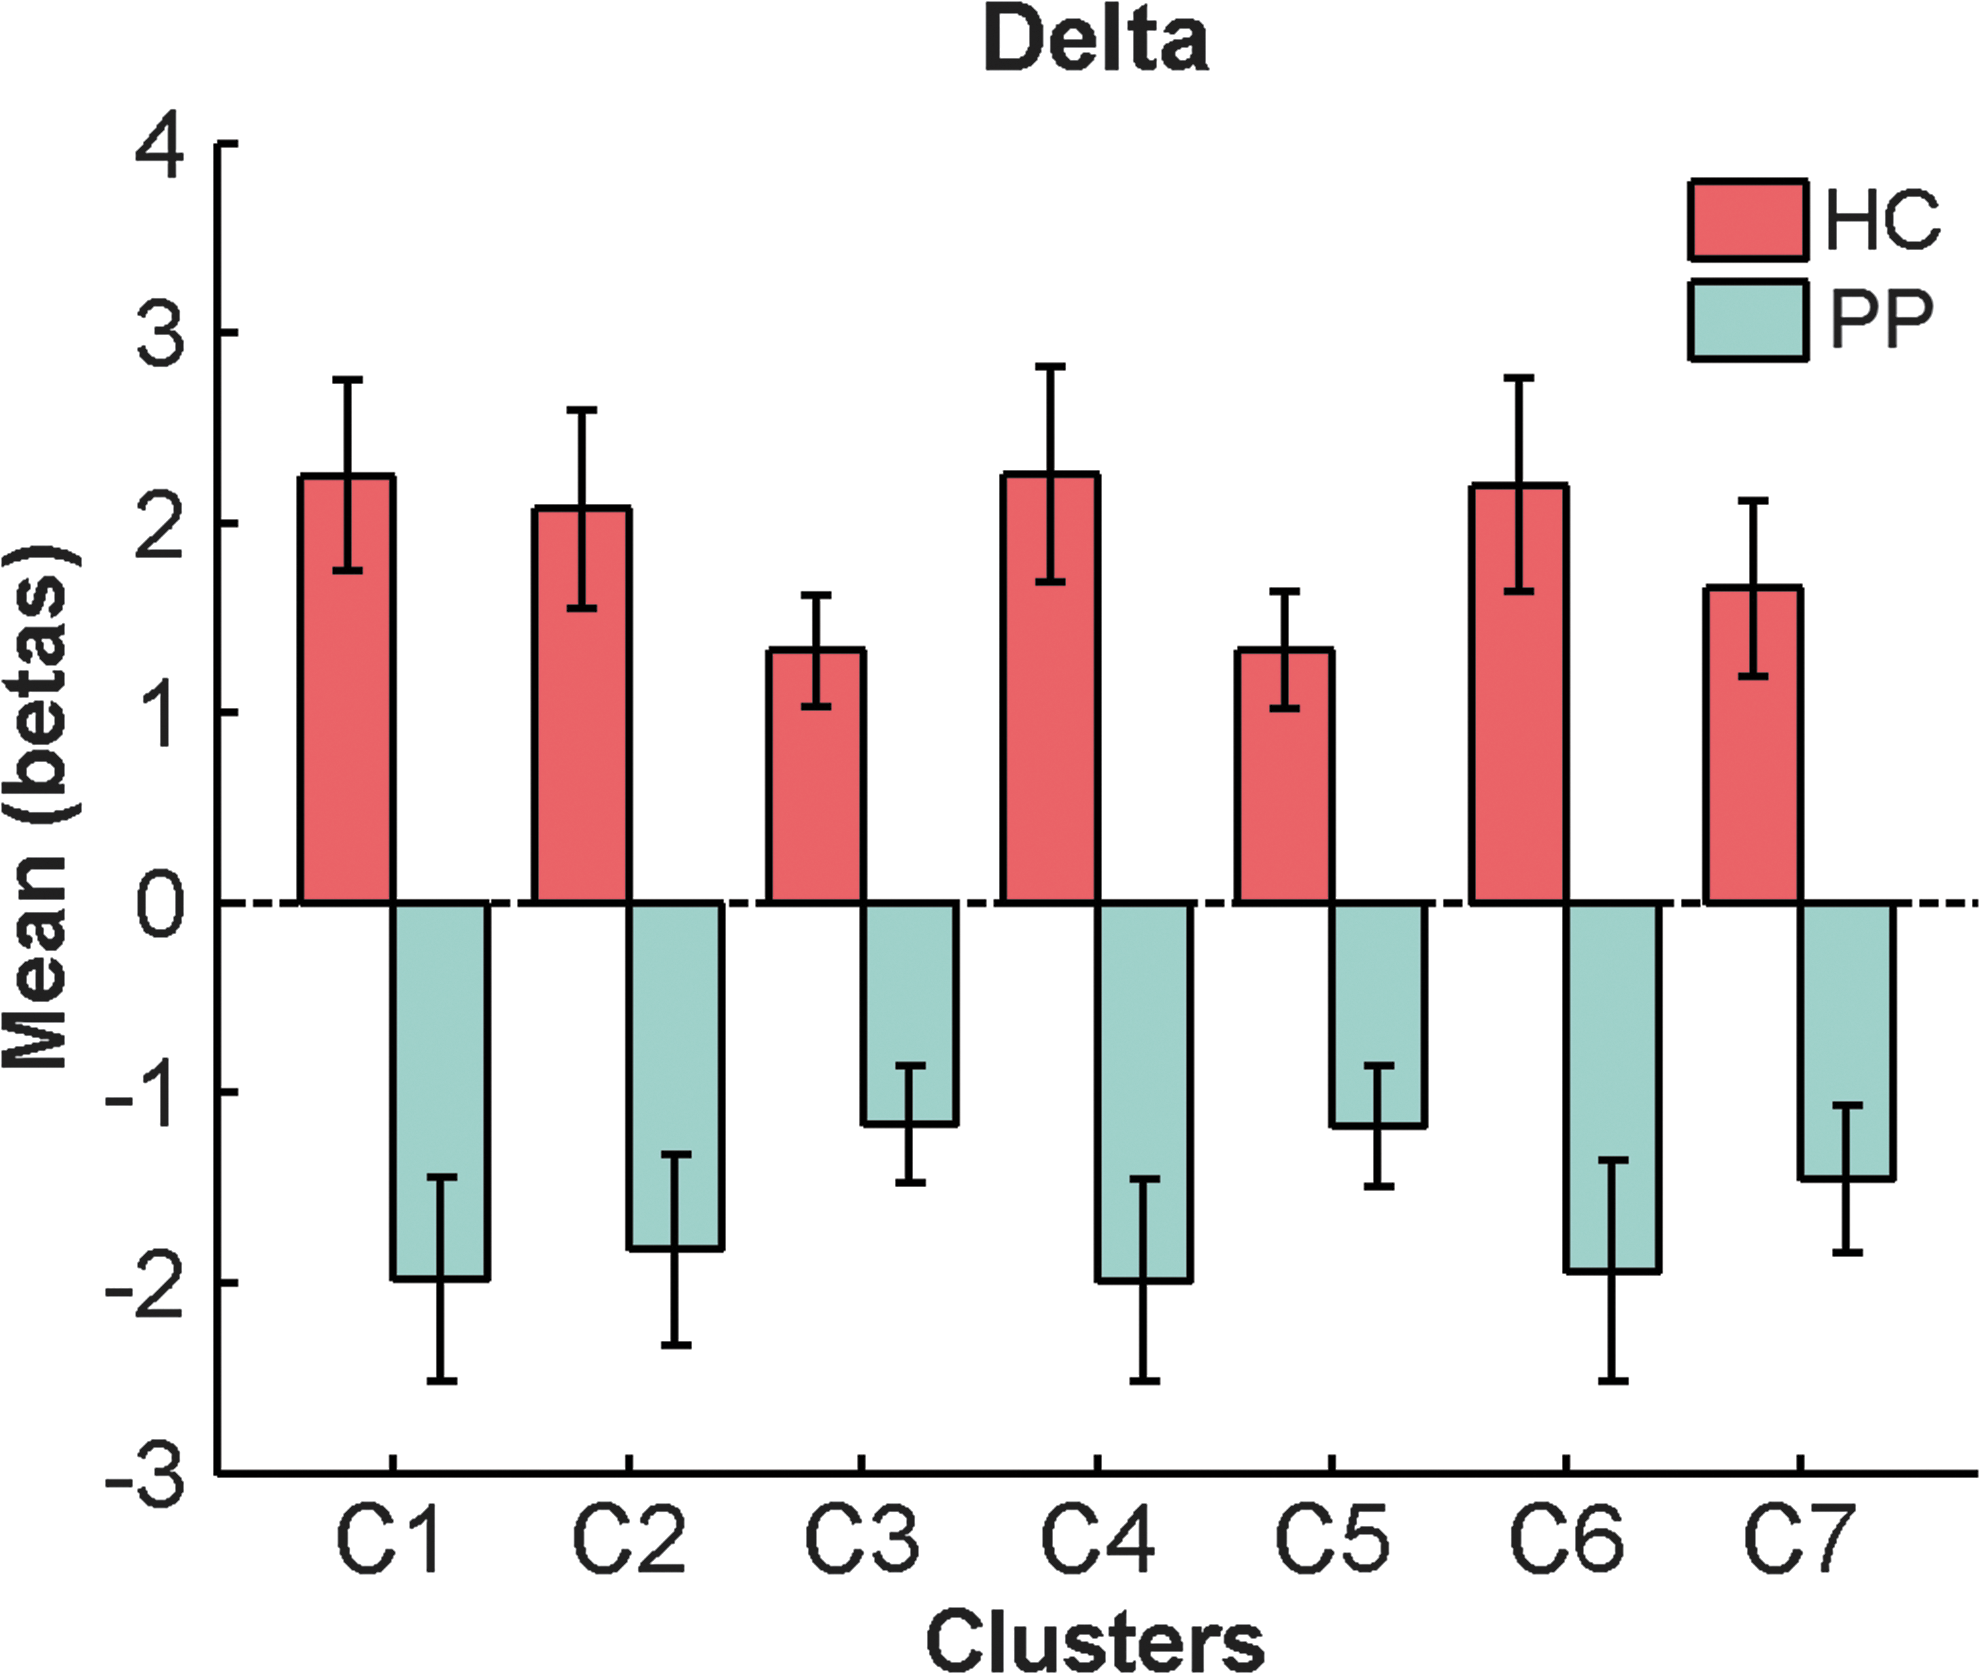
Mean beta weights and SE of significant delta band clusters for each group. SE, standard errors. Color images available online at
Alpha1 band
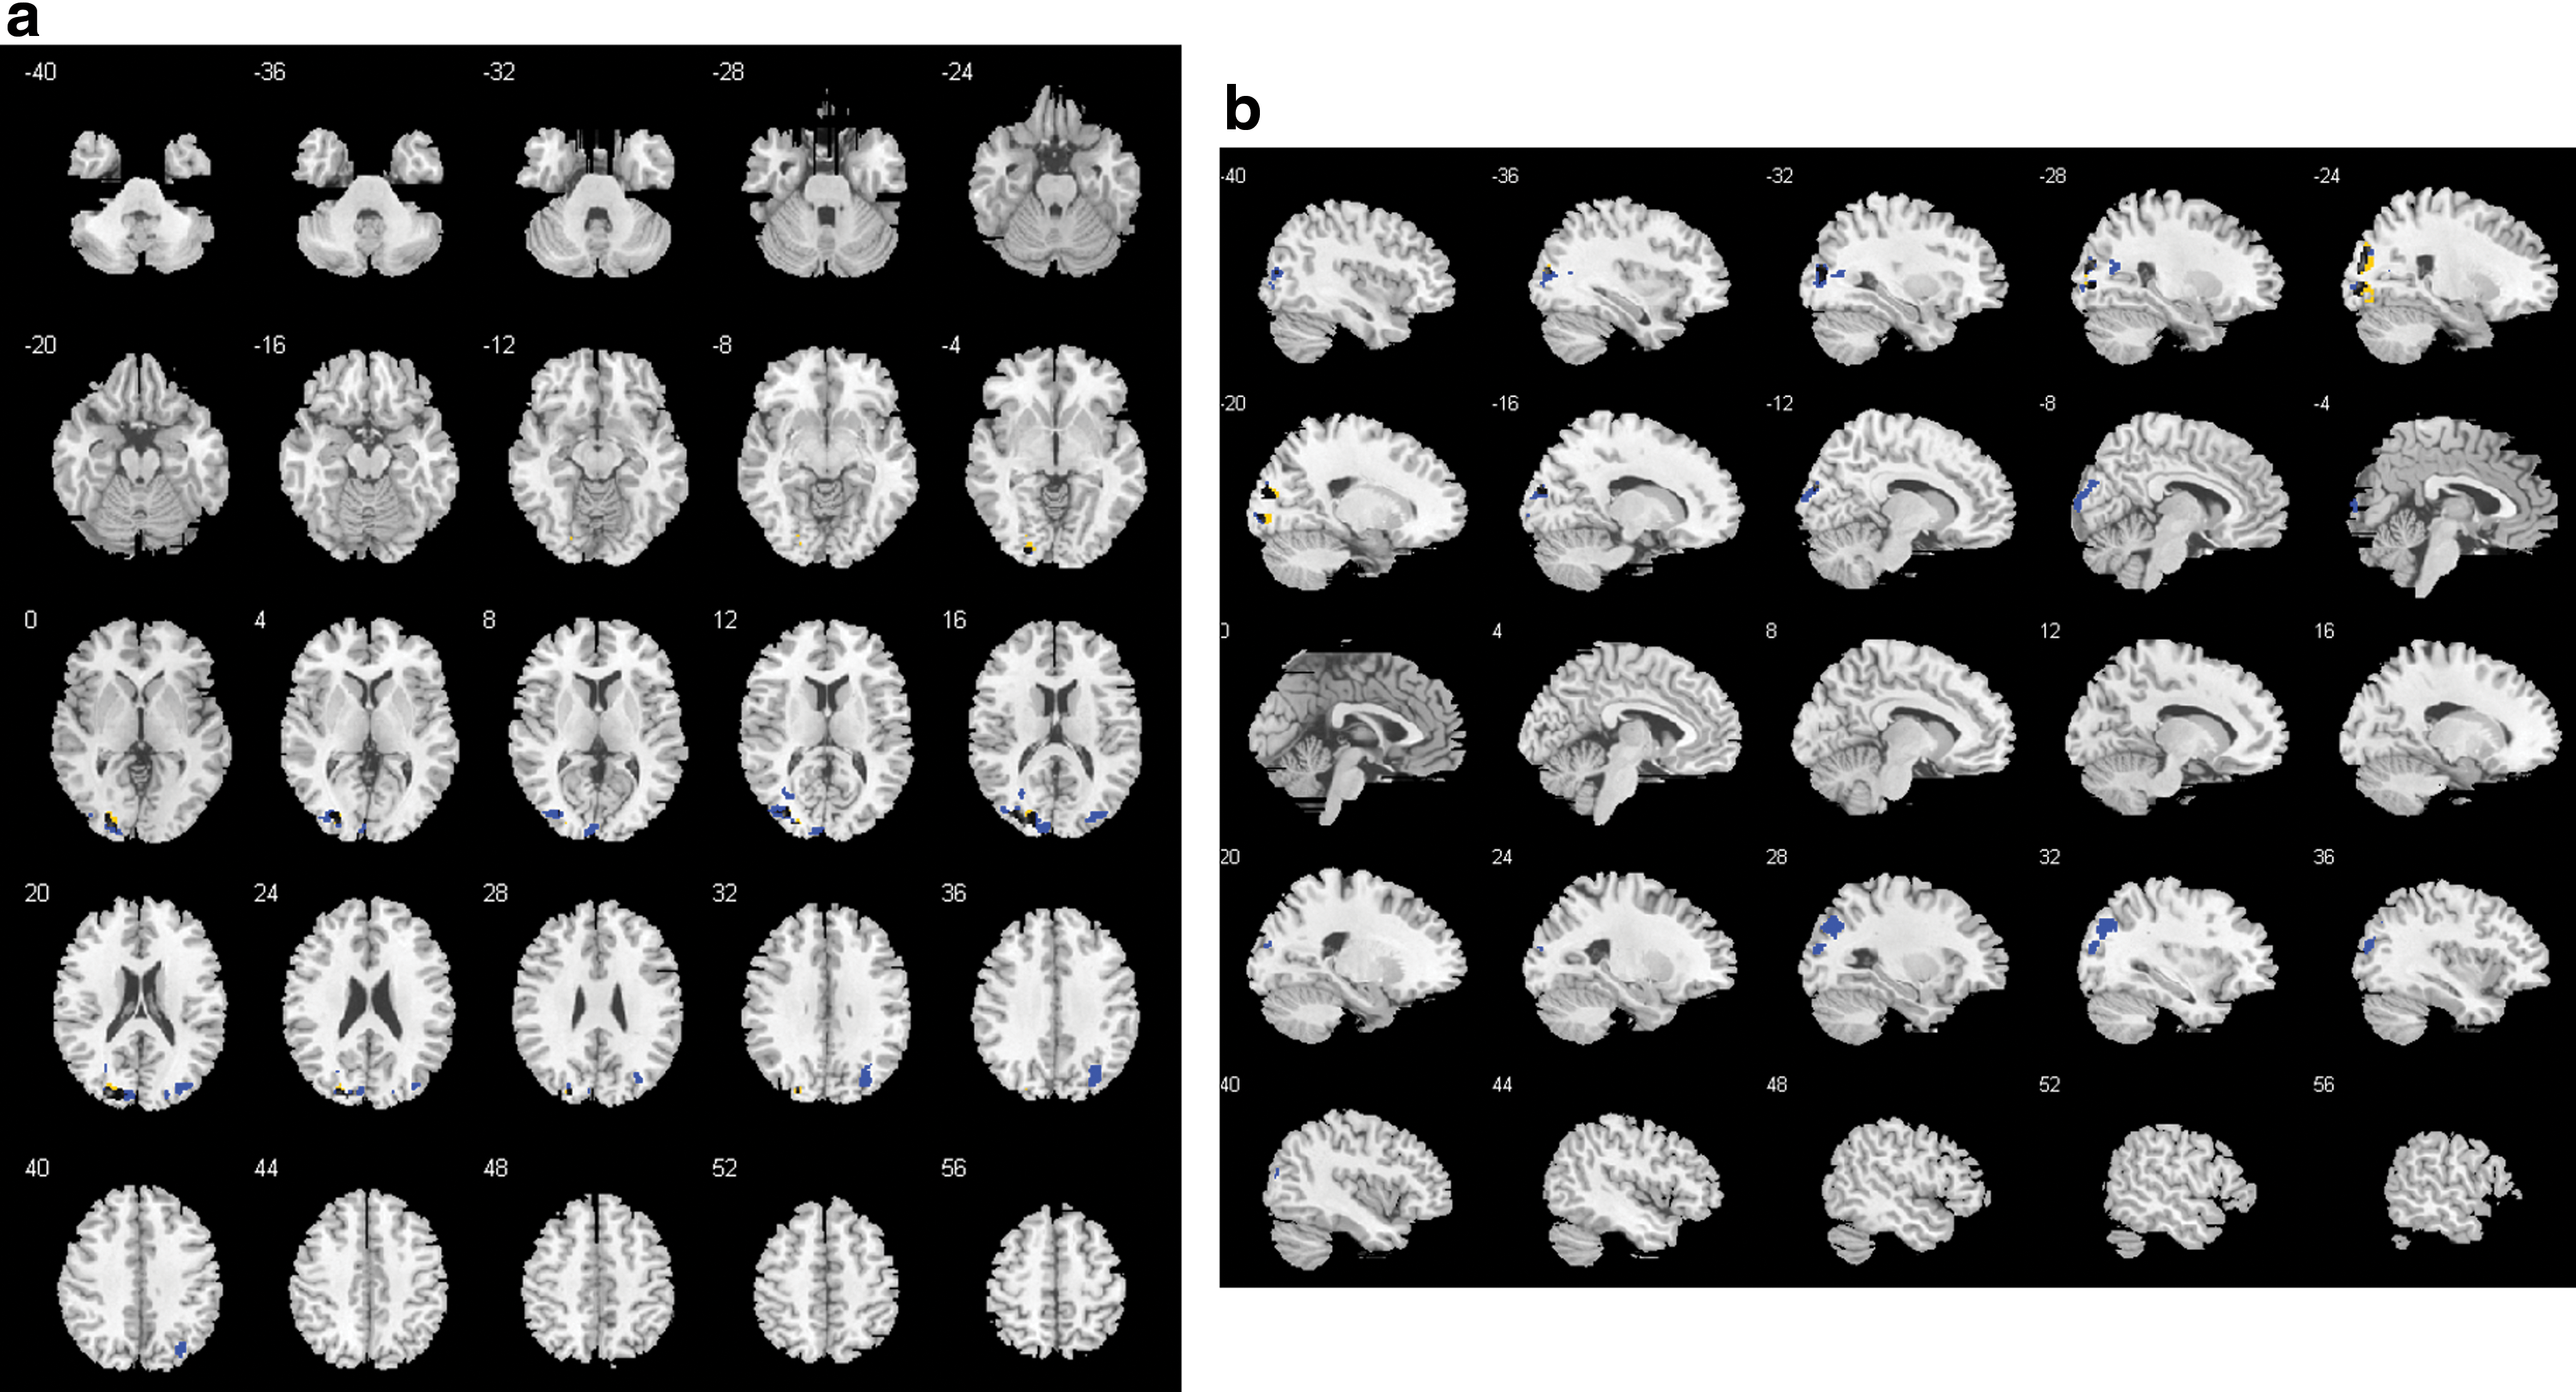
In the alpha1 band, there was 1 cluster containing 434 voxels (FWE p = 0.004) that differed between groups in left hemispheric occipital, temporal, and parietal areas such as the cuneus, precuneus, and Brodmann areas 7, 18, 19, 31 (Fig. 3; for details of involved regions, see Supplementary Table S1). Within the controls, there were two significant negative clusters overlapping with the cluster of the between-group contrast (Fig. 3). The mean beta weights revealed that controls showed negative and patients showed positive associations explaining the group difference (Fig. 4).
GFS alpha1 band:
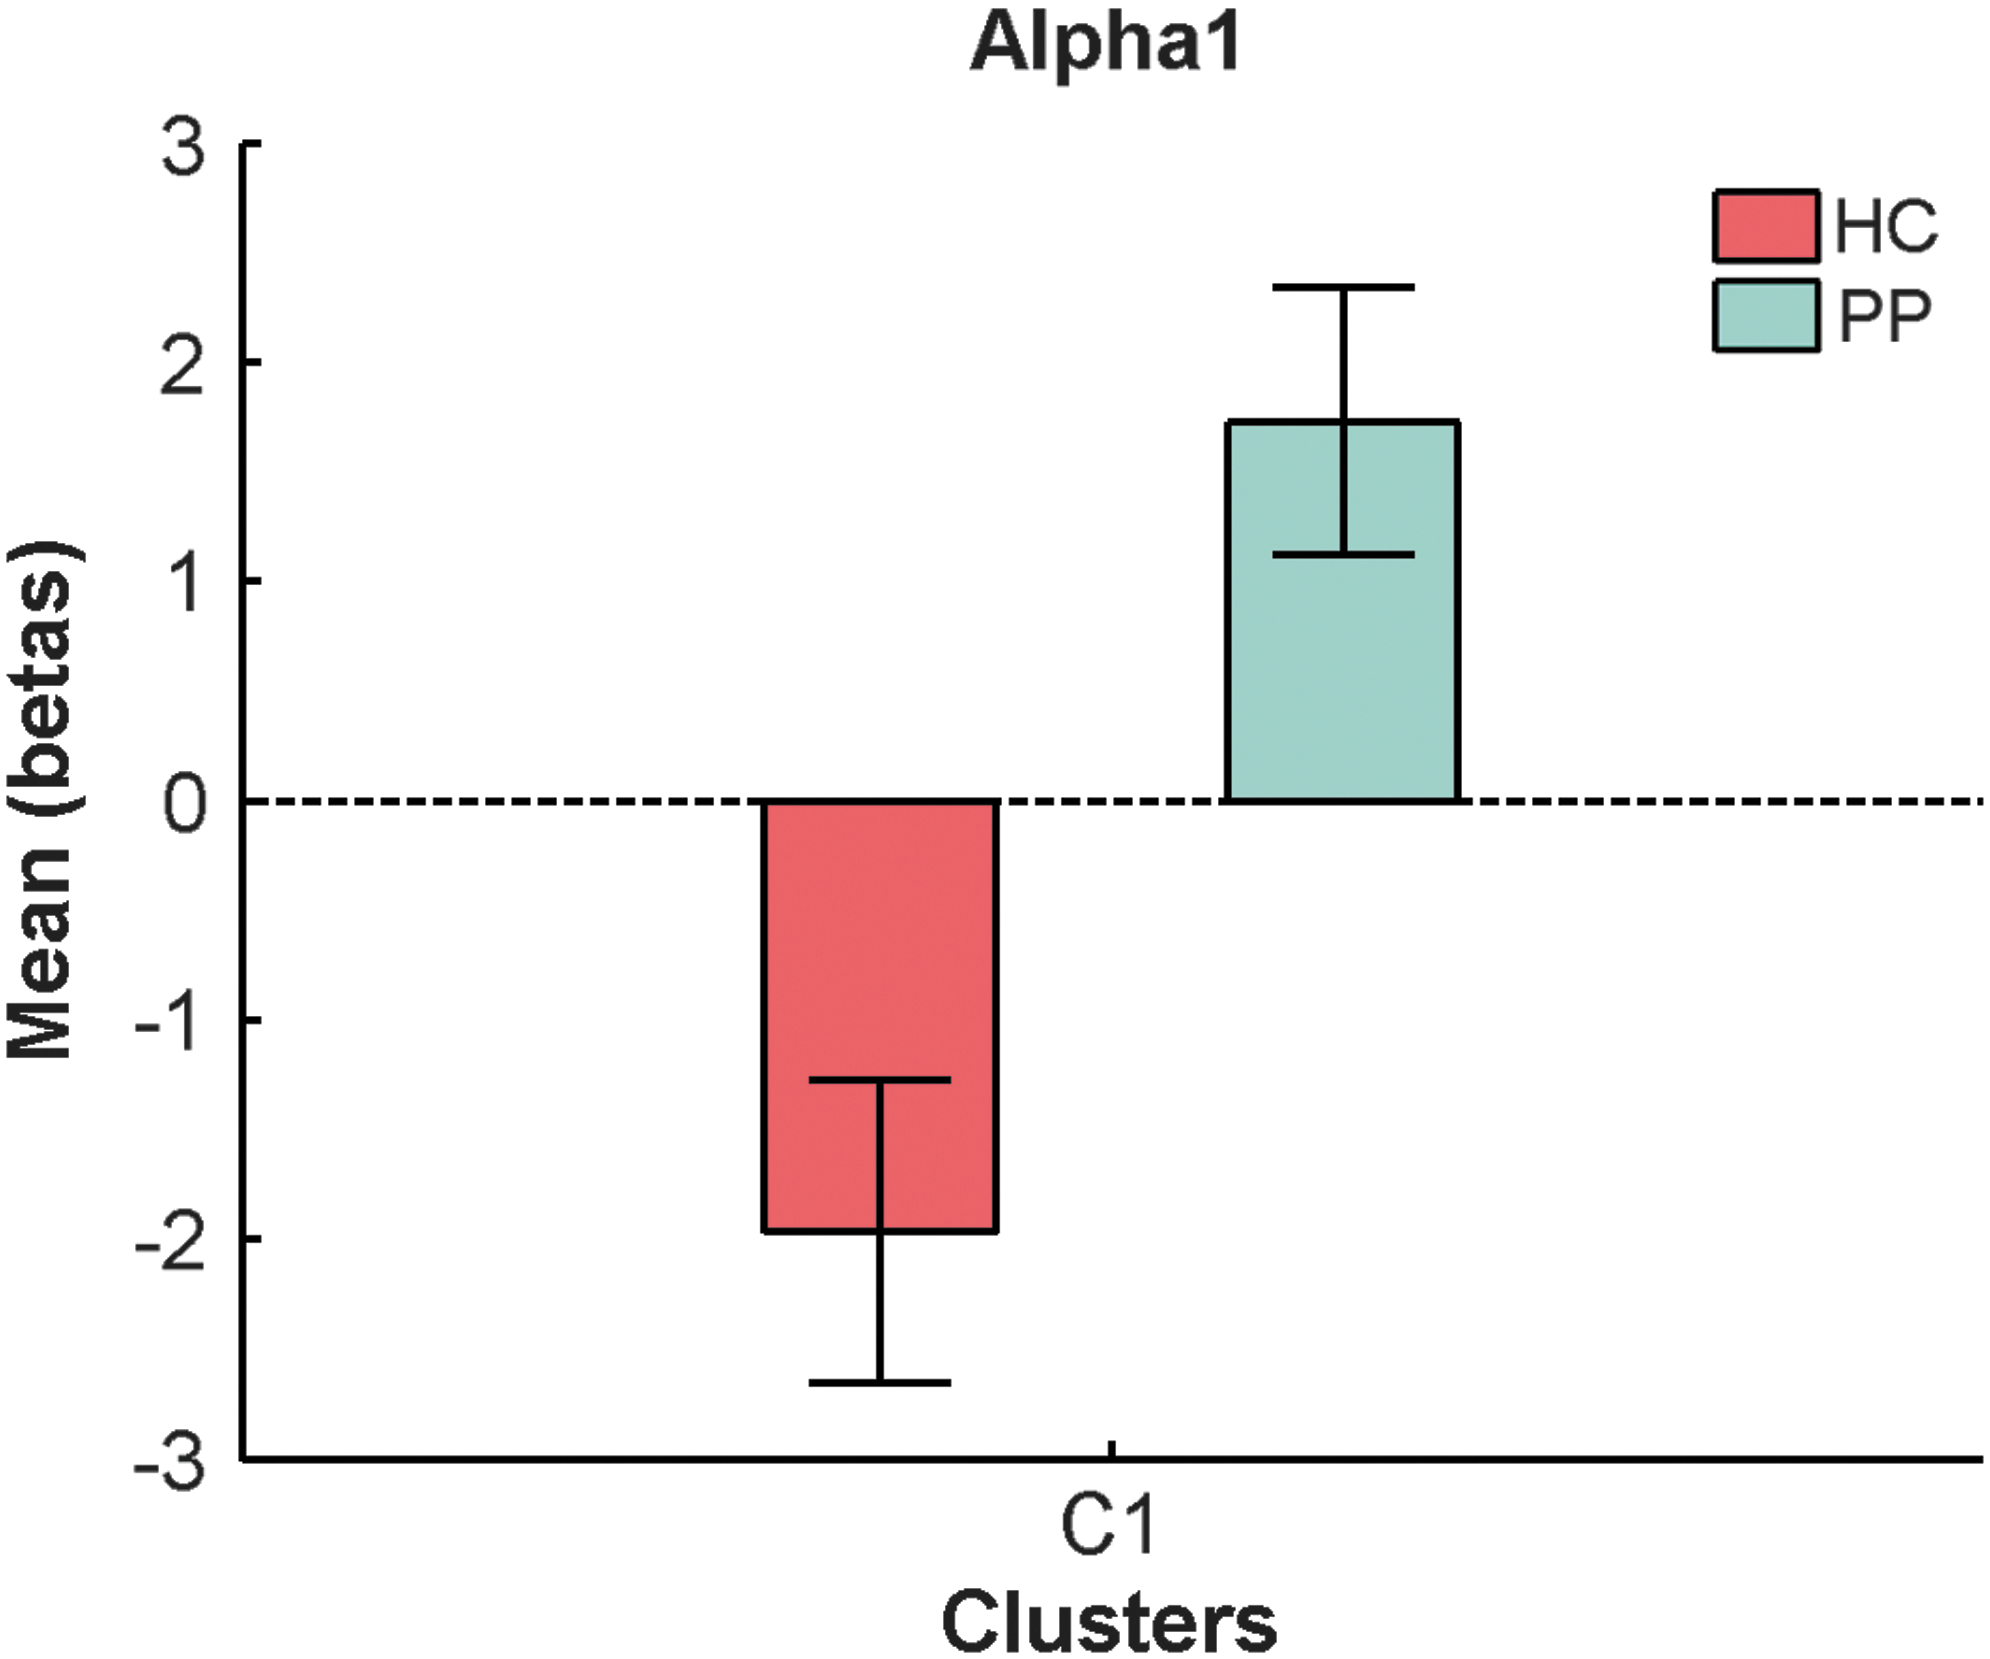
Mean beta weights and SE of significant alpha1 band cluster for each group. Color images available online at
Beta band
In the beta band, there was one 252-voxel cluster (FWE p = 0.0026), located mainly in the right hemispheric precuneus and cuneus that differed between groups (Fig. 5; for details of regions, see Supplementary Table S1). The mean beta weights of that cluster revealed that this difference was explained by patients showing positive GFS beta—BOLD associations, while healthy controls had a negative coupling in that cluster (Fig. 6).
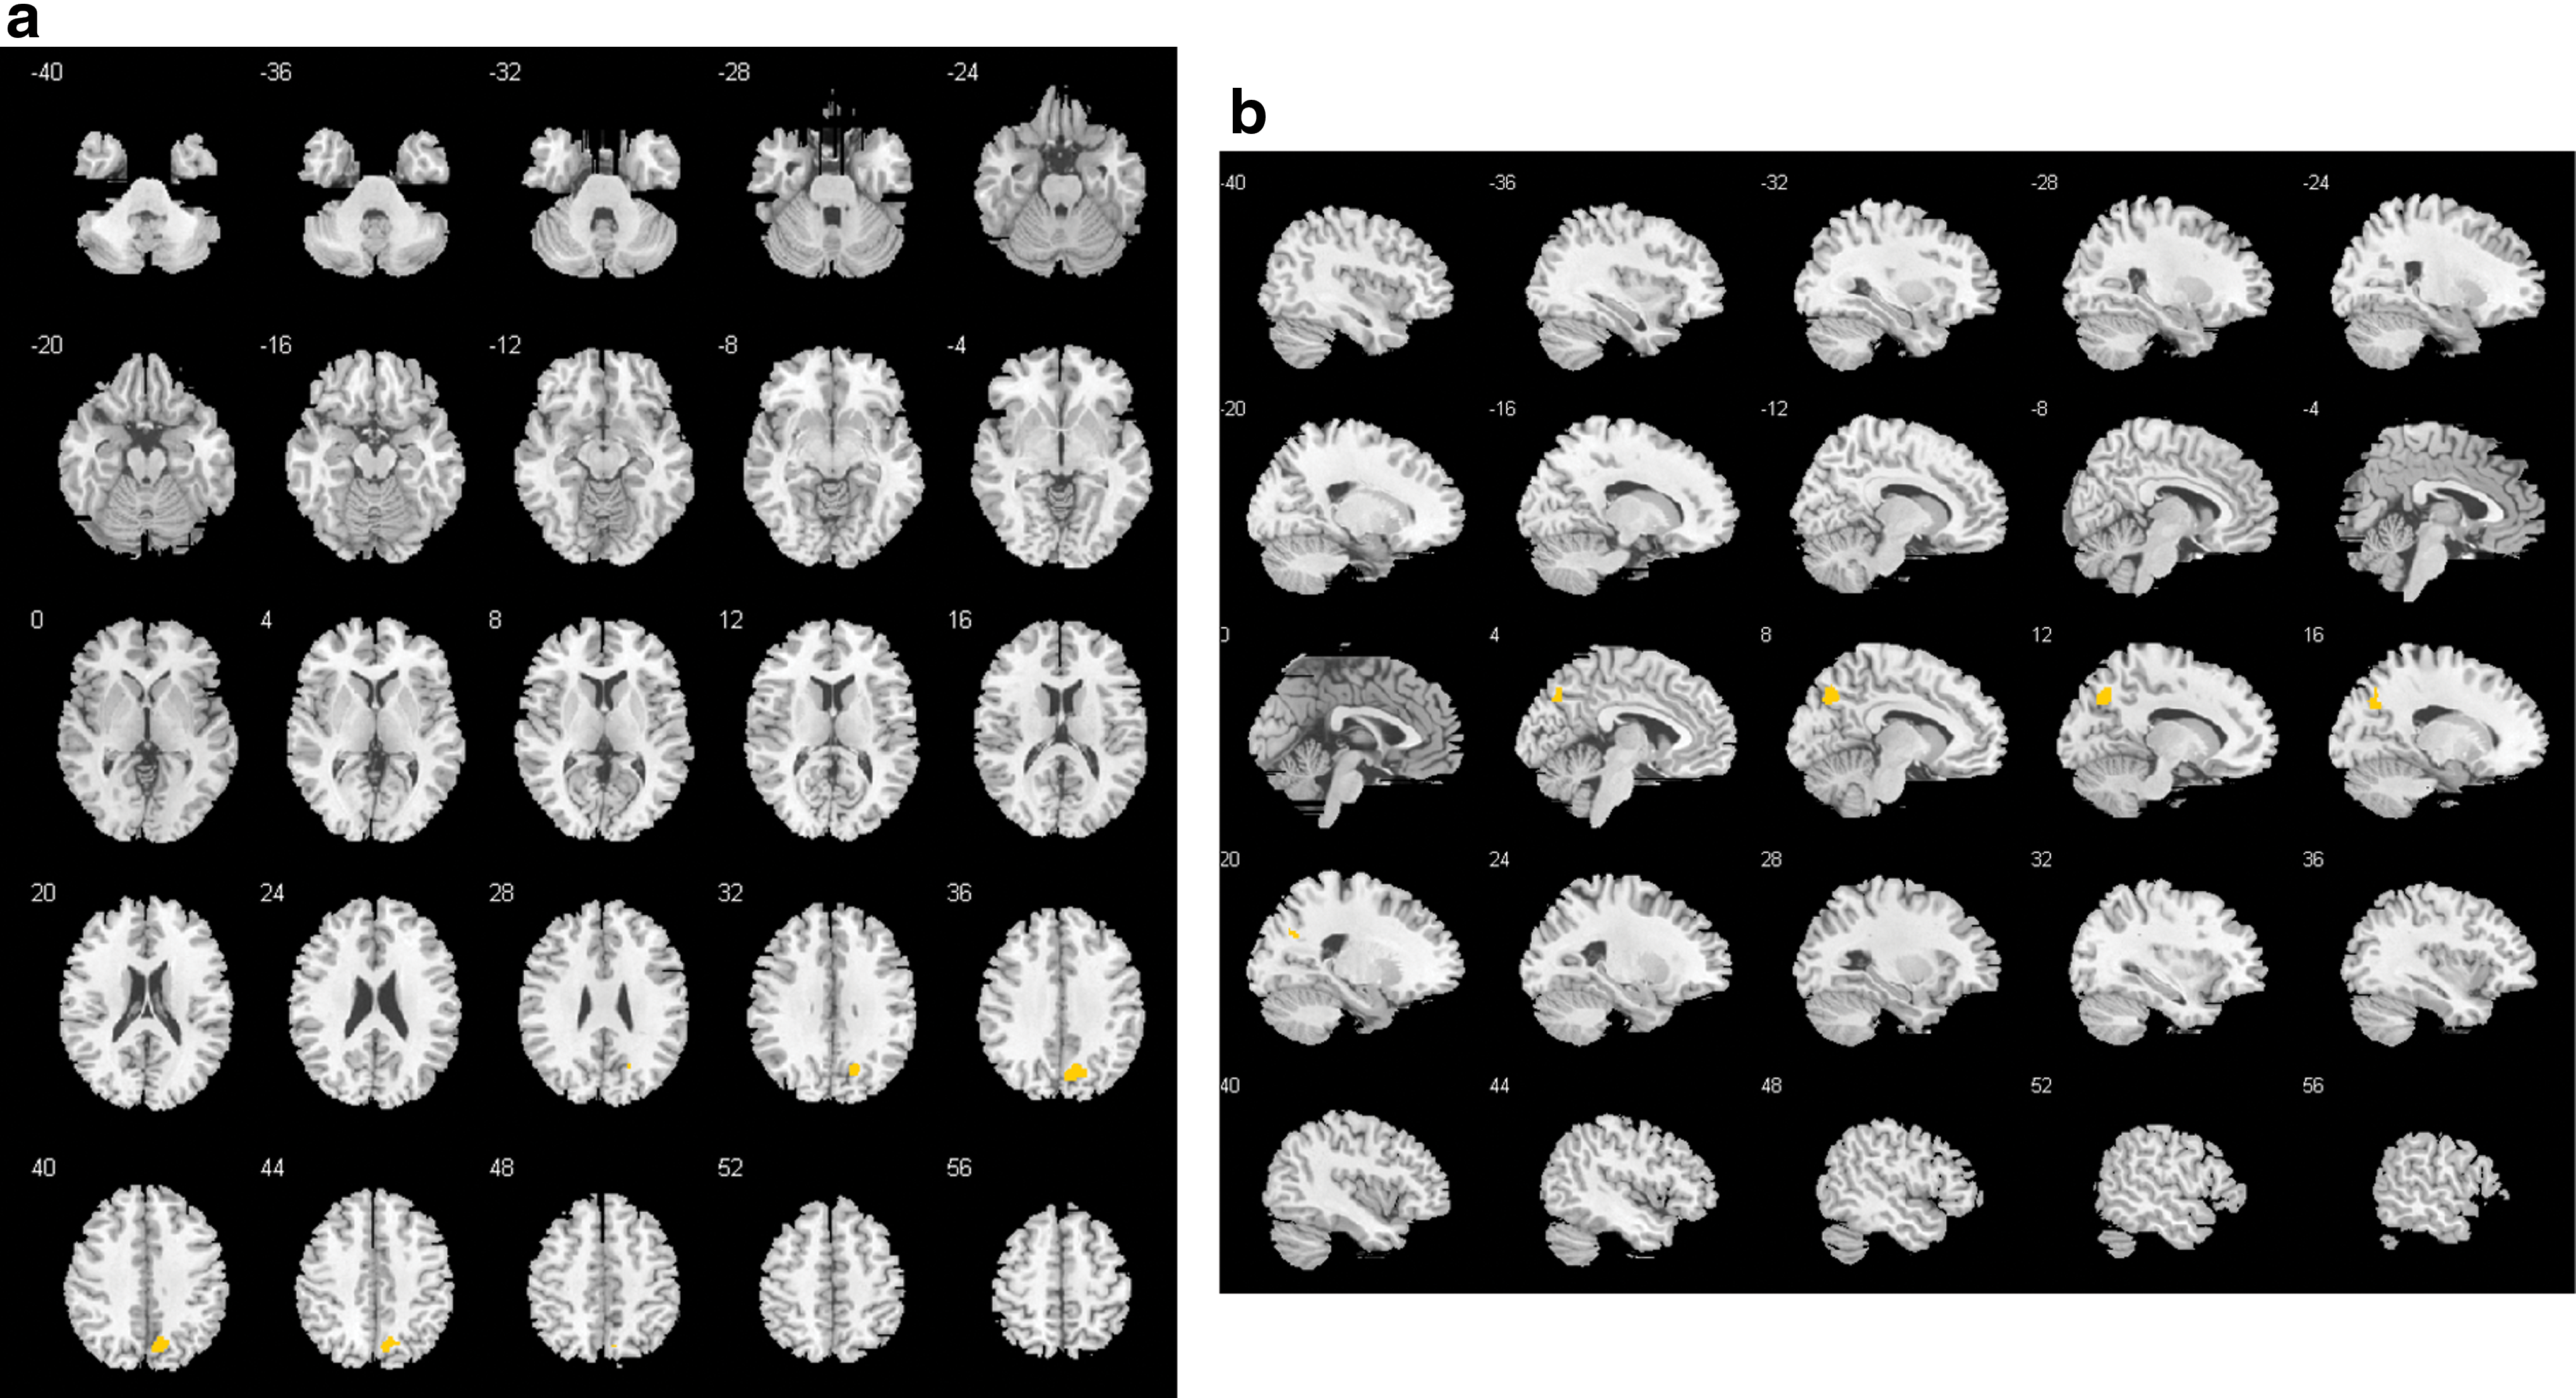
GFS beta band:
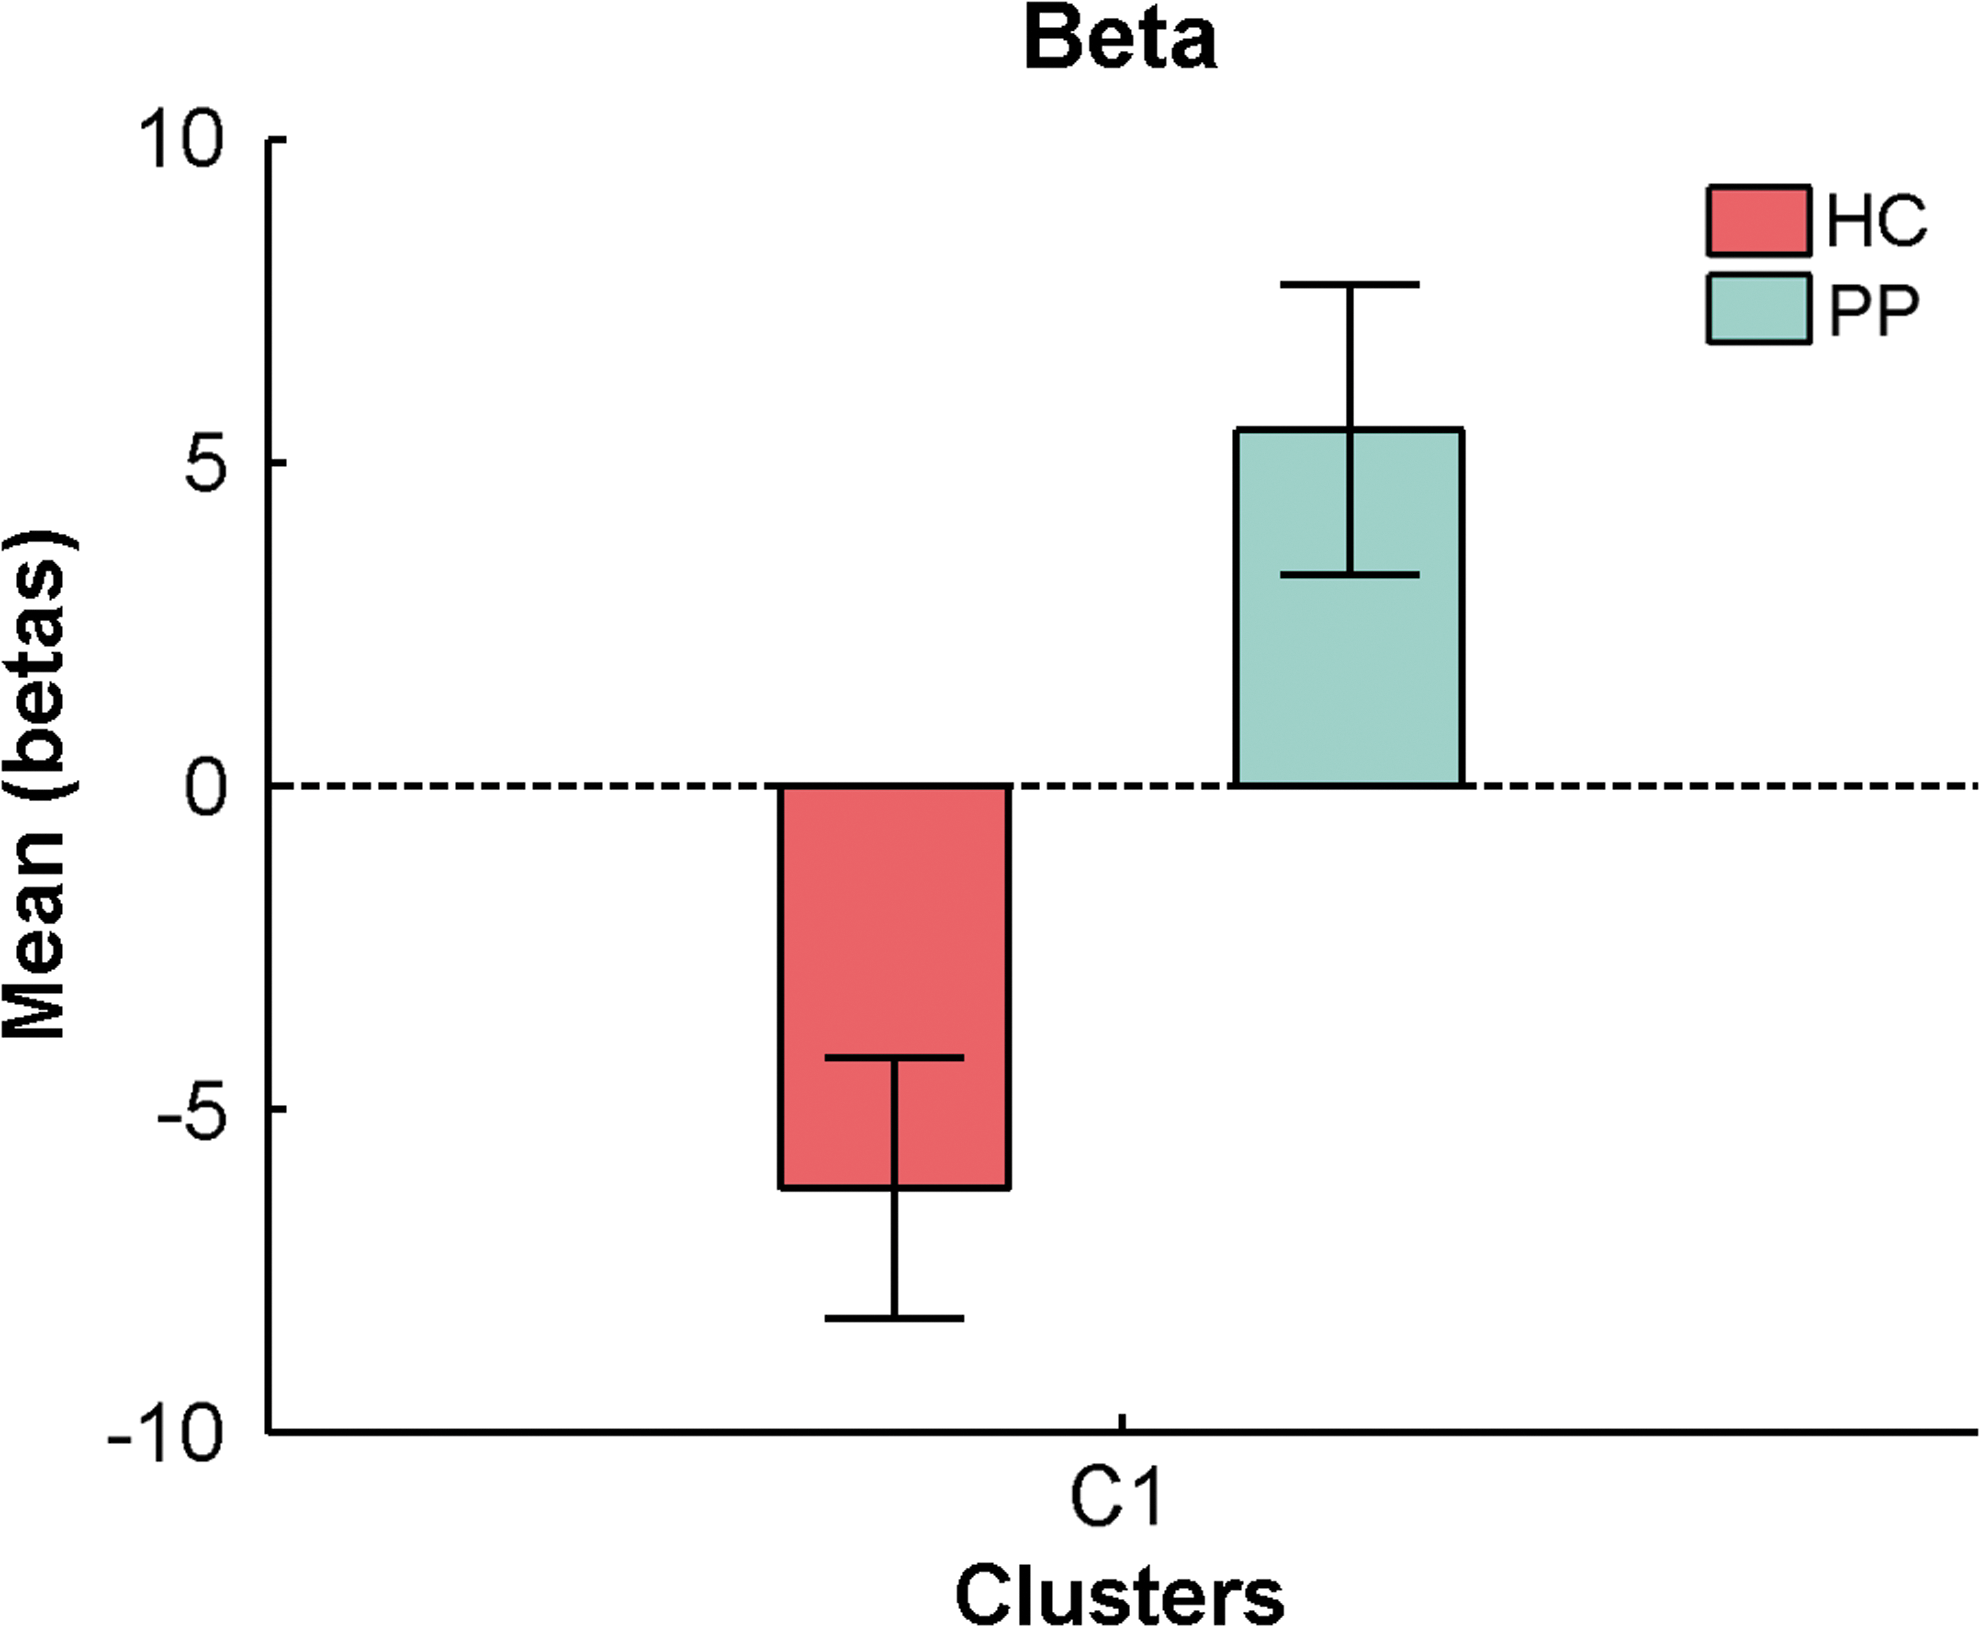
Mean beta weights and SE of significant beta band cluster for each group. Color images available online at
Follow-up analysis: influence of power across all channels in significant GFS group clusters
To elucidate how the measure of GFS was related to amplitudes of the corresponding frequency bands, in follow-up analyses, we ran similar first- and second-level analyses, but used mean power across all channels, instead of synchrony (GFS), as parametric modulators. First, the mean power in the three frequency bands, which showed significant group effects in the GFS analysis (delta, alpha1, and beta), was calculated. Mean power and GFS measures within each frequency band were not correlated with each other (overall mean Pearson r = 0.2463, min = 0.0666, max = 0.4814), so we were able to include both as parametric modulators in the same first-level model. In the end, we conducted three separate models, one for each frequency band.
There were no overlapping voxels (initial threshold p = 0.01, two sided; cluster size: 5) for GFS and global power for any of the frequency bands (delta, alpha1, and beta), indicating that these measures indeed capture different aspects of brain function. In addition, there were no significant clusters for global power surviving at the same initial height threshold as used in the main GFS analyses, so these data are not discussed further.
Differences in GFS frequencies between sites
We performed an ANOVA (5 × 2 factorial design with factors GFS frequency and site) and an additional independent samples t-test for all GFS frequencies (delta, theta, alpha1, alpha2, beta) to check for significant differences between sites (SFVAMC vs. PUK Bern). There was a significant main effect of site (p ≤ 0.001) resulting from the ANOVA and the t-test revealed additionally that each frequency band was significantly different between sites (all p-values ≤0.001): GFS values were always higher at the SFVAMC compared to the PUK Bern. The Levene's test for equality of variance resulting from the t-test indicated that there was no significant difference in the variance between sites in any of the GFS frequency bands (all p-values ≥0.070).
However, the results of the first-level analyses are mathematically independent of these differences between sites. In addition, this factor was included as covariate into the model for the second-level analysis. The finding may be due to different protocols at the two sites: subjects at the PUK Bern alternated between 2-min periods of EC and EO, while subjects at SFVAMC had one 6-min period of EO.
Relationship between symptoms and brain clusters
We ran ANCOVAs, with site as a covariate, to explore systematic relationships of symptom severity as measured by total scores of positive, negative, and general symptoms from the PANSS in PP on the mean EO GFS-modulator beta weights of the significant between-group brain clusters from the delta, alpha1, and beta bands. None of these tests reached significance (all p > 0.05, uncorrected).
Relationship between movement parameters and brain clusters
Because patients showed significantly larger mean head displacements than healthy controls (Table 1), we tested the relationship between the mean EO GFS-modulator beta weights of the significant brain clusters, including the mean motion parameters as covariate of no interest. The group differences for each brain cluster were still highly significant when controlling for mean head displacements (all p-values <0.001), thus our between-group results cannot be explained by group differences in head movement.
Discussion
The goals of this study were threefold. To provide further evidence of a relationship between fluctuations in global common-phase neural oscillations and fluctuations in the BOLD response during rest, to determine the relationship between neural activity in specific frequency bands and BOLD activity in specific brain regions, and to ask how this relationship is affected by psychosis. Our EEG-informed fMRI analysis using the GFS values pooled into five frequency bands (delta, theta, alpha1, alpha2, and beta) revealed significant brain clusters that differed between groups in the delta, alpha1, and beta band.
Delta band
The results in the delta band were the most extensive. They revealed seven clusters, including regions of the well-known DMN: the precuneus, the posterior cingulate gyrus, and the inferior parietal lobule. The results were driven by a negative relationship between GFS delta and regions of the DMN in the patients. The healthy controls had positive associations, but only with the right inferior parietal sulcus of the DMN. That is, when neuronal oscillations in the delta band were synchronized across the scalp, the DMN was less active in patients and more active in the healthy controls. Slow EEG oscillations have been linked to inhibitory processes of the brain (Contreras and Steriade, 1995) and reduced states of alertness, such as drowsiness, sleep, or sedation (Hlinka et al., 2010).
Our results suggest that in PP, coordinated neuronal oscillations in the slow delta frequency are coupled with inhibited activity in the DMN. Synchronized delta activity might underlie known alterations of DMN connectivity as well as psychopathology in this patient population. Interestingly, the most preponderant abnormalities in quantitative EEG in PP are also found in slow rhythms (Boutros et al., 2008; Galderisi et al., 2009; Siekmeier and Stufflebeam, 2010). Our findings may point to a missing link between the extensive literature on fMRI-related DMN abnormalities and the equally well-replicated findings of increased slow EEG activity. Nevertheless, because both increased and decreased connectivities of the DMN are reported, the precise nature of the relationship between connectivity within the DMN and common-phase delta synchronization should be further investigated across rest and a variety of tasks.
Alpha1 band
There was one cluster, including the extrastriate visual cortex, showing a negative coupling between alpha1 in healthy controls, whereas no such modulation was seen in patients, resulting in the between-group effect. That is, in healthy controls but not patients, greater synchrony in the alpha1 band was related to less activity in the visual cortex. Others have reported a negative relationship between alpha power and occipital brain activity, which has been discussed in terms of “idling” of the brain (de Munck et al., 2007; Goldman et al., 2002; Goncalves et al., 2006; Jann et al., 2009, 2010b; Laufs et al., 2003a,b; Moosmann et al., 2003; Tyvaert et al., 2008). Using the same measure of synchronization and definition of lower and upper alpha band that we used, Jann and colleagues (2009) reported a positive relationship between GFS in lower alpha (8.5–10.5 Hz) and the BOLD signal in brain areas corresponding to the dorsal attention network (dAN), whereas GFS in upper alpha (10.5–12.5 Hz) was positively correlated to the DMN (Jann et al., 2009) in healthy subjects.
While the procedures of integrating the alpha band GFS with the fMRI BOLD data were similar, in our healthy controls, we did not see a relationship between GFS alpha1 and the dAN reported by Jann and colleagues (2009). This might be explained by some important differences between the studies. First, in our study, subjects had their EO, whereas in Jann and colleagues (2009) eyes were closed. Second, the subjects in the study by Jann and colleagues (2009) were about 10 years younger than the healthy controls in our study.
Beta band
The between-group effect found in the right precuneus due to patients displaying a positive coupling between GFS in the beta band and activity in the precuneus, with healthy controls showing negative association. The precuneus, a “hub” region of the DMN, is engaged in visuospatial imagery, episodic memory, reflective, self-related processing, awareness, and conscious information processing (Cavanna and Trimble, 2006; Zhang and Li, 2012). As oscillations in the beta frequency range have been associated with polymodal sensory processing, sensory-motor coordination, the maintenance of limb positions, and working memory (Uhlhaas et al., 2008), the positive association between beta GFS and DMN activity in patients may reflect an imbalance between perception/cognition and mind wandering. Findings of decreased induced and evoked beta phase synchronization in circumscribed brain regions were positively correlated with positive symptoms (Uhlhaas, 2011; Uhlhaas and Singer, 2010), whereas deficits in the perception of Mooney faces in patients coincided with a reduction in global beta phase synchronization, suggesting impairment of large-scale synchronization (Uhlhaas and Singer, 2006).
Conclusion
The associations between BOLD and global common-phase synchronization in low-frequency delta, and also the higher frequencies in alpha1 and beta band, were altered in a variety of brain areas in PP, specifically in extrastriate visual areas for the alpha1 and DMN regions for the delta and beta frequency oscillations. The finding that patients and controls showed opposite patterns in their associations between GFS delta and beta band and the DMN, possibly reflects alterations in functional coupling between different nodes of the DMN. Not only regarding EEG but also fMRI BOLD data, it was shown that different frequency ranges are related to specific brain regions (Gohel and Biswal, 2015), and also that global changes of the BOLD signal should be captured too, as displayed by changes in PP (Hahamy et al., 2014).
The reported results in this study reveal novel aspects of the deficient functional integration in PP suggested by Friston (2002). We argue that by using concurrent EEG and fMRI, links between psychopathology and physiological measures of network integration on different time scales can be established. This may provide a more extensive understanding of psychosis and other serious mental illnesses.
Limitations
The possible influence of antipsychotic medications on the neurobiological data always limits the interpretation of results, and it is not common practice to withdraw patients from medications for scientific studies. Although it is difficult to disentangle the effects of medication from the reasons a particular dose of medication was prescribed, we found no statistically significant relationship between chlorpromazine equivalents and the mean beta weights of the significant group clusters. Despite growing evidence that the EEG gamma band is affected in psychosis (McNally and McCarley, 2016; Uhlhaas and Singer, 2006, 2010), its investigation in EEG-fMRI studies is limited: amplifier gain settings required to remove MRI gradient artifacts restrict us from measuring small-amplitude (i.e., <0.5 μV) signals such as gamma band activity and the noisy environment (e.g., compressor pumps) may contaminate higher frequency bands in particular.
It is difficult for us to compare our findings to others in the literature, as there are few similar studies. This may be for several reasons. First, there are many different methods used to combine neural signals derived from simultaneous EEG and fMRI measurements. Second, most studies that looked for relationships between EEG and fMRI used spectral amplitude of the EEG signal. Third, only two studies (studying healthy subjects only) used a common-phase synchronization measure, and it was sensitive to a different aspect of neuronal oscillatory activation (Jann et al., 2009; Kottlow et al., 2012). Fourth, most studies used EC during the resting state, while our subjects had their EO, which are two conditions associated with different mental states. The study of Wu and colleagues (2010) found that during EC, there were widespread alpha hemodynamic responses and high functional connectivity, whereas during EO these effects were markedly diminished.
Footnotes
Acknowledgments
We thank all the participants who participated in our studies. Special thanks to Laura Diaz Hernandez and Kathryn Rieger for helping with the measurements. Andrea Federspiel and Kay Jann for MR-related questions. We thank Nadja Razavi for her help regarding clinical-diagnostic interviews and Ulrich Raub for managing the recruitment process.
Authors' Contributions
A.B., J.M.F., T.K., and V.A.P. wrote the manuscript; A.B. and V.A.P. performed the measurements; A.B., B.J.R., V.A.P., and T.K. conceived and implemented experimental procedures and scripts for analyses; B.J.R., V.A.P., and D.H.M. critically revised the manuscript.
Author Disclosure Statement
All authors hereby declare that there is no actual or potential conflict of interest, including financial, personal, or other relationships with other people or organizations, which would inappropriately influence our work.
References
Supplementary Material
Please find the following supplemental material available below.
For Open Access articles published under a Creative Commons License, all supplemental material carries the same license as the article it is associated with.
For non-Open Access articles published, all supplemental material carries a non-exclusive license, and permission requests for re-use of supplemental material or any part of supplemental material shall be sent directly to the copyright owner as specified in the copyright notice associated with the article.