
Abstract
One of the most intriguing questions in neuroscience is to understand the mechanism of information transfer between different brain areas. Recently, network theory has gained traction and is at the forefront of providing a possible explanation to not only the mechanism of information transfer but also in the identification of different neuropathologies. The perception of a phantom ringing in the ear called tinnitus, similar to other neuropathologies, has been shown to be accompanied by aberrant functional connectivity between different brain areas. Although, there have been independent studies showing that specific groups of areas encode individual symptoms of tinnitus, there has not been one study to show that tinnitus is the unified percept of distinguishable subnetworks encoding different behavioral aspects. This study combines resting-state functional connectivity obtained from the source-localized electroencephalography of 311 tinnitus patients and 264 controls, and a k-fold cross-validation machine learning algorithm to develop a predictive model that verifies the presence of behaviorally specific, spatiotemporally overlapping subnetworks in tinnitus. This reorganization is found to be exclusive to tinnitus, even when compared to physiologically similar disorders such as chronic pain, with each behavioral symptom having a unique oscillatory signature. This frequency-specific transmission of information, called multiplexing, enables different types of information to be carried between two brain regions through the same anatomical connection. In addition to understanding the efficient compensation mechanism of the brain in the presence of multisymptom disorders, the exclusivity of the prediction model presents an encouraging possibility for an objective neural marker for tinnitus.
Introduction
T
It has been suggested that brain networks assume a very cost-effective and efficient small-world topology, which facilitates segregation of brain areas into functionally separable modules and their integration over long distances by means of highly specialized regions called hubs (Bullmore and Sporns, 2009, 2012; Meunier et al., 2009). These functionally separable modules are found to spatially overlap given that different functional modules sometimes share common brain areas (Meunier et al., 2010; Yang and Leskovec, 2014). In addition, the same brain area may also be responsible for different tasks, facilitating processing of multimodal input at each location (Wu et al., 2011). Although aberration from small-world topology has been reported in the presence of a neuropathology (Agosta et al., 2013; Olde Dubbelink et al., 2014; Skidmore et al., 2011; Stam et al., 2009), the concept of functional modularity seems to be retained (Bassett et al., 2008), possibly driving an undesired efficiency in the disease network.
Tinnitus is the continuous phantom perception of a ringing or buzzing sound (Axelsson and Ringdahl, 1989; Jastreboff, 1990; Shargorodsky et al., 2010). The tinnitus network is characterized by an undesirable functional reorganization between auditory and nonauditory brain regions (Mohan et al., 2016a,b). In addition, the tinnitus network consists of a resilient core and a pliable periphery intertwined by overlapping subnetworks working in different oscillatory bands (Mohan et al., 2016c). In our previous work, we showed that although network reorganization in tinnitus is frequency band specific (Mohan et al., 2016a), these networks have overlapping brain areas across the different frequency bands (Mohan et al., 2016c). Furthermore, there also exists an evidence of networks of regions distinctly encoding the different behavioral aspects such as loudness (De Ridder et al., 2015; Vanneste and De Ridder, 2011), distress (Ueyama et al., 2013; Vanneste and De Ridder, 2011; Vanneste et al., 2010), and memory of the sensory deafferentation (De Ridder et al., 2013; Sedley et al., 2015). These subnetworks are identified in specific oscillatory bands, that is, the loudness network in the gamma frequency band (De Ridder et al., 2015), the distress network in the alpha and beta bands (Vanneste and De Ridder, 2011; Vanneste et al., 2010), and the memory of the deafferentation in the theta and gamma bands (De Ridder and Vanneste, 2014; De Ridder et al., 2013). These findings bring us to the theoretical model for tinnitus proposed by De Ridder and coworkers (2014b), which hypothesizes tinnitus as the unified percept of multiple, segregated behavioral symptoms encoded in multiple, spatially, and temporally overlapping subnetworks.
This evidence for temporally overlapping functional modules and neural signatures of behavioral correlates only alludes to the theoretical model for tinnitus. That is, there is no study that we are aware of, which combines the concept of overlapping networks with neural signature of behavioral correlates. To demonstrate this, the current study makes use of both resting-state functional connectivity and a machine learning algorithm to create a model that can discriminate the neuropathology, in this case tinnitus, from a control population. Machine learning algorithms have been used in combination with pathological changes in the cortical activity (Hu and Iannetti, 2016; Wager et al., 2013) and network connectivity (Chong et al., 2016; Eskildsen et al., 2015; Plitt et al., 2015), with the aim to extract distinct features from the disease network that can uniquely characterize the disorder. Although this technique helps in accurately discriminating a disorder from a control group, some researchers suggest that the model may fail when tested against disorders that show similar patterns of a neural activity or connectivity (Hu and Iannetti, 2016). For example, tinnitus has been suggested to resemble chronic pain owing to the similar etiology (i.e., deafferentation) (Folmer et al., 2001; Tonndorf, 1987). In addition, it is suggested that tinnitus and chronic pain share, to a certain extent, similar brain networks that encode, for example, disorder-related distress (De Ridder et al., 2011a). However, the difference in the two disorders lies in the pathways that carry the two percepts. Pain has been identified by very specific nociceptive pathways that have not been identified in tinnitus yet (De Ridder et al., 2011a).
Hence, we hypothesize that the individual connections that help discriminate tinnitus from controls will be exclusive to tinnitus and will cluster into distinct groups of connections that correlate with a behavioral symptom. Furthermore, we hypothesize that these groups of connections will lie in specific oscillatory bands, yet have overlapping connections between brain areas across different groups. Thus, we expect that the behavioral correlate will have a neural oscillatory signature even when the connections between those brain areas possibly overlap across different subnetworks. Through this study, we thus try to provide empirical evidence for a disorder-specific reorganization of the brain as spatially and temporally overlapping subnetworks that behaviorally segregate into separable modules. We also try to establish that although this reorganization is specific to tinnitus, it is possible to understand the brain's coping mechanism to a disorder, from a network reorganization perspective. Furthermore, if the model is exclusive to tinnitus well above chance, then we also have a potential clinical diagnostic tool for tinnitus that can discriminate tinnitus from physiologically similar pathologies.
Materials and Methods
Subject groups
Tinnitus group
The tinnitus group consisted of 311 participants (M = 50.63 years, standard deviation [SD] = 13.67 years; 213 males and 98 females), the onset of whose percept occurred at least a year before data collection. Individuals having pulsatile tinnitus, Ménière's disease, otosclerosis, chronic headache, neurological disorders (such as brain tumors), and those being treated for mental disorders were excluded from the study. The qualitative aspects of tinnitus that were recorded included location (unilateral [N = 114] or bilateral [N = 197]) and type (pure tone [N = 118] or noise like [N = 193]). Pure-tone audiometric thresholds were collected at 0.125, 0.25, 0.5, 1, 2, 3, 4, 6, and 8 kHz as recommended by the British Society of Audiology. Further diagnostic measurements included identifying the pitch and loudness of the tinnitus on the side with the strongest sense of the tinnitus percept. This was done by presenting a 1 kHz pure tone, 10 dB above the patient's hearing threshold at that frequency, in the ear contralateral to that of the tinnitus percept. The pitch of tinnitus was determined by adjusting the frequency of the pure tone until the patient matched it to the pitch of the percept. The intensity of the pure tone was changed to determine the loudness of the percept. Tinnitus loudness level (dB SL) (M = 7.85 dB SL, SD = 8.78) was then calculated by subtracting the absolute loudness level from the audiometric threshold at the tinnitus frequency (M = 5143 Hz, SD = 3183) (Meeus et al., 2010, 2011). A visual analogue scale for loudness (VAS) (“How loud is your tinnitus?”: 0 = no tinnitus and 10 = as loud as imaginable) was assessed. The mean VAS for loudness was 5.31 (SD = 2.56). Also, the Tinnitus Questionnaire (TQ) (Meeus et al., 2007) was assessed that measures a broad spectrum of tinnitus-related psychological complaints. The global TQ score can be computed to measure the general level of psychological and psychosomatic distress. The mean score on the TQ was 36.45 (SD = 17.32). The depression and anxiety were evaluated using the Hospital Anxiety and Depression Scale. The mean score on the depression scale was 6.50 (SD = 4.06) and the mean score on the anxiety scale was 6.52 (SD = 3.48).
Control group
The healthy control group consisted of 264 participants (M = 49.78 years; SD = 14.74; 154 males and 110 females). Individuals with psychiatric and neurological illness, a history of psychiatric disorders and drug/alcohol abuse, records of head injury that resulted in a loss of consciousness, seizures, headaches, and physical disability were excluded from the study. No audiometric testing was done on the individuals in the control group.
Neuropathic pain group
The group consisting of patients suffering from neuropathic pain comprised 78 participants (M = 52.41 years; SD = 11.52; 45 males and 33 females). The term “Neuropathic pain,” related to deafferentation, that is, peripheral nerve, root or central tract lesions, as used in this study, is an umbrella term that encompasses individuals suffering from chronic pain. These patients suffered from these pain complaints for more than 1 year. A numeric rating scale for pain (“How much pain do you have?”: 0 = no pain and 10 = as painful as imaginable) assessed the perceived general pain. General pain was defined as a global pain score experienced during the past week. The mean pain score on the numeric rating scale was 8.15 (SD = 2.98). The Pain Vigilance and Awareness Questionnaire (PVAQ) was also assessed. The PVAQ measures the preoccupation with or attention to pain and pain changes, and is associated with pain-related fear and perceived pain severity (Roelofs et al., 2003). It consists of two separable factors that measure (1) attention to pain and (2) attention to changes in pain (Roelofs et al., 2003). For the PVAQ, the baseline score for attention to pain was 13.60 (SD = 4.21) and for attention to changes in pain was 17.57 (SD = 3.98).
Tinnitus group for validation of exclusivity
An additional group of 53 tinnitus patients (M = 48.91 years, SD = 13.02 years; 26 males and 27 females) was collected to test the tinnitus models. Fifteen patients had unilateral tinnitus and 34 had bilateral tinnitus. Twenty-one patients had pure-tone tinnitus, while 32 reported to have noise-like tinnitus. The average tinnitus loudness level (dB SL) was 6.24 dB SL (SD = 6.02) and the tinnitus frequency was 4845 Hz (SD = 2071). The mean VAS for loudness was 6.04 (SD = 3.09). The mean score on the TQ was 40.91 (SD = 20.75).
Data collection and preprocessing
Data collection
The data were collected under the approval of IRB UZA OGA85. All patients gave an informed consent (as in accordance with the declaration of Helsinki and approved by the local ethics committee at Antwerp University Hospital). Continuous resting-state electroencephalography (EEG) was recorded for 5 min from participants in all three groups (sampling rate = 500 Hz, band passed = 0.15–200 Hz). Subjects were seated upright on a comfortable chair in a fully lit room and were instructed to keep their eyes closed. The EEGs were sampled using Mistar-201 amplifiers (NovaTech;
Data preprocessing
Source reconstruction was generated by estimating the intracerebral electrical sources through standardized low-resolution brain electromagnetic tomography [sLORETA; Pascual-Marqui (2002)]. As a standard practice before the execution of the sLORETA algorithm, a common average reference transformation was performed on the data (Pascual-Marqui, 2002). sLORETA differs from other source localization algorithms since it does not assume a predefined number of active sources, while computing neuronal activity in current density (A/m2). The solution space and the associated lead field matrix used in the study were those that were implemented using the LORETA-Key software (available at
Lagged phase coherence
The lagged-phase coherence has been interpreted as contributing to source activity by cross talk between brain regions (Congedo et al., 2010). In another way, if the oscillations of two sources are coherent with phase lag, this cross talk could be interpreted as axonal transmission of shared information. This signal can be decomposed by the discrete Fourier transformation into a finite series of sine and cosine waves (carrier out-of-phase and in-phase waves, which compose the real and imaginary portion of the Fourier decomposition) at the Fourier frequencies (Bloomfield, 2000). Lag of cosine waves is inversely proportional (with respect to sine counterparts) to their frequency. Pascual-Marqui defined lagged-phase coherence and also described the significance thresholds for given set of lagged-phase coherence values according to asymptotic results (Pascual-Marqui et al., 2011). In this study, the amount of lagged-phase coherence between interacting regions represents the connectivity strength between pairwise combinations of 84 Brodmann areas. The 84 Brodmann areas used in this study are defined in Table 1.
Model generation
Tenfold cross validation
The pairwise connectivity strengths (weights) in the different frequency bands were further organized into a file that could be read by the data-mining software Weka (University of Waikato Machine Learning Group, available at
The measurements of model accuracy calculated by the k-fold cross-validation technique include the number of correctly classified cases, number of incorrectly classified cases, true-positive ratio, root mean squared error (RMSE), mean average error (MAE), and κ-statistic. The true-positive ratio was calculated as the ratio of the total number of correctly classified positive instances (in this case, positive refers to tinnitus patients) over the total number of positive instances in the testing sample. RMSE is a measure of how well the model is learned by the machine and was calculated by taking the square root of the average of the residuals (errors not explained by the regression equation) over the total sample size. The mean average error (MAE) is simply the average of residuals over the total sample size. The κ-statistic compares the model's observed accuracy with its expected (chance) accuracy by taking the difference in observed and expected accuracy over one minus the expected accuracy (1—expected accuracy).
Randomization of data
To determine significance of the model accuracy for the tinnitus/control model, measurements of model accuracy were averaged over 20 iterations of randomized assignment of patient data as either tinnitus or control. The randomized dataset was then used to generate a prediction model and model accuracy values, which were averaged across the 20 trials. The number of records assigned to tinnitus (n = 311) and controls (n = 264) was kept constant across all iterations to minimize variance compared to the original model.
Validation of exclusivity
Using the tinnitus model generated by the 10-fold cross-validation technique in Weka, an additional test set consisting of network connectivity strengths of the functional networks derived from 78 neuropathic pain patients and 53 tinnitus patients was validated. Similar to the cross-validation technique used for creating the tinnitus model, this dataset was divided into 10-folds where each fold of data was tested against the previously generated tinnitus model. The resulting measurement of model accuracy was calculated on the tinnitus/pain model as mentioned above. To test the significance of the tinnitus/pain model, the measurements of model accuracy were averaged over 20 iterations of randomly assigning patients to either the tinnitus group or the neuropathic pain group. The number of patients assigned to the tinnitus group n = 53) and the pain group (n = 78) was maintained during the randomization process to minimize variance with respect to the original model.
Statistical test
On obtaining the averaged measurements of model accuracy from the tinnitus/control, tinnitus/pain, and the randomizations, a chi-square test was performed to determine the significance of the tinnitus/control and the tinnitus/pain models against the random models. The χ 2 values were calculated using the observed values of number of correctly and incorrectly classified cases from the 10-fold cross-validation results of the tinnitus/control and tinnitus/pain models and the expected values of number of correctly and incorrectly classified cases from the corresponding random models.
A four-factor principal component analysis (PCA) was conducted between the tinnitus contributing connections and behavioral measures collected using IBM SPSS 22 software. This factor analysis was then overlaid on the original tinnitus model to determine which clusters of connections demonstrate significant correlation with specific behavioral measures. In addition to the original factor analysis, partial correlation analysis was performed on the significant behavioral measures with each factor, while controlling for behavioral measures that showed a significant correlation with the measure in question.
Results
Tinnitus model
The tinnitus model generation using the cross-validation technique resulted in identifying a set of 65 connections that uniquely differentiate the functional networks of the tinnitus and control groups. These contributing connections span across the eight frequency bands and two hemispheres. All models generated using 2–10-folds comprised the same 65 contributing connections and resulted in the same contributing values (β values) and values of model accuracy (Fig. 1). True-positive discrimination accuracy ranged from 0.82 (2-folds) to 0.88 (6-, 9-, and 10-folds). RMSE was confined to a range between 0.31 (6-, 7-, 9-, and 10-folds) and 0.35 (2-folds).
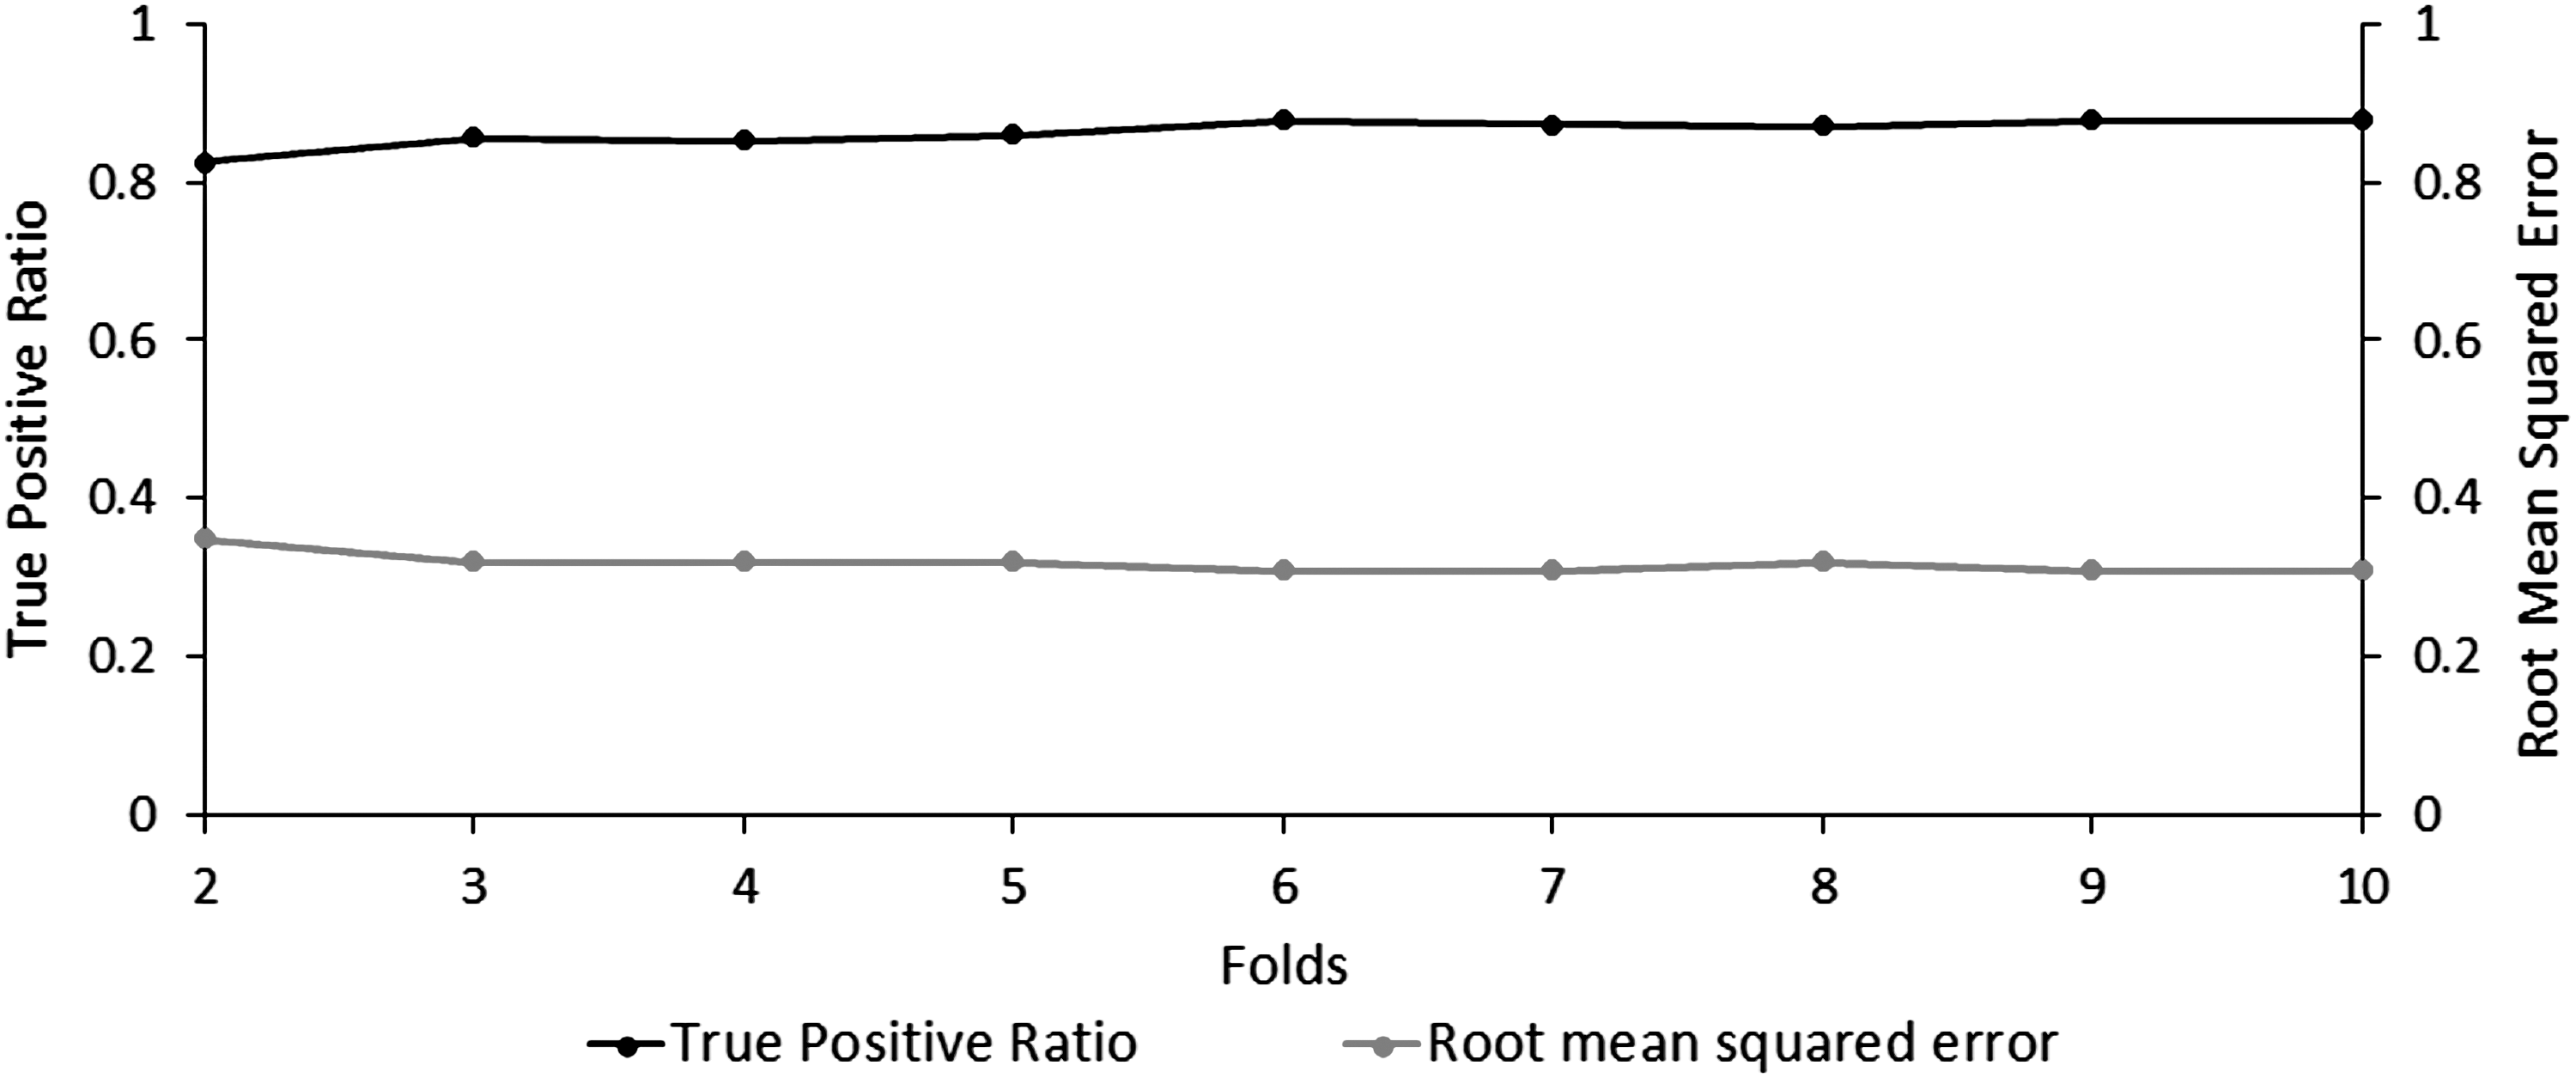
Accuracy and error in tinnitus discrimination across multiple cross-validation trials. The ratio of true positive tinnitus predictions (black) and their corresponding RMSE (gray) across 2–10 cross-validation folds. RMSE, root mean square error.
Due to the increased statistical significance of the 10-fold cross-validation over a 2-fold cross-validation, as reported in previous research (Lemm et al., 2011), the remainder of this study will report the findings from the tinnitus model generated using the 10-fold cross-validation. The generated tinnitus model was fairly accurate at distinguishing between tinnitus and control patients with the percentage of correctly classified cases = 87.70%, percentage of incorrectly classified cases = 12.35%, κ-statistic = 0.75, MAE = 0.20, and RMSE = 0.31 (Fig. 2).
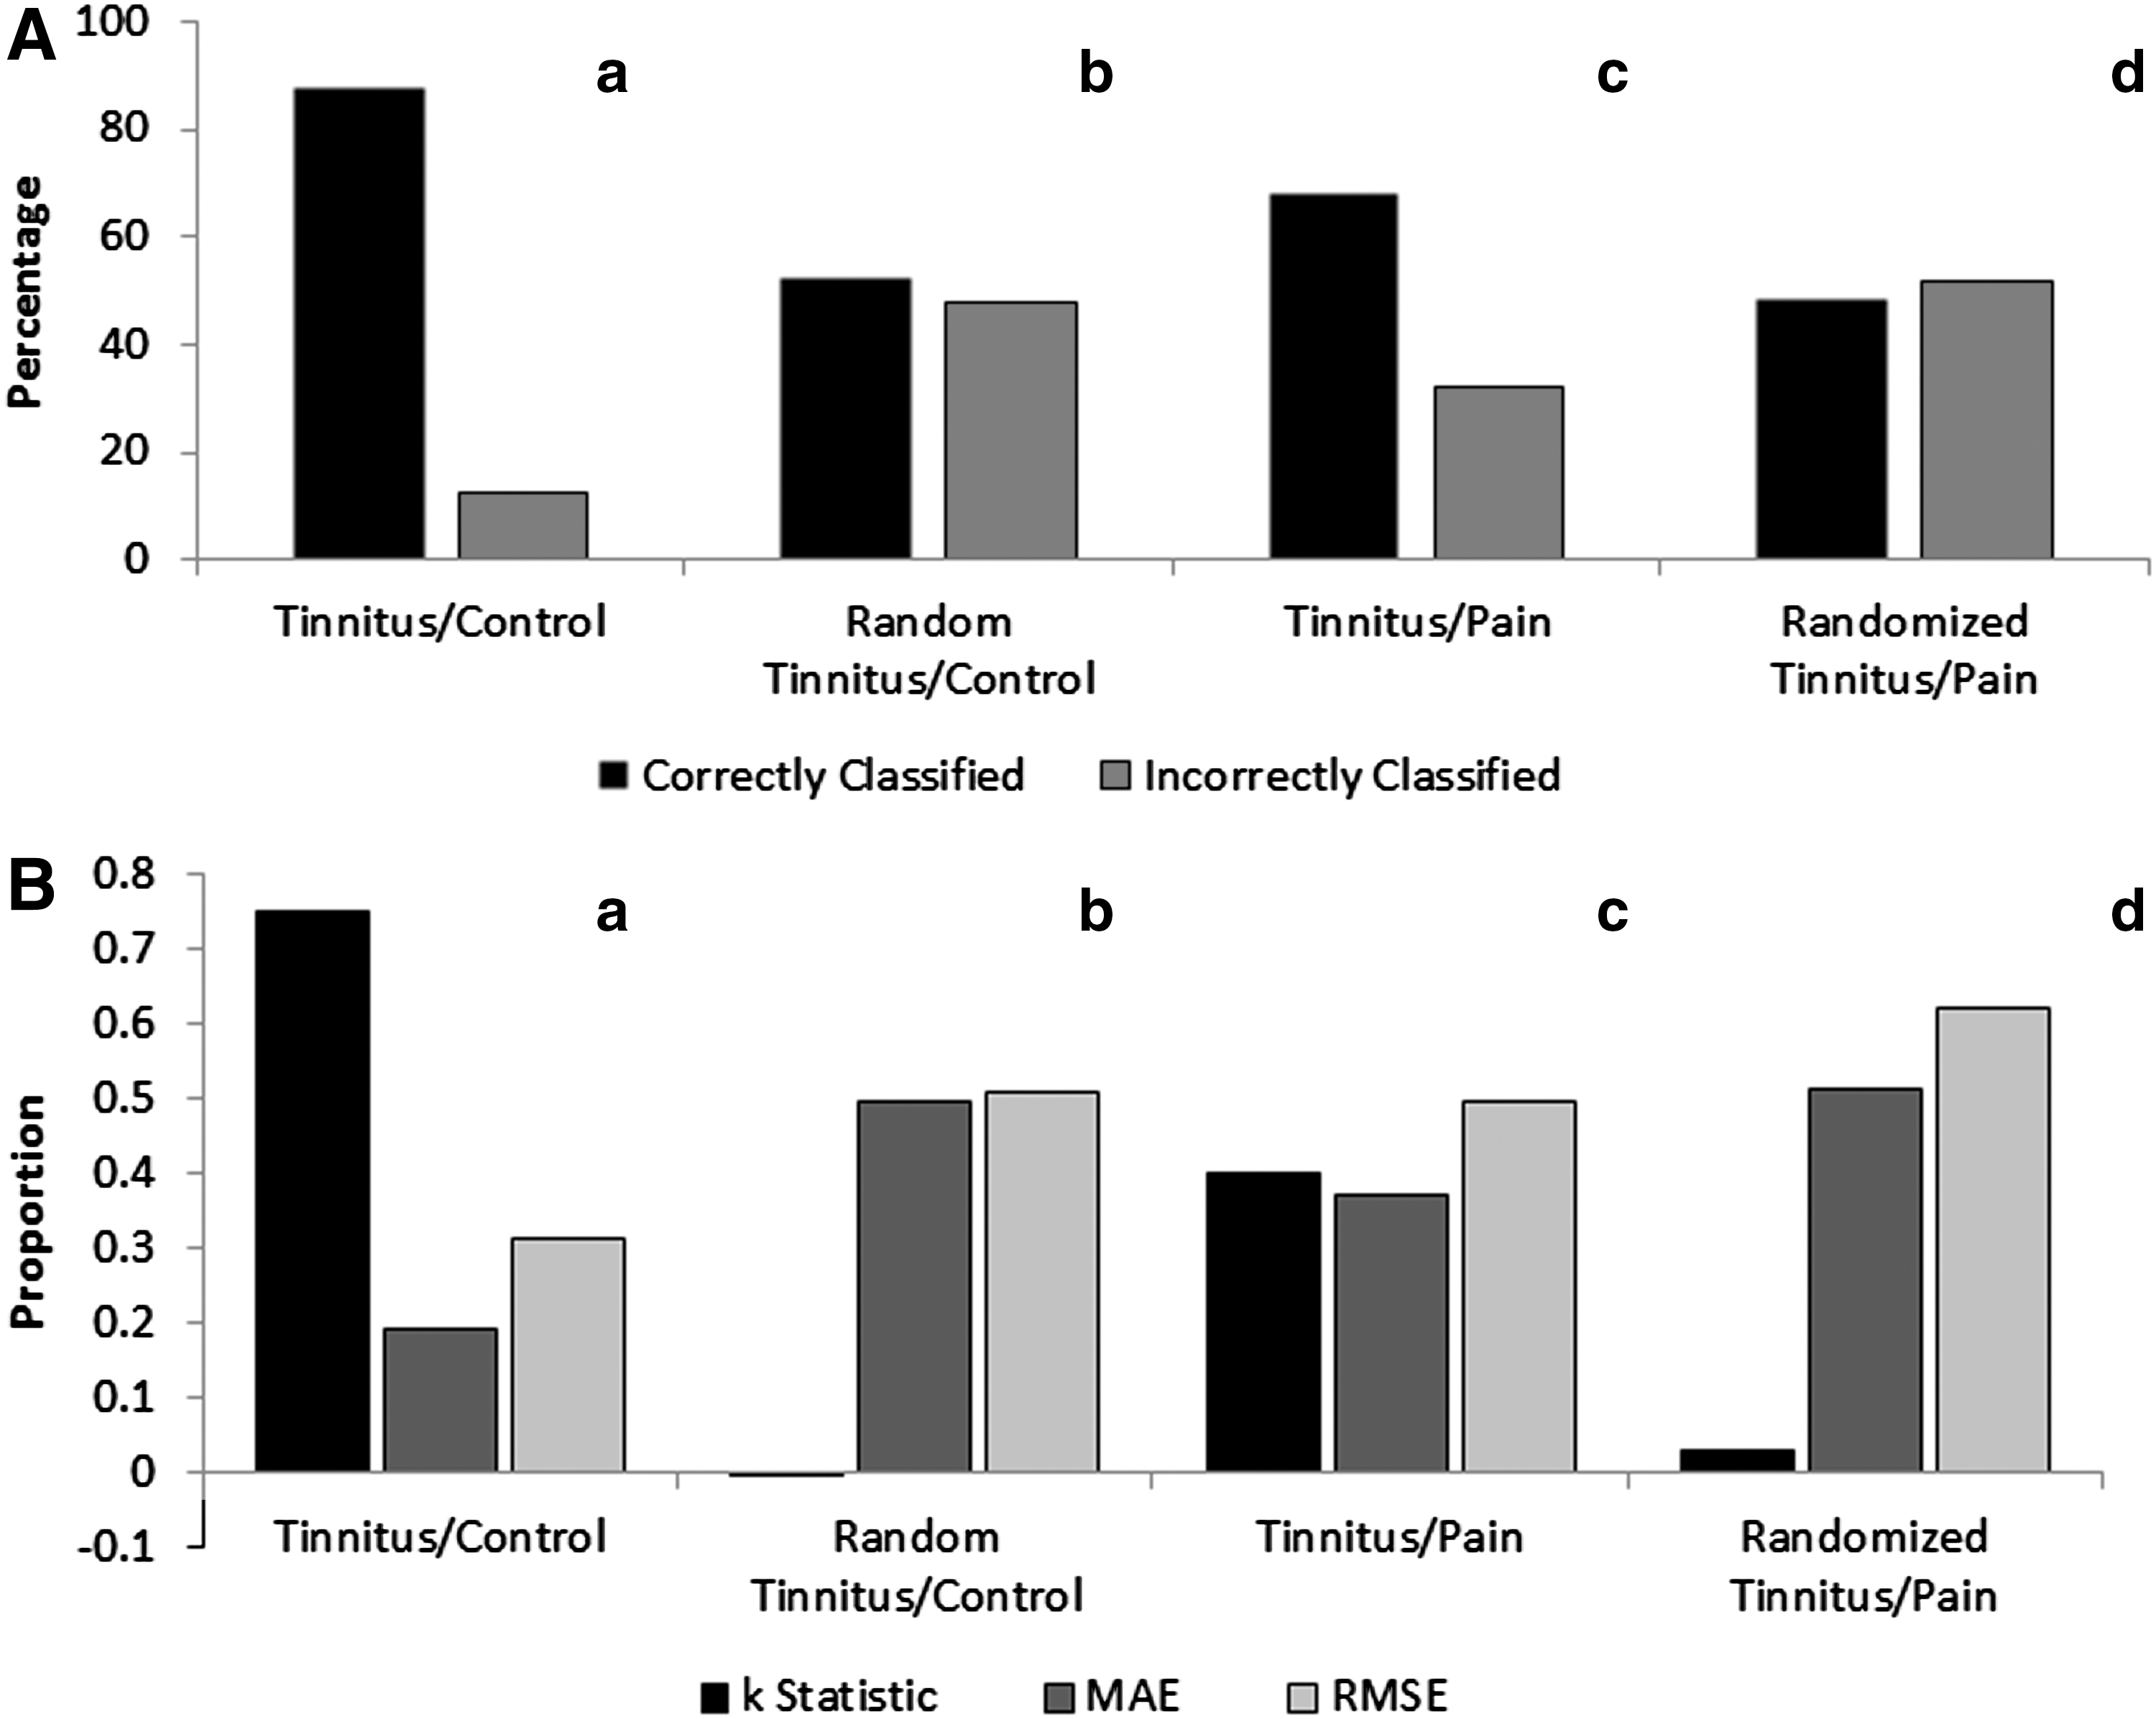
Evaluation of the accuracy and exclusivity of the tinnitus prediction model.
Randomization results
Randomization of the tinnitus/control model yielded a model where the percentage of correctly classified cases = 52.41%, percentage of incorrectly classified cases = 47.60%, κ-statistic = −0.002, MAE = 0.50, and RMSE = 0.51. Randomization of the tinnitus/control data demonstrated that the tinnitus prediction model was significant when compared to the averaged randomized prediction model (χ 2 = 286.35, p < 0.001) (Fig. 2).
Connections of importance
The 65 connections that discriminate the tinnitus from the control are named the connections of importance. These connections span into two large clusters with more than five connections, five smaller clusters with two to five connections, and six single-connection clusters that were not grouped together by brain hemisphere or oscillatory frequency bands (Fig. 3).

Connections of importance as generated by the original tinnitus model using the 10-fold cross-validation. Brodmann brain regions are connected over frequency bands delta (red line), theta (brown line), alpha1 (green line), alpha2 (black line), beta1 (yellow line), beta2 (orange line), beta3 (purple line), and gamma (blue line). Implicated Brodmann areas were also differentiated based on location on either the right (white circle) or left (black circle) hemispheres. Color images available online at
Behavioral correlates
PCA of the contribution of each of the connections of importance (β values) from the tinnitus model generated and the behavioral data collected from tinnitus participants demonstrated a high correlation between factors and frequency bands for contributing connections (Table 2). Factor 1 comprised every contributing connection in theta, beta1, beta2, beta3, and gamma frequency bands along with several alpha1 contributing connections that overlap with Factor 4 and alpha2 contributing connections that overlap with Factor 2. The rest of the contributing connections in Factor 2 are present in the alpha2 band, while the remaining contributing connections in Factor 4 are present in the alpha1 band. All the contributing connections in Factor 3 belong to the delta band. A more detailed description of the connections in importance and their contribution to each factor is given in Table 2 and illustrated in Figure 4.
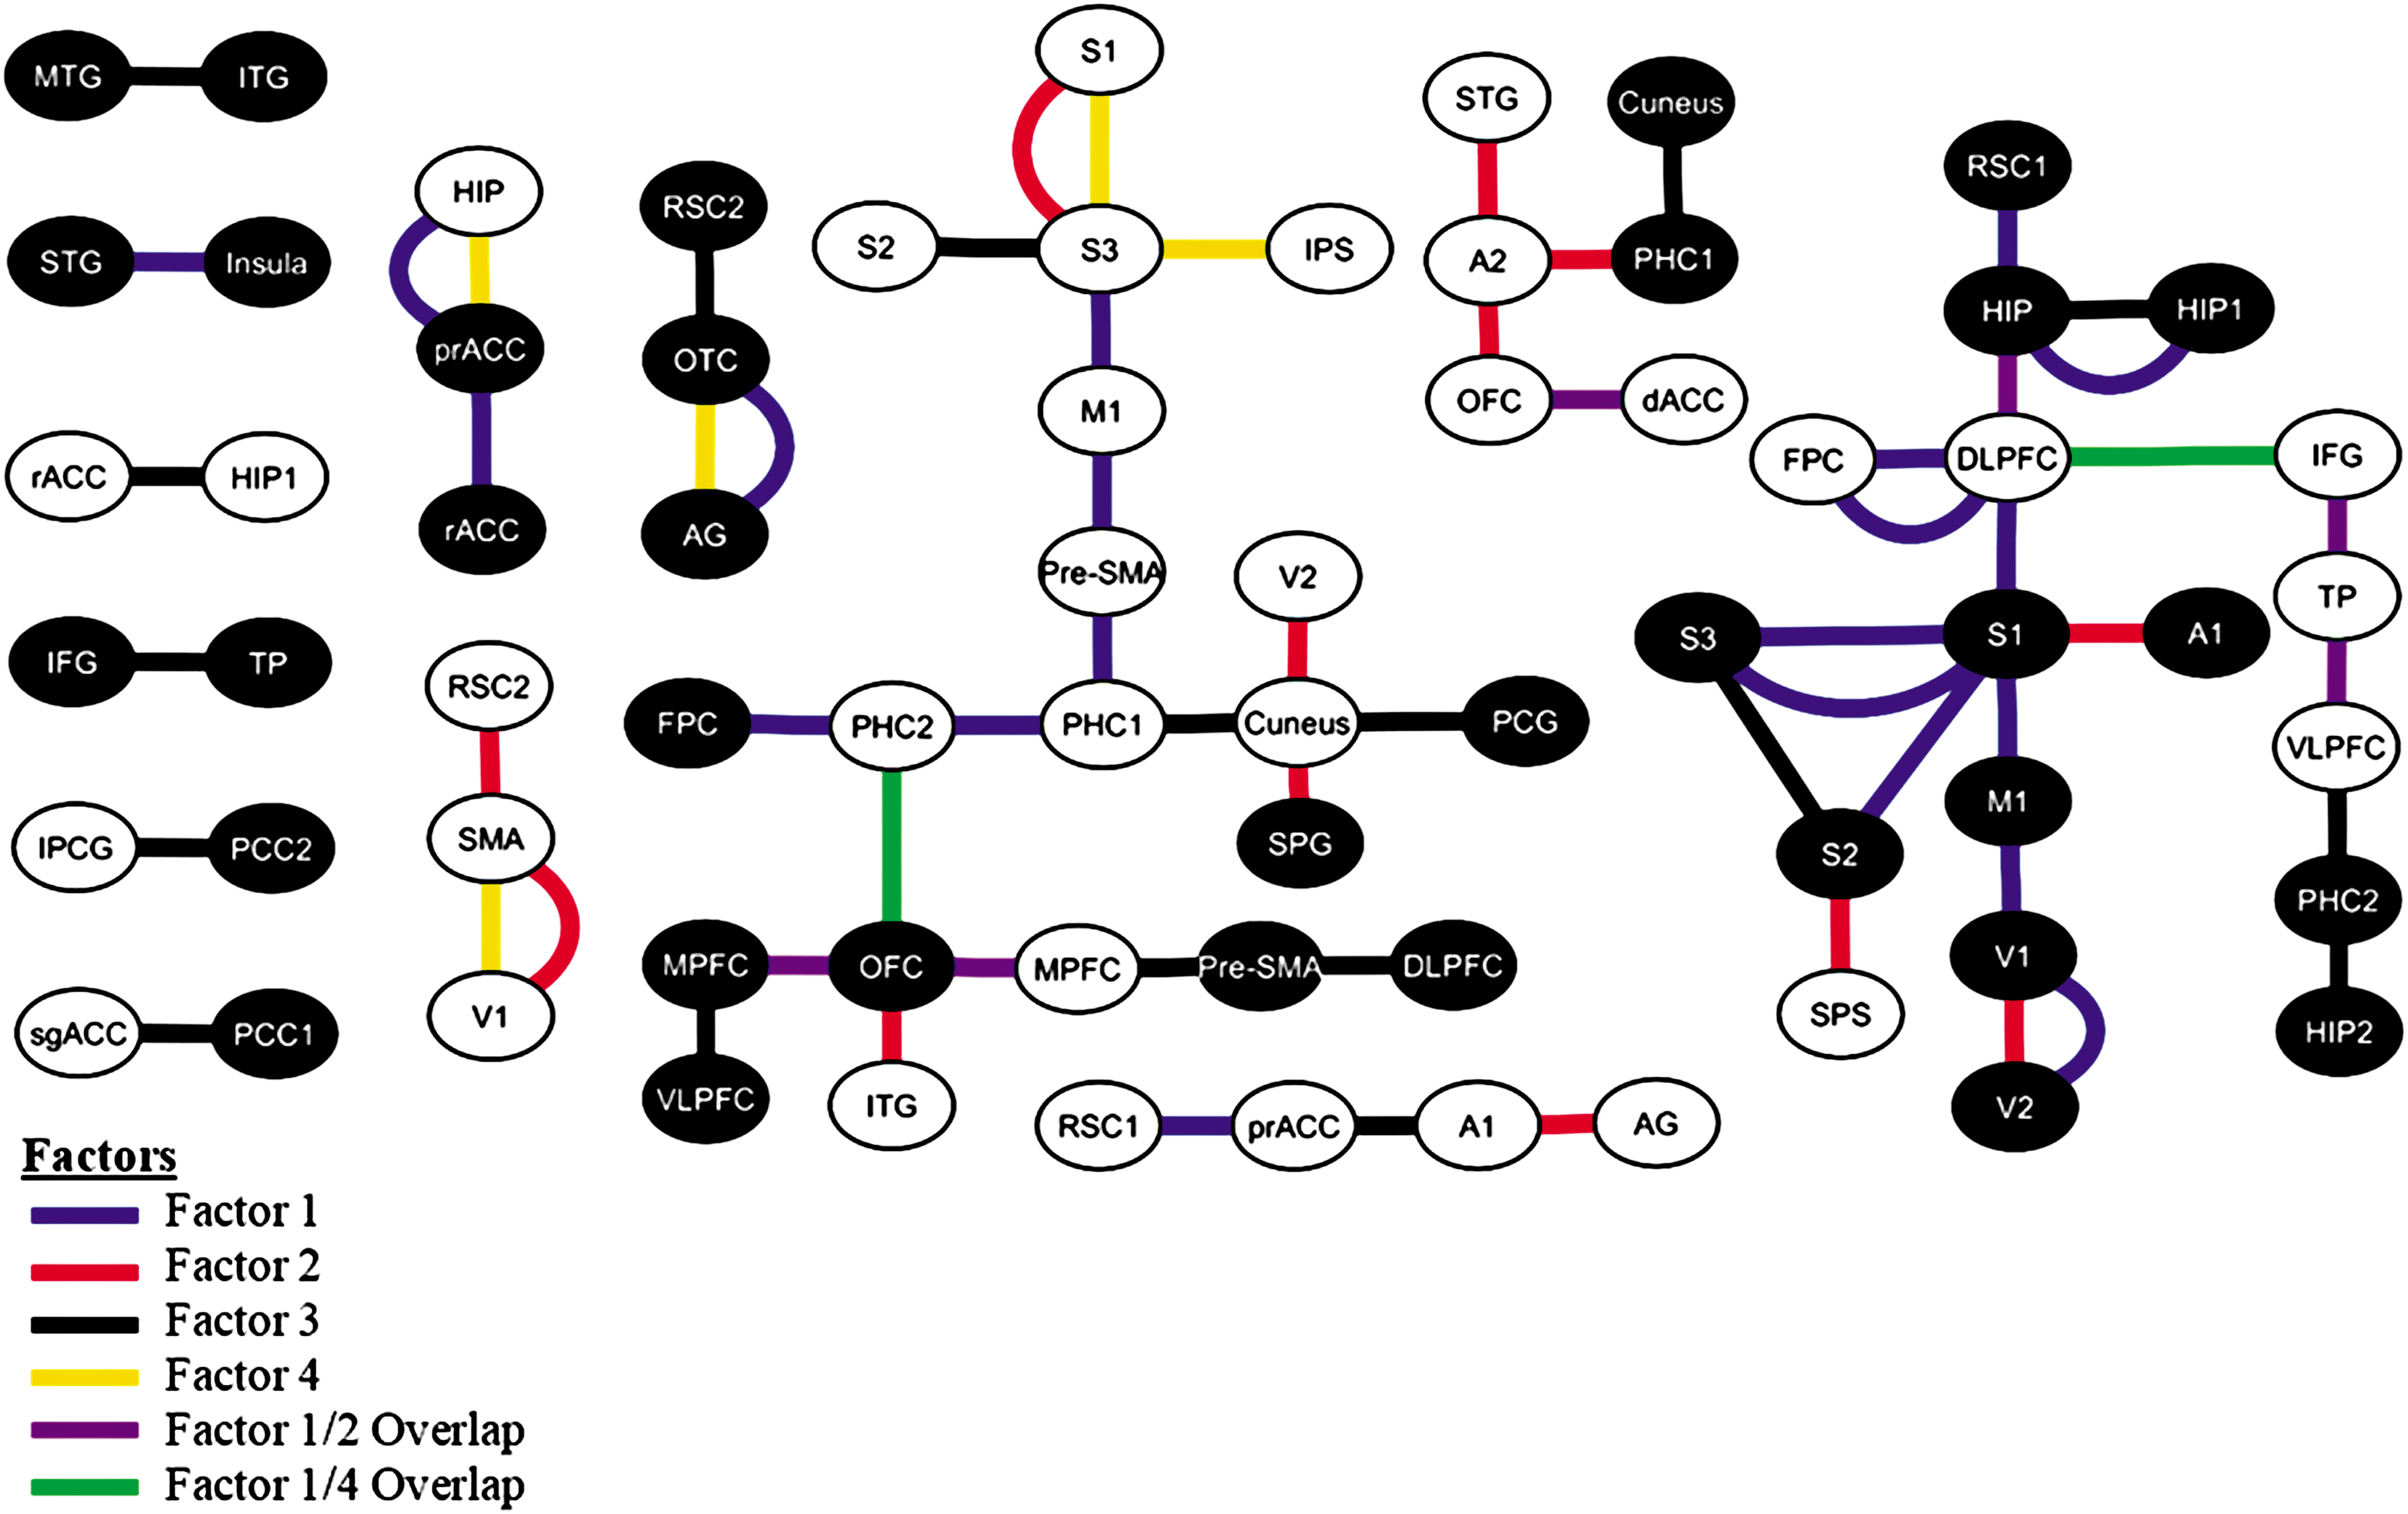
Classification of the connections of importance into factors as determined by PCA. Connections were attributed to Factor 1 (blue), Factor 2 (red), Factor 3 (black), and Factor 4 (yellow). Several connections contributed to more than one factor; these fell into the Factor 1/Factor 2 overlapping connections (purple) and the Factor 1/Factor 4 overlapping connections (green). PCA, principal component analysis. Color images available online at
Bold values denote significant contribution of the connections in that particular factor.
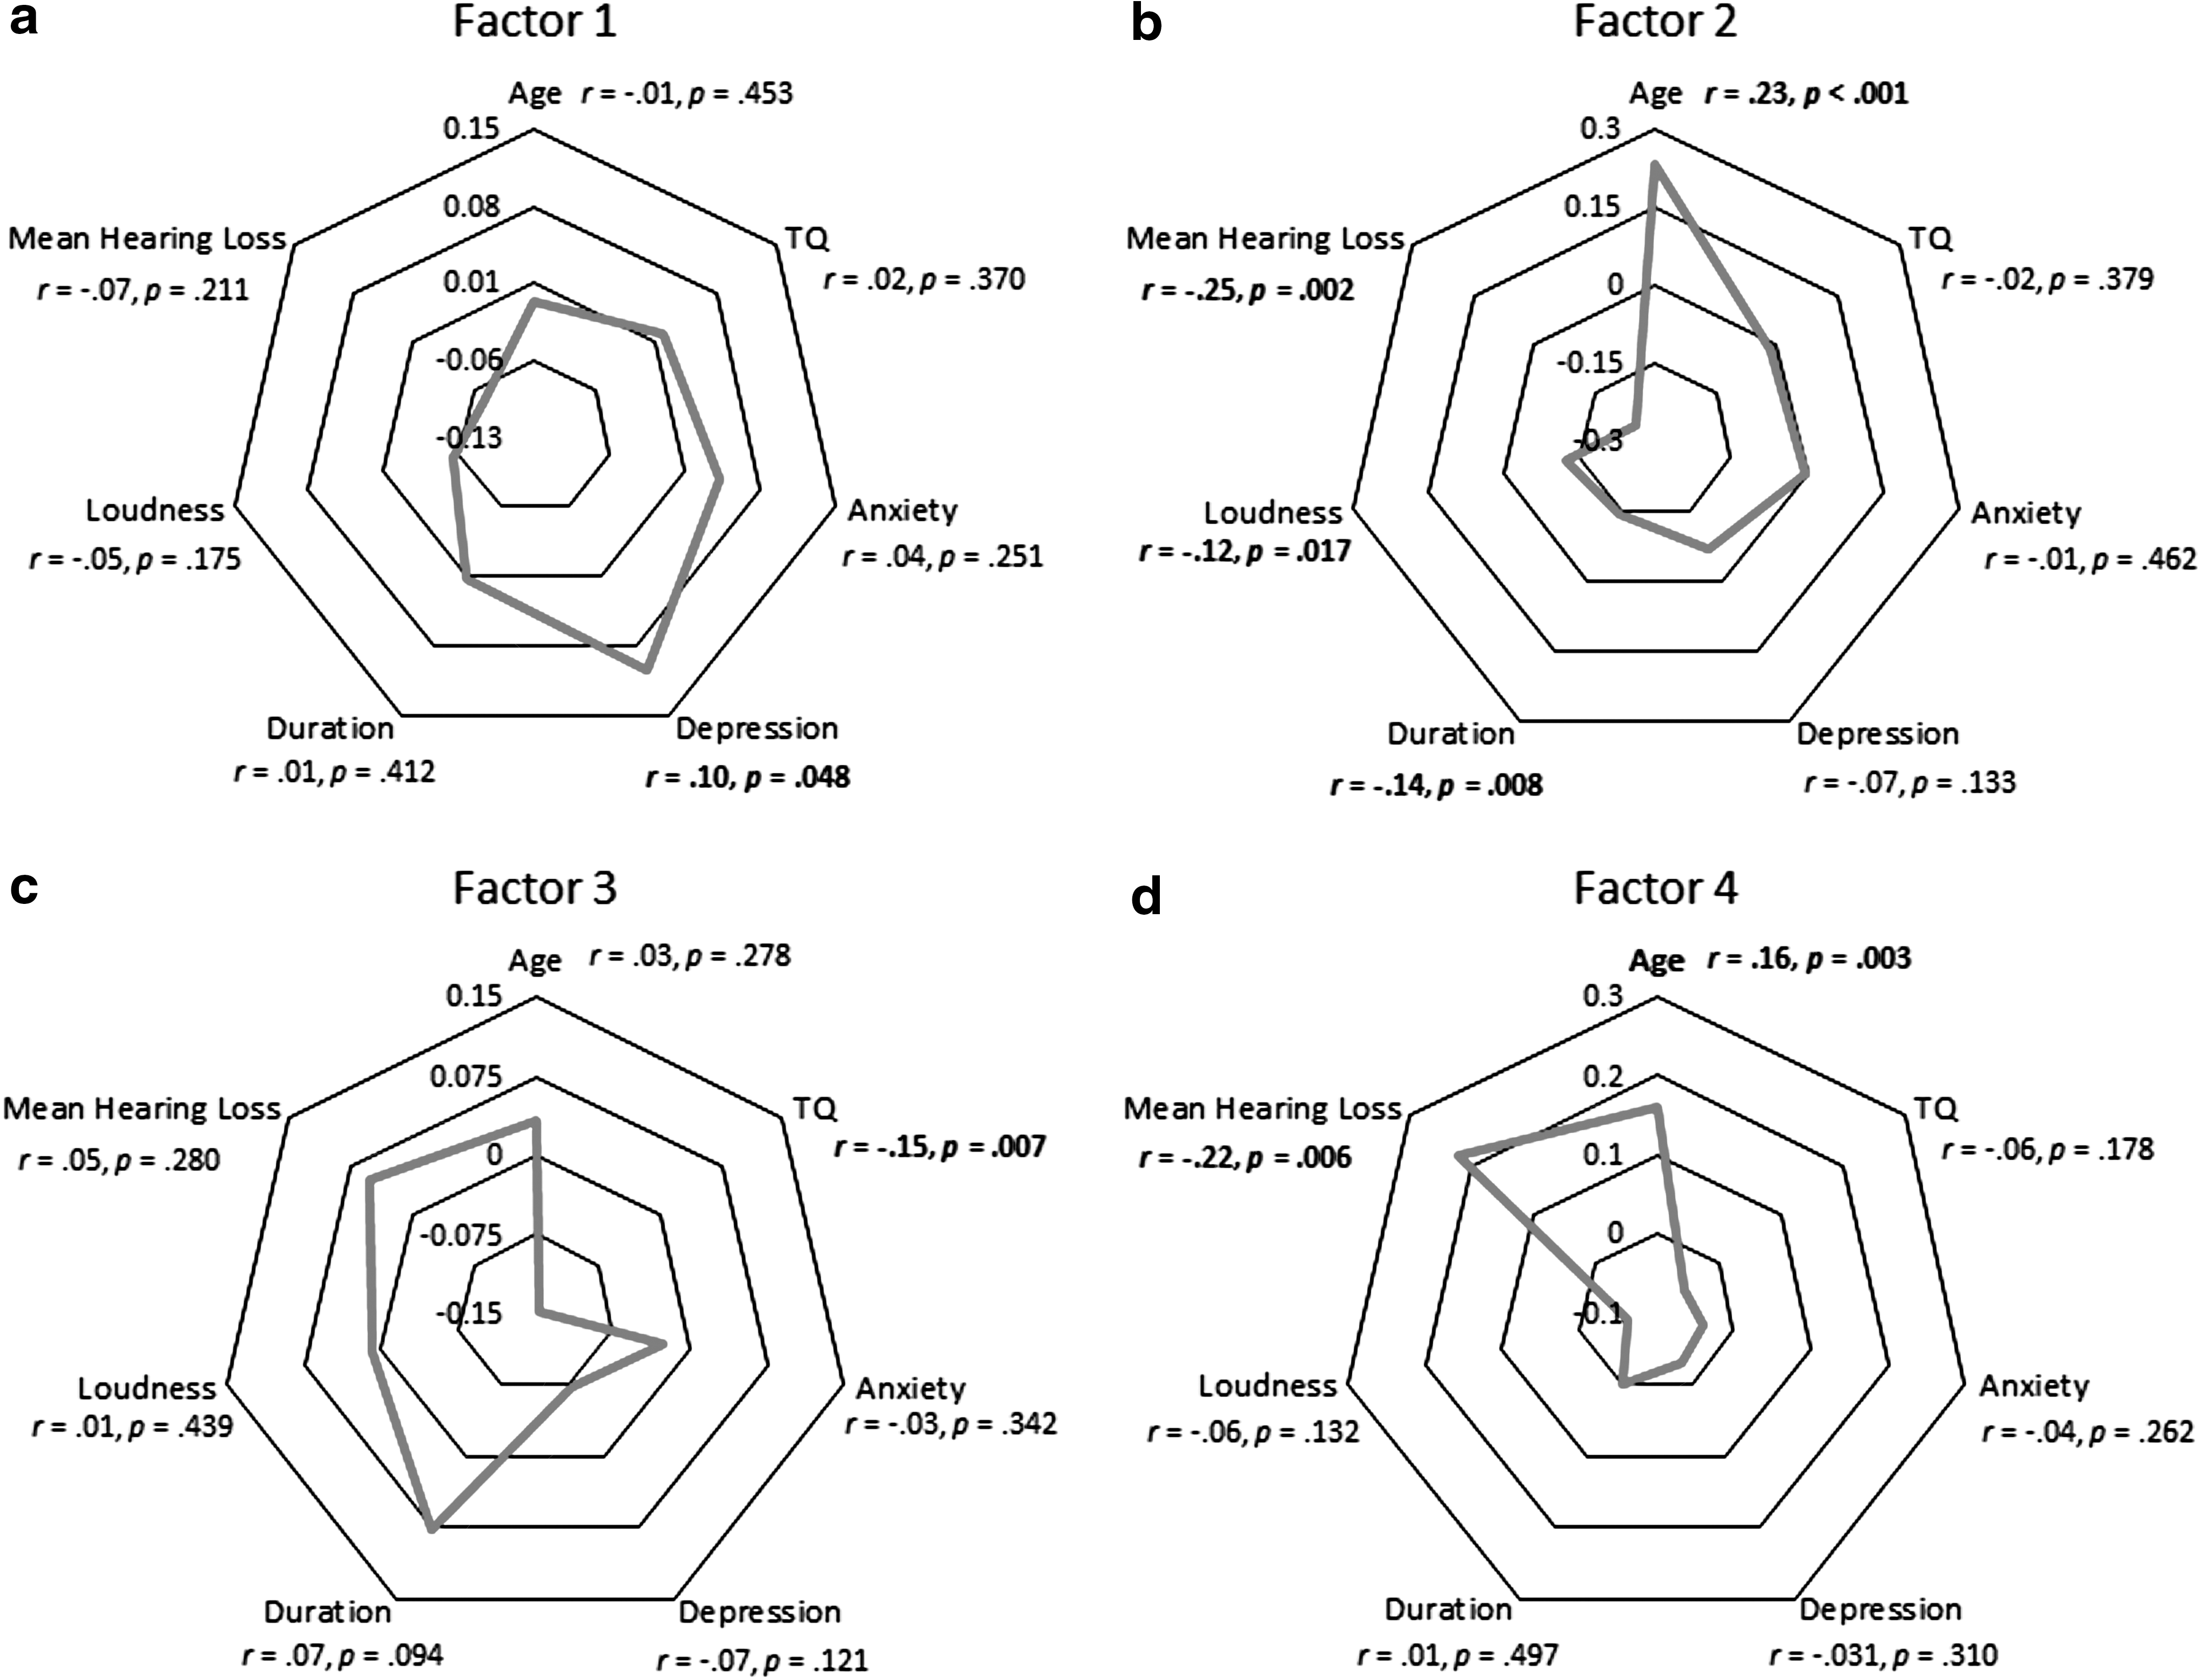
Factor 1 was significantly correlated with depression (r = 0.10, p = 0.048) (Fig. 5A). Factor 2 showed significant correlation with age (r = 0.23, p < 0.001), duration of percept (r = −0.14, p = 0.008), loudness of percept (r = −0.12, p = 0.017), and mean hearing loss (MHL) (r = −0.25, p = 0.002) (Fig. 5B). A significant correlation was observed between Factor 3 and distress, that is, TQ (r = −0.15, p = 0.007) (Fig. 5C). Factor 4 showed a significant correlation with age (r = 0.16, p = 0.003) and MHL (r = 0.22, p = 0.006) (Fig. 5D). From the results of the partial correlation detailed in Table 3, we observe that Factor 1 was significantly correlated with the TQ score after controlling for tinnitus-related anxiety (r = 0.10, p = 0.047) and significantly correlated with tinnitus-related depression after controlling for the loudness of the percept (r = 0.10, p = 0.048); Factor 2 was significantly negatively correlated with age after controlling for tinnitus-related anxiety (r = −0.23, p < 0.001), duration (r = −0.20, p = 0.001), loudness of the percept (r = −0.19, p < 0.001), and MHL (r = −0.15, p = 0.049); was significantly negatively correlated with tinnitus-related depression after controlling for TQ score (r = −0.11, p = 0.043); was significantly negatively correlated with the loudness of the percept after controlling for TQ score (r = −0.10, p = 0.043); was significantly negatively correlated with MHL after controlling for TQ score (r = −0.27, p = 0.001), tinnitus-related depression (r = −0.22, p = 0.008), duration (r = −0.20, p = 0.02), and loudness (r = −0.23, p = 0.005) of the percept. Factor 3 was significantly correlated with age after controlling for MHL (r = 0.21, p = 0.008); was significantly negatively correlated with TQ score after controlling for tinnitus-related anxiety (r = −0.14, p = 0.011) and depression (r = −0.12, p = 0.028), duration (r = −0.15, p = 0.01), and loudness of the percept (r = −0.16, p = 0.004). Factor 4 was significantly correlated with age after controlling for anxiety (r = 0.17, p = 0.004), duration (r = 0.17, p = 0.003), and loudness of the percept (r = 0.18, p = 0.001); was significantly negatively correlated with the loudness of the percept after controlling for MHL (r = −0.18, p = 0.021); was significantly correlated with MHL after controlling for age (r = 0.20, p = 0.013), TQ score (r = 0.23, p = 0.005), tinnitus-related depression (r = 0.23, p = 0.007), duration (r = 0.19, p = 0.024), and loudness of the percept (r = 0.27, p = 0.001).
Correlation of the factors and behavioral correlates. Correlations were deemed significant at *p < 0.05 and **p < 0.01 (one-tailed).
p < 0.05, ** p < 0.01, *** p < 0.001.
MHL, mean hearing loss; TQ, Tinnitus Questionnaire.
Exclusivity of the model
The tinnitus/control model when tested against the tinnitus/pain dataset had a better-than-chance success rate at distinguishing between tinnitus from neuropathic pain patients. The model yielded percentage of correctly classified cases = 66.40%, percentage of incorrectly classified cases = 31.88%, κ-statistic = 0.40, MAE = 0.38, and RMSE = 0.50. Randomization of the tinnitus/pain dataset yielded a model with percentage of correctly classified cases = 48.48%, percentage of incorrectly classified cases = 51.52%, κ-statistic = 0.40, MAE = 0.38, and RMSE = 0.50. The exclusivity of the prediction model was also significantly better at predicting tinnitus versus neuropathic pain patients compared to the averaged randomized prediction model (χ 2 = 21.31, p < 0.001) (Fig. 2).
Discussion
With advancement in network theory, there is an increased interest to identify the neural signatures for the behavioral correlates of multisymptom disorders that could explain both, the mechanism of the underlying pathology as well as serve as a clinical diagnostic tool. This study aims at providing empirical evidence for behaviorally segregated, yet spatially and temporally overlapping functional modules that integrate in a disorder-specific way, resulting in a holistic experience that is unique to each pathology. In particular, we aim at establishing empirical evidence to the theoretical model for tinnitus, proposed by De Ridder and colleagues (2014b) and in doing so, present a possible clinical diagnostic tool for tinnitus.
The success of the model spun out using the k-fold cross-validation algorithm, in reliably discriminating cases with tinnitus from controls significantly above chance is promising, especially considering the stringency and diminished bias of cross-validation testing (Lemm et al., 2011). Moreover, the statistical validity of the model is preserved when comparing the percentage of correctly and incorrectly classified cases with that of a random model. These results are in congruence with findings from other pathologies identified with functional network reorganization, including hepatic encephalopathy (Jao et al., 2015), autism spectrum disorder (Nomi and Uddin, 2015), pain (Wager et al., 2013), and migraine (Chong et al., 2016). In addition to the enhanced precision, the model displays a high degree of specificity by using only 65 out of 27,888 connections across all brain areas and frequencies to discriminate tinnitus from the control dataset. It is, however, important to note that these 65 connections only discriminate the tinnitus network from the control and hence the rest of the 27,822 connections are still common to both the tinnitus and the control network, but have been shown to be organized differently (Mohan et al., 2016a,b,c).
In agreement with our hypothesis, we observe from the correlation and partial correlation results that these 66 connections fall into clinically relevant factors that encode three important aspects of tinnitus—the sensory deprivation/memory of the deafferented frequency, tinnitus-related depression, and the salience associated with the tinnitus. We also observe that these connections cluster with respect to frequency bands in factors 2 (i.e., alpha2), 3 (i.e., delta), and 4 (i.e., alpha1), while factor 1 is mainly a combination of high frequencies (i.e., beta2 and gamma). Factors 2 and 4 seem to encode the aging and the hearing loss aspects of tinnitus, respectively. Although the model fairly discriminates between aging and hearing loss, auditory deprivation is one of the major effects of aging (Zagólski, 2006) and hence is difficult to tease apart the effect of one from the other (Francis et al., 2003; Huang and Tang, 2010). The tinnitus-related depression is encoded by factor 1, which in congruence with previous literature (De Ridder et al., 2011b; Husain and Schmidt, 2014; Schlee et al., 2009; Ueyama et al., 2013; Vanneste and De Ridder, 2011; Vanneste et al., 2010; Weisz et al., 2005) is encoded by the beta frequency bands. Other aspects of the emotional component of tinnitus are captured by the TQ (Adamchic et al., 2012; Belli et al., 2007; Crönlein et al., 2007; Kam et al., 2009; Meeus et al., 2007; Zeman et al., 2012), which correlates with factor 3. Most of these connections fall in the delta band, which is associated with aiding long-distance connectivity and broadcasting information to other parts of the brain (Uhlhaas, 2013; von Stein and Sarnthein, 2000).
Physiologically, we observe that factors 2 and 4 consist of some of the important connections between the auditory cortex, parahippocampus, hippocampus, and orbitofrontal cortex, mostly communicating the Alpha2 frequency band. As mentioned above, these factors seem to be encoding ageing and hearing, respectively. The auditory deafferentation has been proposed to cause an increase in the oscillatory activity in the parahippocampus, which results in a lack of suppression of unimportant sensory information in the hippocampus (De Ridder and Vanneste, 2014). Furthermore, the factors also consist of areas that encode the pitch of the perceived tinnitus (De Ridder et al., 2014b), which has been shown to match the edge frequency of hearing loss (Moore, 2010; Sereda et al., 2015). In factor 1, most of the areas involved, such as the dorsal lateral prefrontal cortex, the connection between the rostral and bilateral pregenual anterior cingulate cortex, and the insula, form a part of the proposed distress network (De Ridder et al., 2014b; Schlee et al., 2009; Ueyama et al., 2013) mostly found in the beta bands. Consistently, factor 1 also correlated with the tinnitus-related depression. Constant salience of the deprived sensory input in tinnitus (De Ridder and Vanneste, 2014; Sedley et al., 2015) triggers the salience network resulting in “aversive auditory pain” (De Ridder et al., 2011a). Some of the areas identified in factor 3 form a part of this salience network (Menon, 2015; Schlee et al., 2009; Seeley et al., 2007; Song et al., 2015). Since these connections are encoded in the delta band, we can expect that the salience and the “aversive pain” encoded in this factor are broadcasted throughout the brain. Furthermore, our tinnitus model presents evidence of statistical validity well above chance level even when tested against physiologically similar pathologies, such as neuropathic pain (De Ridder et al., 2011a, 2014a; Folmer et al., 2001; Isaacson et al., 2003; Møller, 1997). This unique property of our model not only shows that functional connectivity serves a better predictor to discriminating similar pathologies compared to neural activity (Hu and Iannetti, 2016) but also strongly concludes that the reorganization of the tinnitus network is distinguishably disorder specific.
From the results of this study, we can conclude that the neural synchronization captured by the functional connectivity strength is evident in carrying specific information in specific oscillatory bands, indicative of the theory of “communication through coherence” (Fries, 2005, 2015). It is important to keep in mind that although the 66 connections are reported to fall into distinct factors, this decision is made depending on their weighted contribution to that particular factor, implying that their contribution to the other factors is only less weighted as opposed to completely absent. It is because of this weighted contribution that the groups of connections may be considered part of overlapping modules encoding specific behavioral symptoms. Furthermore, this overlap among factors is observed to be spatial (i.e., have common regions among different factors), temporal (i.e., the same two regions communicate in different frequency bands), or spatiotemporal (i.e., a combination of both spatial and temporal overlap). Overlapping community structure is shown to be an inherent property of complex networks (Gregory, 2007; Palla et al., 2005; Shen et al., 2009; Yang and Leskovec, 2014) since it facilitates processing of multimodal input at specific nodes in the network (Wu et al., 2011). This increases the cost-efficiency of information processing since the same node takes part in multiple processing units. Overlapping communities are then integrated by a small number of long-distance connections (Bassett and Bullmore, 2006; Sporns and Zwi, 2004; Watts and Strogatz, 1998) that broadcast the unified information throughout the network, contributing to the cost-efficiency of information transfer (Bullmore and Sporns, 2012; Latora and Marchiori, 2003). In young healthy brain networks, cognitive processes such as attention, memory, and language are proposed to be handled by cognitively segregated yet functionally overlapping modules (Mesulam, 1990). In the case of a neuropathology, we observe that the functional network undergoes a disorder-specific spatiotemporal overlap of groups of connections that are responsible for segregated encoding of the behavioral symptoms exclusive to the disorder. Such reorganization promotes an undesirable efficiency in the wiring of the disease network (Mohan et al., 2016c) and broadcasting of pathological symptoms throughout the brain.
The presence of functionally overlapping modules in the brain presents an efficient way of sending information through the physical anatomical connection between different regions. The concept of different frequency bands carrying unique packets of information through the same physical channel is termed multiplexing (Panzeri et al., 2010). Multiplexing allows selective processing of information and switching between different functional networks (Akam and Kullmann, 2014). This method allows different brain areas to engage in different networks (Akam and Kullmann, 2014) and can hence allows efficient processing of multimodal input at the same location. Although, sometimes, there may be only one physical connection between two brain areas, multiplexing allows different types of information to be transmitted to-and-fro the same line (Weinstein and Ebert, 1971). In this study, we not only observe the presence of spatial, temporal, and spatiotemporally overlapping functional networks but also a unique frequency-specific encoding of behavioral information. This alludes to the possibility of information being communicated between different regions by means of multiplexing. Multiplexing together with spatiotemporal overlap of functional modules may not only improve the efficiency of information transfer but also gives the brain more degrees of freedom to compensate for the disorder. The application of the concept of multiplexing to the brain is relatively new and hence opens avenues of investigation of efficient transmission of information between different brain regions.
Although this study provides a wealth of information about tinnitus organization, there are some limitations to the study that have to be addressed. Although the tinnitus and control groups have comparable average age ranges, they are not controlled for hearing loss. To avoid issues of statistical power in machine learning algorithms and to look at the general effects of tinnitus versus no tinnitus, a control for hearing loss was not applied. This study, however, paves way for future studies to look into groups that have a more stringent control on the inclusion criteria of the study. Second, although EEG source localization is gaining traction, it is still a statistical approximation of the sources of cortically generated potentials. Also, the method cannot reliably identify subcortical structures such as the thalamus, nucleus accumbens, amygdala, and parts of the basal ganglia that have also been shown to play an important role in tinnitus (Llinás et al., 2005; Maudoux et al., 2012; Rauschecker et al., 2010). It would be worthwhile to replicate this study using functional magnetic resonance imaging (fMRI) to confirm and add valuable information to the findings of this study. Despite these limitations, this study has the advantage of temporal resolution to look into the connections between different regions on different scales of cortical oscillations. Moreover, different connectome studies are allowing significant improvement in target selection for invasive and noninvasive brain stimulation therapies (Crossley et al., 2014), and our findings may allow an even more specific selection of target that can be tailored to the therapeutic needs of individual patients. Due to the integration of multimodal subnetworks, there has recently been a push for classifying patients on a symptom spectrum rather than the more standard categorical diagnoses to account for individual patient differences across a group of symptoms (Buckholtz and Meyer-Lindenberg, 2012). Coupled with recent investigations in connectome changes across the lifespan that could serve as a baseline (Cao et al., 2014), identification of separable subnetworks, along with their behavioral correlates and the quantification of alterations in connectivity strength from resting-state data, could become one of the most powerful and individualized biomarkers of neurological pathologies (Kaiser, 2013).
Conclusion
Our study shows a disorder-specific reorganization in the tinnitus network as behaviorally segregated, spatiotemporally overlapping subnetworks providing empirical evidence to the theoretical tinnitus model proposed by De Ridder and colleagues. The frequency-specific encoding of behavioral symptoms between overlapping functional modules suggests the presence of multiplexing in the brain, which allows for different types of information to be transmitted through the same anatomical connection. This type of reorganization can also be viewed as a compensation mechanism of the brain to multisymptom disorders presenting an undesired efficiency of the disease network. Specific to tinnitus, the exclusivity of the model and behavioral categorization of connections could potentially become a clinical tool that might objectively diagnose the disorder.
Footnotes
Author Disclosure Statement
No competing financial interests exist.