
Abstract
Transcranial magnetic stimulation (TMS) in combination with neuroimaging techniques allows to measure the effects of a direct perturbation of the brain. When coupled with high-density electroencephalography (TMS/hd-EEG), TMS pulses revealed electrophysiological signatures of different cortical modules in health and disease. However, the neural underpinnings of these signatures remain unclear. Here, by applying multimodal analyses of cortical response to TMS recordings and diffusion magnetic resonance imaging (dMRI) tractography, we investigated the relationship between functional and structural features of different cortical modules in a cohort of awake healthy volunteers. For each subject, we computed directed functional connectivity interactions between cortical areas from the source-reconstructed TMS/hd-EEG recordings and correlated them with the correspondent structural connectivity matrix extracted from dMRI tractography, in three different frequency bands (α, β, γ) and two sites of stimulation (left precuneus and left premotor). Each stimulated area appeared to mainly respond to TMS by being functionally elicited in specific frequency bands, that is, β for precuneus and γ for premotor. We also observed a temporary decrease in the whole-brain correlation between directed functional connectivity and structural connectivity after TMS in all frequency bands. Notably, when focusing on the stimulated areas only, we found that the structure–function correlation significantly increases over time in the premotor area controlateral to TMS. Our study points out the importance of taking into account the major role played by different cortical oscillations when investigating the mechanisms for integration and segregation of information in the human brain.
Introduction
T
The amount of information contained in the hd-EEG response to TMS appears to contain inner signatures of the functional organization in a brain network. Two recent studies (Ferrarelli et al., 2012; Rosanova et al., 2009) in healthy awake subjects showed that TMS can also induce EEG oscillations at different frequencies. The TMS pulse gives rise to different connected cortical regions in the brain, generating a complex EEG pattern composed of strong fluctuations at the “natural” frequency of the stimulated area. These oscillations are believed to reflect neurophysiological activity that is transiently elicited by the TMS pulse and possibly engaged through brain connections (Cona et al., 2011; Ferrarelli et al., 2012; Rosanova et al., 2009).
Recently, researchers have started to investigate how the TMS/hd-EEG perturbation might be constrained and shaped by brain structure, either by exploring the correlation between TMS-induced interhemispheric signal propagation and neuroanatomy (Groppa et al., 2013; Voineskos et al., 2010) or by improving the modeling of the TMS-induced electric field by using realistic neural geometry (Bortoletto et al., 2015; De Geeter et al., 2015). Besides, it has lately been shown that cortical networks derived from source EEG connectivity partially reflect both direct and indirect underlying white matter (WM) connectivity in a broad range of frequencies (Chu et al., 2015).
In this respect, the development of diffusion magnetic resonance imaging (dMRI) might add information on the structural architecture of the brain (Catani et al., 2002). The application of deterministic and probabilistic tractography methods allows for the spatial topography of the WM, which represents bundles of coherently organized and myelinated axons (Song et al., 2002). The output of tractography algorithms permits anatomically plausible visualization of WM pathways and has led to reliable quantification of structural connections between brain regions (i.e., the human connectome) (Bullmore and Sporns, 2009; Sporns et al., 2005).
The purpose of this proof-of-concept article is to investigate EEG changes of directed functional connectivity in the brain induced by TMS from both a functional and a structural perspective, using multimodal modeling of source-reconstructed TMS/hd-EEG recordings and dMRI tractography. The study of functional connectivity changes after the perturbation can possibly help in understanding the structure–function modulation caused by TMS (i.e., the extent to which TMS-induced EEG dynamics is constrained by WM pathways) and the specific frequency bands of the involved brain regions. Taking the aforementioned recent findings as a starting point, we here aim at assessing: (1) the role of the “natural frequencies” in the TMS-induced functional connectivity changes (Ferrarelli et al., 2012; Rosanova et al., 2009) and (2) the extent to which functional connectivity, as a consequence of the induced perturbation, is shaped by brain structure.
We will first present the processing pipelines for TMS-EEG and dMRI data. Second, the mathematical methodology for the evaluation of the directed functional connectivity between brain regions and its correlation with the structural connectome will be presented. Finally, results obtained in a cohort of healthy volunteers will be presented and discussed.
Materials and Methods
TMS/hd-EEG recordings: acquisition and preprocessing
TMS/hd-EEG data were acquired in 14 healthy awake adults (6 men, age range 23–37 years) as published elsewhere (Casali et al., 2010, 2013; Rosanova et al., 2012). In brief, subjects were sitting on a reclined chair with eyes open looking at a fixation point on a screen. All participants gave written informed consent and underwent clinical examinations to rule out any potential adverse effect of TMS.
The TMS/hd-EEG experimental procedure, approved by the Local Ethical Committee of the University of Liège, was performed by using a figure-of-eight coil driven by a mobile unit (eXimia TMS Stimulator; Nexstim Ltd.), targeting two cortical areas (left superior parietal and left premotor) for at least 200 trials. These areas were selected for the following reasons: (1) They are easily accessible and far from major head or facial muscles whose activation may affect EEG recordings; (2) previous TMS/EEG studies have been successfully performed in these areas during wakefulness (Casarotto et al., 2010; Massimini et al., 2005; Rosanova et al., 2009); and (3) because these areas are part of the fronto-parietal network and, thus, are structurally and functionally highly connected. The left superior parietal and left premotor targets were identified on the subject's 3D T1 brain scan and reached through the neuronavigation system (NBS; Nexstim Ltd.) by using a stereoscopic infrared tracking camera and reflective sensors on the subject's head and the stimulating coil.
Electrical brain activity was recorded by using a 60-channel TMS-compatible EEG amplifier (Nexstim eXimia; Nexstim Plc) with a sample-and-hold circuit, which prevents the amplifier from saturation (see Supplementary Data for details; Supplementary Data are available online at
Channels dominated by artifacts, such as 50 Hz noise, electrode movements, or strong TMS-induced artifact, were removed (maximum of 10 per session) and later interpolated. The session was discarded if the removed channels were clustered in such a way that interpolation would have been impossible or limited in accuracy. A minimum of 200 average trials was kept for further analyses. The percentage of excluded trials varied from subject to subject but was less than 10%. TMS trials containing noise, muscle activity, or eye movements were detected and rejected (Rosanova et al., 2012), and the session was performed until 200 accepted trials were recorded, or a maximum of 400 per site (never reached in this healthy subjects population). Independent component analysis (ICA) was also used as the last step in the signal preprocessing in some subjects, to remove artifacts from ocular movements or remaining 50 Hz noise, that could not be dealt with in the previous steps.
Out of the initial 14 subjects, we excluded 5 of them for the superior parietal target and 2 for the premotor target, because of a low signal-to-noise ratio of TMS/EEG-evoked responses [i.e., when the ratio between post-stimulus and pre-stimulus amplitude is below 1.4, as in Casali et al. (2010, 2013)]. EEG data were referenced by means of the reference electrode standardization technique (Liu et al., 2015; Yao, 2001), downsampled at half of the original sampling rate (from 725 to 362 Hz), and bandpass filtered (2 to 80 Hz).
Source reconstruction was performed as described by Casali and coworkers (2010, 2013). Conductive head volume was modeled according to the 3-spheres BERG method (Berg and Scherg, 1994) and constrained to the cerebral cortex that was modeled as a three-dimensional grid of 3004 fixed dipoles that were oriented normally to the cortical surface. This model was adapted to the anatomy of each subject by using the Statistical Parametric Mapping software package (SPM8, freely available at
To summarize significant functional measures over anatomically and/or functionally identifiable brain regions, the time courses of the 3004 reconstructed sources were then averaged into the specific 90 cortical and subcortical areas of the automated anatomical labeling (AAL) (Tzourio-Mazoyer et al., 2002) parcellation (Fig. 1), according to their position on the cortical mesh (Casali et al., 2010). Specifically, the AAL template was first registered onto the cortical mesh, allowing for a mapping between the 3004 fixed dipoles and the regions of interest (ROIs) of the template. Then, the time series of the dipoles falling in the same AAL brain region were averaged together.
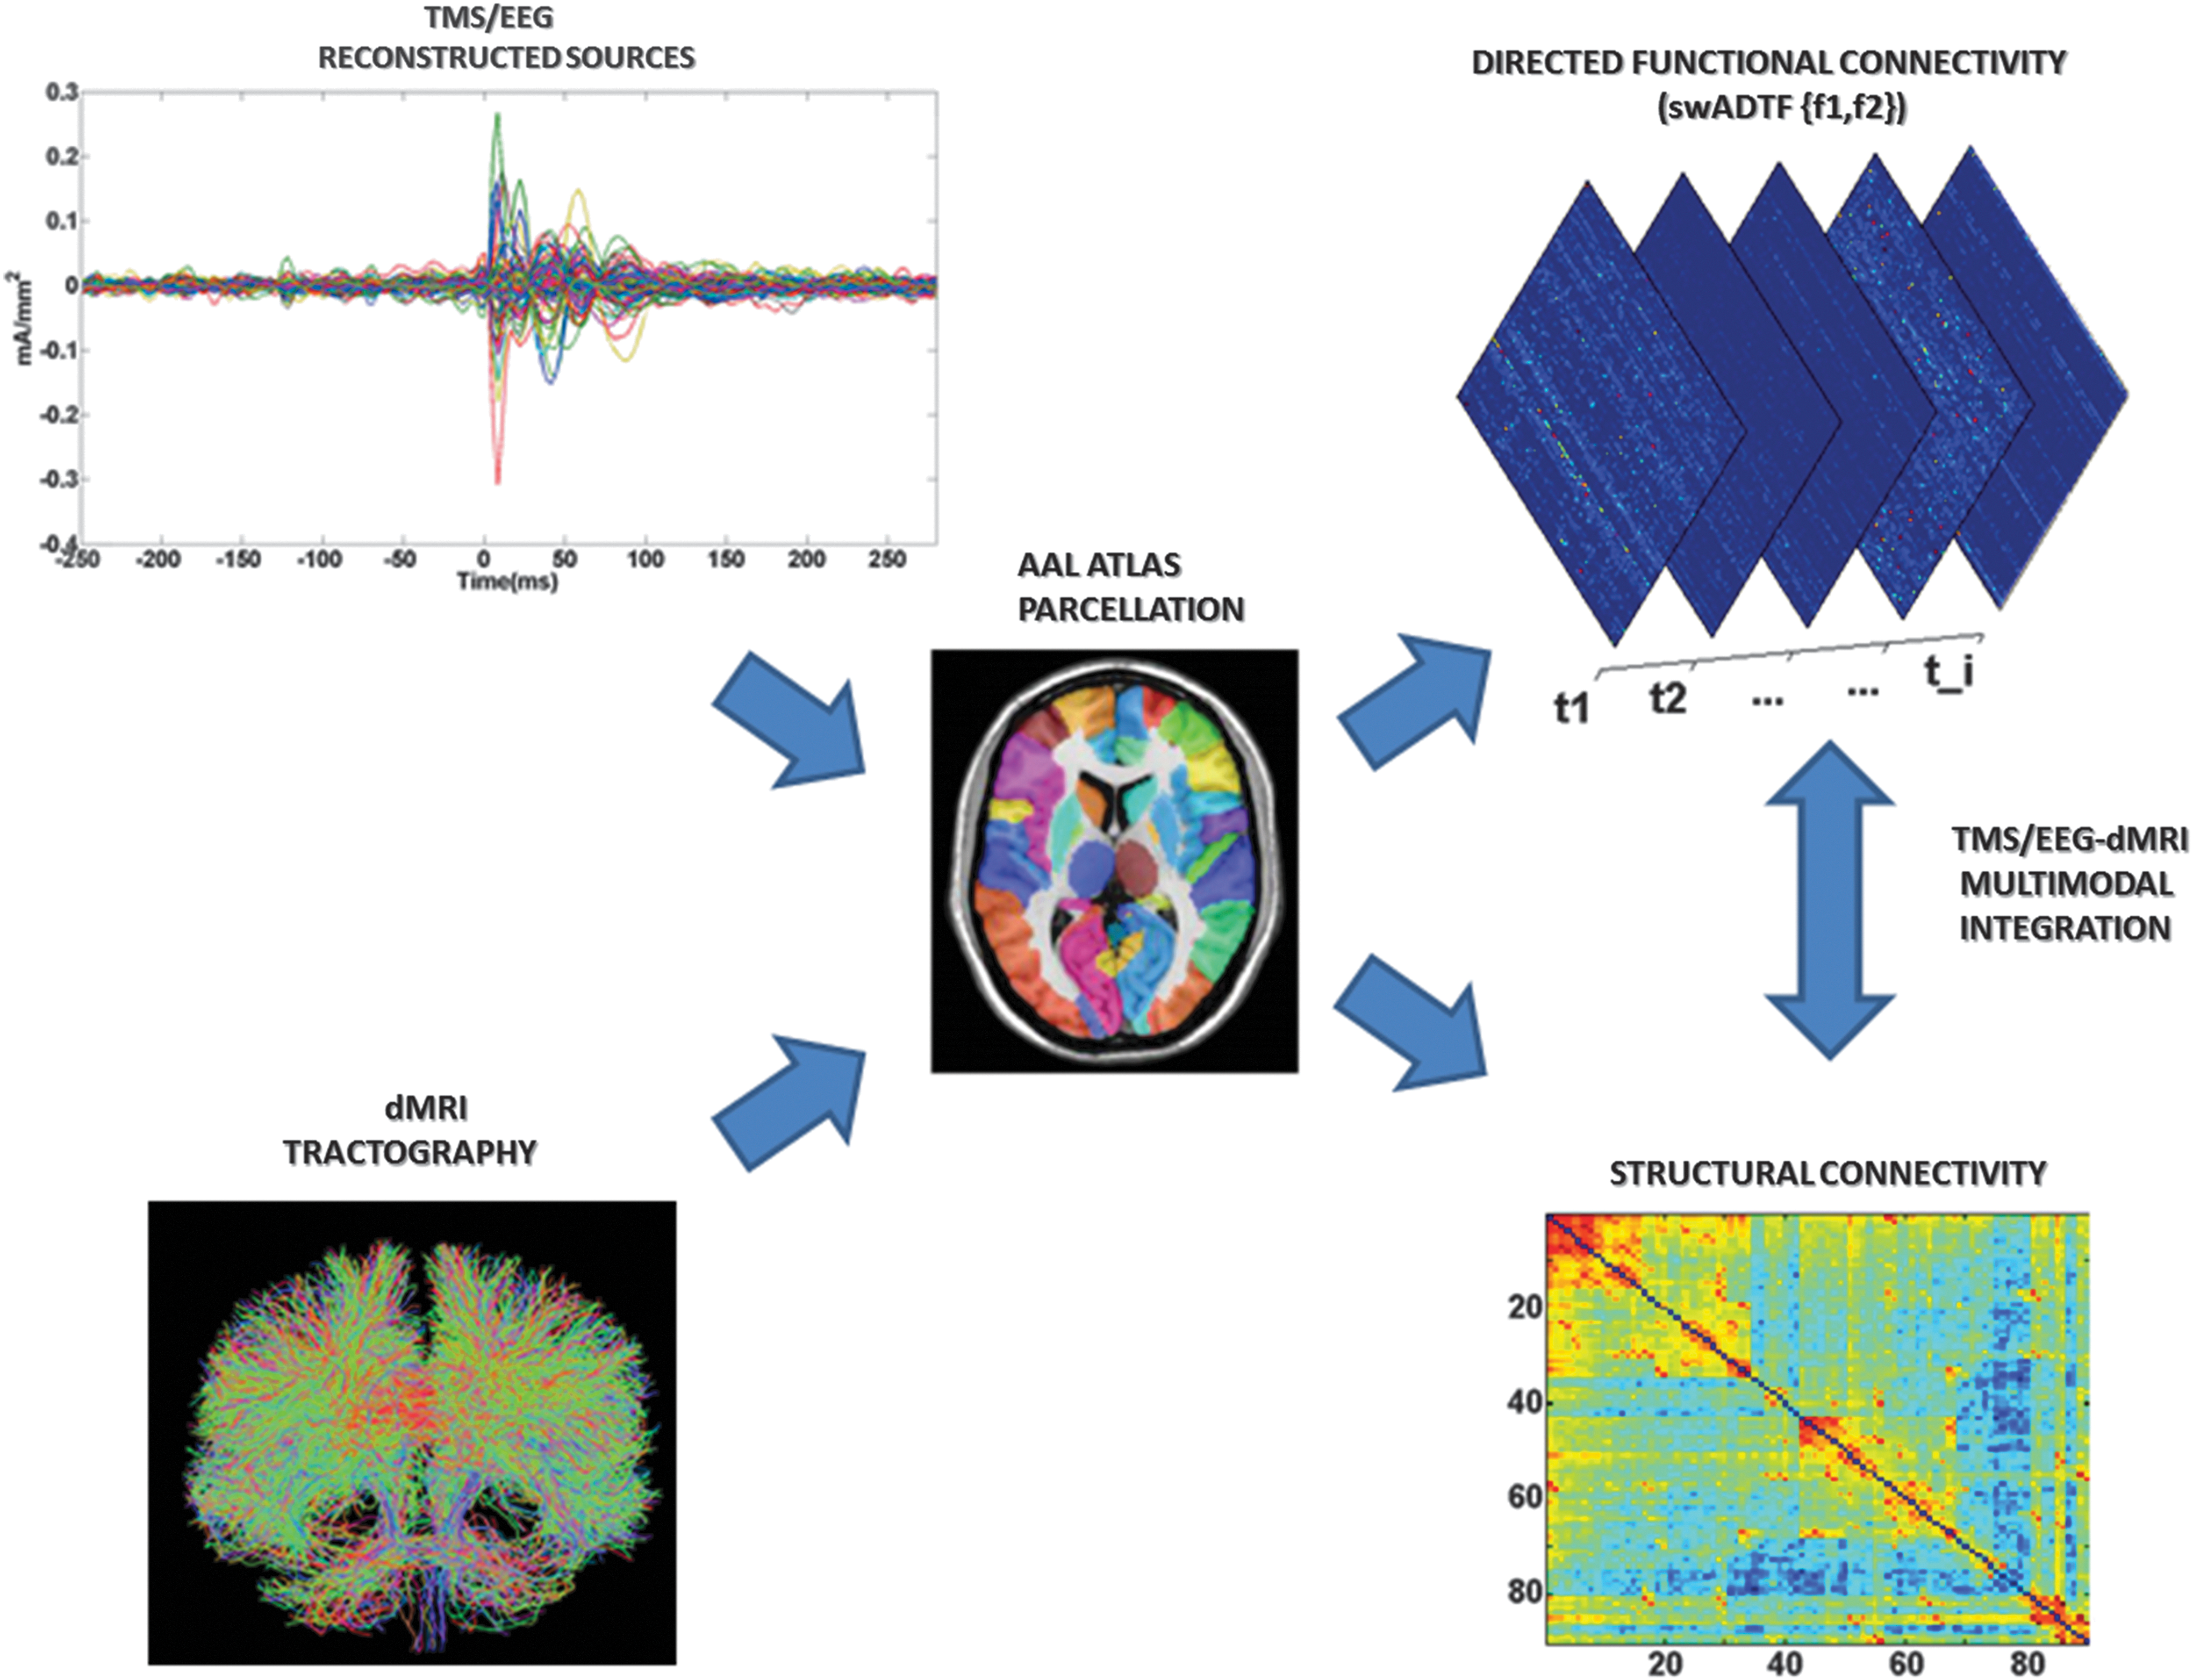
Flowchart of TMS/EEG-dMRI modeling. Up: The time courses of the 3004 reconstructed dipoles were averaged into the parcels of the AAL atlas (Tzourio-Mazoyer et al., 2002), consisting of 90 unique brain regions (cerebellar regions were excluded from the analysis). The 90 time courses obtained were modeled by using swADTF (Van Mierlo et al., 2011, 2013). swADTF returns the causal interactions between the cortical regions (
dMRI data: acquisition and preprocessing
A series of diffusion-weighted magnetic resonance images (dwi) of brain anatomy were acquired in each participant by using a Siemens Trio Magnetom 3 Tesla system (Siemens Trio, University Hospital of Liege, Belgium). dwi images were acquired at a b-value of 1000 sec/mm2 by using 64 encoding gradients that were uniformly distributed in space by an electrostatic repulsion approach (Jones et al., 1999). Voxels had dimensions of 1.8 × 1.8 × 3.3 mm3, and volumes were acquired in 45 transverse slices by using a 128 × 128 voxel matrix. A single T1-weighted 3D magnetization-prepared rapid gradient echo sequence (MPRAGE) image, with an isotropic resolution of 1 mm3, was also acquired for each subject.
Diffusion volumes were analyzed by using typical preprocessing steps in dMRI (Caeyenberghs et al., 2012; Zalesky et al., 2014). Eddy current correction for each participant was achieved by using FDT, v2.0, the diffusion toolkit within FSL 5.0 (FMRIB Software Library;
dMRI data: registration of the anatomical image and atlas parcellation
We segmented each subject's T1-weighted image into whole-brain WM, gray matter (GM), and cerebrospinal fluid masks by using FAST, a part of FSL (FMRIB Software Library v 5.0). The corresponding WM mask image was registered without resampling to the relevant dwi series (Smith et al., 2004). Next, the AAL atlas was first registered to the T1 space by using linear (FSL flirt) and non-linear warping (FSL FNIRT) to achieve the best registration into each subject's space. Then, the single-subject AAL template was finally registered without resampling to the dwi space by using the affine transform resulting from the WM registration. This transformation matrix was also applied to the T1-derived GM mask, which was used as a termination mask for the tractography analysis.
dMRI data: tractography and connectome construction
The fiber response model was estimated for each subject from the high b-value (b = 1000 sec/mm2) dwi. A mask of single-fiber voxels was extracted from the thresholded and eroded FA images (Tournier et al., 2004, 2008). Using non-negativity constrained spherical deconvolution, fiber orientation distribution (FOD) functions were obtained at each voxel by using the MRTRIX3 package (J-D Tournier; Brain Research Institute,
Probabilistic tractography was performed by using randomly placed seeds within subject-specific WM masks, registered as mentioned in the latter. Streamline tracking settings were as follows: number of tracks = 10 million, FOD magnitude cutoff for terminating tracks = 0.1, minimum track length = 5 mm, maximum track length = 200 mm, minimum radius of curvature = 1 mm, tracking algorithm step size = 0.5 mm. Streamlines were terminated when they extended out of the WM-GM mask interface, or could not progress along a direction with an FOD magnitude or a curvature radius higher than the minimum cutoffs.
The streamlines obtained were mapped to the relevant nodes defined by the AAL parcellation registered in the subject's dwi space, using MRTRIX3 (Tournier et al., 2012). Each streamline termination was assigned to the nearest GM parcel within a 2 mm search radius. The resulting connectome was finally examined by determining the connection density (number of streamlines per unit surface) between any two regions of the AAL template, as described by Caeyenberghs and coworkers (2012) (Fig. 1). This correction was needed to account for the variable size of the cortical ROIs of the AAL template (Hagmann et al., 2008).
TMS/hd-EEG-directed functional connectivity estimation: spectrum-weighted adaptive-directed transfer function
We evaluated directed functional connectivity between the 90 EEG reconstructed brain signals (see TMS/hd-EEG Recordings: Acquisition and Preprocessing section) by using an extension of a data-driven technique based on Granger causality (Granger, 1969). According to Granger causality, if a signal x1
“Granger causes” (or “G-causes”) a signal x2
, then past values of x1
should contain information that helps to predict x2
above and beyond the information contained in past values of x2
alone (Granger, 1969). This statistical concept can be mathematically modeled as a multivariate autoregressive model (MVAR):
where, for a number K of signals, xn is the matrix containing the K signals at time n, en is a matrix containing the uncorrelated white noise at time n, p is the model order (i.e., how many past values are taken into account), and Am is the K × K coefficient matrix for delay m.
The directed transfer function (DTF) is a measure based on Granger causality to analyze the propagation of activity between multiple signals in the frequency domain, by means of a multivariate model of spectral coefficients (Kaminski and Blinowska, 1991):
The information on the interactions between signals (i.e., brain regions, in our case) in the frequency domain is now contained in the K × K matrix H (the equivalent of A in Eq. 1 in the frequency domain), also known as the transfer matrix of the model, which contains information on the directed interactions between signals xi and xj at frequency f.
These models assume stationary signals as input. To cope with the non-stationary nature of most natural signals, an extension of the DTF, the adaptive DTF (ADTF) (Arnold et al., 1998; Astolfi et al., 2008; Wilke et al., 2008), was proposed. To adapt the autoregressive model to non-stationary signals, the coefficients of the autoregressive model (i.e., matrix H in Eq. 2) were allowed to vary in time, by means of a Kalman filtering procedure (Arnold et al., 1998) [the interested reader may refer to Van Mierlo et al. (2011, 2013) for details on the methodology].
This time-variant multivariate autoregressive (TVAR) model with time-varying parameters has been successfully used for connectivity modeling of epileptic intracranial EEG data (Van Mierlo et al., 2011, 2013). To take into account the non-stationary nature of the TMS pulse in our EEG source-reconstructed signals, here, we adopted the spectrum-weighted version of the ADTF (swADTF) (Van Mierlo et al., 2011, 2013):
where
Each term
The swADTF allows us to investigate directional interactions between all the signals at a predefined frequency band over time. The measure weights all outgoing directed functional connectivity present in the terms
TMS/EEG-dMRI multimodal integration: outdegree computation and statistical assessment
We computed directed functional connectivity (swADTF) on the brain network defined by the anatomical atlas (AAL) reconstructed sources for each subject. A detailed discussion on the implementation and the setup of the parameters can be found as described by Van Mierlo and coworkers (2011).
The swADTF was calculated in three frequency bands:
To track modulations of directed functional connectivity due to TMS, we considered 3 different non-overlapping windows of 300 msec: a “baseline,” pre-stimulus, extended from −300 to 0 msec before the TMS pulse; a “post-stimulus,” after the TMS pulse, which captures the dynamics from 20 to 320 msec after the pulse (the first 20 msec were discarded to minimize the effect of possible artifacts occurring at the time of stimulation) (Rogasch et al., 2013; Rosanova et al., 2009); and a “late post-stimulus,” from 320 to 620 msec after the stimulation.
We obtained the mean global outgoing flow from a region j before and after the stimulation by averaging the swADTF time courses in each of the three time windows and by summing the average amount of directed connectivity transferred from j to each node of the network. In network terms, this quantity is called Outdegree. In our case, for each frequency band and window (i.e., baseline or post-stimulus):
where
To detect significant group changes in the Outdegree before and after the stimulation, a two-sample t-test of the post-stimulus Outdegree against the correspondent baseline Outdegree was performed in each region. Post-stimulus Outdegree values were considered significant at
Furthermore, to investigate how the integration and segregation of the functional brain network change after the TMS pulse, we evaluated some key topological properties of the directed functional connectivity networks, before and after the TMS pulse. The following network measures were computed: clustering coefficient, betweenness centrality, rich club coefficient, and global efficiency (Bullmore and Sporns, 2009; Sporns, 2011), by using the Brain Connectivity Toolbox (
Finally, for each subject, the structural degree of a node j (SCdegree) was simply calculated from the structural connectivity matrix S by summing over its columns.
Structure–function correlations and statistical assessment
The dynamic interaction between regions modeled by swADTF can be represented as a series of time-varying directed connectivity matrices (Fig. 1). In each frequency band, dynamic spatial correlation was defined as the mean row-by-row Pearson's correlation at each time point between each subject's directed functional connectivity matrix and the correspondent structural connectivity matrix. The
Results
The significant differences (Table 1) in directed functional connectivity, between baseline and post-stimulus window, across cortical regions after TMS perturbation are illustrated by projecting the Outdegree onto the anatomical template (Fig. 2). In the first 300 msec after the pulse, the two sites of stimulation have significant Outdegree peaks at different frequency bands. However, we did not find any significant differences between Outdegree values of baseline and late post-stimulus windows.

Directed functional connectivity across cortical regions after TMS. First three rows: Snapshot of differences between baseline and post-TMS stimulus directed functional connectivity (i.e., Outdegree) at
Top increment for each site of stimulation is highlighted in bold.
AAL, automated anatomical labeling; FB, frequency band; TMS, transcranial magnetic stimulation.
In particular, the superior parietal cortex has a maximum of directed functional connectivity in the
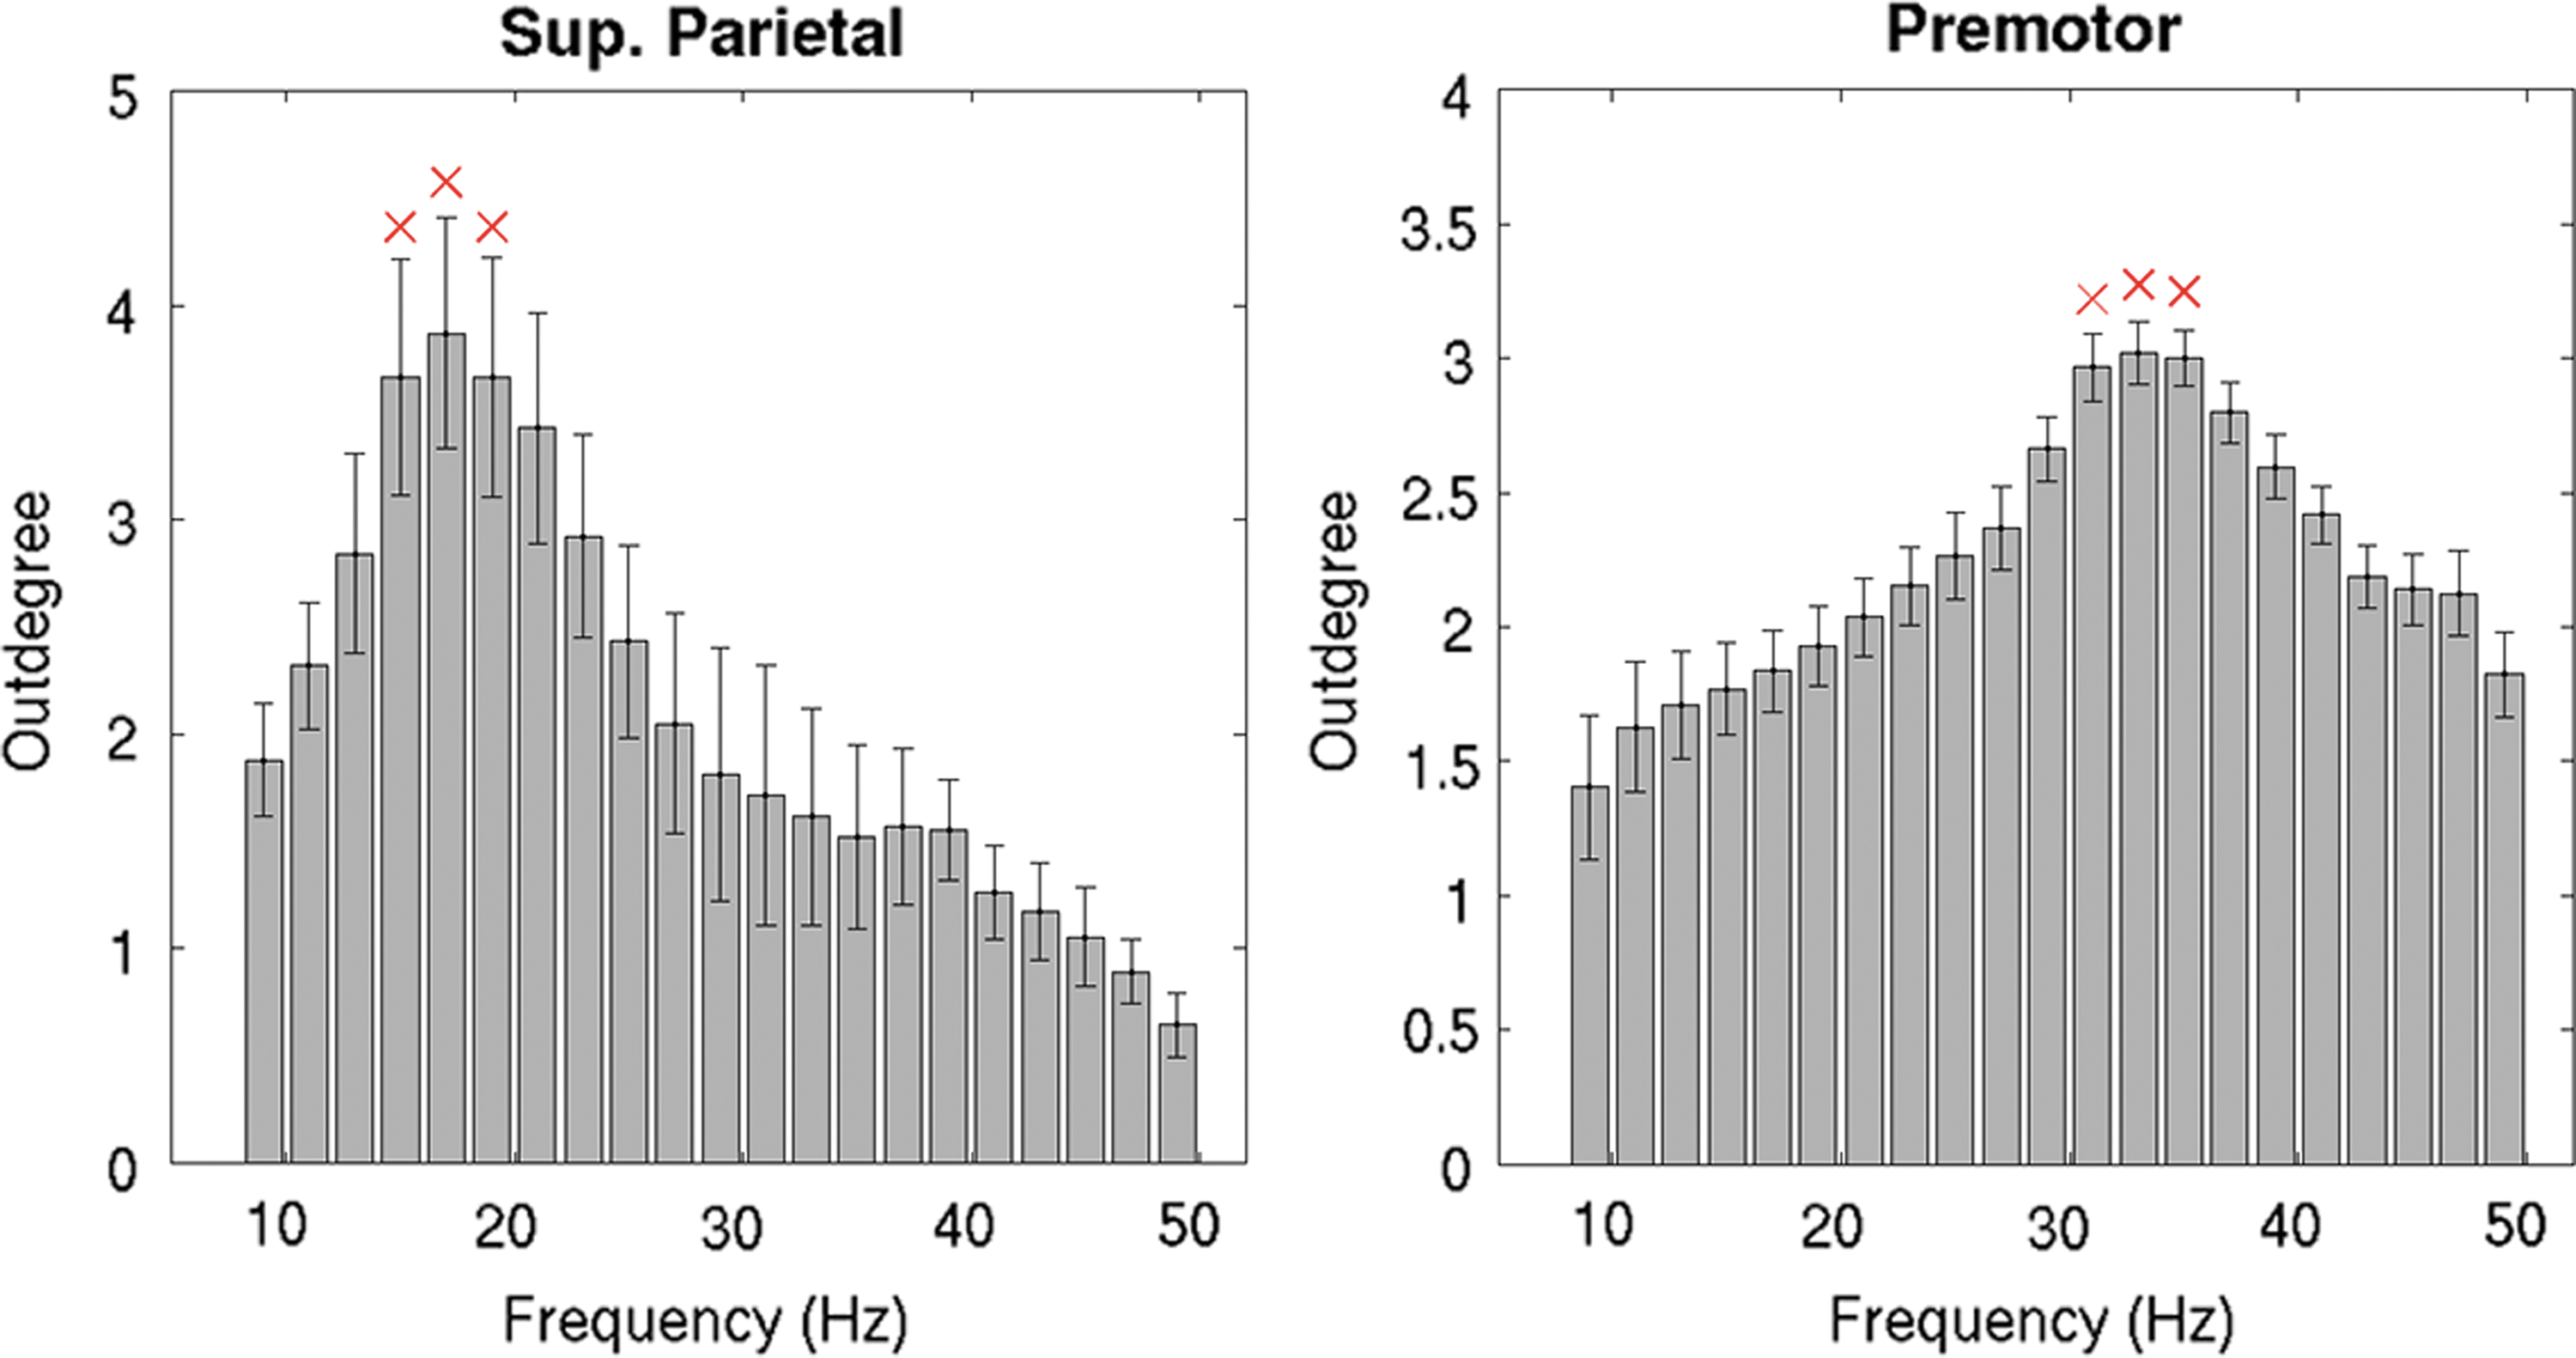
Peaks of directed functional connectivity for the two stimulated regions. Barplots show Outdegree values for the two sites of stimulation (left, sup parietal; right, premotor) when using finer frequency ranges (2 Hz steps). Errorbars indicate standard error over subjects. The red crosses on the top of the bars indicate that the Outdegree value is significantly different for the two target regions (double-sided t-test,
The peaks in directed functional connectivity at different frequencies in the areas depicted in Figure 2 confirm the hypothesis that different brain regions might be usually tuned to oscillate at a characteristic rate (i.e., natural frequency) (Ferrarelli et al., 2012; Rosanova et al., 2009). Furthermore, despite the fast and chaotic functional response generated by the TMS pulse in the brain network, the cortical regions significantly recruited by TMS seem to maintain peaks of functional activation at the specific natural frequency consistently over time (Fig. 4 and Supplementary Videos S1 and S2). Notably, the connectivity peaks of the premotor site follow the specific differences in the power spectrum, whereas the peaks of directed functional connectivity in the superior parietal site appear to be more connectivity specific (Supplementary Fig. S1).
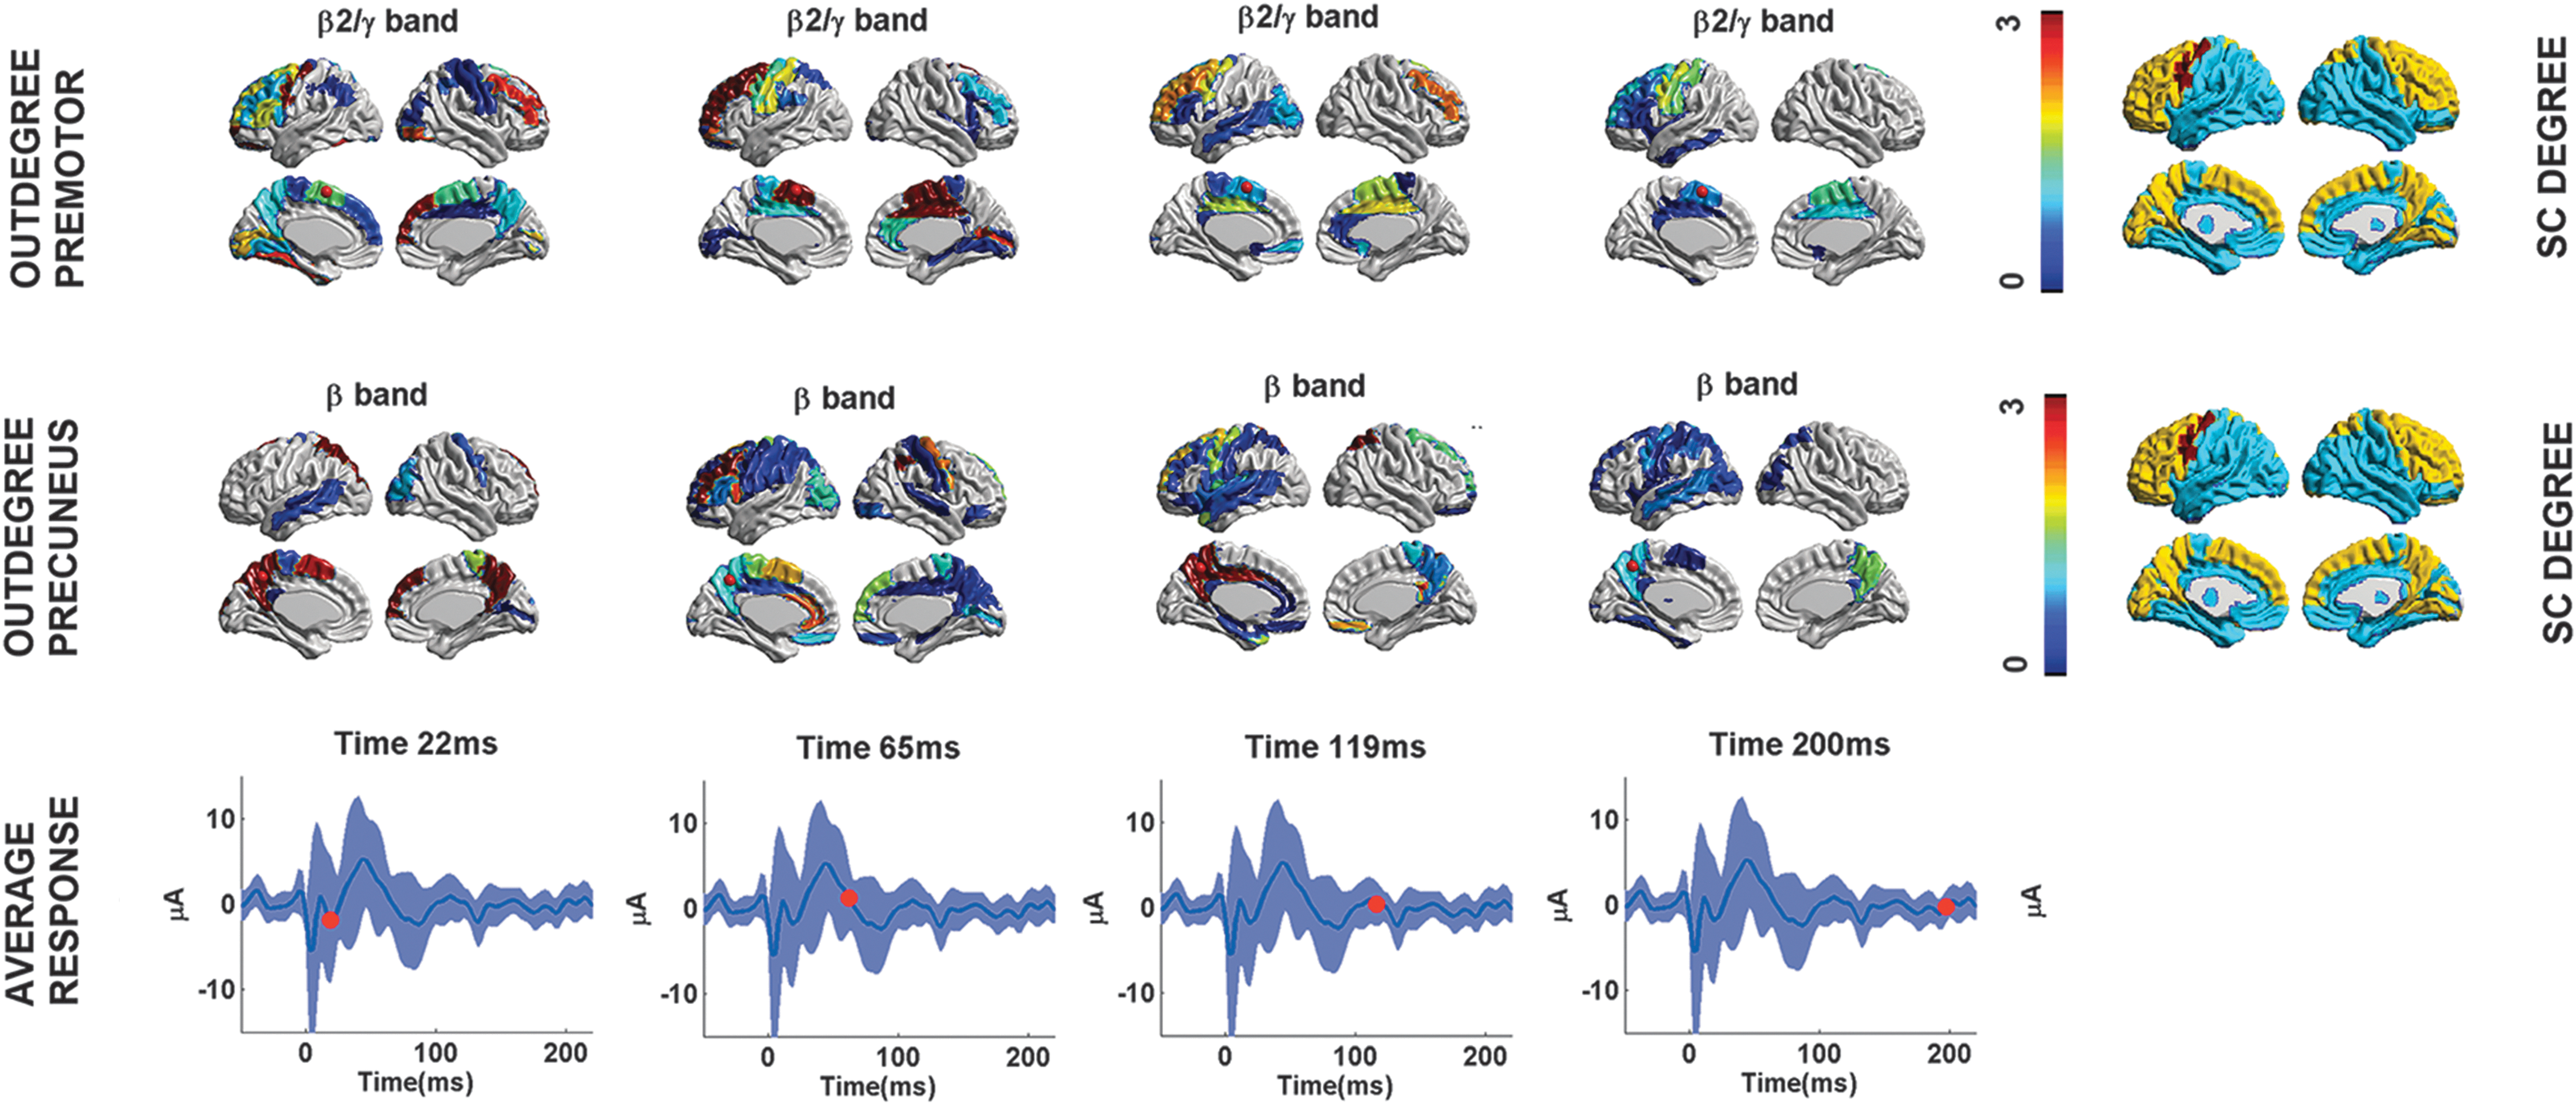
Flow of directed functional connectivity over time. Selected frames from Supplementary Videos S1 and S2, of the functional connectivity across cortical regions, for both sites of stimulation (top two rows), after the TMS pulse. The temporal changes of the Outdegree for the natural frequency of the site of stimulation (i.e.,
It is also worth mentioning that none of the network measures computed on the directed functional connectivity matrices before and after the TMS pulse survived to the statistical significance threshold (
The dynamic spatial correlation between the directed functional connectivity (swADTF) and the connectome, for the two different sites of stimulation (i.e., left superior parietal and left premotor) and for each of the three chosen frequency bands (i.e.,

Time-varying spatial correlation between directed functional connectivity and structural connectivity. Each plot shows the average over subjects of the dynamic spatial correlation between the directed functional connectivity (swADTF) matrices and the SC in function of time (blue line, standard error in shaded blue), for the three different frequency bands (
In fact, assuming that each of the 90 AAL cortical regions responds to TMS by oscillating at its peculiar natural frequency, the emergence of this complex between-band interaction might generate a consequent deflection in the within-band structure–function correlation (Fig. 5). This effect might be due to the region-specific variability in the intensity and the duration of the cortical response to TMS at the different natural frequencies, but it might also depend on the degree to which each recruited region is structurally connected to the rest of the network.
To further investigate whether the structural connectivity profiles of the stimulated regions influence subsequent TMS-evoked connectivity, we evaluated the local dynamic spatial correlation between the directed functional connectivity (swADTF) for the targeted cortical regions and the connectome, for both sites of stimulation (Fig. 6). Notably, the structure–function correlation significantly increases over time in the right premotor cortex after TMS, when its natural frequency band (i.e.,

Time-varying spatial correlation for the stimulated cortical regions. Each row shows the average over subjects of the dynamic spatial correlation (blue and green line, standard error in shaded blue and green) between the directed functional connectivity (swADTF) and SC for the AAL ROIs comprising left and right premotor areas (stimulated and controlateral, i.e., ST SMA, CL SMA) and the left and right superior parietal areas (stimulated and controlateral, i.e., ST PCC, CL PCC), respectively, for the three different frequency bands (i.e.,
Discussion
In this work, we studied for the first time the interplay between directed functional connectivity computed from TMS-reconstructed EEG sources and the connectome extracted from whole-brain dMRI tractography in a cohort of healthy volunteers. We aimed at assessing: (1) whether natural frequencies of the stimulated areas play a role in the TMS-induced functional connectivity changes and (2) to what extent these functional connectivity changes are shaped by brain structure. Later follows a detailed discussion of the findings. First, this work confirms the hypothesis that different rhythms in the brain emerge after TMS, which was the first aim of our study. This dynamic interaction at different natural frequencies seems to reflect intrinsic properties of cortical regions, and the way those are interconnected (Cona et al., 2011; Rosanova et al., 2009). Previous studies revealed that distant areas, when activated by TMS, responded with oscillations closer to their own “natural” frequency (Ferrarelli et al., 2012; Rosanova et al., 2009). Our analysis on peaks of significant changes in directed functional connectivity at different frequency bands corroborated the hypothesis that TMS evokes dominant oscillations in different cortical areas at a characteristic rate. These findings are in line with previous studies (Ferrarelli et al., 2012; Rosanova et al., 2009), where the authors showed that TMS on healthy awake subjects consistently evokes EEG oscillations with dominant frequencies that depend on the site of stimulation. In particular, when stimulated, the superior parietal cortex was shown to respond to TMS in the
Each stimulated area appeared to mainly respond to the stimulation by being functionally elicited in specific “natural” frequency bands, that is,
Second, our analysis permitted us to evaluate the dynamic interactions between directed functional connectivity and anatomical connectivity, before and after TMS, which was the second aim of our study.
We compared structural and directed functional connectivity at the whole network level for different EEG bands (
We observed a temporary decrease in the correlation between directed connectivity and structural connectivity after TMS. Assuming that each region in the brain reacts to the perturbation at a characteristic operating frequency, the decrease in structure–function correlation in each frequency (Fig. 5) might be caused by the complex pattern of between-frequency interactions rising after TMS in the whole-brain network. The return to baseline might then depend on two things: One is the temporal duration of the functional activation of the elicited area; the second is the extent to which it is related to its structural connectivity pattern.
These considerations brought us to explore the link between the “natural” frequency response of the stimulated cortical areas and their structural architecture. Interestingly, for the premotor cortex that is controlateral to the stimulation site, the correlation between directed functional connectivity at the natural frequency and structural connections increases after the stimulation and reveals a long-lasting effect over time (Fig. 6). The fact that this effect is not reproduced for the superior parietal cortex might be due to a number of reasons. First, it has been shown that this area has lower cortical excitability than the premotor cortex, and, thus, it is more difficult to trigger (Ferrarelli et al., 2012; Rosanova et al., 2009). Second, it is possible that the different frequency responses in each cortical area might reflect different anatomical backgrounds.
Indeed, recent studies have reported that there is a strong correlation between cytoarchitecture and anatomical and functional connectivity in cats, macaques, and humans (Beul et al., 2015; Scholtens et al., 2014), with the superior parietal area showing both a different cytoarchitecture and a different connectivity architecture than supplementary motor regions (van den Heuvel et al., 2015). This might explain why the functional activation at specific resonant frequencies is differently related to the structural coupling (i.e., the amount of tracts connecting them) depending on the anatomical architecture of the specific brain region.
Limitations
Given the intrinsic limitations of the EEG in terms of spatial resolution, it is important to stress that the patterns of connectivity detected by TMS/hd-EEG are necessarily coarse. Even though TEPs are characterized by a good test-retest reproducibility (Lioumis et al., 2009), the inter-individual reproducibility of the outgoing flow of information could be improved by a better computation of the electric field induced by the TMS. More advanced models (boundary, or finite, element models) could improve the accuracy of the source localization (Wagner et al., 2009).
Another limitation of our study concerns the relatively small sample size and the inter-subject variability at both the TMS/hd-EEG response and the tractography level. However, in this article, we investigated for the first time through TMS-EEG and dwi the relationship between structural and directed functional connectivity patterns in healthy subjects. The number of subjects included in the study, coupled with appropriate statistics, can definitely be of use for future research and hypothesis. Furthermore, the functional and structural connectivity profiles obtained from our cohort appear to be stable across subjects (Supplementary Fig. S4).
In addition, it has been shown that there are many brain regions with a complex structural architecture, which are also referred to as “crossing fibers” (Jeurissen et al., 2011; Tournier et al., 2012). In this context, tractography approaches based on more advanced diffusion models (Jeurissen et al., 2011), or on more refined anatomical constraints (Smith et al., 2012) may provide more accurate anatomical connectivity patterns of brain networks. Therefore, our approach works best for studying large-scale interactions than fine-scale, local dynamics.
Finally, a b-value of 1000
Conclusions
In conclusion, the findings of this study suggest that the way brain structure and function interact after TMS perturbation follows a rather complex and multifaceted dynamic. Notably, when looking at the whole-brain network level, the structure–function relationship is largely reduced after TMS within each frequency band (Fig. 5). Nonetheless, when looking at the local responses of the target regions, we showed that the way directed functional connectivity changes due to TMS might depend on both the frequency at which the cortical module is elicited by TMS and the structural architecture of the specific stimulated cortical region (Fig. 6). Future studies should validate this hypothesis by exploring natural frequency profiles in different sites of stimulation and/or by evaluating structure–function correlations at natural peak frequencies in brain regions other than the stimulated ones. An interesting follow-up of this study would be to investigate how the TMS pulse changes the functional connectivity profile of different stimulated sites over shorter time periods, that is, by using shorter time windows or a sliding window approach. In conclusion, our multimodal whole-brain approach gives new insights on how TMS interferes with the brain network in healthy controls. More specifically, our study points out the importance of taking into account the major role played by different cortical oscillations when investigating the mechanisms for integration and segregation of information in the human brain (Casali et al., 2013). Another interesting follow-up of this study would, indeed, be to look at differences in structure–function interactions, either when the cognitive function is pharmacologically modulated (i.e., anesthesia) or after pathology, damage, or disruption in structural connections (i.e., coma and disorders of consciousness).
Footnotes
Acknowledgments
The authors thank Timo Roine, Erik Ziegler, Gianluca Frasso, Andrea Piarulli, and Georgos Antonopoulos for their insightful discussion and comments on this article. They also thank Marie-Aurelie Bruno, Athena Demertzi, Audrey Vanhaudenhuyse, and Melanie Boly for help in acquiring the data. This research was supported by the Wallonia-Brussels Federation of Concerted Research Action (ARC), Human Brain Project, Fonds National de la Recherche Scientifique de Belgique (FNRS), Belgian Science Policy (CEREBNET, BELSPO), McDonnell Foundation, European Space Agency, Mind Science Foundation, University Hospital, and University of Liège, Human Brain Project (EU-H2020-fetflagship-hbp-sga1-ga720270) and Luminous project (EU-H2020-fetopen-ga686764). O.B. is a research fellow, O.G. is a post-doctoral fellow, and S.L. is a research director at FNRS.
Author Disclosure Statement
No competing financial interests exist.
References
Supplementary Material
Please find the following supplemental material available below.
For Open Access articles published under a Creative Commons License, all supplemental material carries the same license as the article it is associated with.
For non-Open Access articles published, all supplemental material carries a non-exclusive license, and permission requests for re-use of supplemental material or any part of supplemental material shall be sent directly to the copyright owner as specified in the copyright notice associated with the article.