
Abstract
Network analysis based on graph theory depicts the brain as a complex network that allows inspection of overall brain connectivity pattern and calculation of quantifiable network metrics. To date, large-scale network analysis has not been applied to resting-state functional networks in complete spinal cord injury (SCI) patients. To characterize modular reorganization of whole brain into constituent nodes and compare network metrics between SCI and control subjects, fifteen subjects with chronic complete cervical SCI and 15 neurologically intact controls were scanned. The data were preprocessed followed by parcellation of the brain into 116 regions of interest (ROI). Correlation analysis was performed between every ROI pair to construct connectivity matrices and ROIs were categorized into distinct modules. Subsequently, local efficiency (LE) and global efficiency (GE) network metrics were calculated at incremental cost thresholds. The application of a modularity algorithm organized the whole-brain resting-state functional network of the SCI and the control subjects into nine and seven modules, respectively. The individual modules differed across groups in terms of the number and the composition of constituent nodes. LE demonstrated statistically significant decrease at multiple cost levels in SCI subjects. GE did not differ significantly between the two groups. The demonstration of modular architecture in both groups highlights the applicability of large-scale network analysis in studying complex brain networks. Comparing modules across groups revealed differences in number and membership of constituent nodes, indicating modular reorganization due to neural plasticity.
Introduction
S
The imbalance in conduction of neural impulses is transmitted throughout the neuraxis with attendant structural and functional ramifications (Ding et al., 2005; Freund et al., 2011; Jurkiewicz et al., 2006, 2007; Levy et al., 1990; Lundell et al., 2011; Moore et al., 2000; Oudega and Perez, 2012; Perani et al., 2001; Petersen et al., 2012; Topka et al., 1991; Wrigley et al., 2009a). Atrophic changes in anatomical structures have been observed at spinal and supraspinal levels after SCI (Freund et al., 2011; Wrigley et al., 2009b). Functional imaging of cortical regions has demonstrated reorganization of motor areas during movement (Jurkiewicz et al., 2006; Lundell et al., 2011). However, task-based functional imaging can be difficult in determining the effects of SCI on brain reorganization on account of variations in parameters like type of motor tasks, time since SCI, and location and severity of SCI (Kokotilo et al., 2009). More recently, reorganization in the sensorimotor cortex has been demonstrated in the resting state, which might be advantageous since it does not require an activity paradigm (Min et al., 2015).
The assessment of resting-state functional magnetic resonance imaging (rs-fMRI) data is predominantly done using analytic methods (seed-based and independent component analysis) that permit limited visualization of connectivity among regions (Biswal et al., 1995; van de Ven et al., 2004; Wang et al., 2010; Zang et al., 2007). In contrast, large-scale network analysis allows the inspection of overall connectivity patterns among all elements (regions of interest [ROI]) of the brain (Wang et al., 2010). This analysis, modeled on graph theory, defines a complex network as a collection of nodes and edge from which graph metrics are calculated to investigate different network attributes (Rubinov and Sporns, 2010; Sporns et al., 2005; Wang et al., 2010). The utility of graph-based techniques has been proven by an increasing number of rs-fMRI studies to probe potential mechanisms involved in normal and diseased brain (Buckner et al., 2009; Fair et al., 2007, 2008, 2009; Gong et al., 2010; He et al., 2008; Liu et al., 2008; Micheloyannis et al., 2009; Stam et al., 2007; Supekar et al., 2009; van den Heuvel et al., 2008b).
Over the past decade, fMRI has been increasingly used to characterize connectivity changes in the cerebral cortex following trauma to the spinal cord (Cramer et al., 2005; Curt et al., 2002; Endo et al., 2007; Freund et al., 2011; Henderson et al., 2011; Hou et al., 2014; Rao et al., 2013; Wrigley et al., 2009a). The time since injury to the cord in these studies has varied from immediate period following SCI to chronic injury spanning over years. The studies have included mixed groups comprising patients from each American Spinal Injury Association (ASIA) grade. The results from these studies have subsequently provided a multitude of findings affecting cortical and subcortical findings. However, to our knowledge, no study has explored the reorganization pattern of brain networks with rs-fMRI in patients with complete SCI using a graph theory. In this analysis, the global network architecture of the brain in SCI has been studied using graph theory by parcellation of the whole brain into nodes and comparing graph theoretical metrics between the SCI patients and controls.
Materials and Methods
Study participants
Fifteen SCI subjects and an equal number of control subjects underwent imaging after signing written consent forms. A chart review was used to select SCI subjects with ASIA Impairment Scale A (AIS A), corresponding to complete CSI (Tables 1 and 2). The diseased subjects suffered from cervical SCI with injury duration of more than 2 years and no associated traumatic brain injury. The inclusion criteria and exclusion criteria are detailed below (Table 3). The control subjects were age-matched healthy volunteers with intact motor and sensory systems. All procedures were approved by the Institutional Review Boards.
Unless otherwise indicated, data are presented as mean ± standard deviation.
MVA, motor vehicle accident; MC, motorcycle crash.
ASIA, American Spinal Injury Association.
Data acquisition
The imaging datasets for study participants were acquired using a whole-body 3.0 T Signa global efficiency (GE) scanner (Waukesha, Wisconsin). During the imaging session, participants were placed in the supine position on the gantry of the scanner. To reduce motion-related artifact, the head was positioned in a midline location in a purpose-built multichannel head and neck coil and stabilized by clamps. During resting-state image acquisitions, no cognitive tasks were performed and study participants were instructed to close their eyes, stay awake, and relax inside the scanner.
Sagittal resting-state functional imaging data sets were collected in 8 min using single-shot gradient echo-echo planar imaging (EPI) pulse sequence with TR = 2000 msec, TE = 25 msec, field of view = 24 × 24 cm2, image matrix = 64 × 64, bandwidth = 250 kHz, slice thickness = 3.5 mm with no gaps, and image and repetitions (time points) = 300. A total of 8640 images were obtained with voxel resolution of 3.75 × 3.75 × 4 mm3.
Methodology of graph theory-based approach
The evaluation of resting-state functional networks of the whole brain using graph theory is outlined below (Bullmore and Sporns, 2009). First, nodes or ROI were defined based on an anatomical atlas (Tzourio-Mazoyer et al., 2002). Next, resting-state time series extracted from individual nodes were cross-correlated with other nodes. This created an association matrix based on the strength of connection between each pair of nodes. Then a range of thresholds was applied to create undirected and unweighted binary matrices. Finally, modular organization of whole-brain network and efficiency metrics were compared across subject groups (Bullmore and Sporns, 2009).
Preprocessing of imaging data
The preprocessing of raw imaging data was carried out using Analysis of Functional Neuroimaging (AFNI) (
Individual subbricks of the functional imaging data sets (EPI) were concatenated into one big 3D+ time dataset (AFNI command, 3dTcat). The first five time points of each time series were discarded to allow for T1 equilibration. Signal spike artifacts were removed from the time series data by data interpolation from neighboring time points (AFNI command, 3dDespike) (Cox and Jesmanowicz, 1999). Rigid body correction was performed for head motion along translational (x, y, and z) and rotational parameters (roll, pitch, and yaw). Volume registration of the R-fMRI data was used to estimate and regress these motion parameters (AFNI command, 3dvolreg and 3dDeconvolve). Detrending was done for the removal of mean, linear, and quadratic trends (AFNI command, 3dDetrend). Statistical parametric mapping (SPM) software was used to normalize the data of each individual subject to the Montreal Neurological Institute (MNI) space. Standard SPM white matter (WM) and cerebrospinal fluid (CSF) mask in the MNI space were used to obtain the averaged WM and CSF time courses. They were regressed to remove their impact on the resting-state signal. Band pass filter was applied to restrict the data in the frequency band of 0.015–0.1 Hz. Global signal negative index was used to determine that global regression was not required for this analysis (Chen et al., 2011).
Large-scale network analysis
The connectivity analysis involved the segmentation of the whole brain into 116 anatomically defined ROI based on Automated Anatomical Labeling (AAL) atlas in MNI space with 90 of the 116 ROIs belonging to the cerebrum and 26 belonging to the cerebellum (Tzourio-Mazoyer et al., 2002). For a given ROI, the time course from each constituent voxel was extracted and averaged to derive averaged time series for that ROI.
The ROIs chosen for the analysis amounted to 6670 theoretically possible edges in a fully connected network as per notation N × (N – 1)/2, where N denoted the number of ROIs. The network studied was undirected since the directionality of the edge between two ROIs was not taken into account. The temporal association between any pair of ROIs was calculated using Pearson correlation coefficient (r). The coefficient measured the strength of each edge (association) between ROIs i and j as the cross-correlation coefficient between the time series of ROI(i) and ROI(j). The r values obtained were represented in the form of association matrix. The matrices obtained for all the subjects were averaged across both the groups to generate group association matrices.
Brain connectivity toolbox (BCT) was used for the computation of modular reorganization and metrics related to network efficiency (
A range of cost thresholds (0.01–0.5) was applied to the association matrix for each subject with cost defined as the ratio of number of edges to the total number of possible edges. Multiple values were used due to lack of consensus on the appropriate thresholding value. The LE value for the network metric in question was acquired after averaging the value obtained from individual ROIs. The GE and averaged LE values from individual subjects were compared for statistical significance (p < 0.05) using t-test. For the calculation of modules using the modularity algorithm, the cross-correlation matrix was thresholder to 15% of the total number of possible connections, and module maps were generated.
Results
Modular organization
The modularity algorithm determined the separation of the whole-brain network into different modules at the threshold value of 15% of all possible connections. The SCI group assembled into modular structures similar to the control group (Fig. 1). Tracking each of these modules to deconstruct the constituent ROIs showed that SCI patients and controls differed in terms of the number of modules and the member ROIs in each of these modules. These differences in the modular organization of whole-brain network show that SCI and controls group assemble into nine and seven modules, respectively. The module organization pattern of SCI and control subjects is graphically illustrated in Figure 2. Module 1 of the control group was shown to deconstruct into three separate modules in the SCI group (Modules 1, 2, and 8). Upon further inspection, the breakdown of member ROIs in Module 1 in the control group revealed that ROIs of the cerebellar hemisphere functionally connected with the sensorimotor cortex were split into Module 1 and 2 in the SCI group. The left lobule VI and V of cerebellar hemisphere formed part of Module 2 in the SCI group. Module 2 of the control group was disrupted into three modules in the SCI patient population (Modules 1, 2, and 4). Module 3 of the controls was also divided into three distinct modules in the SCI group (Modules 2, 3, and 4) with Module 2 containing left and right primary sensorimotor ROIs, Module 3 containing insula, middle cingulate gyrus (MCC), supplementary motor areas (SMA), and some areas of temporal cortex, and Module 4 containing ROIs from inferior frontal gyrus and temporal cortex. Thus, primary sensorimotor ROIs were part of Module 2 in the SCI group, whereas the secondary association ROIs were included in Module 3. Module 4 of the control group was separated into six modules in the SCI group (Modules 3, 4, 5, 6, 7, and 9) with Module 3 containing left and right anterior cingulate gyrus (ACC), Module 4 containing ROIs from frontal gyri, posterior cingulate gyrus, and some areas of parietal and temporal cortex, and Module 5 containing limbic structures namely left and right hippocampus, parahippocampal gyrus, and amygdala. The remaining modules (Modules 6, 7, and 9) in the SCI group that were split from Module 4 of the control group each contained a single ROI. The member ROIs of Module 5 in the control groups comprising left and right putamen, caudate, globus pallidus, and thalamus were also part of Module 5 in the SCI group. In addition, Module 5 in the SCI group comprised limbic structures and right olfactory cortex. Table 4 lists the detailed breakdown of member ROIs contained in all the individual modules of both the study groups.
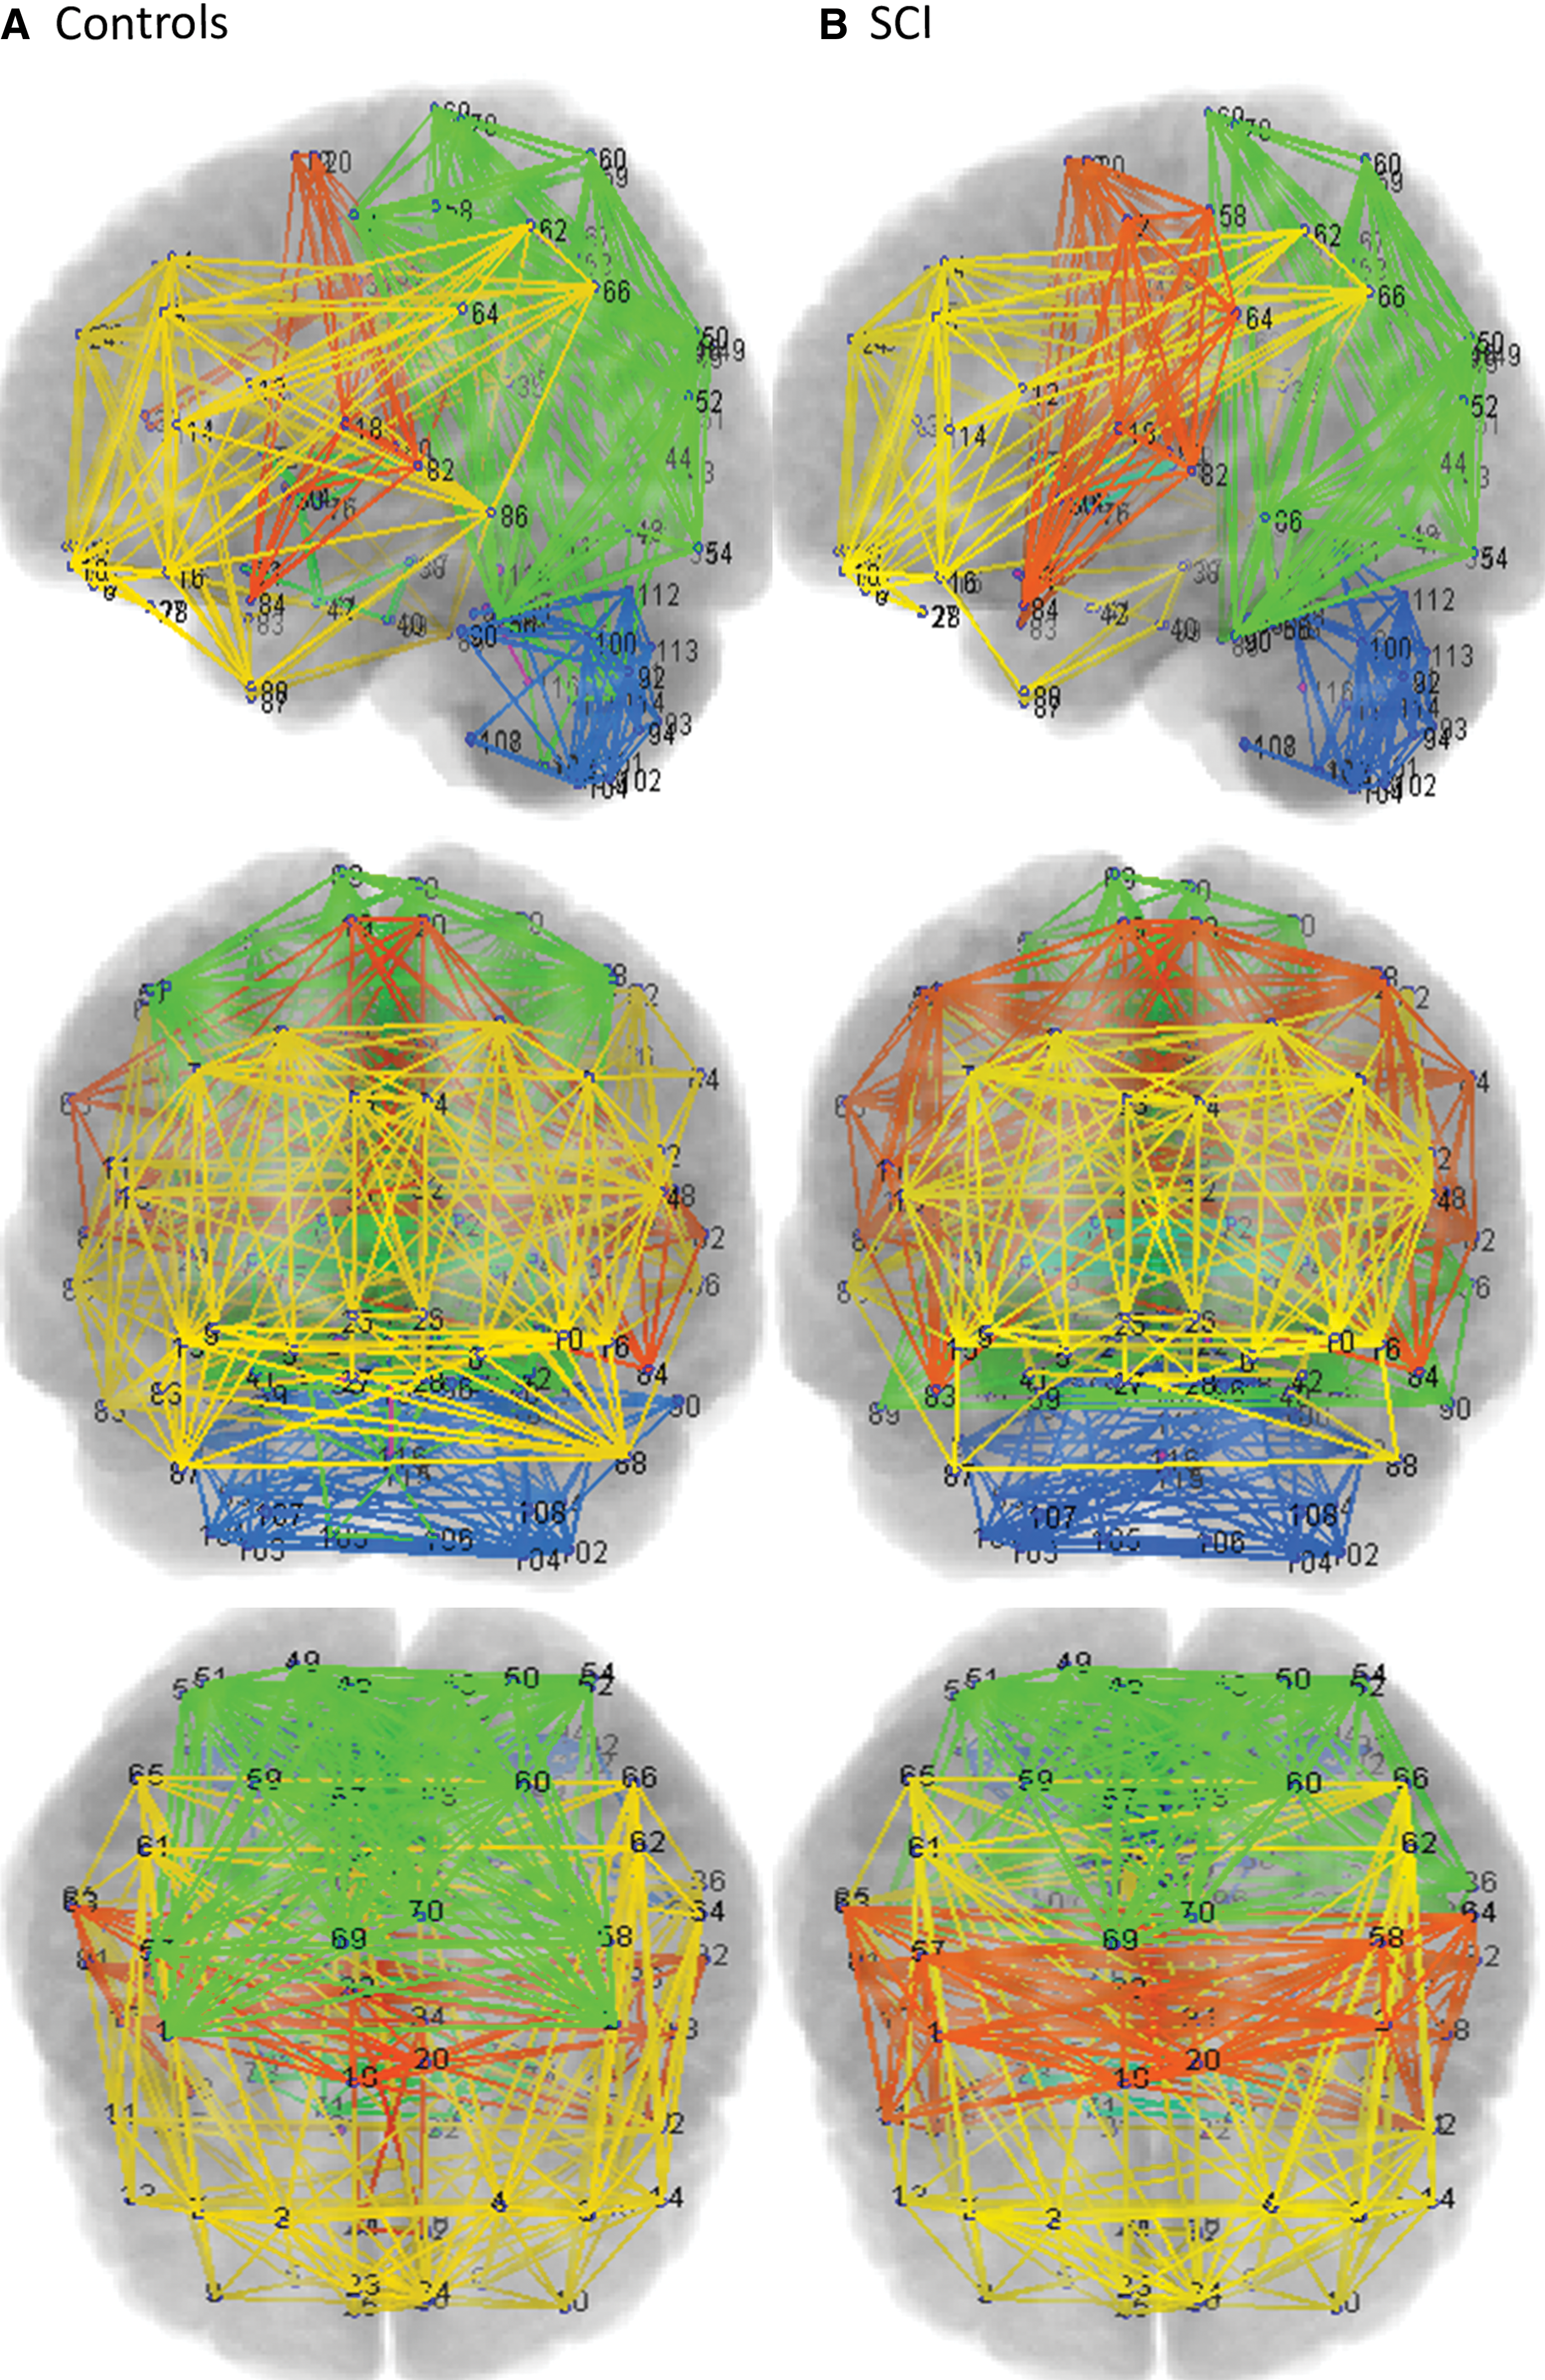
Network view showing modular organization of whole-brain resting-state functional networks in control

The reorganization of modules based upon correlation coefficient is depicted in the connectivity matrix for control and SCI subjects. The numbers mentioned in the middle correspond to individual modules for each group. Red arrow and red connection lines show the reorganization pattern from controls subjects to SCI subjects. The thickness of each line represents the number of members. Color images available online at
ROI, regions of interest; SCI, spinal cord injury.
Network metrics
The quantitative values for network metrics of LE and GE were determined using the efficiency algorithm present in the BCT, which used Matlab to compute the output. LE provides a measure of the attribute of segregation within the brain network. Group comparison of LE for whole-brain network revealed decreased values of LE in SCI subjects compared to controls. The decrease in LE was present at cost thresholds of 0.09 and 0.1 (Fig. 3). GE was compared across groups as a measure of network integration. Comparing the value of GE averaged across groups showed no significant differences for the whole-brain functional network at any of the cost thresholds.
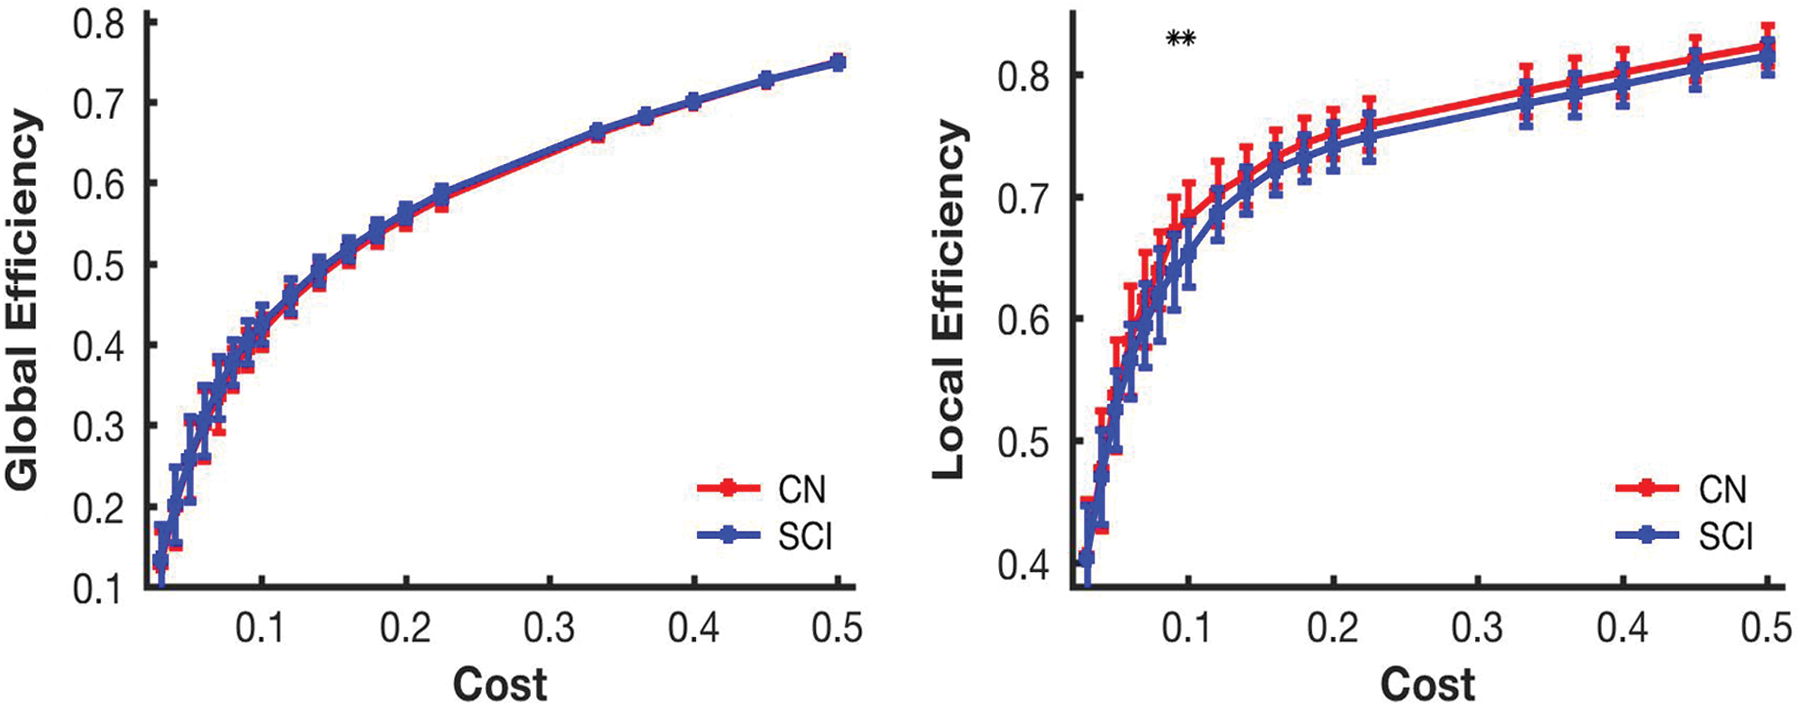
Comparison of network metrics based on graph theoretical approach between controls and SCI subjects at different cost thresholds. Red and blue lines designate control and SCI subject groups, respectively, and ** denotes the threshold values with statistical significance between the groups. Error bars in the figures represent the standard error. Color images available online at
Discussion
Prior studies utilizing large-scale network analysis have characterized the arrangement of complex brain networks as modular (Achard and Bullmore, 2007; Chen et al., 2008; Cordes et al., 2002; Ferrarini et al., 2009; Gong et al., 2009; Hagmann et al., 2008; He et al., 2007, 2009; Meunier et al., 2009; Salvador et al., 2005; Zhou et al., 2006). To our knowledge, this is the first study to use large-scale network analysis to characterize the modular organization of whole-brain resting-state functional connectivity in patients with complete SCI. The presence of qualitative and quantitative differences in modular organization and network metrics, respectively, highlights the applicability of graph theoretical approach to evaluate the whole-brain network architecture in SCI patients (Min et al., 2015; Rubinov and Sporns, 2010; Sporns, 2013). The demonstration of modular organization in the diseased group highlights the preserved ability of brain architecture to assemble into subnetworks in SCI. The AAL atlas, modeled on an anatomical atlas of the brain, was chosen based on previous work, showing influence of underlying structural connectivity on functional connectivity (Damoiseaux and Greicius, 2009; Greicius et al., 2009; Hagmann et al., 2008; Honey et al., 2007, 2009, 2010; Koch et al., 2002; Skudlarski et al., 2008; Sporns et al., 2005; van den Heuvel et al., 2008a, 2009). We included 116 ROIs since cerebellum is an important structure associated with balance and posture and warrants consideration in SCI patients, while evaluating large-scale network connectivity.
Module 1 in the control group comprised cerebellar ROIs. Existing literature mentions existence of resting-state functional connections between the sensorimotor cortex and the cerebellar hemispheres (Stoodley et al., 2012). The cerebellum upon receiving inputs from the cortex provides output that modifies the execution of voluntary movements. The disruption of these circuits might occur following distal SCI. The division of the member ROIs of Module 1 into three separate modules in the SCI group highlights altered functional connections in the cerebellum following SCI, could be due to the ensuing imbalance in the neural communication between the cortex and the cerebellum. Furthermore, all the ROIs corresponding to the anterior cerebellum formed part of Module 1 in the controls, but were split into separate modules in the SCI group. The anterior cerebellum contains ROIs (lobes III–V) that are affected following disruption of motor inputs from cerebrum (Stoodley and Schmahmann, 2009; Stoodley et al., 2012). This might cause alterations to the activation patterns in the anterior cerebellum and lead distribution of the ROIs belonging to the anterior cerebellum into separate modules. In addition, the somatomotor representation in the cerebellum is not symmetrical and might account to some extent for the differences observed in the composition of the modules between the two study groups.
In the field of SCI research, previous studies have utilized functional imaging to show activation of secondary areas of cortex during imagined or actual movements in patients with injury to the spinal cord. There has also been documentation of enlargement or encroachment of cortical areas with intact connections to the spinal cord into the cortical regions deprived of input from caudal structures (Cramer et al., 2005; Curt et al., 2002; Endo et al., 2007; Freund et al., 2011; Henderson et al., 2011; Hou et al., 2014; Jurkiewicz et al., 2007; Mikulis et al., 2002; Rao et al., 2013; Wrigley et al., 2009a). The ROIs comprising the primary sensorimotor and the secondary motor areas of the cerebral cortex were contained in Module 3 of the controls, whereas the ROIs corresponding to the primary sensorimotor regions namely left and right precentral and postcentral gyrus formed part of a separate module (Module 2) in SCI patients. This separation of ROIs points to altered functional connectivity between the primary and the secondary sensorimotor areas, which could be due to the loss of inputs from the extremities causing a decrease in the spontaneous functional activity in primary sensorimotor cortixal areas (Aguilar et al., 2010; Yague et al., 2014). Module 2 in the SCI group also contained ROIs from the cerebellum that had been part of Module 1 in the control group. The membership of Module 2 in SCI patients of ROIs comprising regions of primary sensorimotor cortex and areas of the cerebellum associated with motor actions might be due to the formation of altered functional connectivity patterns between primary sensorimotor cortex and cerebellum. Furthermore, Module 3 in the SCI group contained SMA, ACC, and MCC, and insular cortex among other ROIs. The insular cortex has connections with the primary somatosensory areas (S1) in healthy individuals. The loss of inputs from the spinal cord to the primary sensory cortex might disrupt the functional connectivity between the insula and the S1.
The attributes of segregation and integration that relate to information processing were studied based on previous research demonstrating the brain as a complex network (Sporns et al., 2004; Tononi et al., 1994). Segregation provides insight into the connectivity among different ROIs at the local or regional level and integration measures connectivity between different modules or subcommunities at the global or whole-brain level (Sporns, 2013). The idea behind studying these attributes was to characterize how information was being processed at the local and global level (Achard and Bullmore, 2007). Functional segregation refers to neuronal processing carried out among functionally related regions arranged within modules. This arrangement of connections tends to generate statistical dependence of neural signals within modules and statistical independence between modules, thereby promoting functional segregation (Sporns, 2013). In this study, decreased LE was found in the whole-brain network at multiple cost levels in SCI patients. The decrease in regional connectedness might be due to a reduction in connections among ROIs belonging to a specific module following loss in innervation from downstream neural structures. Previous work done by our group using seed-based analysis had showed decreased resting-state connectivity between individual sensorimotor ROIs and other brain regions, in line with our finding of decreased LE in the whole-brain network (Oni-Orisan et al., 2016). The network attribute of integration highlights the efficiency of information processing at the global level. An integrated network is essential for passing information among different brain regions to perform different tasks. The comparison of GE across groups in our analysis did not result in any significant findings. This could be due to the fact that, since underlying structural architecture remains intact following distal central nervous system insults like SCI, internetwork functional connections between different networks in the brain are increased in the injured group to account for the loss of intranetwork connections. Furthermore, in adjusting to this new normal of decreased LE internetwork connections might expend greater resources in an effort to maintain the earlier levels of connectivity, resulting in less-efficient processing in the functional networks of the injured group (Geerligs et al., 2015).
The presence of different number of modules and the composition of ROIs in various modules between the controls and the SCI group have significant implications for SCI research. These results highlight the inherent modular architecture of spontaneous brain functional networks in SCI patients and provide insights into the topological organization of the observed alterations in the large-scale resting-state functional connectivity (Grefkes and Fink, 2011; Hou et al., 2014). This coupled with the fact that resting-state functional connectivity is associated with by task-induced functional connectivity as well as underlying structural connectivity hints at potential alterations to task-based and anatomic connectivity networks (Freund et al., 2013; Henderson et al., 2011; Honey et al., 2009; Wrigley et al., 2009a). In addition, detailed inspection of module membership demonstrates a hub nodule, like anterior cingulate cortex being part of a different module in the SCI group compared to controls, speaks of the possibility of further analysis aimed at studying these so-called network hubs in more detail to assess their impact on the functional and structural connectivity in SCI patients. Furthermore, the information concerning the differences of network topology between different study groups can prove useful in the generation of useful models of disease progression. The findings in this study, although based on a subset of SCI patients classified as having complete injury, can be extended across a broad spectrum of SCI severity, and the network changes observed could have the potential to contribute in providing an analytical framework for biomarker development.
A number of factors warrant further consideration to improve our understanding of the changes to the whole-brain functional connectivity in SCI. The study focused on chronic complete cervical SCI patients. However, the severity and the level of injury might have an impact on the progression of connectivity alterations at supraspinal levels after SCI (Freund et al., 2011). Neuropathic pain experienced in SCI involves the thalamus serving as an important conduit, which warrants further exploration (Wrigley et al., 2009b). This study focuses on the network reorganization pattern in the brain. The changes induced in the spinal cord after SCI need to be studied to account for their contribution to the cortical findings. AAL template was used to map functional ROIs based on anatomical locations, which could lead to incorrect defining of functional regions. Comparative studies using alternate classification schemes might serve to improve upon these findings. The data for handedness have not been included, but additional analysis should factor that data since handedness could potentially influence resting-state connectivity. In continuation with our research centered around SCI, some of the above-mentioned concerns would be addressed to add to the present understanding of the modifications to large-scale network organization patterns.
Conclusion
In summary, with use of large-scale network analysis, we demonstrated that resting-state functional networks underwent modular reorganization in SCI. The modules differed in terms of the number and membership of constituent ROIs, which is indicative of neural plasticity in the brain. The finding of decreased LE in SCI suggests reduced efficiency of information processing in specialized regions of brain. GE, however, did not differ significantly, possibly due to minimal impact of distant SCI on interregional connectivity among brain regions. The changes seen in modular organization and localized information processing demonstrate the applicability of graph theory in studying the resting-state functional networks in neurosurgical patient populations.
Footnotes
Author Disclosure Statement
No competing financial interests exist.