
Abstract
Recent electrophysiological studies have suggested surges in electrical correlates of consciousness (i.e., elevated gamma power and connectivity) after cardiac arrest (CA). This study examines electrocorticogram (ECoG) activity and coherence of the dying brain during asphyxial CA. Male Wistar rats (n = 16) were induced with isoflurane anesthesia, which was washed out before asphyxial CA. Mean phase coherence and ECoG power were compared during different stages of the asphyxial period to assess potential neural correlates of consciousness. After asphyxia, the ECoG progressed through four distinct stages (asphyxial stages 1–4 [AS1-4]), including a transient period of near-electrocerebral silence lasting several seconds (AS3). Electrocerebral silence (AS4) occurred within 1 min of the start of asphyxia, and pulseless electrical activity followed the start of AS4 by 1–2 min. AS3 was linked to a significant increase in frontal coherence between the left and right motor cortices (p < 0.05), with no corresponding increase in ECoG power. AS3 was also associated with a significant posterior shift of ECoG power, favoring the visual cortices (p < 0.05). Although the ECoG during AS3 appears visually flat or silent when viewed with standard clinical settings, our study suggests that this period of transient near-electrocerebral silence contains distinctive neural activity. Specifically, the burst in frontal coherence and posterior shift of ECoG power that we find during this period immediately preceding CA may be a neural correlate of conscious processing.
Introduction
S
Interestingly, between 4% and 23% of cardiac arrest (CA) survivors report having a near-death experience (NDE) (Cant et al., 2012), and 46% report awareness while near death but do not meet NDE criteria according to the Greyson NDE scale (i.e., ≥7) (Parnia et al., 2014). Recent studies in animals and humans provide evidence to suggest that the brain may indeed be capable of consciousness after CA. Global surges in electroencephalogram (EEG) gamma activity and functional and effective connectivity were found after abrupt asystole CA in rodents (Borjigin et al., 2013). In addition, a surge of the bispectral index or patient state index was seen after CA in hospitalized patients on end-of-life care (Chawla et al., 2009; Goodman et al., 2009). Electrophysiological studies on CA, therefore, may potentially serve as a model to explore the mechanisms underlying reports of consciousness while near death.
Earlier EEG studies characterized level of consciousness with classical measures such as relative delta power, median frequency, and spectral edge frequency (Drummond et al., 1991; Plourde and Picton, 1990; Schwender et al., 1996). Unconscious states generally exhibit a shift in EEG activity away from faster frequencies, characterized by a decrease in relative alpha, beta, and gamma power; median frequency; and spectral edge frequency (Kortelainen et al., 2012; Medeiros et al., 2009; Nieuwenhuijs et al., 2002; Theilen et al., 2002). Cognitive tasks, however, have been associated with localized increases in these fast oscillations, specifically beta and gamma power (Crone et al., 2001, 2006; Fitzgibbon et al., 2004; Güntekin et al., 2013).
Although individual brain regions have important functions, consciousness and cognition are also thought to arise from integration of information among regions (Tononi et al., 1994). Functional connectivity, a form of information integration, is defined here as a correlation among measurements in neuronal activity, such as a correlation between the phases of two EEG channels (i.e., coherence) (Friston, 2011). Functional connectivity has been found to increase from resting-state levels during a variety of cognitive tasks in both humans and animals (Bola and Sabel, 2015; Cahn et al., 2013; Liu et al., 2014; Rodriguez and George, 1999; Srinivasan et al., 1999; Wang et al., 2015; Wei et al., 2015).
In this study, we employed a pulseless electrical activity (PEA) model of CA on rodents to investigate electrocorticogram (ECoG) activity and functional connectivity during the dying process (Hendrickx et al., 1984a,b). Asystole and PEA are the two forms of nonshockable electrocardiogram (ECG) rhythms (i.e., not treatable by defibrillation) that occur during CA. With asystole there is an abrupt loss of blood circulation, whereas with PEA there is a gradual anoxic and hypercarbic decline in blood pressure (BP) until complete cessation of circulation (Foreman and Claassen, 2012; Kawai et al., 1992). During the gradual decline in systemic circulation and, consequently, cerebral blood flow (CBF), the ECoG exhibits a slowing pattern and eventual suppression of amplitude (Jordan, 2004).
Although neural correlates of consciousness have been reported after asystole, we were interested in characterizing ECoG power and coherence during a more gradual dying process. Because ECoG amplitude is suppressed diffusely across the brain during asphyxial CA, an amplitude-independent measure of functional connectively (i.e., mean phase coherence) was employed in this study. We hypothesized that animals undergoing anoxic CA would demonstrate heightened functional connectivity during the gradual suppression of ECoG power that is considered a hallmark feature of impending cardiac death.
Materials and Methods
Animal preparation
Sixteen male Wistar rats obtained from Charles River Laboratory (Kingston, Raleigh, and St. Constant facilities) at weights of 300–400 g were used in this study. Each rat had two electrodes (1.57 mm diameter) implanted on the dura 2 mm anterior and 2.5 mm lateral to bregma, corresponding to the left and right M1 motor cortices of the frontal lobes. Two additional electrodes were implanted 5.5 mm posterior and 4 mm lateral to bregma, corresponding to the left and right V1 visual cortices. A reference electrode was placed 3 mm posterior to lambda over the cerebellum. The rats were allowed to recover for 1 week before undergoing the CA experiment.
CA experiment
On the day of the CA experiment, rats underwent endotracheal intubation and mechanical ventilation while under 2% isoflurane anesthesia carried by 50% oxygen, and 50% nitrogen. Arterial blood gases were monitored to normalize ventilation, while body temperature was regulated to maintain 37°C. BP and ECG were monitored through a femoral artery catheter and electrode leads, respectively, to determine cardiac activity and arrest.
The CA procedure began with 2 min of 100% oxygen and reduced anesthesia, followed by an additional 3 min with the isoflurane turned off (anesthesia washout) and the ventilator delivering room air (21% oxygen). Along with the anesthesia washout, 1 mg vecuronium, a neuromuscular blocker, was delivered intravenously to prevent movement as the rat regained ECoG activity. At the end of anesthesia washout, when the ECoG was fully active, the ventilator was turned off, and the ventilator tubing to the animal was clamped to initiate asphyxia. After onset of asphyxia, the ECoG was recorded for 7 min. All animal procedures were approved by the University of California Animal Care Committee and followed the recommendations of the American Veterinary Medical Association Panel on Euthanasia.
Signal acquisition and preparation
ECoG was recorded from the bilateral frontal cortices and visual cortices at 1526 Hz with a Tucker-Davis Technologies, Inc. RZ5D bioamplifier and a PZ2 preamplifier (TDT, Alachua, FL) with a reference electrode placed on the cerebellum. All signal processing was executed using MATLAB (The MathWorks, Inc., Natick, MA). An average reference across all channels was applied to reduce any pervasive noise, and a 60 Hz notch filter was applied to remove electrical noise. The signals were resampled to 600 Hz using Mathwork's Signal Processing Toolbox, which employs an antialiasing filter, to reduce computational load.
Root mean square (RMS) was calculated from 1 to 150 Hz bandpassed data in 1-sec windows with 1.8 sec overlap (90%) to estimate signal amplitude in each channel. The four asphyxial stages (AS1–4) were determined based on distinct changes in the slope of the RMS. AS2 in some rats were as short as 2 sec, so the power spectral density (PSD) was calculated on the first 2 sec of AS1–4, respectively, using a short-time Fourier transform with 1 sec hamming windows for tapering and 0.9 sec overlap (90%). The PSD of each channel was normalized by subtracting the PSD of the final minute of anesthesia washout. Differences in PSD between the frontal and occipital regions were calculated by averaging the two leads bilaterally.
Calculation of mean phase coherence
The ECoG was convoluted at 1-Hz frequency steps from 1 to 150 Hz with complex Morlet wavelets of linearly increasing cycles from 3 to 40. The phase angle differences between the different channel combinations [Eq. (1)] were calculated in 2 sec windows with 1.8 sec overlap (90%).
Mean phase coherence was calculated, according to Equation (2), on each time–frequency bin. Each rat's coherence values were z-normalized to the final minute of isoflurane washout immediately before asphyxia onset.
Statistical analysis
An exploratory analysis was performed using the z-coherence values from 1 to 150 Hz. No assumptions were made about the distribution of data before statistical analysis, and therefore, a pixel-based paired nonparametric permutation test was performed to compare asphyxia to the final minute of washout. The z-coherence time–frequency map for each rat and channel combination was randomly multiplied 1000 times by 1 or −1 to obtain a distribution of 1000 maximal averaged z-coherence pixel values for each channel combination. Statistical significance was determined by a threshold z-coherence of the top 5% of each channel combination distribution. Bonferroni correction was then applied to this threshold for the multiple channel combinations. To compare power between the frontal and occipital regions, Wilcoxon signed-rank tests were performed in 10-Hz frequency bins along with false discovery rate with the linear step-up procedure for multiple comparison corrections.
Results
Asphyxial CA is associated with four stages of ECoG activity
We classified EEG during asphyxia into four distinct stages (AS1–4), as determined by ECoG amplitude (i.e., RMS). After the onset of asphyxia, the ECoG maintains its amplitude for 29 ± 3 sec (AS1) before rapidly decreasing for 5 ± 2 sec (AS2). Interestingly, it then maintains a very low amplitude for 13 ± 4 sec (AS3) before becoming silent (AS4) (Fig. 1A, B). Electrocerebral silence (AS4) is subsequently maintained for the remaining duration of the recording. The spectrogram affirms that the ECoG morphology is unchanged during AS1 (Fig. 1C). As is characteristic during ischemia, the power of the faster frequencies is gradually lost during AS2–3. CA, as defined by mean arterial pressure (MAP) <20 mmHg, occurred at 153 ± 24 sec after asphyxia onset, which indicates that cortical silence occurred before circulatory arrest (Fig. 1D).
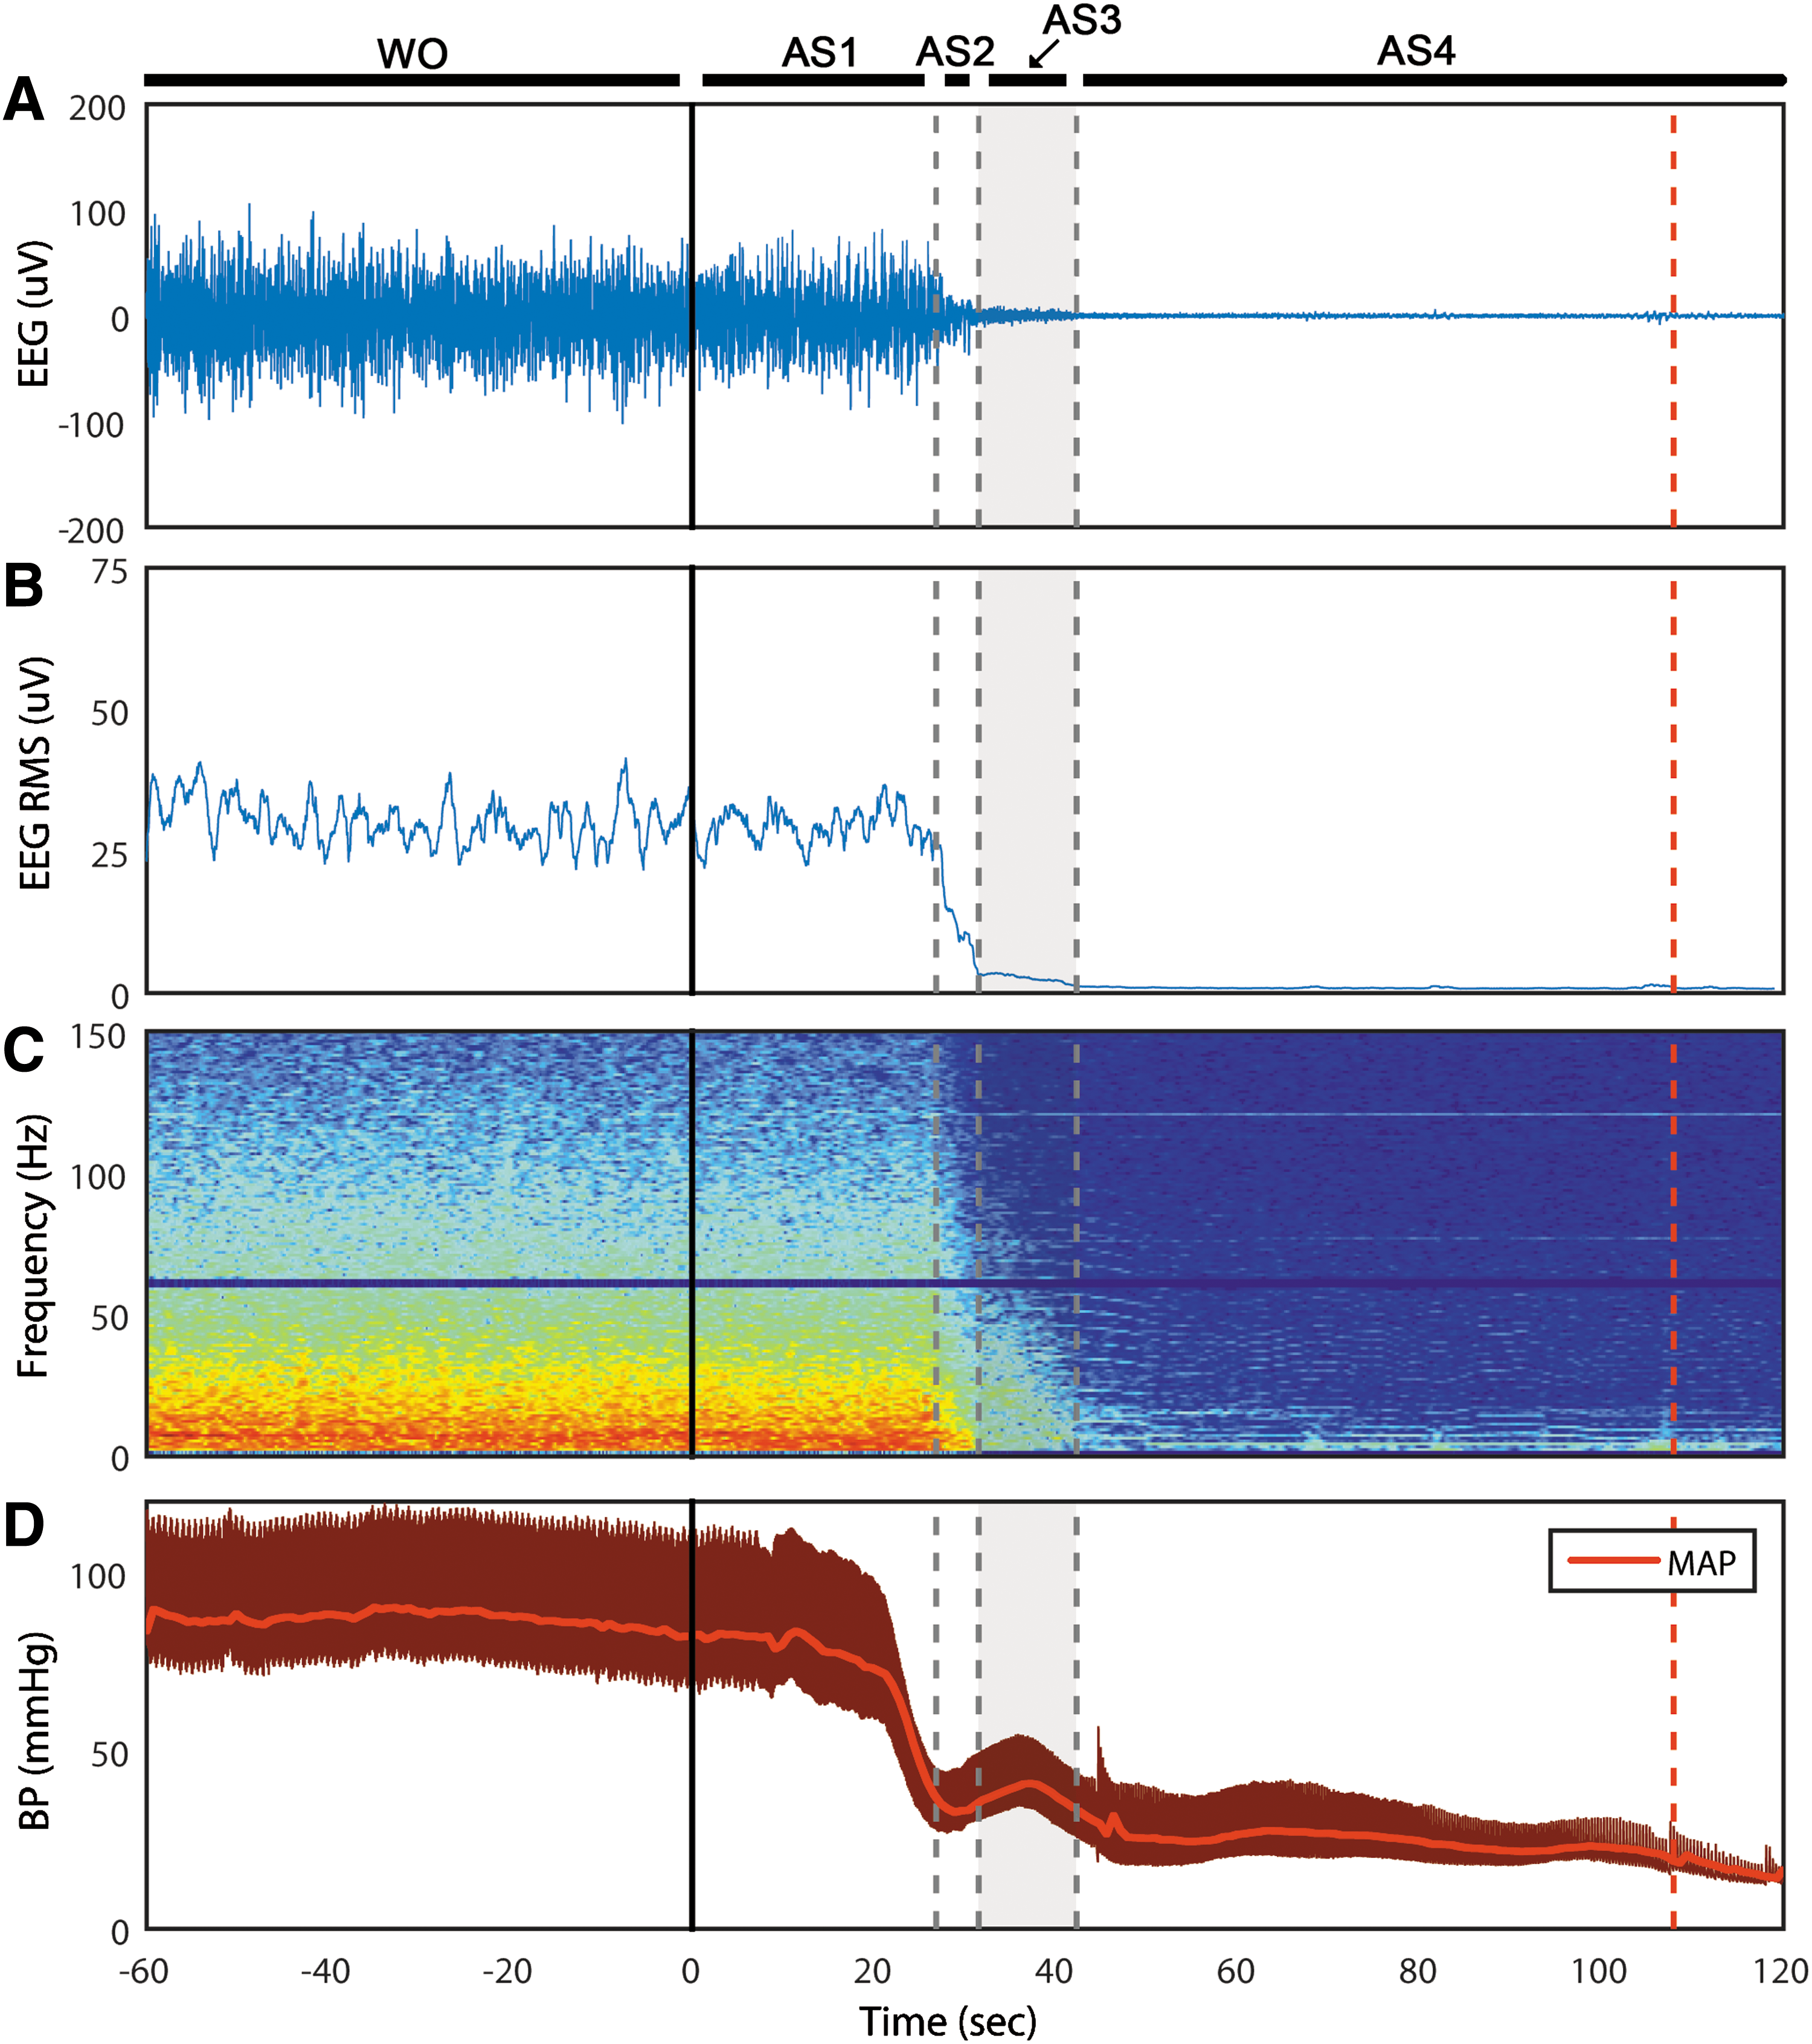
Time course of asphyxial CA of representative rat.
When viewed with standard clinical settings for time and sensitivity, the ECoG appears to be flat during AS3 (Fig. 2). However, the time-condensed ECoG, and in particular the ECoG RMS, reveals that the lowest ECoG amplitudes do not occur until AS4. Thus, although the asphyxial ECoG appears to be silent after steeply dropping in amplitude, it maintains an extended period of near-electrocerebral silence (AS3).
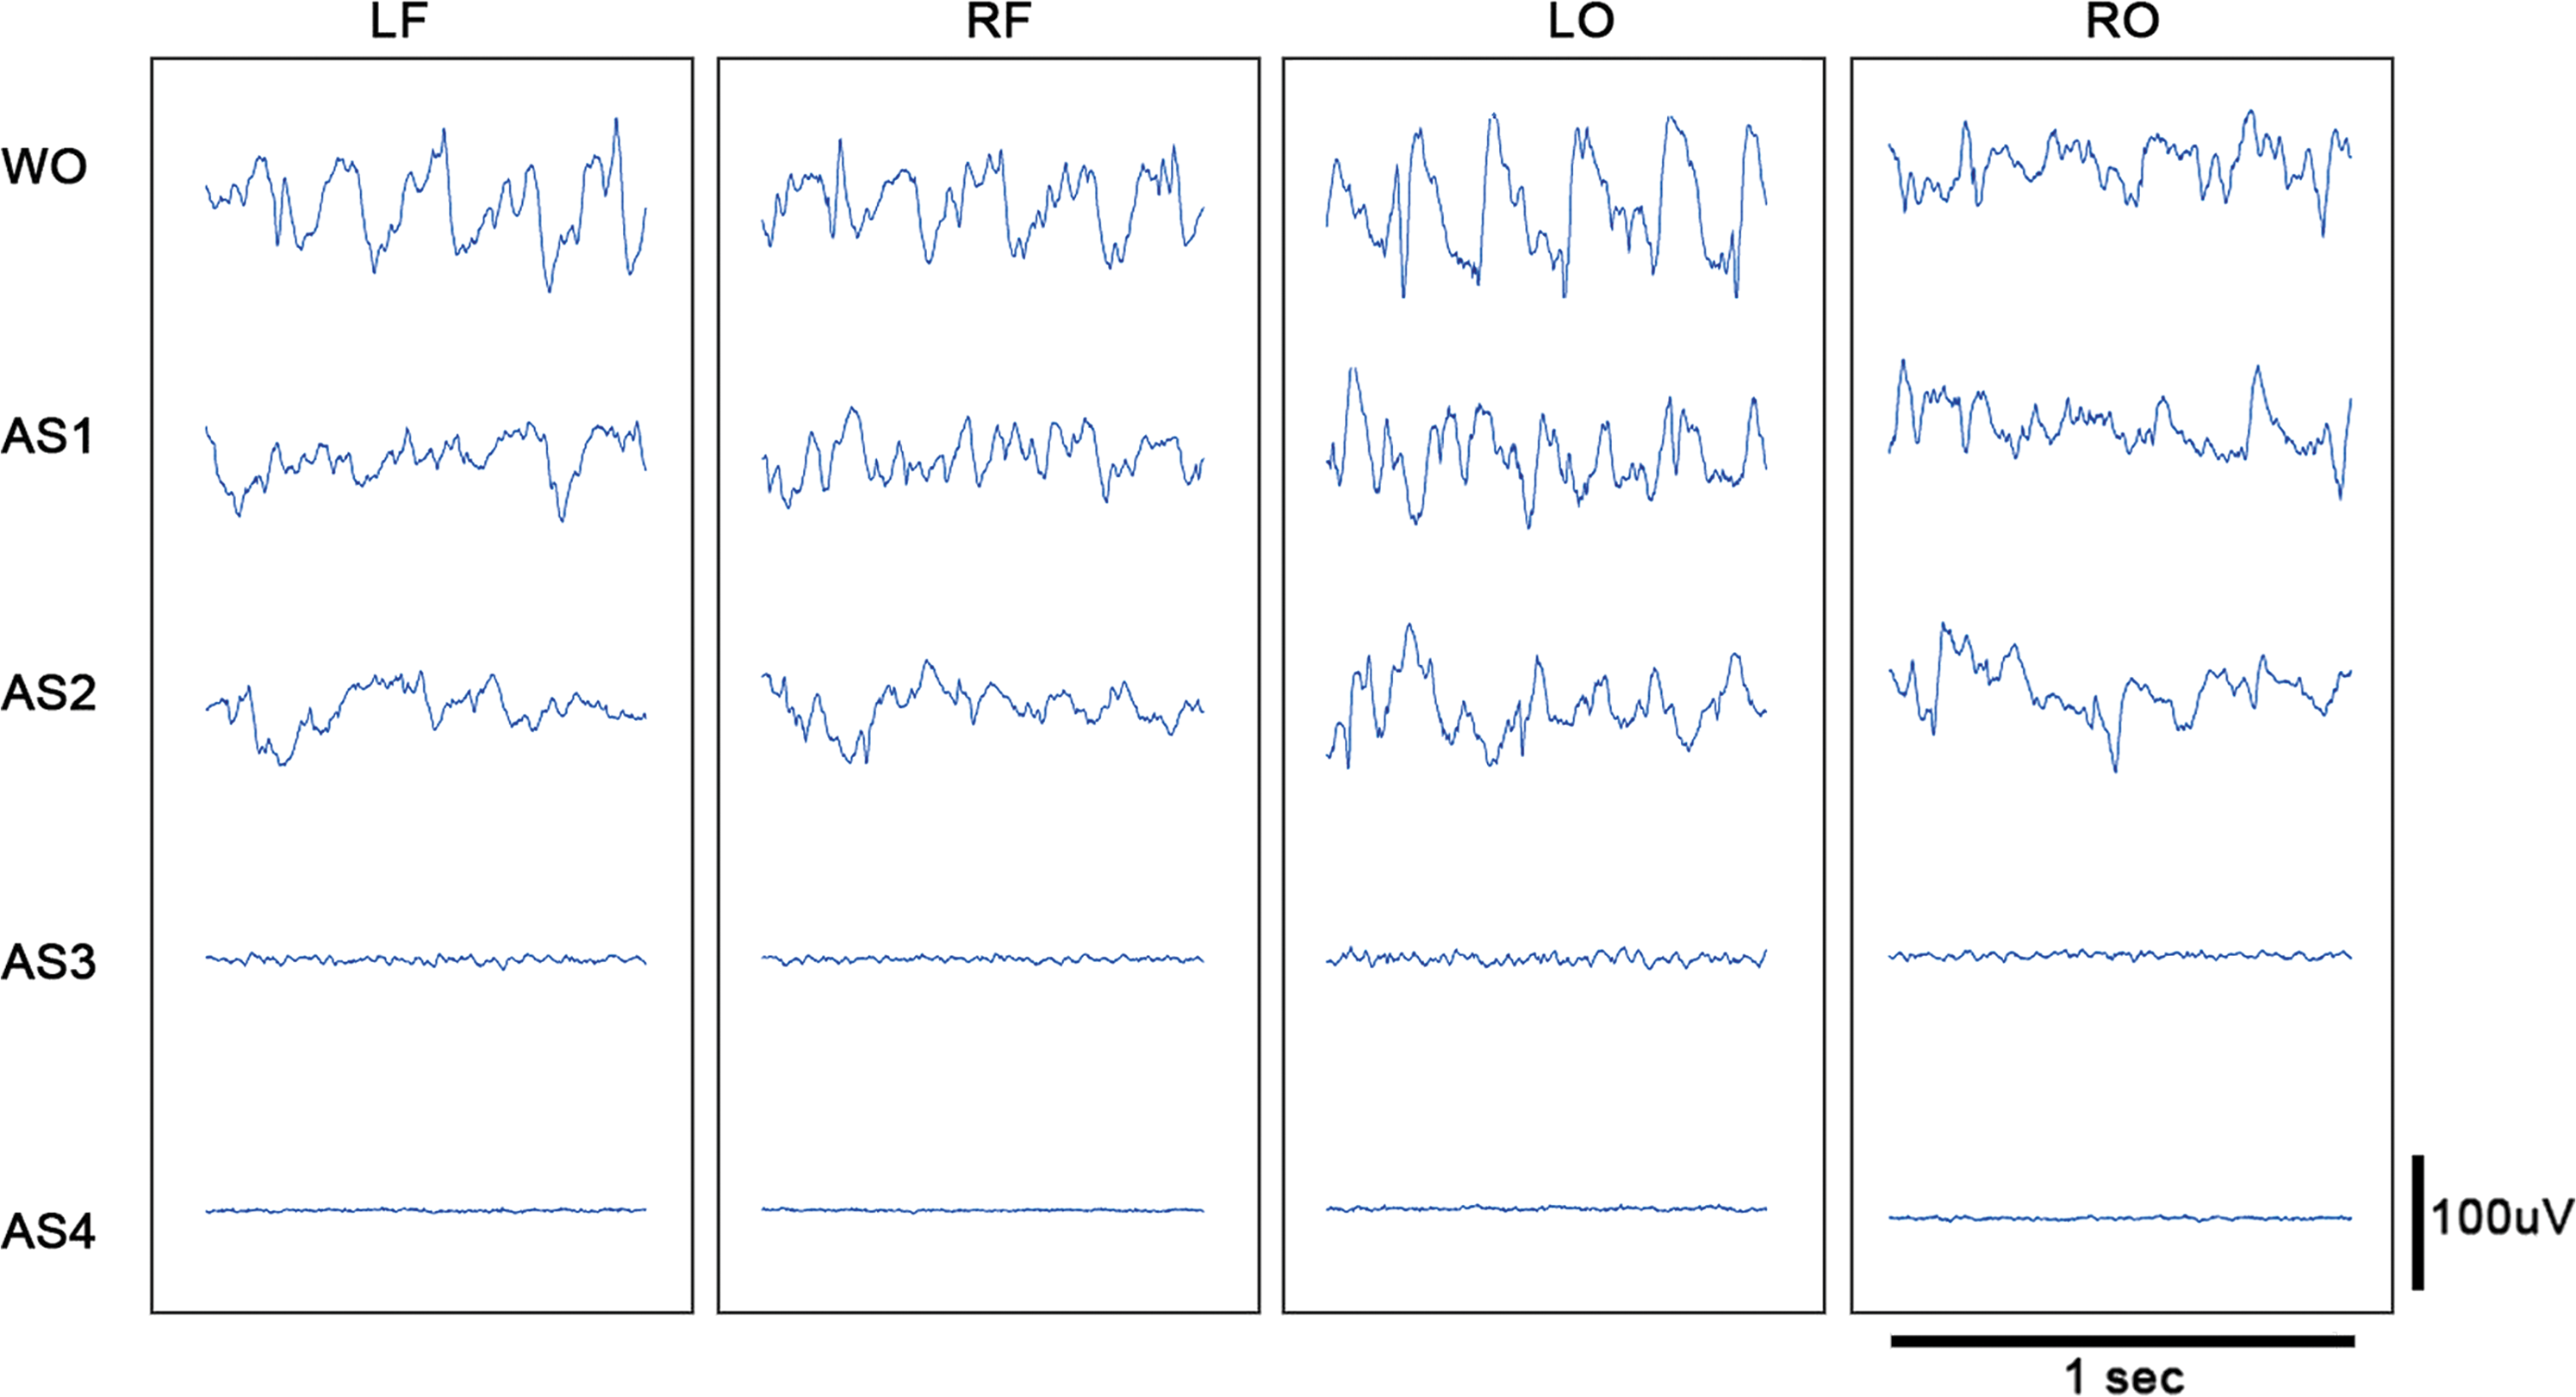
Asphyxial stages of each channel for a representative rat. Displayed are 1 sec of ECoG of a representative rat during each stage of asphyxial CA. The amplitude during AS3 is nearly as suppressed as during AS4 (electrocerebral silence); however, some faster frequency activity is evident during AS3 that is not visible during AS4. LF, left frontal; LO, left occipital; RF, right frontal; RO, right occipital; WO, isoflurane washout. Color images available online at
Frontal ECoG coherence rises during near-electrocerebral silence
To explore functional connectivity during CA, we determined the intra- and interhemispheric ECoG coherence from 1 to 150 Hz. A sustained surge in coherence, particularly between the left and right frontal cortices, was found during near-electrocerebral silence (AS3) (Fig. 3). The frontal coherence was significantly different from washout for frequencies in the range of 13–39 Hz (i.e., beta and slow gamma bands). This increase in frontal coherence during AS3 was noted in 15 of 16 rats (Fig. 4) and was observed to be nearly synchronous, with the left frontal and right frontal mean phase difference being nearly zero (Fig. 5). The frontal coherence was not associated with an increase in frontal power (Fig. 6).
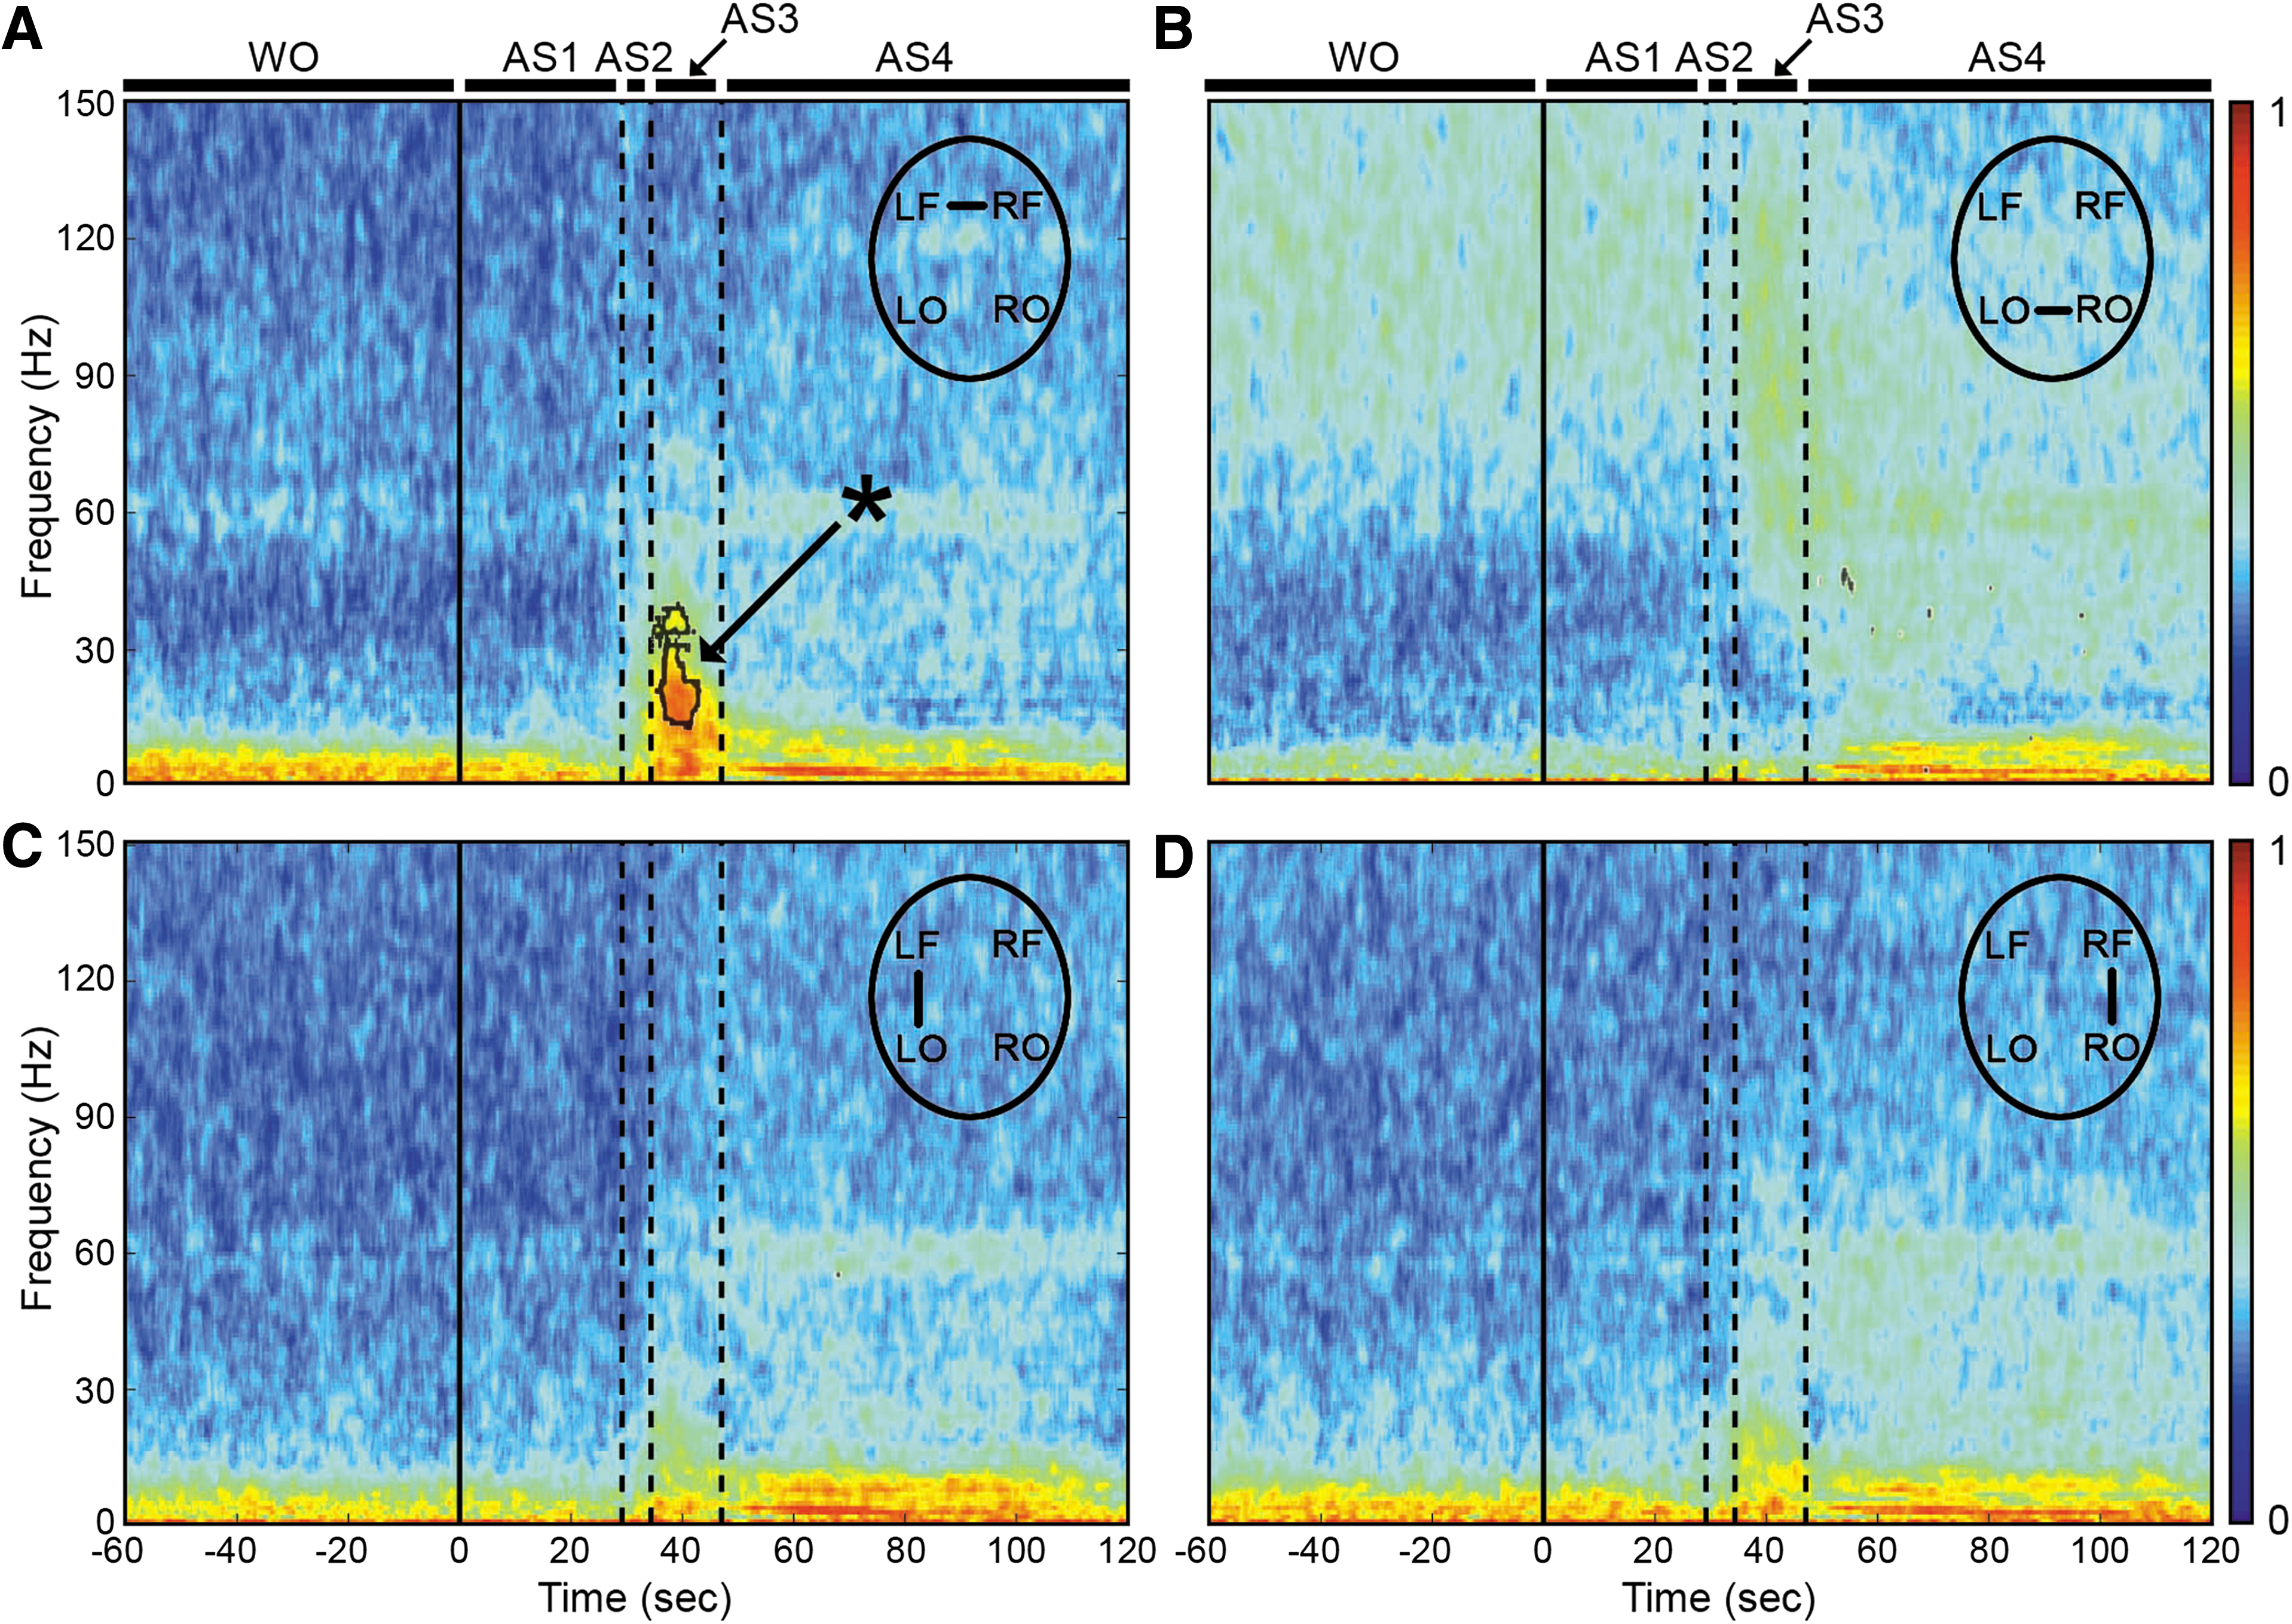
ECoG phase coherence during asphyxial CA.

Coherence during AS3 for each rat. The coherence for each rat was z-normalized to the last minute of anesthesia washout. Each line represents the z-coherence of an individual rat during the middle 2 sec of its respective AS3.
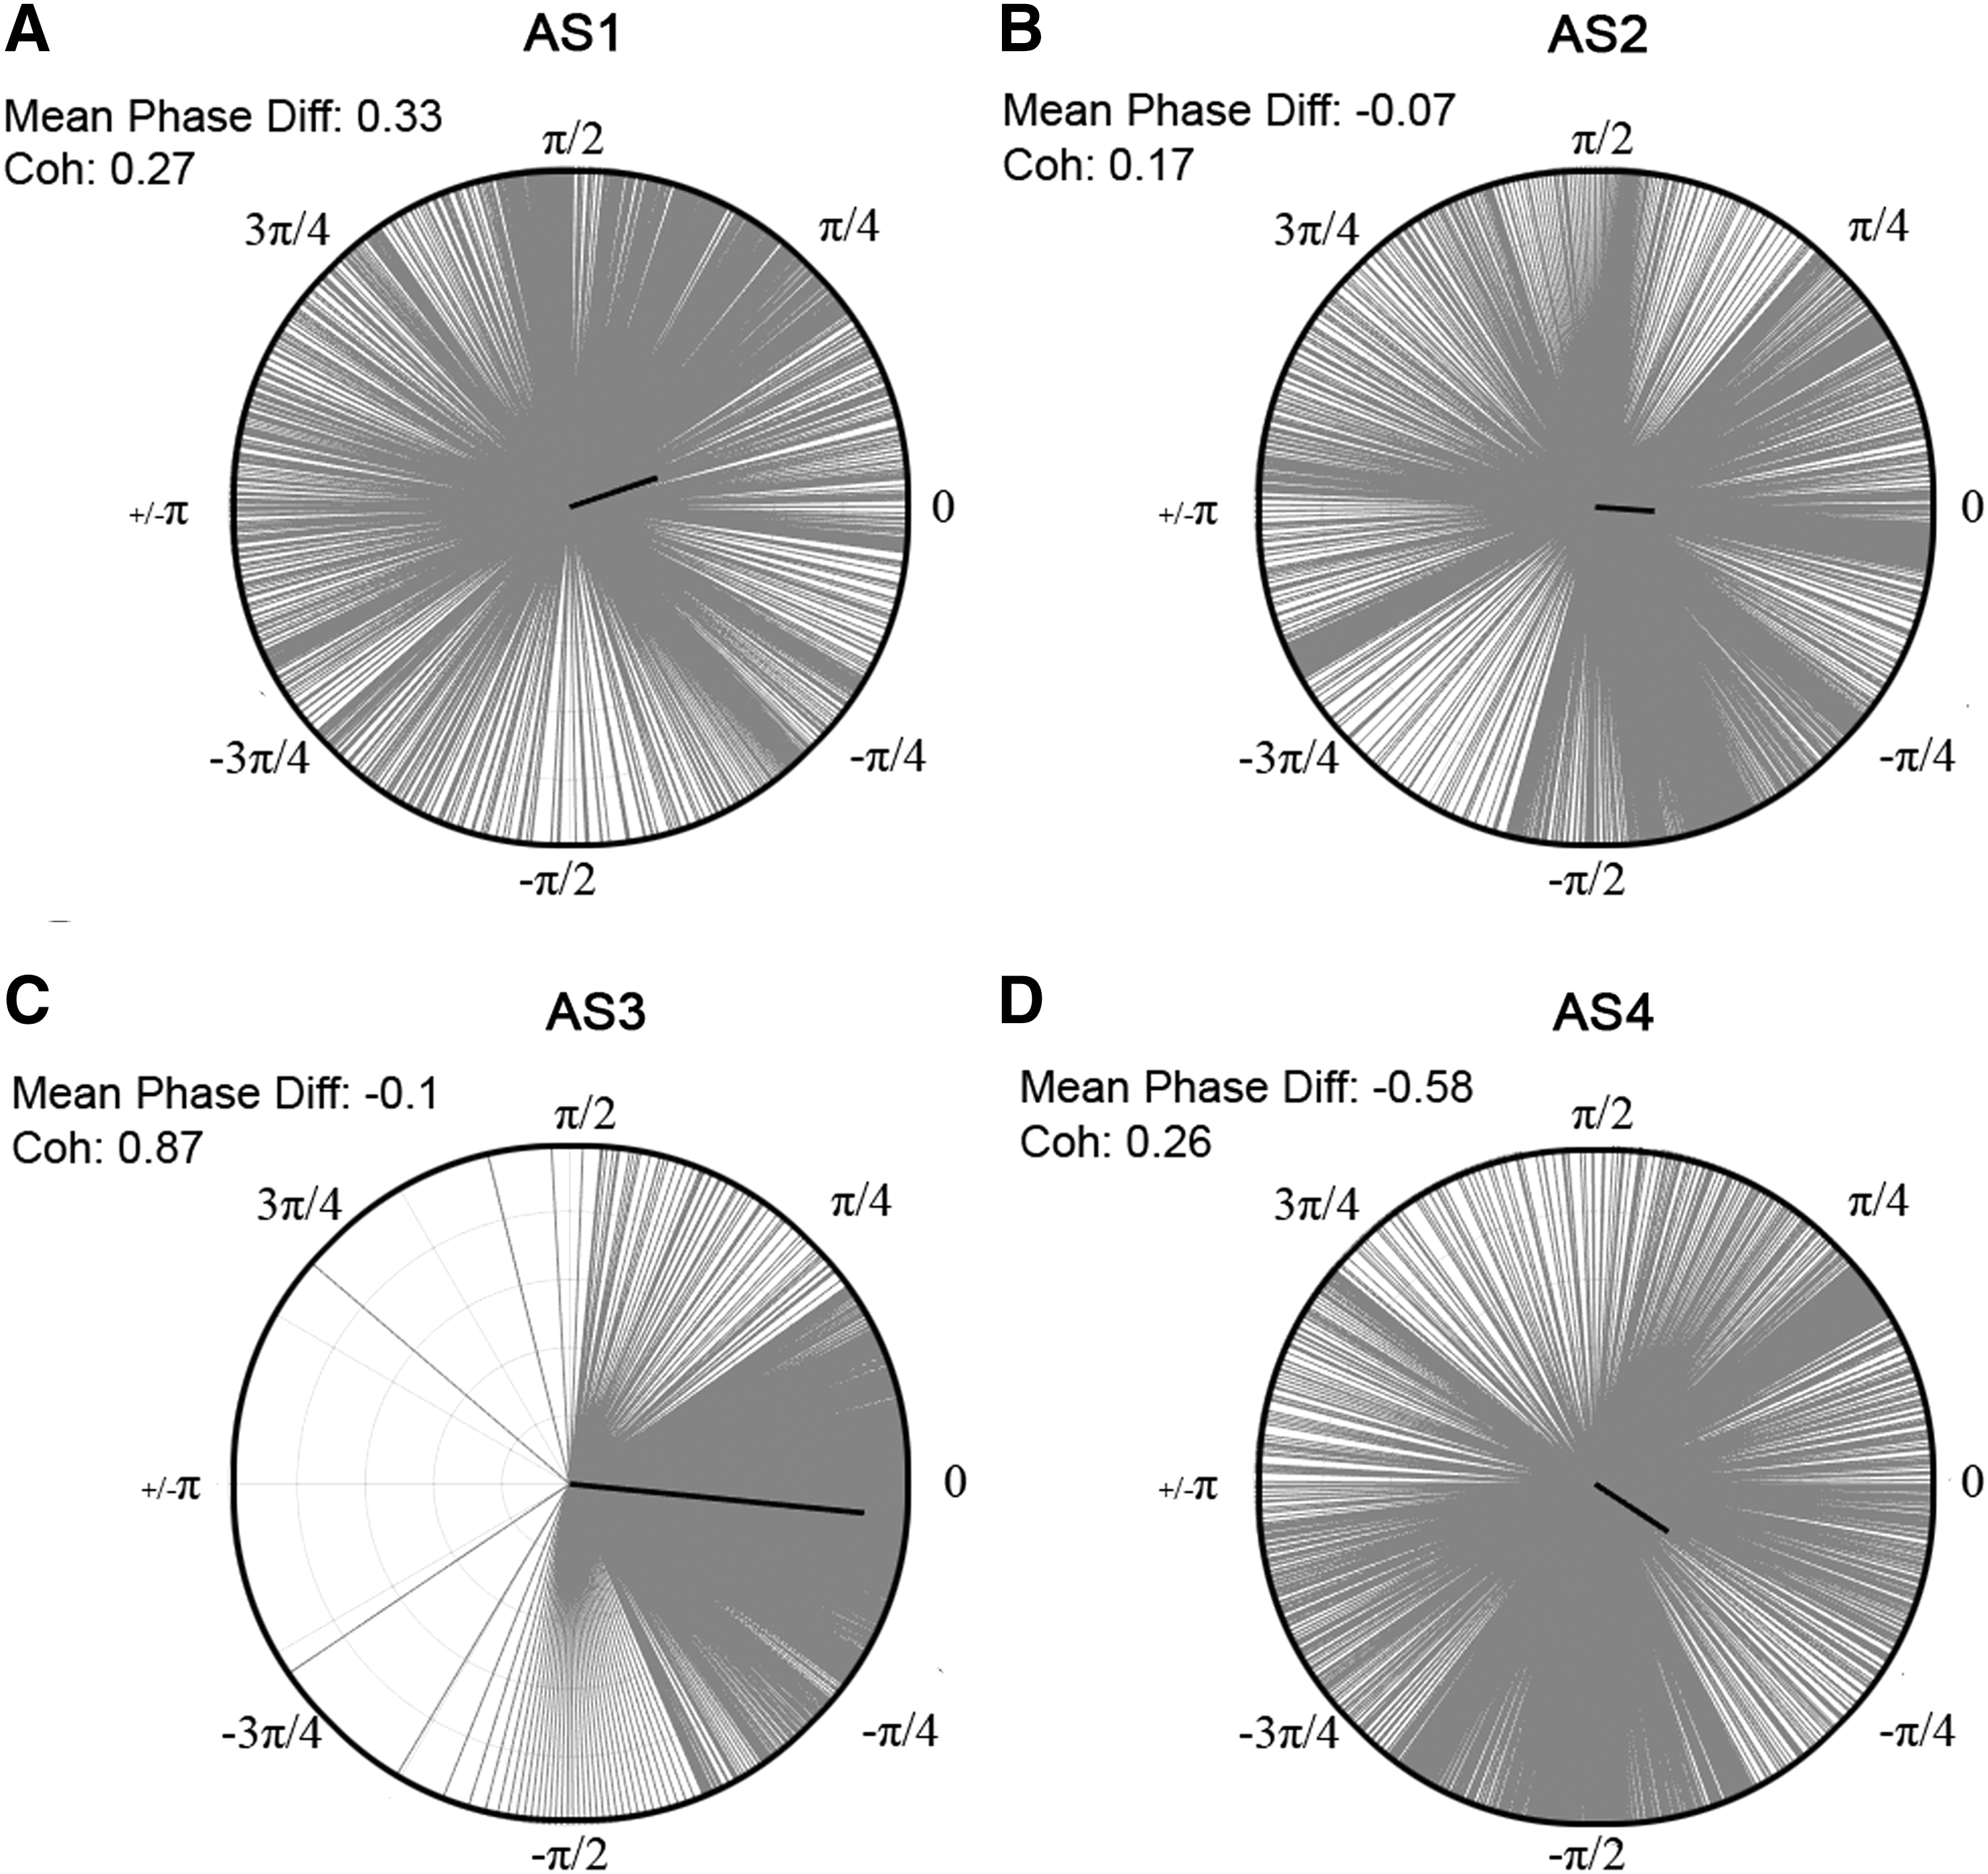
Phase differences during asphyxial stages of representative rat. The distribution of phase differences for the beginning of each asphyxial stage (i.e., beginning 2 sec of AS1–4, respectively) is displayed from −π to π between the left and right frontal leads from 13 to 39 Hz. The mean phase difference is depicted by the angle of the bold black line, and the coherence value is represented by the magnitude of the line.
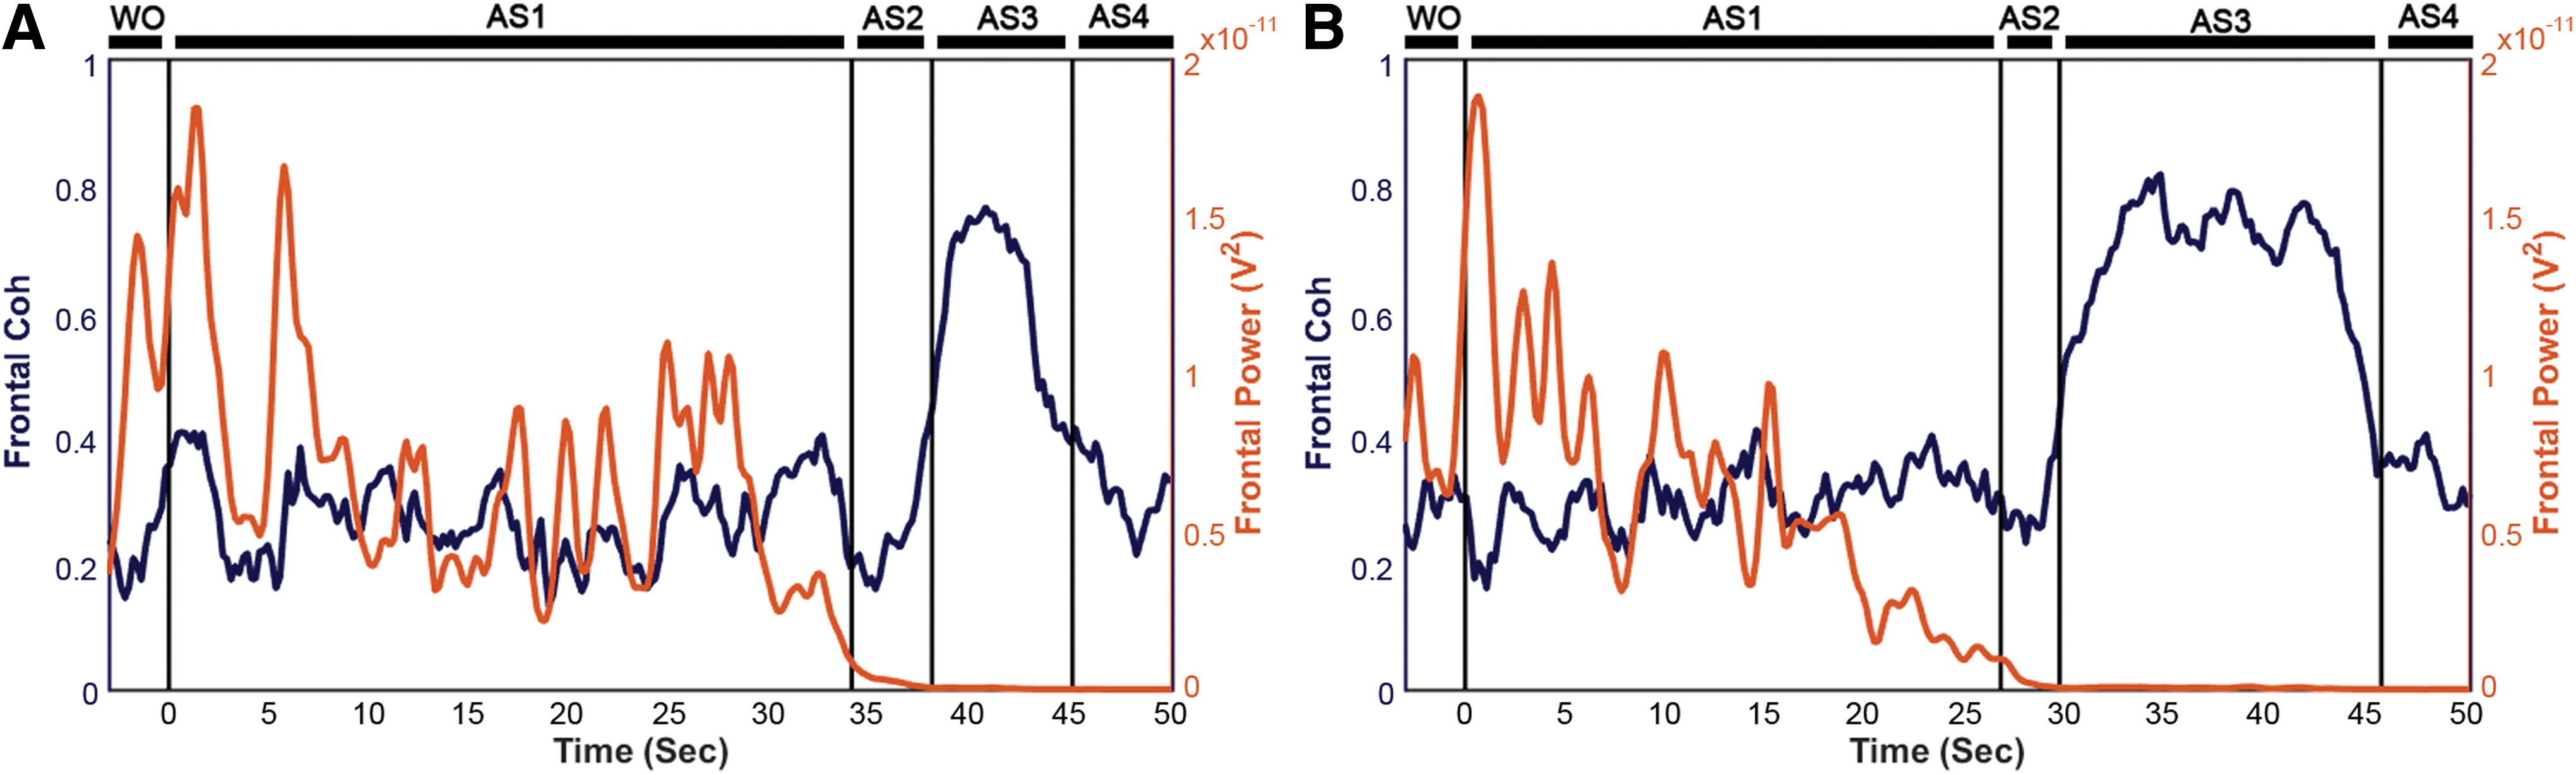
Frontal coherence and power (13–39 Hz) of two representative rats.
Posterior shift in ECoG power during the burst in frontal ECoG coherence
Lastly, we determined whether there were overall differences in the level of ECoG activity between frontal and posterior regions of the cortex that were potentiating the connectivity in the frontal lobe (Fig. 7). No differences in power were observed from AS1–2, which affirmed the previously noted lack of change in ECoG from washout through AS1. During AS3, however, we found a significant difference with greater power in the visual cortices (in comparison with the motor cortices) from 30 to 100 Hz (p < 0.05). Therefore, although we found a sustained surge in frontal coherence during AS3, we did not find frontal power to be greater than occipital power. On the contrary, we found a posterior shift in brain activity during this stage of near-electrocerebral silence, which has also been found in dream states (Hong et al., 2009; Siclari et al., 2014; Wehrle et al., 2005).
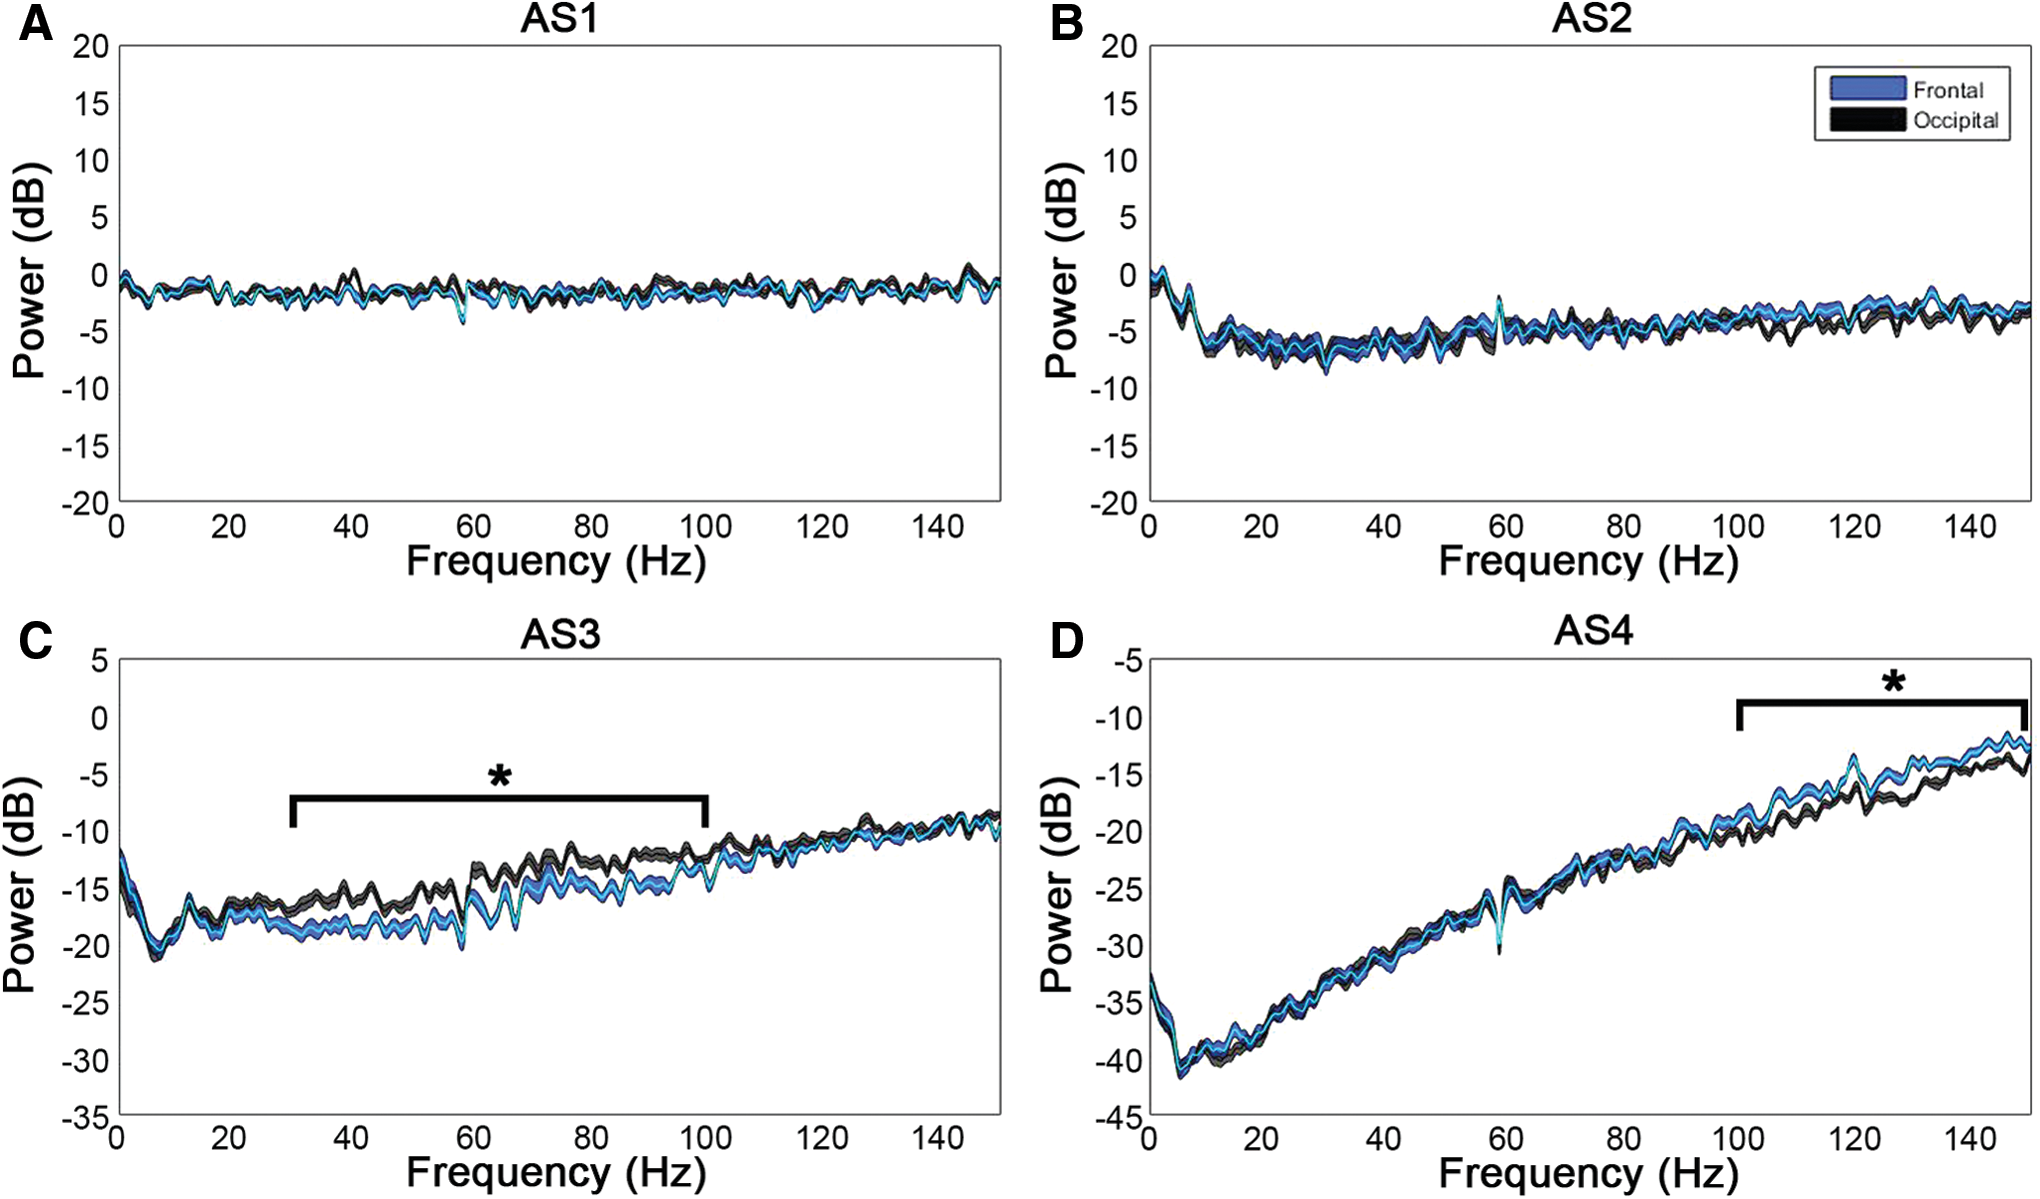
Frontal versus occipital power during asphyxial stages. Displayed are the differences in power from washout during AS1–4.
Discussion
During ischemic episodes, the EEG is known to shift toward slower frequencies before becoming isoelectric (Foreman and Claassen, 2012; Nagata, 1988). In our asphyxial CA model, we observed a similar effect in the transition from AS1 to AS2, yet we also discovered a subsequent period of transient near-electrocerebral silence (AS3) that lasted several seconds. Interestingly, we demonstrate in this study that, during this near-silent ECoG period of asphyxial CA, there is long-range hypersynchrony of the frontal lobe (motor cortex) paired with a posterior shift in ECoG power favoring the visual cortex.
Our PEA model of CA featured an isoelectric ECoG that began 106 ± 26 sec before loss of arterial BP (MAP <20 mmHg). In cases of abrupt loss of blood circulation, a silent EEG (defined as <2 μV) has been reported to occur within 30 sec after CA (Szurhaj et al., 2015); conversely, in cases of a gradual loss of blood flow, such as hypoxic respiratory failure, the EEG has been found to become isoelectric before CA (Pana et al., 2016). In our experiments, AS3 was preceded by a rapid drop in BP, indicative of a concomitant drop in CBF (Hossmann, 2008), and followed by a low BP that was maintained through AS3 and 1–2 min of silent EEG. Of note, AS3 often coincided with a slight rebound in BP that has been previously reported (Hossmann, 2008).
We speculate that the period of low blood flow, in particular during AS3, may be permissive of continual cortical activity. This is corroborated by animal studies in which visual evoked potentials are used to mark the loss of stimulated EEG activity. A rodent study of four-vessel occlusion, which also causes a loss of blood flow to the brain, found the loss of visual evoked potentials to occur ∼1.8 min after occlusion and loss of EEG activity at 15 sec (Ilie et al., 2006). This suggests that AS3 from our study lies within the time frame during which cortical activity can be stimulated.
Although interpretations of consciousness in nonhumans are especially difficult, functional connectivity in animals has been found to be similar to that in humans in several contexts (Boly et al., 2013; Hudetz et al., 2015; Wei et al., 2015). In fact, homologues to the default mode network, an internal awareness network previously thought of as unique to humans, have also been found in rodents (Gozzi and Schwarz, 2016; Pawela et al., 2008). The rise in frontal coherence during AS3 in our study may thus be indicative of conscious processing. Various neuroimaging studies on altered states of consciousness (e.g., anesthesia and sleep) have found preferential regional CBF (rCBF) and metabolism, as well as functional connectivity, reductions in the frontoparietal cortex; return of awareness was found to restore these decrements (Hudetz, 2012; Hudetz et al., 2015).
In addition to the rise in frontal coherence, we also found a posterior shift in the power of faster frequencies that is also suggestive of conscious processing. Although the frontoparietal association cortex has been the primary focus of consciousness research, traditional interpretations from these findings have recently been questioned (Koch et al., 2016). A posterior (temporoparietal–occipital) network for neural correlates of consciousness has been supported by recent within-state or no-task paradigms that attempted to control for potential confounders, such as attention, expectation, or working memory (Frassle et al., 2014; Pitts et al., 2014; Tsuchiya et al., 2015).
A within-state, no task paradigm was recently employed, in which subjects were awoken at random times and asked to report whether they were dreaming. Faster frequency activity in frontal regions was associated with thought-like processes while dreaming, and a reduction in slower frequency power in posterior regions was associated with perceptual experiences (Koch et al., 2016; Siclari et al., 2014). Various studies have separated attention from conscious perception, implicating frontal and parietal regions in attention and introspection (Buschman and Miller, 2007; Dehaene and Changeux, 2011; Kamphuisen et al., 2008; Wyart and Tallon-Baudry, 2008; Zaretskaya and Narinyan, 2014). Therefore, the surge in frontal coherence that we observe during AS3 may be reflective of a heightened state of introspection or attention, whereas the shift in higher frequency power toward the posterior may be indicative of perceptual or sensory processing.
Although we observe purported neural correlates of consciousness during AS3, elevated connectivity and gamma power have also been associated with unconscious states. Various anesthetics cause blood flow to increase preferentially in frontoparietal regions, whereas frontal coherence has also been reported to increase while unconscious (Hudetz, 2012; Pascual-Leone, 2013; Supp et al., 2011). Elevated gamma power and beta and gamma synchrony have also been reported in unconscious patients after generalized tonic–clonic seizures (Pockett and Holmes, 2009). Our findings, while consistent with previous markers of consciousness, thus may also be interpreted as cortical dynamics that precede loss of consciousness. During propofol anesthesia, for example, a spike in frontal alpha power and coherence was seen to precede loss of consciousness (Supp et al., 2011). However, we did not observe the stereotypic increase in absolute or relative frontal power often associated with the frontal coherence during such anesthesia-induced unconsciousness.
Additionally, the brief 3-minute washout period for isoflurane in our experiments raises the possibility that residual isoflurane may have effects on coherence during asphyxia. Indeed, though the ECoG appears active by the end of washout in our study, prior studies have shown residual levels of isoflurane up to 10 minutes after initiation of washout (Kim and Tham, 2013; Torri et al., 2002). Thus, future studies can elucidate the potential role of residual isoflurane on neural correlates of consciousness by using other anesthetic agents, other modes of CA induction, and modification of anesthesia washout periods as permitted within the confines of approved animal protocols. Furthermore, isoflurane and other volatile anesthetics have been shown to have longer-lasting effects, as evidenced by isoflurane-mediated preconditioning studies. While these studies show uncoupling of mitochondria and sensitization of ion channels that can theoretically affect cellular firing, a majority of these preconditioning studies are focused on the cardioprotective rather than neuroprotective role (Bonney et al., 2014; Ljubkovic et al., 2007; Marinovic et al., 2005). Also, among the studies showing isoflurane-induced preconditioning on the brain, most are focused on time periods well beyond the initial 30–60 seconds of hypoxic-ischemic insults when we note the AS3 ECoG findings (McMurtrey and Zuo, 2010; Sasaoka et al., 2009).
Finally, given the evidence that vecuronium and other neuromuscular blocking agents can exert effects on central cholinergic receptors (Cardone et al., 1994), one may consider vecuronium's potential role in our ECoG findings during AS3. However, such studies were conducted in brain slices, whereas in live animals vecuronium has very limited permeability through the blood brain barrier, especially in small doses such as in our study (Chiodini et al., 1998; Waser et al., 1987). Additionally, even after asphyxial CA, the blood brain barrier remains intact and impermeable to small and large molecules for many hours (Tress et al., 2014), well beyond the focus of our study.
Conclusion
In summary, we found asphyxial CA to induce a period of near-electrocerebral silence that was marked by hypersynchrony in the frontal lobes and increased power in the visual cortices, which suggests potential markers of consciousness. Although human electrophysiological recordings of CA are often confounded by drug, anesthetic, or other pathological conditions, animal studies may allow for controlling these factors to better determine whether there are in fact neural indicators of consciousness while near death.
As such, future studies investigating neural correlates of consciousness can target the brief rebound in BP after asphyxia that was noted earlier and its role in changes in brain connectivity. As the importance of corticocardiac signaling in asphyxia has been reported recently (Li et al., 2015), a multimodal approach that includes ECoG, ECG, BP, CBF, and brain metabolic activity monitoring may be utilized to investigate such phenomena (Crouzet et al., 2016). In addition, although research on loss and regain of consciousness has often employed anesthesia, resuscitable animal models of CA may also allow the controlled study of regaining of consciousness from a pathological state, which might elucidate any potential clinical implications (Rady and Verheijde, 2016).
Footnotes
Acknowledgments
The authors thank Ramin Badiyan, Juan Alcocer, Zuhal Hassan, Jasmine Chen, and Dr. Young-Jin Kang for their assistance with the CA experiments. This work was supported by a 5KL2TR000147 grant to YA and the National Center for Research Resources and National Center for Advancing Translational Sciences, National Institutes of Health, through grant UL1 TR001414. Funds from the UC Irvine Department of Neurology and School of Medicine to YA also supported this project. The content is solely the responsibility of the authors and does not necessarily represent the official views of the NIH.
Author Disclosure Statement
The authors declare that the research was conducted in the absence of any commercial or financial relationships that could be construed as a potential conflict of interest.