
Abstract
Sickle cell disease (SCD) is a vascular disorder that is often associated with recurrent ischemia-reperfusion injury, anemia, vasculopathy, and strokes. These cerebral injuries are associated with neurological dysfunction, limiting the full developing potential of the patient. However, recent large studies of SCD have demonstrated that cognitive impairment occurs even in the absence of brain abnormalities on conventional magnetic resonance imaging (MRI). These observations support an emerging consensus that brain injury in SCD is diffuse and that conventional neuroimaging often underestimates the extent of injury. In this article, we postulated that alterations in the cerebral connectivity may constitute a sensitive biomarker of SCD severity. Using functional MRI, a connectivity study analyzing the SCD patients individually was performed. First, a robust learning scheme based on graphical lasso model and Fréchet mean was used for estimating a consistent descriptor of healthy brain connectivity. Then, we tested a statistical method that provides an individual index of similarity between this healthy connectivity model and each SCD patient's connectivity matrix. Our results demonstrated that the reference connectivity model was not appropriate to model connectivity for only 4 out of 27 patients. After controlling for the gender, two separate predictors of this individual similarity index were the anemia (p = 0.02) and white matter hyperintensities (WMH) (silent stroke) (p = 0.03), so that patients with low hemoglobin level or with WMH have the least similarity to the reference connectivity model. Further studies are required to determine whether the resting-state connectivity changes reflect pathological changes or compensatory responses to chronic anemia.
Introduction
S
Aggressive transcranial Doppler screening and more liberal use of chronic transfusion therapy and hydroxyurea have lowered overt stroke dramatically, whereas silent strokes or white matter hyperintensities (WMH) occur in more than 50% of patients by early adulthood (Kassim et al., 2016). These injuries are associated with neurological dysfunction, limiting the full developing potential of the child and adult (Mackin et al., 2014). However, recent large studies of neurologically asymptomatic children and adults with SCD have demonstrated that cognitive impairment occurs even in the absence of brain abnormalities on conventional magnetic resonance imaging (MRI) (Sun et al., 2012). These observations support an emerging consensus that brain injury in SCD is diffuse and insidious, and that conventional neuroimaging often underestimates the extent of injury.
Previous MRI studies have reported a delayed volumetric growth of brain gray matter (GM) in children with SCD (Chen et al., 2015; Steen et al., 2005). Regional cortical thickness abnormalities were found in the precuneus and the posterior cingulate, which are possible symptoms of chronic hemodynamic complications and insufficient oxygen delivery to watershed tissue (Kirk et al., 2009). This chronic vascular disease also causes diffuse white matter (WM) damage in major fiber pathways throughout the brain (Balci et al., 2012; Kawadler et al., 2013). SCD patients also present bilateral WM volume loss in comparison to control (CTL) subjects in the cerebrum and frontal, parietal, and temporal lobes while sparing the occipital lobe, that are associated with low hemoglobin level and mean platelet volume (Choi et al., 2017).
Cognitive deficiencies have also been reported, including lower verbal intelligence quotient scores, poorer math performance, and visuo-motor impairments with increasing age in patients with SCD (Fowler et al., 1988; Wang et al., 2001; Wasserman et al., 1991).
Given the global nature of brain volumetric changes, we postulated that alterations in the cerebral connectivity in SCD patients may constitute a sensitive biomarker of SCD severity. Functional brain changes are believed to precede structural brain changes and neurocognitive damage (Lampit et al., 2015; Supekar et al., 2010; Vaessen et al., 2014).
Functional magnetic resonance imaging (fMRI) is an indirect measure of neural activity in the human brain, correlating the latter with local changes in blood flow and oxygen consumption. Non-neuronal contributions to the blood oxygen level-dependent (BOLD) signal include signal changes due to motion, cardiac pulsations, respiratory-induced modulations, blood flow changes coupled to end-tidal CO2, and vasomotion (Behzadi et al., 2007; Murphy et al., 2013). After correcting for source of physiological noise through linear regression, the brain's functional connections are inferred by exploiting temporal similarity between low-frequency BOLD fluctuations of different regions. As is the case in other studies, we will use resting-state fMRI for this inference; see, for example, the human connectome project (Smith et al., 2013).
Functional connectivity (Biswal et al., 1995) has recently found applications in clinical settings (Fox and Greicius, 2010). In particular, a core set of more than ten networks have been consistently identified across subjects (Damoiseaux, 2012; Fox et al., 2005): the primary sensorimotor network, the primary visual and extra-striate visual network, the bilateral temporal/insular, and anterior cingulate cortex regions, as well as the left and right lateralized networks consisting of superior parietal and superior frontal regions. In resting conditions, the default mode network (DMN; comprising mainly the posterior cingulate cortex, the precuneus, the medial prefrontal cortex, and the angular/lateral parietal cortex) is the dominant network detected (Raichle et al., 2001); however, its role remains the subject of speculations.
Recently, graph theoretical approaches have proved to provide a powerful framework for evaluating fMRI brain networks, that is, functional connectivity. These techniques model the brain as a complex network where nodes are associated with regions of interest (ROIs) and an edge strength represents the degree of functional connectivity between a pair of regions. Functional connectivity can be computed by using partial correlations (Hampson et al., 2002; Phlypo et al., 2014; Smith et al., 2011), which provides a much better characterization of brain connectivity than simple correlation analysis. This is because partial correlation relates to the direct connectivity between two nodes, by measuring the correlation between a pair after having regressed out the effects from all other nodes in the network. If the partial correlation between a pair of regions vanishes, these two regions are considered conditionally independent given the activity of other brain areas (Hastie et al., 2005).
Estimation of functional networks using partial correlations is an ill-defined problem when the number of possible connections involved in the analysis is large compared with the number of regions considered. Therefore, one often applies sparse regularization of the network connections via an L1 penalty (Friedman et al., 2008), commonly referred to as graph(ical) lasso (least absolute shrinkage and selection operator). An additional advantage of the so-obtained sparse network solutions lies in the fact that these are helpful in interpreting the estimated networks from a functional point of view.
An extension to graphical lasso estimates an intra-subject brain connectivity model (Rosa et al., 2015), imposing the same functional structure on all subjects' connectivity networks (Ng et al., 2013; Varoquaux et al., 2010). This network-centric perspective has allowed fundamental insights into the organization of the healthy and diseased brain, which could lead to the identification of potential disease biomarkers. It has been utilized to investigate Alzheimer's disease (Huang et al., 2010) and thalassemia (Coloigner et al., 2016). An implementation of the optimization program that is used in this article can be found in NiLearn (Abraham et al., 2014).
In this article, we propose a robust learning scheme based on an intra-subject graphical lasso model estimate for the CTL subjects against which we test inferred graphical models of the SCD patients. Our goal is to detect subject-specific deviations from this intra-subject model, as such revealing potential biomarkers of early-stage SCD. Hyper parameters of our model are set within a cross-validation scheme, yielding a robust model of healthy brain connectivity. Under our null hypothesis, the connectivity model learned on CTL is perfectly adequate to describe every single SCD network model. A permutation test was used to assess model fitness for every patient and to provide an individual index of similarity in resting-state connectivity between remaining SCD patients and CTL subjects. Further, the relationships between the similarity index and blood measurements such as CBF and hematocrit were investigated.
Materials and Methods
Participants
Patients were recruited at the Children's Hospital Los Angeles (CHLA) between January 2012 and January 2016. The institutional review board of CHLA approved the protocol (CCI-11-00083), and written informed consent was obtained from all subjects. The diagnosis of SCD was confirmed by hemoglobin electrophoresis on cellulose acetate. The population sample consists of 27 SCD patients (24 patients with SS hemoglobin, 1 patient with Sβ0 hemoglobin, and 2 patients with SC hemoglobin) and 21 CTL subjects (12 subjects with AA hemoglobin and 9 subjects with SA hemoglobin). For each subject, demographic data such as age, gender, and educational level as well as standard laboratory parameters, including hemoglobin concentration, percent of hemoglobin S or F, and hematocrit, were collected.
Thirteen SCD patients were receiving blood transfusions regularly. Indications for transfusion were abnormal transcranial Doppler examination (N = 9), acute chest syndrome (N = 2), renal failure (N = 1), and unknown (N = 1). For these chronically transfused patients, the study was performed immediately before their scheduled blood transfusion, when their hemoglobin levels were comparable to those of the nontransfused patients. SCD patients had been transfused for 7.4 ± 2.9 years (range 3.5–13.6 years). All patients receiving chronic transfusions were maintained on iron chelation with deferasirox.
Seven out of the 13 nontransfused SCD patients were prescribed hydroxyurea. Four out of the seven patients on hydroxyurea had increased mean corpuscular volume and hemoglobin F percent, suggesting good hydroxyurea response. Hemoglobin F was increased in the nontransfused SCD population (because of hydroxyurea usage), but it was not significantly increased in any of the chronically transfused patients. Patients with any history of neurologic injury, overt stroke, or imaging findings were excluded.
Patients with chronic disorder (e.g., epilepsy, diabetes, chronic lung disease) or evidence of acute chest or pain crisis hospitalization within 1 month were also excluded. All patients were, thus, in their steady state. Study subjects were not evaluated by a neurologist, but no focal neurologic deficits were documented in the medical record. Nontransfused patients reported 0–2 pain crises in the previous year but none in the past month. Most of the patients receiving regular transfusion therapy did not have any pain crises.
African American CTL subjects with HbAA or HbSA on electrophoresis and a normal hemoglobin level (>12 g/dL for women, >13.5 g/dL for men) were recruited primarily from relatives and family friends of the patients to better match the genetic and socioeconomic background. CTL subjects' exclusion criteria were seizures, developmental delay, diabetes, or uncontrolled hypertension.
MRI acquisition
All participants underwent a magnetic resonance imaging study at CHLA using a 3T Philips Achieva and an eight-element head coil. A whole brain, 3D T1-weighted image was acquired (160 sagittal slices) with repetition time (TR) = 8.2 sec, echo time (TE) = 3.8 msec, flip angle = 8°, in-plane resolution = 1 × 1 mm, field-of-view (FOV) = 256 × 224 mm, and thickness/gap = 1.0/0 mm. To localize the silent strokes, the 3D T2-weighted image was obtained with TR = 4.8 sec, TE = 255 msec, flip angle = 90°, in-plane resolution = 1 × 1 mm, FOV = 256 × 256 mm, and thickness/gap = 1.3/0 mm. A cerebral magnetic resonance angiography using three-dimensional time-of-flight angiography of the circle of Willis was acquired by using TR = 23 msec, TE = 3.5 msec, 150 slices, 0.7 mm thickness, and a directional field of view of 10.5 cm.
During resting-state fMRI scanning, subjects were instructed to close their eyes, remain still as much as possible, not to think of anything systematically, and not to fall asleep. The functional images were acquired with the following parameters: TR = 2000 msec, TE = 50 msec, flip angle = 90°, in-plane resolution = 2.3 × 2.3 mm, FOV = 220 × 220 mm, 26 axial slices, and thickness/gap = 5/0 mm. A total of 240 volumes were collected in 8 min. The echo time was chosen to maximize contrast-to-noise ratio of the BOLD signal across the entire brain; this occurs when TE is near T2* (∼50 msec at 3T) (Krüger et al., 2001). We wanted to optimize T2* contrast because SCD patients are quite anemic and blunted fMRI response has been previously described in this population (Zou et al., 2011).
To measure CBF, a phase-contrast (PC) MRI was also obtained, positioned just above the carotid bifurcation: TR = 1286 msec, TE = 77 msec, resolution = 1.2 × 1.2 mm, FOV = 220 × 220 mm, velocity encoding gradient = 200 mm/sec, and slice thickness = 5 mm.
Analysis of anatomic and PC images
Angiography, 3D T1 and 3D T2 images were analyzed by a single board-certified radiologist.
T1-weighted images were processed by using BrainSuite14 (
Angiographic images were scored according to a segmental scoring system developed for SCD patients (Helton et al., 2014).
The WMH were classified as ≥3 mm lesions on 3D T2-weighted images observed in two orthogonal planes, with or without corresponding changes on T1. Since patients with known strokes were excluded, WMH were considered “silent” irrespective of neurocognitive testing results. Since isolated WMH are relatively common in children (Nelson et al., 2000) and increase in frequency with age (Neema et al., 2009; Postma et al., 2016), more than one lesion per decade of age was required to be considered pathological.
PC images were analyzed by using custom MATLAB routines as previously described (Borzage et al., 2016; Bush et al., 2016). Briefly, an operator placed a single point within each of the four major cerebral vessels. Boundaries were automatically segmented from the complex difference images by using a Canny edge detector, grown by a single voxel, and thresholded at values three times greater than the noise floor. All contours were confirmed by the operator and manually traced in the event of automatic algorithm failure (<5%).
Resting-state fMRI preprocessing
To avoid T1 equilibration effects, the first two volumes of our fMRI time series were discarded. A correction was applied to rectify slice acquisition timing differences within volumes.
Then, the fMRI preprocessing procedure was led as illustrated in Figure 1: First, a motion correction step was applied, which consists of realigning linearly all other volumes to the central one with MCFLIRT algorithm of FMRIB Software Library (FSL) to compensate for subject motion and to ensure voxel-to-voxel correspondence across time. Second, two registration steps were used to transform the functional data into the Montreal Neurological Institute (MNI) template space. The mean fMRI image was co-registered (six rigid body parameters) with the structural image; the structural image was nonlinearly transformed to the MNI template space, using the linear and nonlinear FSL registration algorithms. The parameters generated from these two co-registration steps were then concatenated and used for the normalization of each fMRI volume.

Resting-state fMRI preprocessing. fMRI functional data signal of interest is extracted and transformed from patient space to MNI template space; see text for details. Thirty-nine regions are used as nodes to construct the connectivity matrix for every patient. fMRI, functional magnetic resonance imaging; MNI, Montreal Neurological Institute.
Third, a regression smoothing method based on a general fMRI data linear model analysis was used to remove the residual noise and motion in each voxel as a function of 17 regressors. The first five noise regressors were derived by conducting an initial model fit to determine principal components from noisy regions of non-interest, namely white matter, cerebral spinal fluid, and matter outside the brain by the CompCor method T1 weighted as implemented in Nilearn (
Finally, the resting-state data were parcellated into 39 regions considered as nodes to construct the brain network by using a multi-subject probabilistic atlas (Varoquaux et al., 2011). Regional mean time-series were estimated by averaging the fMRI signals over all voxels within each region. Edges of the brain network were defined as functional connectivity of all pairs of atlas regions by using the partial correlation coefficient as estimated per our graphical lasso framework.
Connectivity analysis
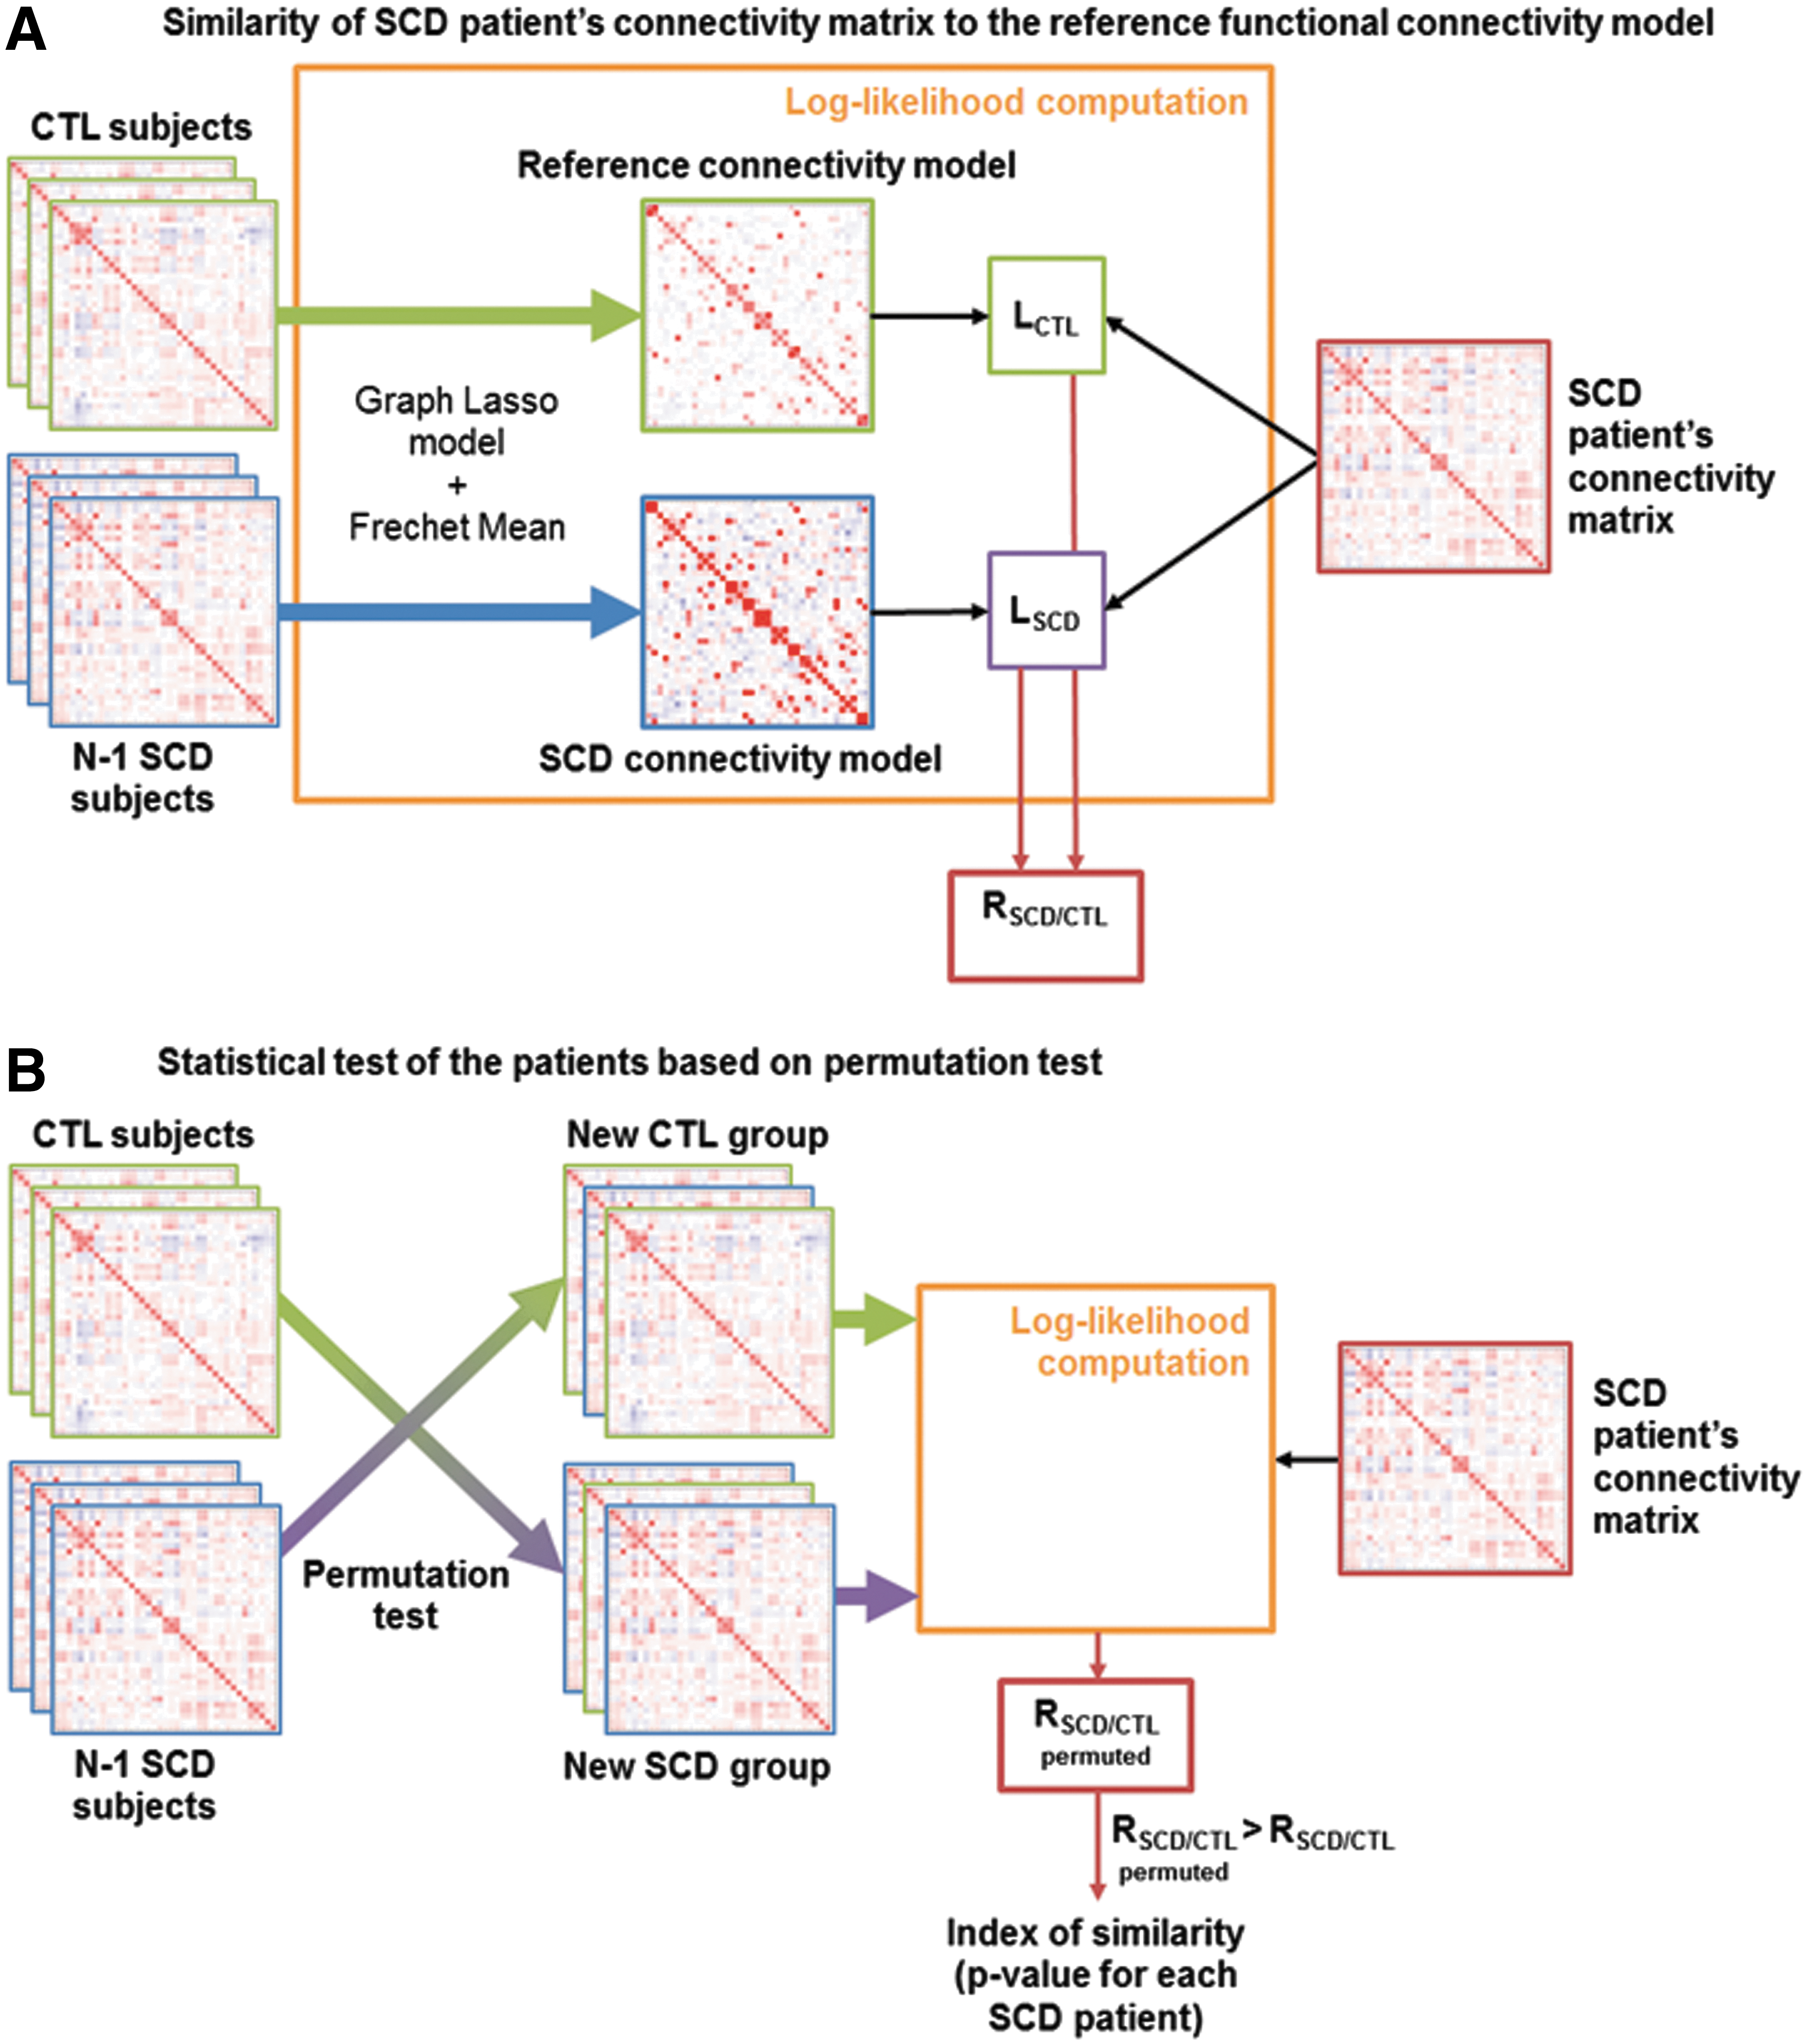
The fMRI connectivity analysis steps are illustrated in Figure 2. A robust sparse modeling framework was employed, associated with a cross-validation scheme to yield a descriptor of the reference functional connectivity structure for CTL, as proposed in Coloigner et al. (2016). Based on the empirical covariance matrix of each CTL subject, partial correlation—and hence a sparse network structure—was first estimated individually by using the graphical lasso. As described in Figure 2A, the resulting sparse functional brain networks were combined by group-averaging the individual network structures over the space of symmetric positive definite matrices by means of a Fréchet mean (Varoquaux et al., 2010). The resulting average network defines the reference connectivity model (Coloigner et al., 2016). For every patient, the reference SCD connectivity model was estimated by the same procedure from the remaining SCD connectivity matrices.
Overview of the method.
Then, the reference and SCD connectivity models determined earlier, respectively LCTL and LSCD, were applied to every SCD patient by using a likelihood ratio. We then computed RSCD/CTL, the log of the likelihood ratio of the individual connectivity matrix under the group model for SCD with respect to CTL.
As shown in Figure 2B, permutation tests were used to assess the p-value of every patient: Data were permuted by shuffling the subjects' labels (CTL or SCD), and then calculating the same logarithm of the ratio of likelihoods between permuted models. Finally, the p-value, called the index of similarity, was calculated for every SCD patient as the fraction of log-ratios that was at least as high as the original (nonpermuted) log-ratios statistic, which was derived from the correctly labeled data. Ultimately, this index of similarity reflects the degree of correspondence between each SCD patients' model and the reference connectivity model, with a p-value <5% indicating that the reference model is not appropriate to represent the connectivity of this SCD patient.
Results
Demographic and clinical characteristics
Demographic and clinical variables among SCD and CTL patients are given in Table 1. No significant differences between SCD and CTL participants were observed regarding age, gender, and education. The mean age of the entire sample was 22.1 ± 9.1, with participants ranging from 11.7 to 38.1 years old; 53% were female participants, and 82% had completed 12 or more years of education. In the CTL group, there was an insignificant gender imbalance (5 men, 16 women). Thirteen of the SCD patients were regularly receiving blood transfusions. Hemoglobin levels were 10.1 ± 2.0 in the nontransfused SCD patients, 9.3 ± 0.9 in the transfused SCD patients, and 13.9 ± 1.2 in the CTL patients. The median hemoglobin S percentage was 70.2% in the nontransfused SCD group, whereas this quantity was reduced to 28.5% in the transfused SCD group.
All results except gender are given as mean ± SD. The Chi-square test was used for gender (M for male and F for female) and genotype (AA, AS, SS, and SC). Other demographic and laboratory parameters were compared by using Student's test. Bold text indicates a statistically significant difference. Maternal educational attainment was assessed by asking patients to choose their highest educational level completed from the following choices: 1 = less than high school; 2 = high school or General Educational Development completed; 3 = some college or technical school; 4 = college graduate; and 5 = graduate school.
BMI, body mass index; BSA, body surface area; BSP, systolic blood pressure; CBF, cerebral blood flow; CTL, control; DBP, Diastolic blood pressure; GM, gray matter; HR, heart rate; SCD, sickle cell disease; SD, standard deviation; WM, white matter; WMH, white matter hyperintensities.
The SCD patients had higher CBF values (range: 57.1–123.5 mL/min/100 g, 25% < 73.6 mL/min/100 g, and 75% > 109.3 mL/min/100 g), compared with CTL subjects (range: 43.1–78.1 mL/min/100 g, 25% < 53.0, median = 63.3 mL/min/100 g, and 75% > 69.2 mL/min/100 g), consistent with previous reports (Bush et al., 2016). Quartiles of hematocrit were as follows: 24.4%, 26.9%, and 30% in SCD and 37.8%, 39.9%, and 42.4% in CTL.
Structural results
All 27 subjects had normal MR angiograms other than mild tortuosity in some of the older subjects. Regional changes in brain volume are summarized in Table 1. After adjusting for age, sex, and education level, most of the brain structures in the SCD group had reduced WM and GM volumes (i.e., negative t-score); however, none of the GM volume differences reached statistical significance The structures with significant WM loss (p < 0.05) were distributed across the entire brain, primary in frontal, parietal, and temporal lobes. Paradoxically, a small increase in WM volume was observed in the insula (p = 0.017). Total pial surface area was slightly decreased in SCD patients; on segmental analysis, only the parietal lobe remained significant. Cortical thickness was not different either globally or regionally.
Abnormal WMH were documented in 2 out of 21 CTL patients and in 7 out of 27 SCD patients. The number of lesions ranged from 3 to 18, and none of them were larger than 5 mm. Lesions were more common in the fronto-parietal white matter, consistent with previous descriptions (Ohene-Frempong et al., 1998).
Functional analysis
First, the healthy brain functional connectivity model was estimated from the 18 CTL subjects (three other CTL subjects are included into a separate test set) by using the robust learning scheme based on a graphical lasso model whose hyperparameter is fixed within a cross-validation scheme. Figure 3A displays the partial correlation model, giving a descriptor of reference functional connectivity. Compared with the empirical covariance matrices of the subjects, we observed that the reference connectivity model is sparser, as expected. Indeed, only direct connections between two ROIs are represented in the inverse covariance matrix. Some well-defined networks were activated, such as the default mode network, executive CTL network, visuospatial network, visual networks, and salience network.
A graphical representation of the connections for the atlas-based ROIs is shown in Figure 3B. It shows strong contralateral functional links between homologous areas across the entire brain: Each region tends to be functionally connected with its corresponding region in the opposite hemisphere. We also observed a dorsal stream network linking the medial prefrontal cortex (called frontal DMN in MSDL atlas) with the cingulate cortex. Indeed, the sagittal view of the Figure 3B shows the connections between the dorsolateral prefrontal cortex and the posterior parietal cortex, implicated, in particular, in the default mode network. The analysis also revealed a ventral stream linking the precuneus with the right tempoparietal junction (R TPJ as defined in MSDL atlas) and the inferior temporal cortex.

Reference connectivity model:
This estimated model was applied to the connectivity maps of 27 SCD patients and 3 healthy subjects (Fig. 4). Four patients had a similarity index (p-value) <5%, leading to the conclusion that the reference brain connectivity learned on CTL subjects was not adequate to describe these patients. Their connectivity maps were visually inspected to identify some differences, which could explain these results. Unfortunately, their connectivity patterns appeared similar. This suggests that the main network such as the default mode network, executive CTL network, visuospatial network, visual networks, and salience network are activated but with altered connectivity strengths.
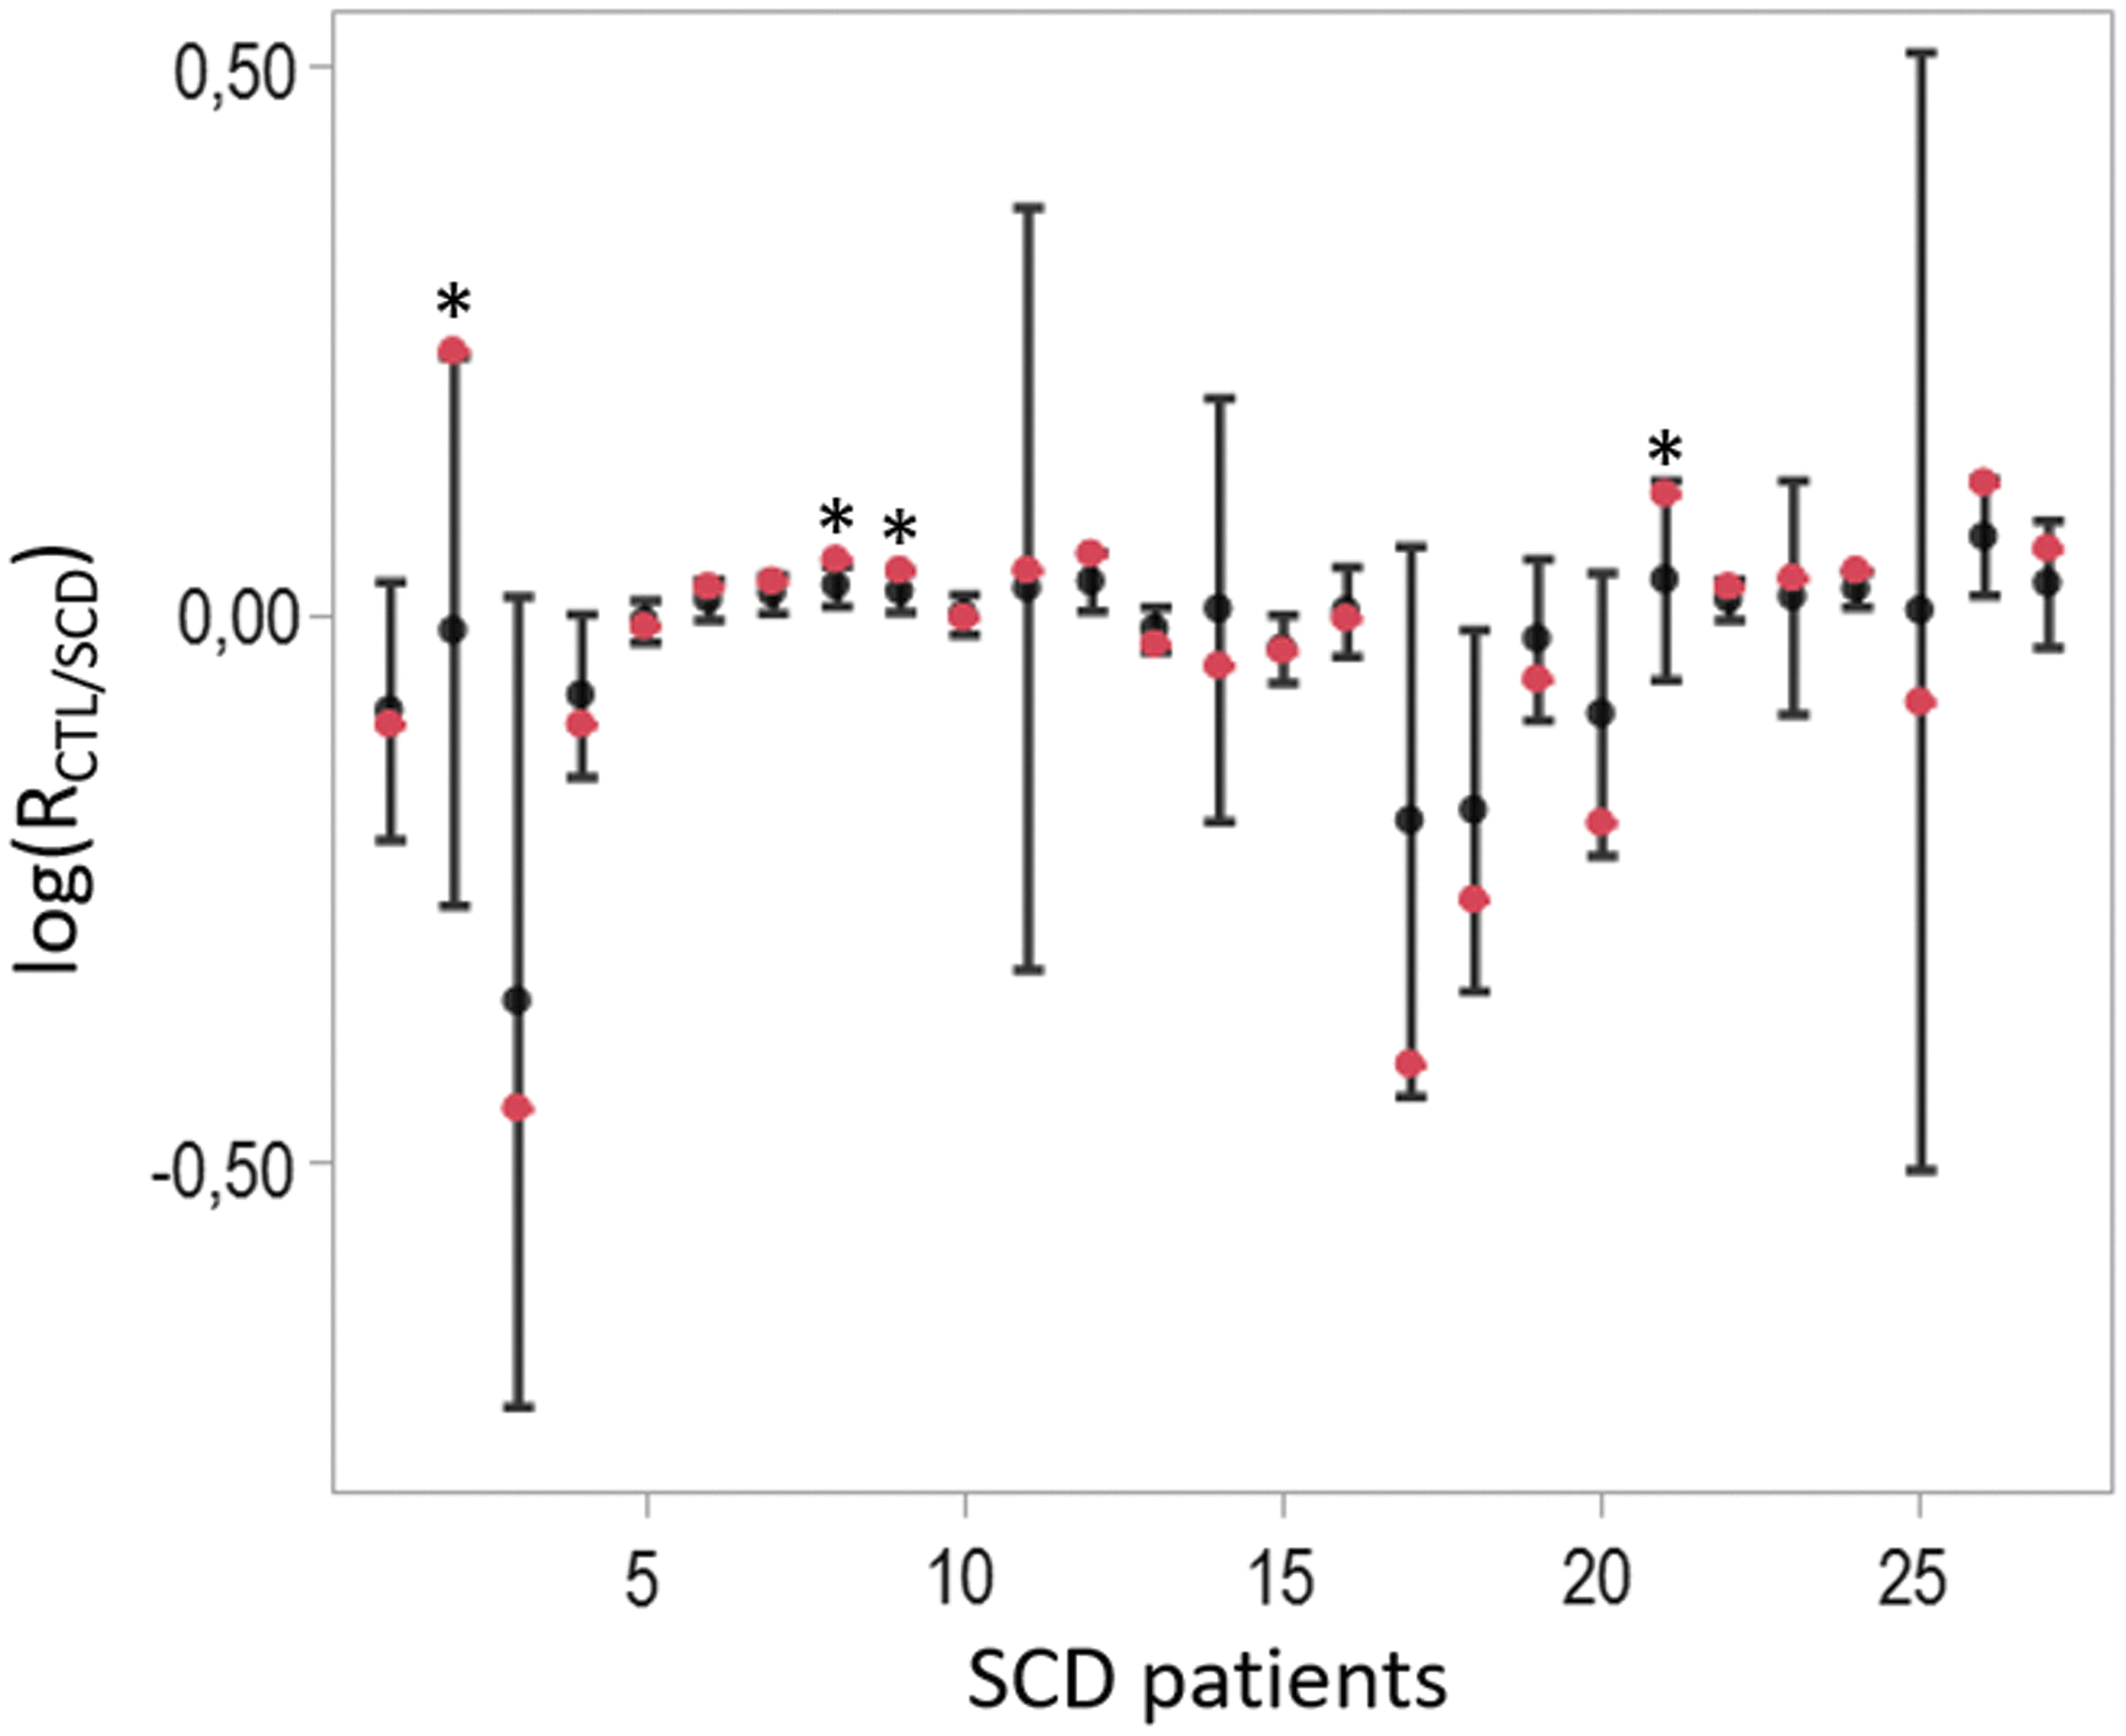
Boxplot of the ratio of log-likelihood for each patient with SCD. Each box visually represents the mean and standard deviation of the log-likelihood between the individual connectivity matrix and both SCD/CTL models, obtained for all permutations. The original (nonpermuted) log-ratio statistics, which were derived from the correctly labeled data, are shown in red. CTL, control.
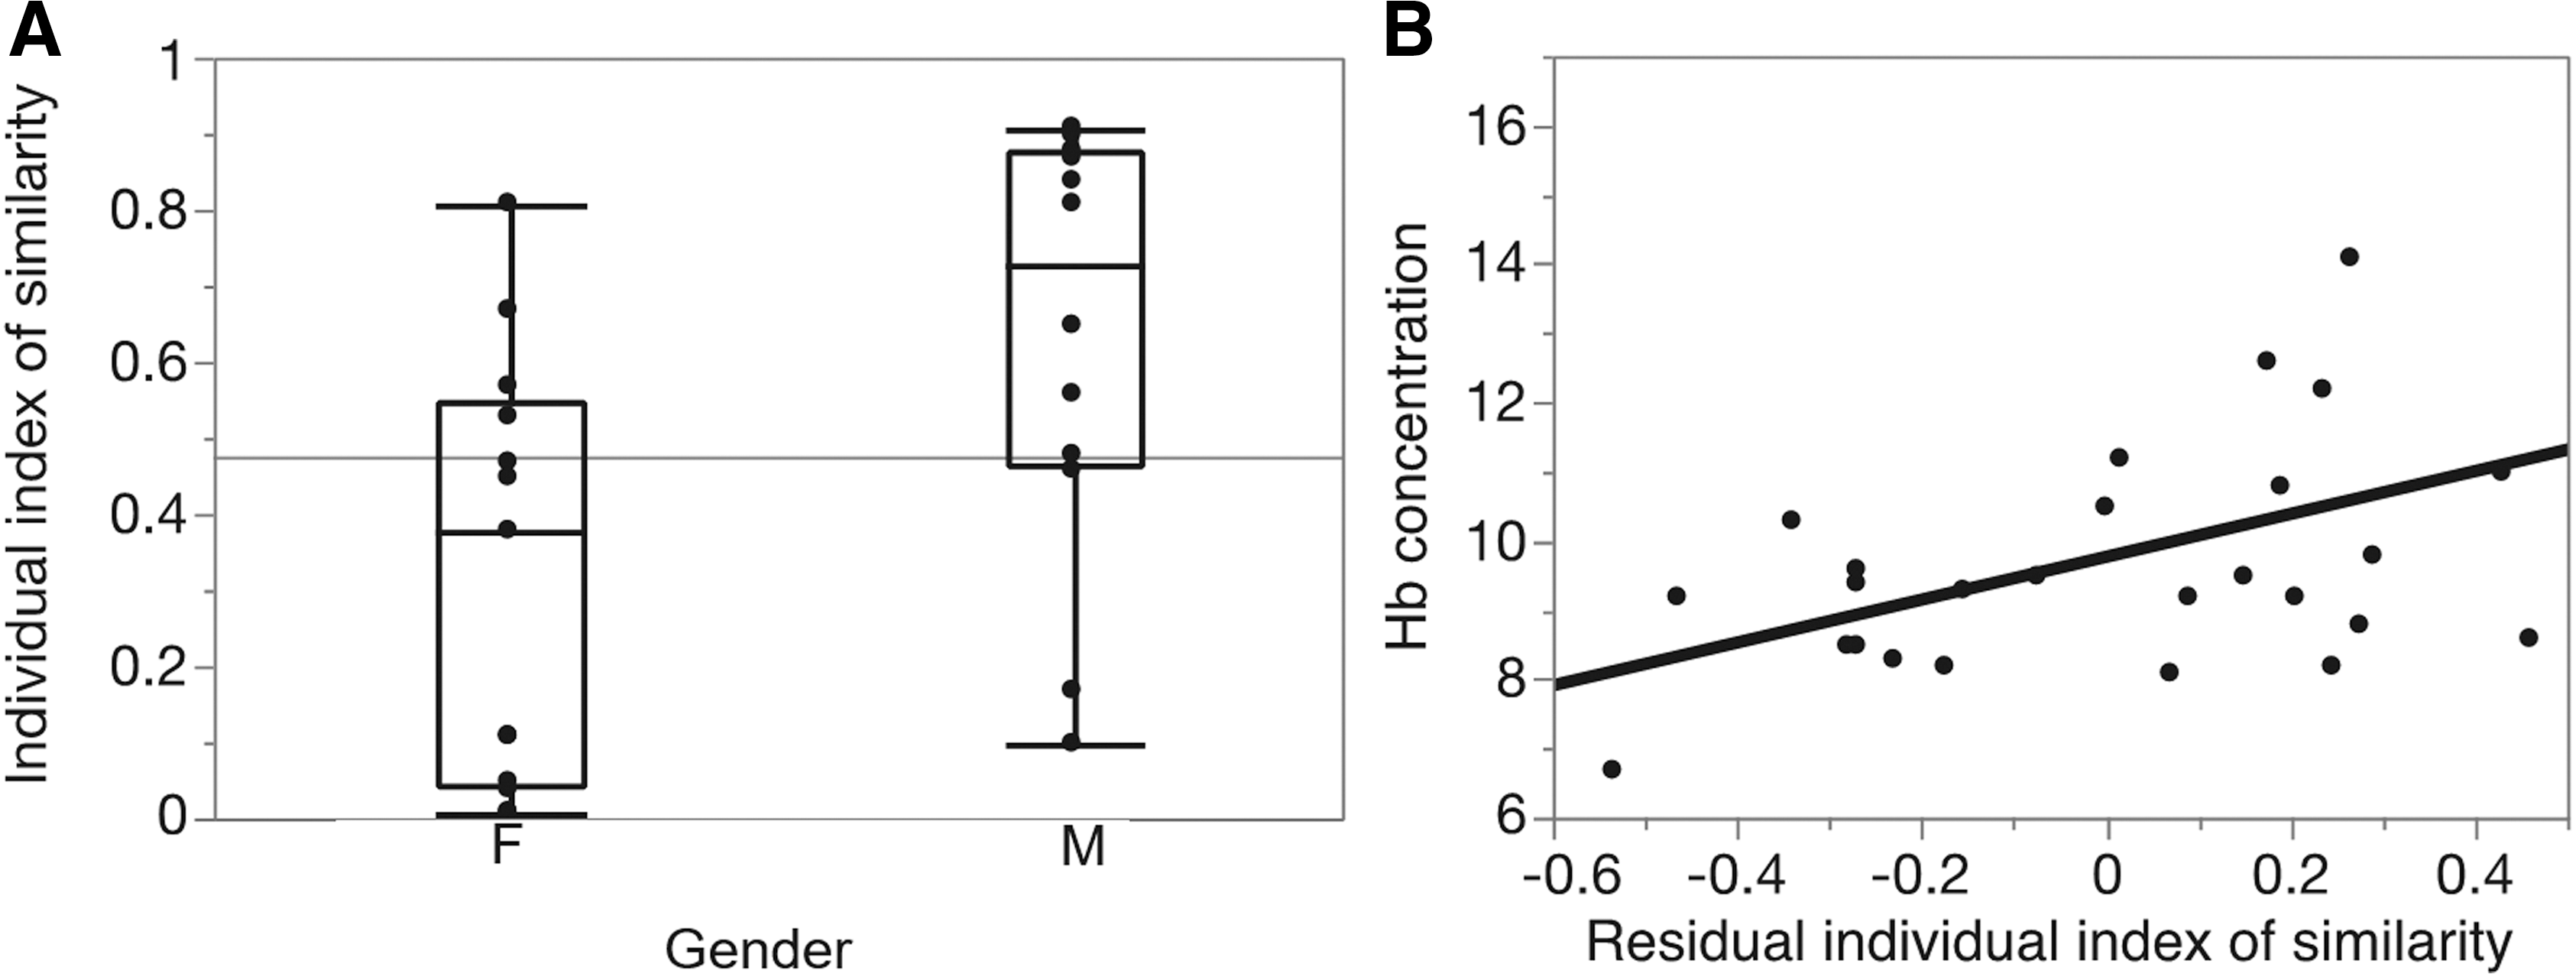
Moreover, the result of the permutation test suggested that the model learned on CTL subjects is no less adequate (in the maximum likelihood sense) to describe most SCD patients as is the group template of SCD patients, with a high p-value (p = 0.35 using a Fisher test). Three healthy subjects are also included into our test set. We obtain p values equal to 0.58, 0.49, and 0.65 [log(RSCD/CTL) = −0.07 ± 0.017, log(RSCD/CTL) = −0.13 ± 0.04 and log(RSCD/CTL) = −0.03 ± 0.05]; hence, the reference model learned on the other CTL subjects seems to be slightly more adequate to describe these healthy subjects. Finally, as displayed in Figure 5, the individual similarity index of the connectivity analysis for the SCD patients showed significant gender-related differences (0.32 ± 0.28 for the women vs. 0.63 ± 0.28 for the men, p = 0.01).
Similarity index results.
Relationship with structural measurements and laboratory data
To probe for physiologic predictors of the network analysis, correlation analysis was performed between connectivity results and structural and blood measurements. The similarity index was independent of hemolysis markers, white blood cells, platelets, hemoglobin S%, or hemoglobin F%. Hemoglobin (and hematocrit) did correlate with similarity after correction for sex differences (Fig. 5B). Patients with the lowest hemoglobin level exhibited the least similarity to the reference connectivity model.
Second, the importance of WMH in the SCD patients, which are a bio-marker of the pathology, translated into significant similarity index differences. Indeed, after controlling for gender, patients with WMH have a significantly lower similarity index (p-value = 0.03). Despite the large differences in WM volume between the SCD and CTL subjects, the similarity index was independent of white matter volume (with or without age/sex correction). However, white matter volume and WMH were statistically independent of one another. After controlling for gender, patients with WMH demonstrated a significantly lower similarity index (p-value = 0.03).
Although SCD patients did not have statistically significant differences in GM or total brain volume, the similarity index was positively correlated with both these parameters (p = 0.0091 for total volume and p = 0.0048 for GM volume). However, these differences were inextricably linked to gender (r2 = 0.32 for GM volume, 0.28 for gender); inclusion of either parameter was mutually exclusive of the other.
Discussion
To our knowledge, this is the first resting connectivity study analyzing SCD patients as individuals and linking their brain connectivity with blood markers of disease severity. A graphical lasso method was used for estimating partial correlations between brain regions, thereby inferring functional networks in fMRI data. Using L1-norm regularization provides sparse solutions and, hence, facilitates the interpretation of the estimated networks. This method identified physiologically plausible connectivity graphs in the CTL and SCD groups, consistent with previously published network models (Belilovsky et al., 2015; Varoquaux and Craddock, 2013; Varoquaux et al., 2011). A descriptor of reference brain connectivity was estimated by group-averaging the connectivity matrices of the CTL subjects by using a Fréchet mean.
Given the increased brain blood flow, high prevalence of white matter damage, and neurocognitive deficits observed in SCD patients, we postulated that these patients would manifest differences in resting connectivity patterns. By using permutation analysis, we assessed the accuracy of reference brain connectivity learned on the CTL group for every patient. Only 4 out of 27 patients were not appropriately described by the reference connectivity model (at p < 0.05), which was not statistically significant for the group. This suggests that despite the early onset of neurologic stressors and damage, the fundamental functional brain “wiring” in SCD is not disrupted.
Nonetheless, the individual index of similarity index had two correlates, hemoglobin and gender, which may have important physiologic underpinnings. Patients with SCD compensate for their anemia by increasing their resting brain blood flow, thereby maintaining normal oxygen delivery at rest (Bush et al., 2016). However, high resting CBF impairs cerebrovascular reserve (Prohovnik et al., 2009), leaving the brain vulnerable to ischemic brain injury during common stressors such as hemoglobin desaturation (Hollocks et al., 2012; Kirkham et al., 2001; Quinn et al., 2009) (e.g., sleep apnea), decreased hemoglobin (e.g., bleeding or acute hemolysis), and increased cerebral metabolic rate (e.g., fever, seizure). Thus, severity of anemia represents a risk factor for brain damage (DeBaun et al., 2012) and, thus, it is not surprising that low hemoglobin correlated with dissimilar resting-state network connectivity, regardless of gender. In fact, low hemoglobin has previously been reported to be a strong biomarker for disease severity and death in SCD (Lebensburger et al., 2012; Miller et al., 2000).
Unlike the hemoglobin association, the large gender difference in individual similarity index was unexpected, particularly since women made up a larger fraction of the CTL group. Further, the direction of the effect was opposite of what we expected. Men with SCD typically have more severe white matter disease (Land et al., 2016), impaired neurocognitive function (Land et al., 2015), and death (Platt et al., 1994). We speculate that the differences may reflect a differential vulnerability to early ischemic events. Male and female brains mature differently in adolescence with respect to timing, location, and amount of synaptic pruning (Herting et al., 2015; Vijayakumar et al., 2016; Willing and Juraska, 2015). In women, the process begins significantly earlier than for men (Lim et al., 2015), which increases the likelihood that chronic anemia and ischemic insults could modify synapse consolidation in the developing brain. Although SCD patients are anemic their whole lives, their cerebral metabolic demands, resting CBF, and stroke risk are highest in the school aged years, peaking at 6–10 years of age when cerebral vascular reserve is at its nadir (Ohene-Frempong et al., 1998; Prohovnik et al., 1989). Thus, women initiate synaptic pruning at a time of greatest cerebral vulnerability. In the presence of a known stressor (anemia), the greater dissimilarity from controls found in female brains could represent more damage to the “standard” connections, compensatory promotion of alternative connections, or both.
After controlling for gender differences, similarity index was lower in patients having WMH, suggesting a plausible link between brain damage and disrupted resting-state connectivity. WMH, also known as silent strokes, are lesions between 3 and 10 mm in size observed on T2-weighted imaging and lack overt neurological symptoms. However, they are associated with an increased risk of neurocognitive deficits, dementia, and death (Debette and Markus, 2010). The frequency and distribution of WMH in our study were comparable to previous reports (Moser et al., 1996). A significant difference of hemoglobin level between SCD patients with and without WMH confirms that the more anemic patients have a higher risk for silent strokes. After removing the effect of the hemoglobin, no significant difference was observed between the similarity index of SCD patients with and without WMH. Indeed, due to this existing correlation, it is not possible to separate the effect of these two confounded predictors.
The study has some important limitations. The study cohort size is modest, limiting our ability to detect subtle connectivity differences. Our study includes teenagers and young adults in whom natural brain maturation is occurring. Although our cohorts were age matched, we are underpowered to investigate the impact of normal age effects. Another investigation will be needed to determine whether connectivity changes are associated with poorer neurocognitive performance. Even though we observe plausible associations with similarity index, it is impossible to make direct causal inferences between similarity index and structural, blood, or functional measures. Nevertheless, our observations provide insights for future studies and suggest a novel metric to study response to therapies.
Conclusion
In this article, the effect of SCD on resting-state connectivity was quantified by using robust learning schemes. The study is unique in characterizing network similarity across individuals and linking connectivity metrics with structural and blood measurements. Reference brain networks were not appropriate to model resting-state activity from only 15% of patients, indicating that most of the SCD subjects do not differ in terms of connectivity from CTLs. After controlling for the gender, two separate predictors of this individual similarity index were the anemia and WMH (silent stroke). Patients having WMH have the least similarity to the reference connectivity model, suggesting a plausible link between brain damage and disrupted resting-state connectivity. Moreover, a significant difference of hemoglobin level between SCD patients with and without WMH confirms that the more anemic patients have a higher risk for silent strokes, leading to network dissimilarities. Based on these results, the dissimilarities found by the proposed method could reflect pathological changes, compensatory mechanisms to chronic anemia, or a combination of the two.
Footnotes
Acknowledgments
This work was supported by the National Heart Lung and Blood Institute U01 HL117718 and by the National Institute of Clinical Research Resources through the Clinical Translational Science Institute at CHLA (5UL1 TR000130-05). Philips Healthcare provided support for protocol development and applications engineering on a support-in-kind basis.
Author Disclosure Statement
No competing financial interests exist.