
Abstract
Electroencephalography (EEG) spikes and focal epileptic seizures are generated in circumscribed cerebral networks that have been insufficiently described. For precise time and spatial domain network characterization, we applied in patients with focal epilepsy dense array 256-channel EEG recordings with causal connectivity estimation by using time-resolved partial directed coherence and 3T-magnetic resonance imaging-derived cortical and thalamus integrity reconstruction. Before spike generation, significant theta and alpha bands driven information flows alterations were noted from both temporal and frontal lobes to the thalamus and from the thalamus to the frontal lobe. Medial dorsal and ventral anterior nuclei of the thalamus were delimited as possible pacemakers. Markedly reduced thalamic volumes and impaired cortical integrity in widespread areas predicted the altered information flows. Our data reveal distinct patterns of connectivity involving the thalamus and frontal cortex that are both directly and causally involved in spike generation. These structures might play an essential role in epileptogenesis and could be targeted in future therapeutic approaches.
Introduction
F
We hypothesize (1) frequency- and time domain-specific changes in connectivity before spike generation and (2) clear structural abnormalities involving the epileptogenic network that are related to the long-range synchronization and not solely to the primary focus.
Methods
Ethics statement
The study protocol was approved by the local ethical board at the National Center of Epileptology institutional review board, Chisinau, Moldova.
Participants
Fifteen patients (mean age ± standard deviation: 28.1 ± 8.3 years, 9 men) with focal epilepsy (12 TLE patients) without seizures in the month before investigation and 15 age-matched healthy subjects (27.9 ± 4.0 years, 7 men) were included. The diagnosis of epilepsy was established on the basis of clinical history and electroencephalography (EEG) findings according to revised International League Against Epilepsy (ILAE) classification (Berg et al., 2010). The recruited patients were referred to the National Center of Epileptology, Chisinau, Moldova. The demographic and clinical characteristics of each patient are summarized in Table 1. The analysis pipeline is presented in Figure 1.
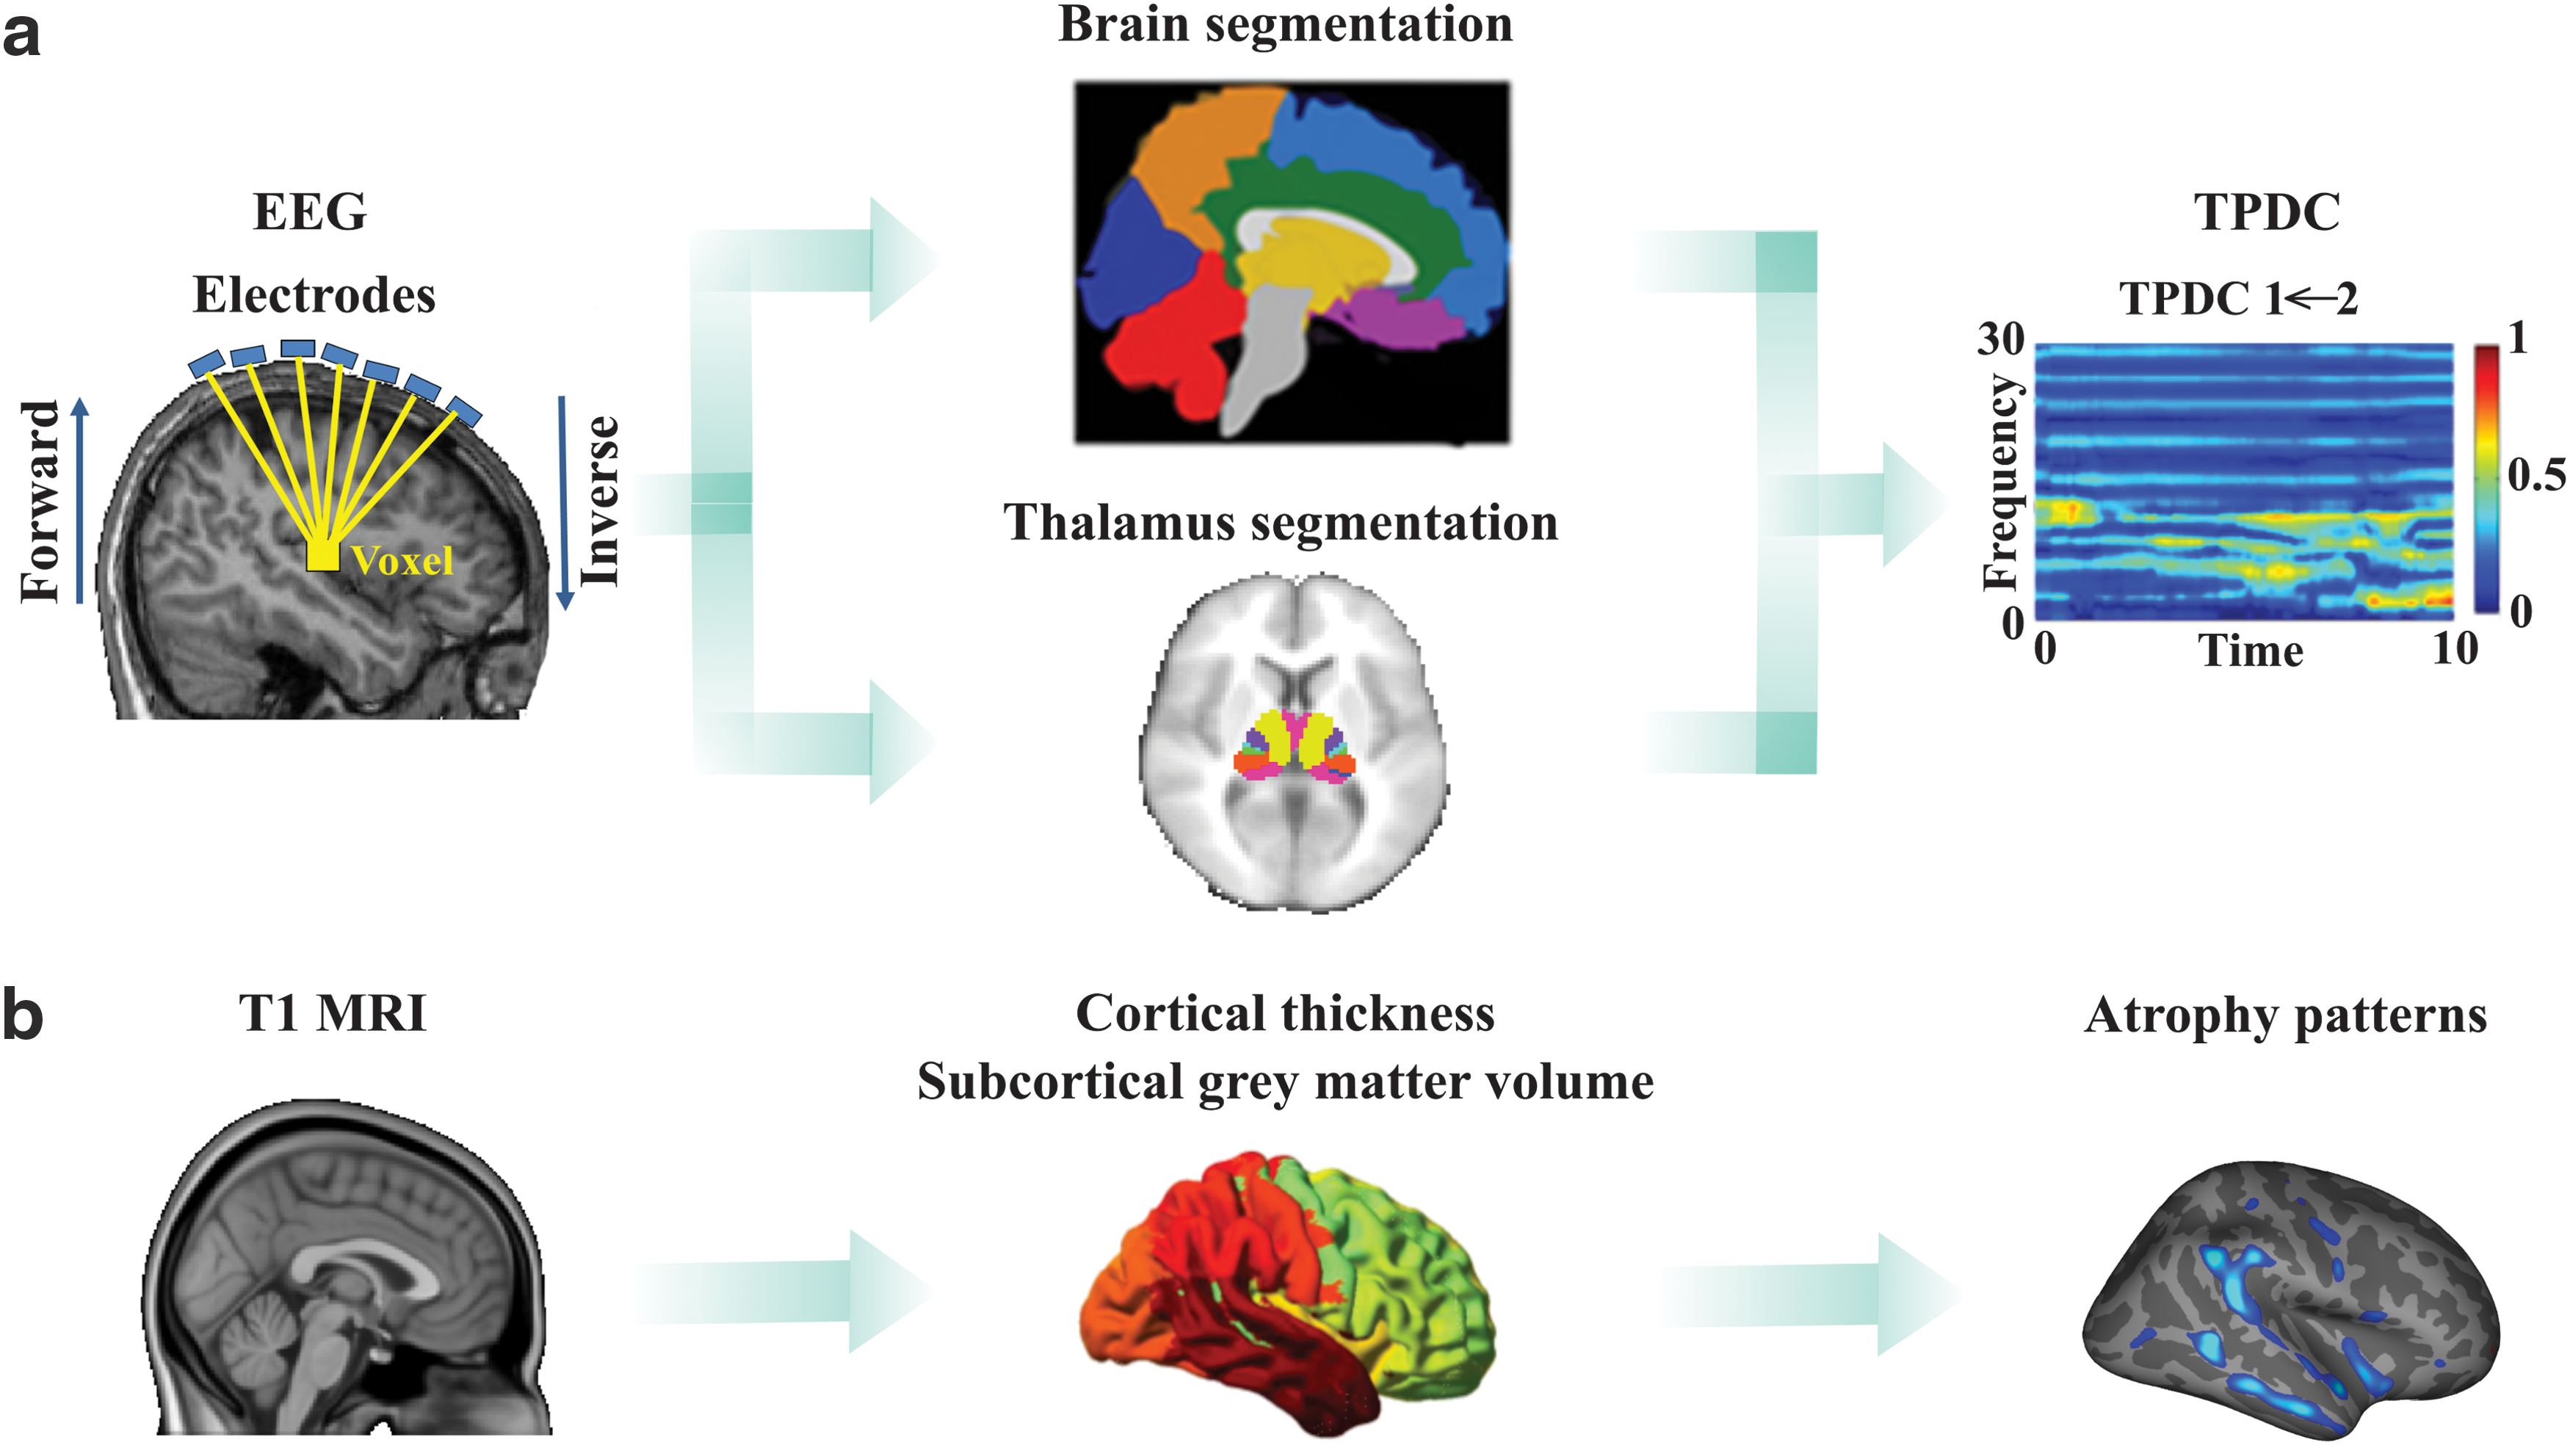
Overview of the analysis pipeline:
AEDs, antiepileptic drugs; BCS, bilateral convulsive seizures; CBZ, carbamazepine; DS, dyscognitive seizures; EM, encephalomalacia; EMS, elementary motor seizures; GMH, gray matter heterotopia; L, left; LCM, Lacosamide; LEV, levetiracetam; LTG, lamotrigine; MRI, magnetic resonance imaging; MTS, mesial temporal sclerosis; PHG, parahippocampal gyrus; R, right; WM, white matter, VPA, valproate.
EEG data acquisition
We performed interictal dense array video EEG of epilepsy patients at rest and in an alert state for 2 h in a dimly lit and quite room. The EEG electrodes were included in a cap, with 20–25 mm interelectrode distances placed according to the international 10/5 system (Jurcak et al., 2007) (Hydrogel Geodesic Sensor Net 130 routine, 256 electrodes, Electrical Geodesic, Inc., Eugene, OR). The sampling rate was 1000 Hz, with low and high frequency filters (0.3 and 70 Hz, respectively) and stored using Net Station 5 software package (Electrical Geodesic) and in reference to anatomical landmarks. The sampling rate was 1000 Hz. Net station 5 software package (Electrical Geodesic) was used to filter the data at 0.3 Hz high pass and 70 Hz low pass filters respectively. The obtained electrodes’ impedance was below 10 kΩ. All patients were under continuous observation throughout the recording.
Magnetic resonance imaging data acquisition
Structural magnetic resonance imaging (MRI) data were acquired by using a 3T SIEMENS Skyra scanner, with a 32-channel head coil (Wellmer et al., 2013). T1-weighted images (repetition time [TR] = 2000 msec, echo time [TE] = 9 msec, 4 mm slice thickness, flip angle = 150°), T2-weighted images (TR = 3800 msec, TE = 117 msec, 4 mm slice thickness, flip angle = 190°), and fluid-attenuated inversion recovery sequences were acquired.
Data processing
EEG preprocessing and analysis was performed by using FieldTrip toolbox and in-house Matlab scripts. Muscle artifacts were first removed by using manual data inspection by an experienced neurophysiologist. An infomax Independent Component Analysis (ICA) (Delorme and Makeig, 2004) was then applied and ICA components were profiled by their topography, activation time course, and spectrogram. Components clearly assigned to, for example, rarely occurring eye blinks (Jung et al., 2000) were excluded from the back projection. EEG spikes from all scalp channels were then transformed to the average reference (Lehmann and Skrandies, 1980), and EEG segments with remaining artifacts were removed. Typical interictal spikes with the same morphology were marked manually at the time of maximum positivity or negativity, the detected spikes were checked individually, and some were excluded. In turn, interictal events such as polyspikes or spikes riding on a preceding slow wave were also rejected to avoid preonset baseline contamination. For each patient, 5–10 interictal spikes were selected. The EEG signal was parsed 15 sec before the spike peak for each patient separately. The time interval of 10 sec before the spike was defined as the activation period, and the time period from 10 to 15 sec before the spike was defined as the baseline period for all the following analyses. Source power and synchronization analysis (see section Source analysis) across all sources was examined at theta (4–7 Hz), alpha (8–13 Hz), and beta (14–30 Hz) frequency bands separately.
Source analysis
A full description of the coherence analysis is given elsewhere (Michels et al., 2013; Muthuraman et al., 2012). There are two major constraints in this analysis: First, the analysis is created on a single dipole model, which is not linearly correlated to other dipoles and second, the signal-to-noise ratio must be sufficiently high (Groß et al., 2001). The fixed dipole model was used in which the dipole source responsible for the measured EEG potentials during an epoch remains at a constant location, the dipole moment vector maintains a constant orientation throughout the epoch, and only the magnitude varies. The output of the beamformer at a voxel in the brain can be defined as a weighted sum of the output of all EEG channels (Van Veen et al., 1997). The weights determine the spatial filtering characteristics of the beamformer and are selected to increase the sensitivity to signals from a voxel and reduce the contributions of signals from (noise) sources at different locations. The frequency components and their linear interaction are represented as a cross-spectral density matrix. To visualize power at a given frequency range, a linear transformation was used based on a constrained optimization problem, which acts as a spatial filter (Van Veen et al., 1997). The spatial filter was applied to a large number of voxels covering the entire brain, assigning a specific value of power to each voxel. A voxel size of 5 mm was used in this study. The beamformer weights for a given source (at a location of interest) are determined by the data covariance matrix and the forward solution (lead-field matrix [LFM]). The LFM was estimated with specified models for the brain. In this study, the brain was modeled by a boundary element method (Fuchs et al., 2002) with three layers, namely brain, skull, and skin. The volume conductor model was created by using individual T1 magnetic resonance images. Part of the forward modeling and the source analysis were done by using the open source software FieldTrip (Oostenveld et al., 2011). For both groups, the head was modeled by using the electrode locations based on the anatomical landmarks. The LFM contains information about the geometry and conductivity of the model. The complete description of the solution for the forward problem has been previously described (Muthuraman et al., 2010, 2014).
The brain regions were defined according to the Automatic Anatomic Labeling Atlas 116 regions of interest (ROIs) (Whitfield-Gabrieli and Nieto-Castanon, 2012). To address major anatomically relevant regions, the ROIs were subdivided into seven separate regions, namely prefrontal, frontal, parietal, occipital, temporal, thalamus, and cerebellum. The thalamus parcellation was done based on the connectivity probability to cortical masks (Behrens et al., 2003; Jones, 2012). The activated voxels were selected by a within-subject surrogate analysis to define the significance level, which was then used to identify voxels in the regions as activated voxels. Once brain region voxels were identified, their activity was extracted from the surface EEG (source space). In a further analysis, all the original source signals for each region with several activated voxels were combined by estimating the second-order spectra and employing a weighting scheme depending on the analyzed frequency range to form a pooled source signal estimate for each region as previously described (Amjad et al., 1997; Rosenberg et al., 1989). For estimating the relative signal-to-noise ratio (SNR), the power in the frequency bands (theta, alpha and beta) was considered as signal and the power in the frequency band of 100–200 Hz from the averaged epochs (5–10 epochs per patient) was considered as noise. We have also estimated the orientation of dipoles in the thalamus voxels to justify the dipole orientation. From the number of activated voxels the principle orientation was calculated and normalized by the orientations from the total number of activated voxels.
Connectivity analysis
Using time-frequency causality, we can not only focus on a particular frequency but also analyze the time dynamics of the causality at that frequency. Based on the state-space modeling, the time-frequency causality estimation method of time-resolved partial directed coherence (TPDC) utilizes dual-extended Kalman filtering (DEKF) (Haykin, 2001; Wan and Nelson, 2001). We can estimate the time-varying dependent autoregressive (AR) coefficients. One extended Kalman Filter (EKF) will estimate the states and feed this information to the other EKF; the second EKF will estimate the model parameters and will also share this information with the first EKF. By concurrently using two Kalman filters, working in parallel with one another, we can estimate both states and model parameters of the system at each time instance. After estimating the time-varying multivariate autoregressive (MVAR) coefficients, the next step is to use those coefficients for the calculation of causality between the time series. Since DEKF can give us the time-varying MVAR coefficients at each time point, we can calculate the partial directed coherence (PDC) at each time point as well. The general expression for the PDC is given as follows:
In Equation (1), π is the magnitude of PDC from time series j to i at frequency
The mean TPDC values for the significant connections from the different time windows were compared with a repeated-measure analysis of variance. The significance level was set to p < 0.05. Post hoc tests with Tukey-Kramer correction for multiple comparisons were applied.
Cortical thickness analysis
Cortical reconstruction and volumetric segmentation were performed with the Freesurfer image analysis suite (version 5.3.0), which is documented and freely available for download online (
To relate information flow changes and structure, we computed the difference (
Results
Clinical description
In this study, a total of 15 epilepsy patients and 15 age-matched healthy controls were analyzed. The healthy controls did not present any history of seizures or other neurologic abnormalities. There was no significant difference in age (p > 0.05) between the two cohorts. All patients except one were right handed. Thirteen patients had dyscognitive seizures, and three patients presented focal motor seizures with evolution in bilateral convulsive seizures. Among 15 patients, the radiological magnetic resonance imaging (MRI) assessment showed no morphological correlate in one case, and the others presented different structural lesions (Table 1).
Temporal dynamics of effective connectivity
The analysis of the focused frequency bands (theta, alpha, and beta) in the period before spike generation showed significant information flows only in theta (t = 4.06, p = 0.005) and alpha (t = 4.36, p = 0.003) frequency bands. These survived the data-driven surrogate significance analysis and will be discussed further in this section.
In patients, we detect a significant decrease in connectivity strength from temporal and frontal lobes to the thalamus and from the thalamus to the frontal lobe in the theta domain with a maximum peak 5 sec before spike generation (Fig. 2a). Moreover, just before spike appearance (in the last 4 sec), the connectivity from the temporal lobe to the thalamus increased significantly. Furthermore, we observed a similar pattern of connectivity dynamics in the alpha band (Fig. 2b). Here, we noticed a clear information flow increase from the temporal lobe to the thalamus that also peaked 5 sec before spike generation. A further significant breakdown of information flows between the temporal and frontal lobe to the thalamus was noted.

Temporal dynamics of effective connectivity in theta
The strength of temporo-thalamic connectivity change (5 sec before spike) significantly correlated with fronto-thalamic connectivity dynamics (r = 0.73, p = 0.001). In the same band and time window, the thalamo-frontal connectivity values showed no significant interrelations with temporo-thalamic (p = 0.06) and fronto-thalamic (p = 0.5) connectivity variations.
In the alpha band, thalamo-frontal connectivity correlated significantly with the modulation of fronto-thalamic (r = 0.63, p = 0.01) and not significantly with the temporo-thalamic (p = 0.7) information flows. Temporo-thalamic connectivity also did not correlate with the fronto-thalamic connectivity dynamics (p = 0.5).
No other significant changes of connectivity were noted between the further analyzed cerebral regions (i.e., occipital, parietal, prefrontal).
In healthy subjects for the analyzed frequency bands (theta, alpha, and beta), we found significant information flows only in the alpha frequency band. Bidirectional connections were attested between the frontal lobe and the thalamus (t = 4.01, p = 0.006) and between frontal and parietal lobes (t = 4.16, p = 0.004) that survived the data-driven surrogate significance analysis. In the analyzed time window of 10 sec, no significant changes in information flows were detected for these connections, which were stable over the entire time interval.
Thalamic parcellation-related connectivity dynamics
In the theta frequency band, we found significant bidirectional connections from the medial dorsal and ventral anterior thalamus to the frontal lobe (Fig. 3). The temporal dynamics of connectivity changes were similar to the changes of connectivity involving the entire thalamus structure mentioned earlier. In the alpha frequency band, we see a similar breakdown of the connectivity strength involving the frontal lobe and the medial dorsal and ventral anterior nuclei of the thalamus (Fig. 4). A significant reduction in information flows was detected ca. 5 sec before spike generation from the temporal lobe to the anterior, lateral, and inferior nuclei of the pulvinar of the thalamus, as shown in Figures 5 and 6. The relative SNR for each of the frequency bands was above 30 decibel (dB), and only those epochs were chosen which had a relative SNR greater than 30 dB and the orientation of dipoles was in all the subjects radial (above 75%) that additionally supports the argument for visualizing deeper thalamic sources (see Supplementary Table S1; Supplementary Data are available online at

Connectivity dynamics in theta frequency band from the frontal lobe to the medial dorsal nucleus of the thalamus
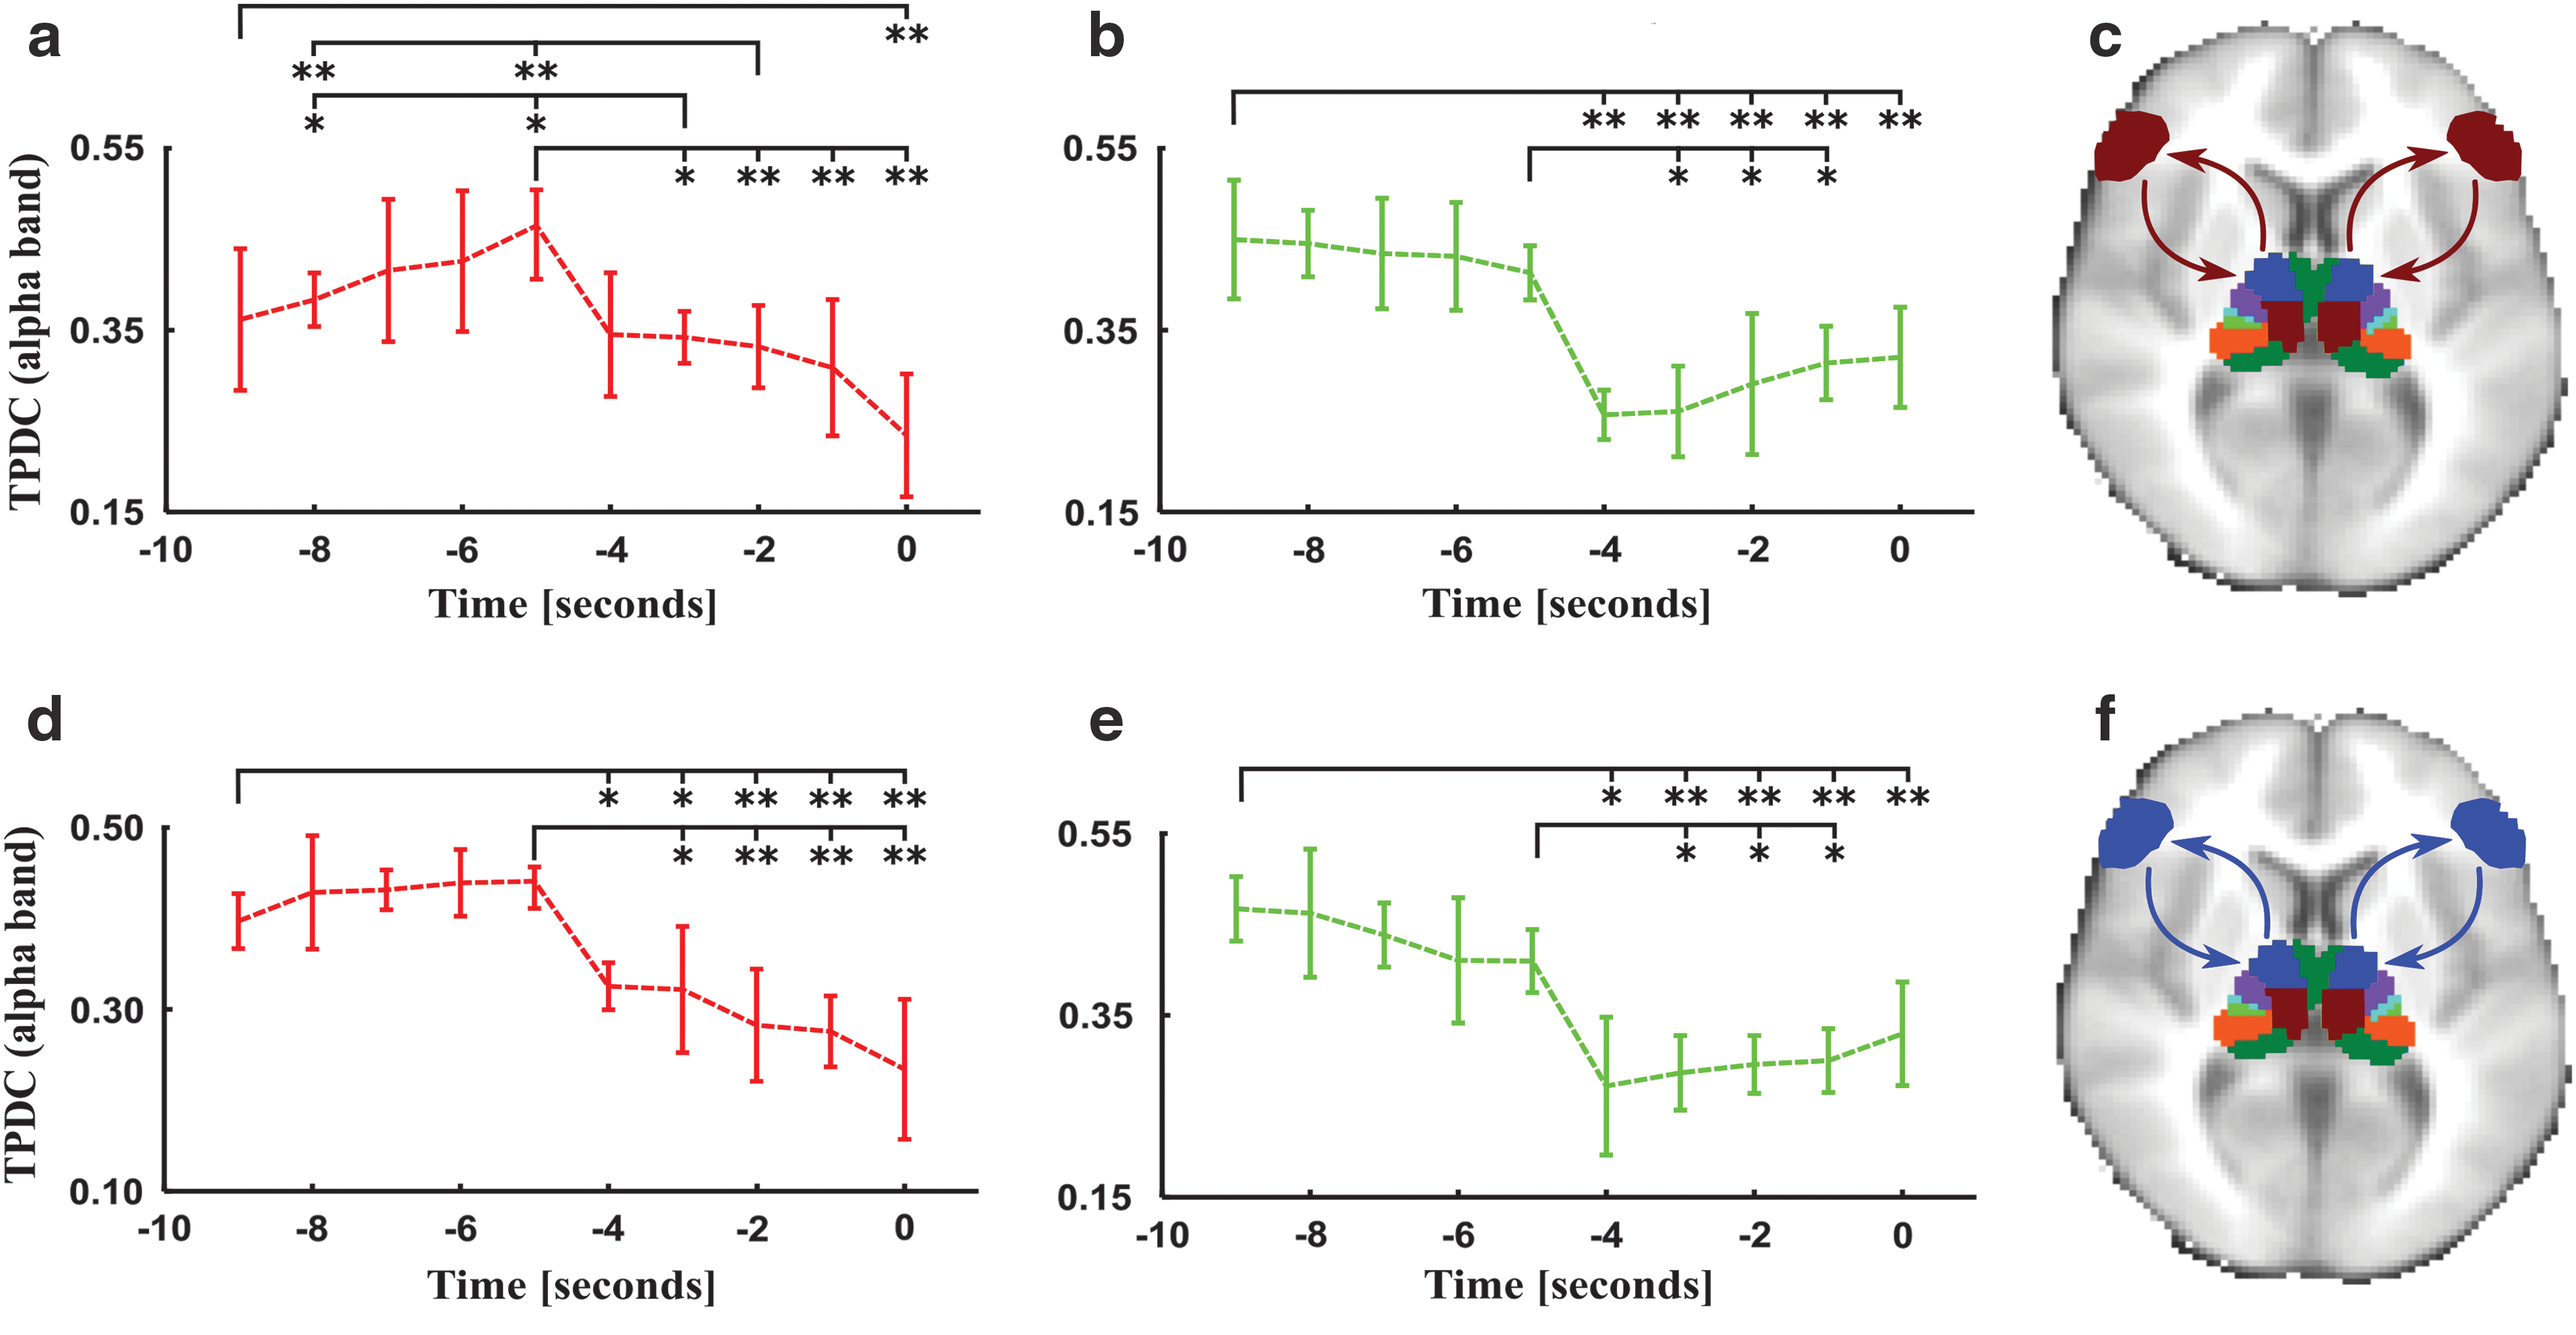
Connectivity dynamics in alpha frequency band from the frontal lobe to the medial dorsal nucleus of the thalamus
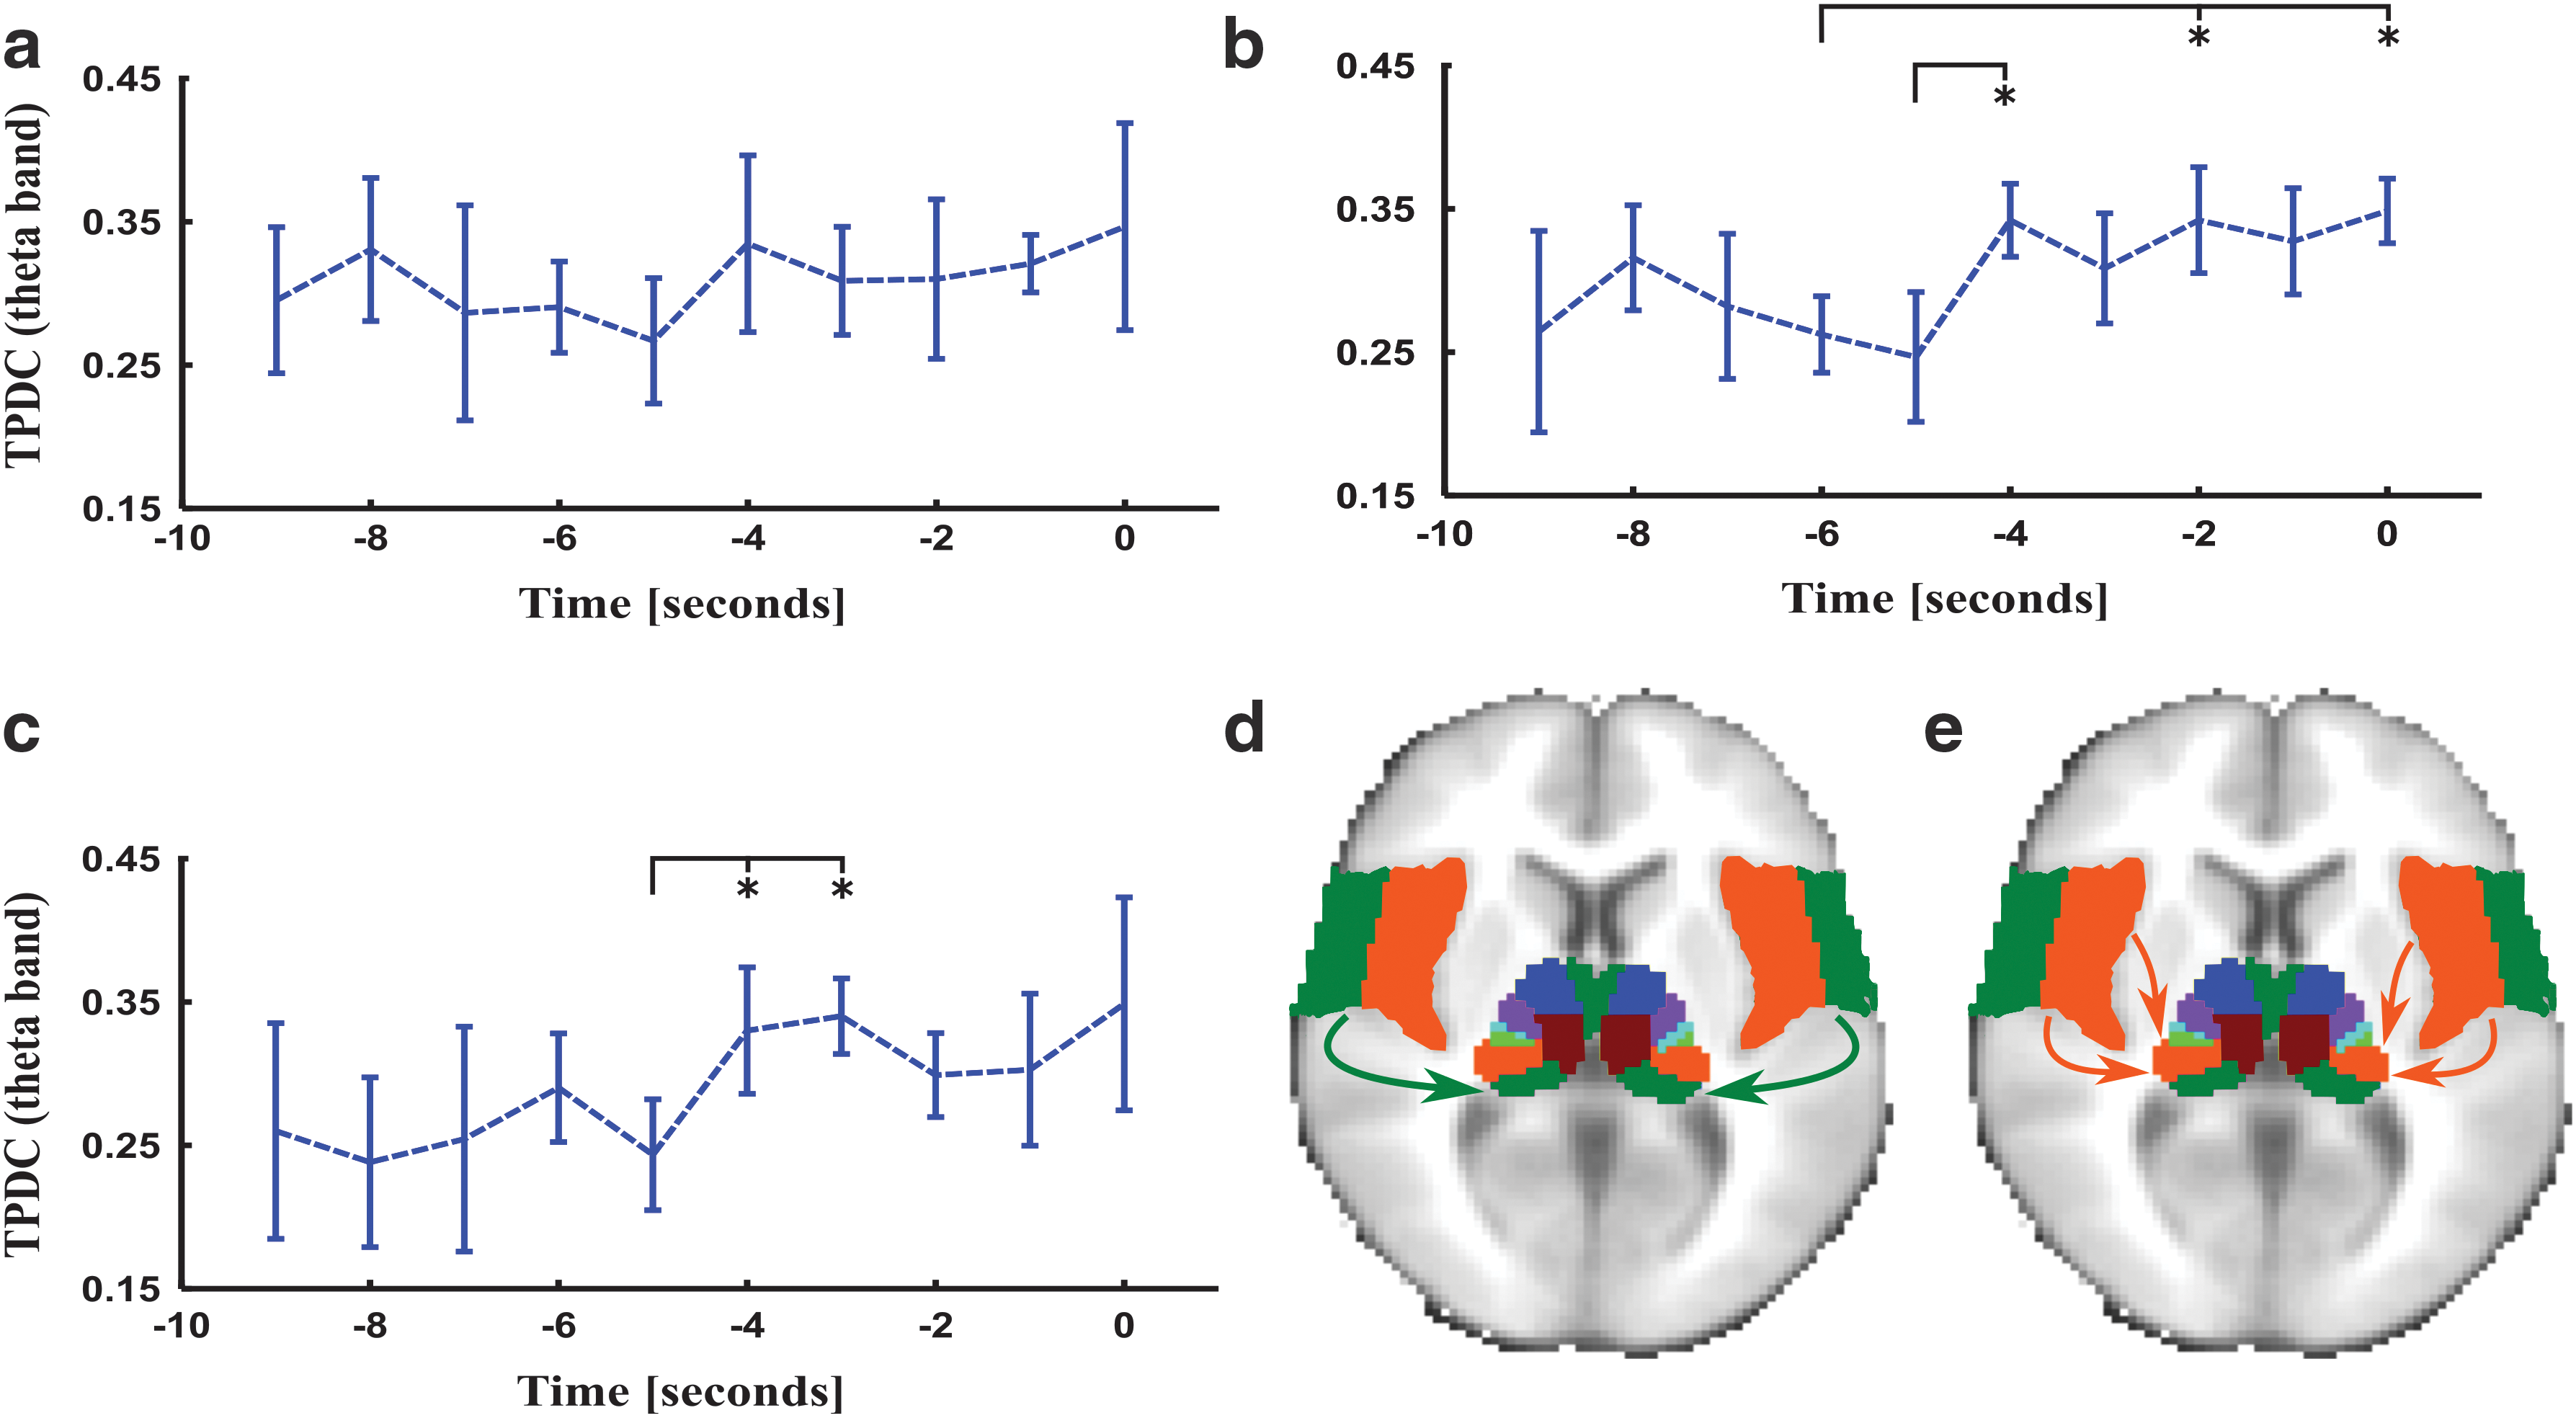
Effective connectivity dynamics in theta frequency band from the temporal lobe toward anterior
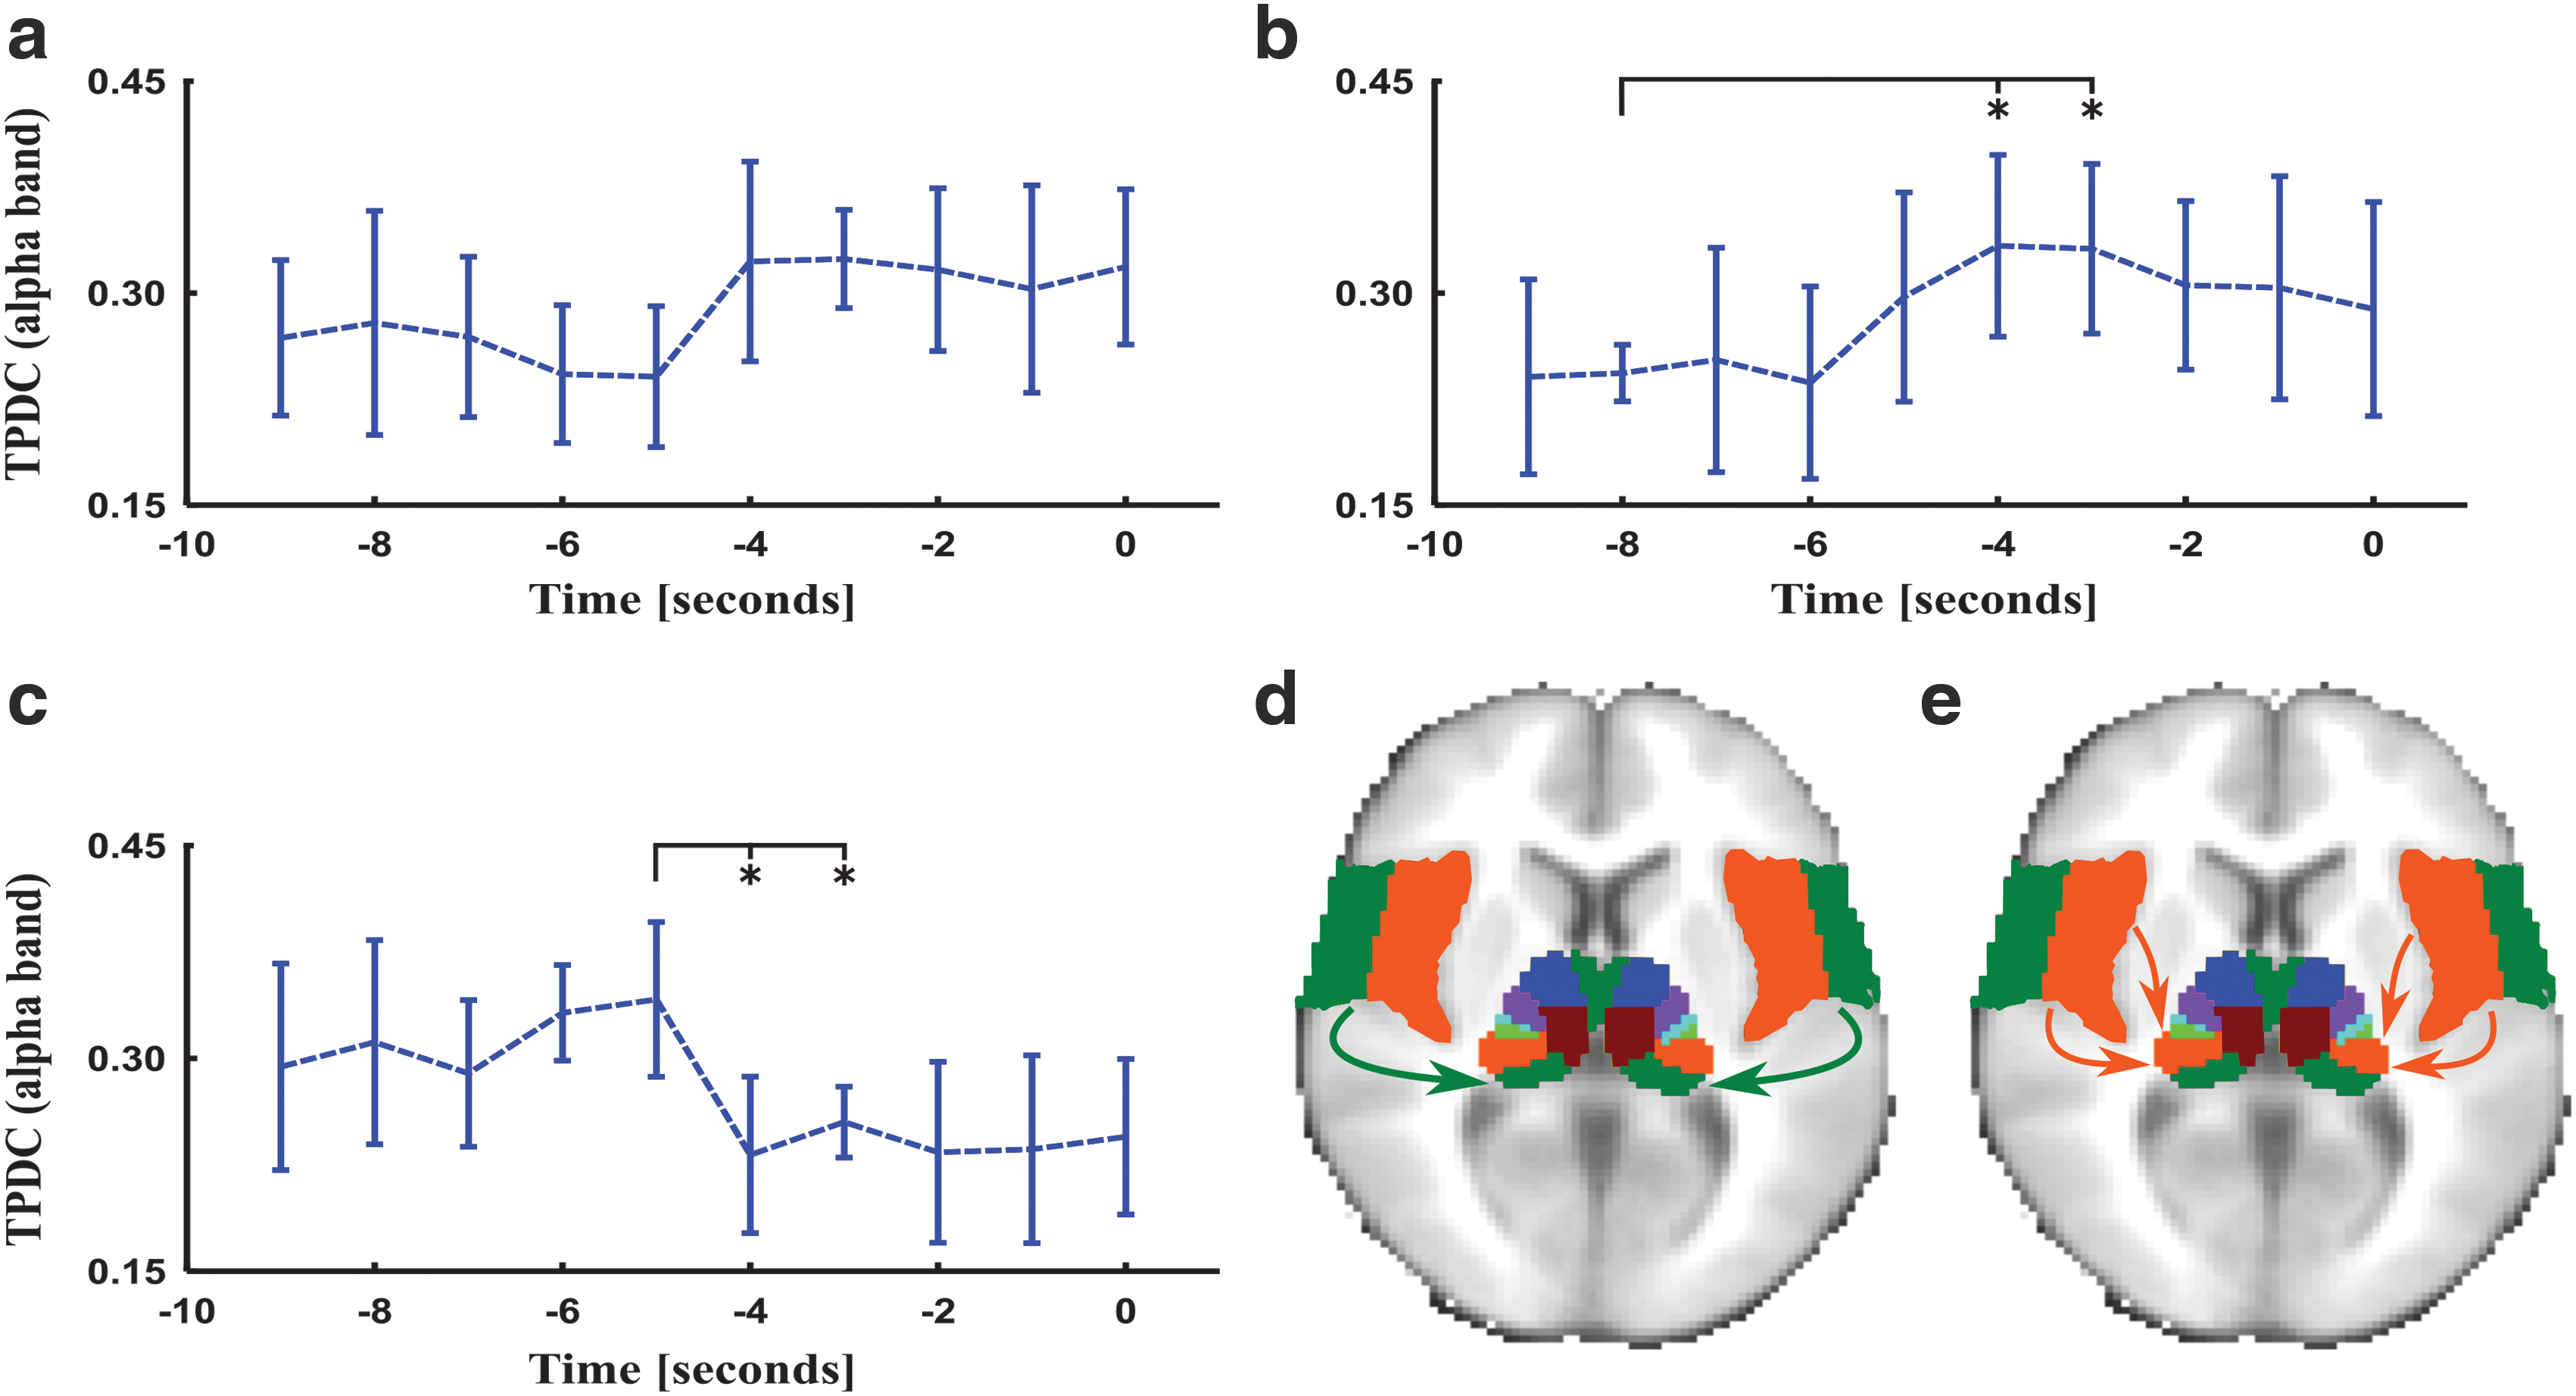
Effective connectivity dynamics in alpha frequency band from the temporal lobe toward anterior
Cortical thickness and thalamic volume
Cortical thickness analysis showed a significant cortical thinning of widespread regions in patients with epilepsy (p < 0.05, false discovery rate corrected; >50 voxels), mainly in the frontal and temporal regions (Fig. 7). A cortical thickness increase was detected in the occipital cortex. The complete results are presented in Table 2 and Figure 7. No significant correlations were found between cortical thickness and disease duration.
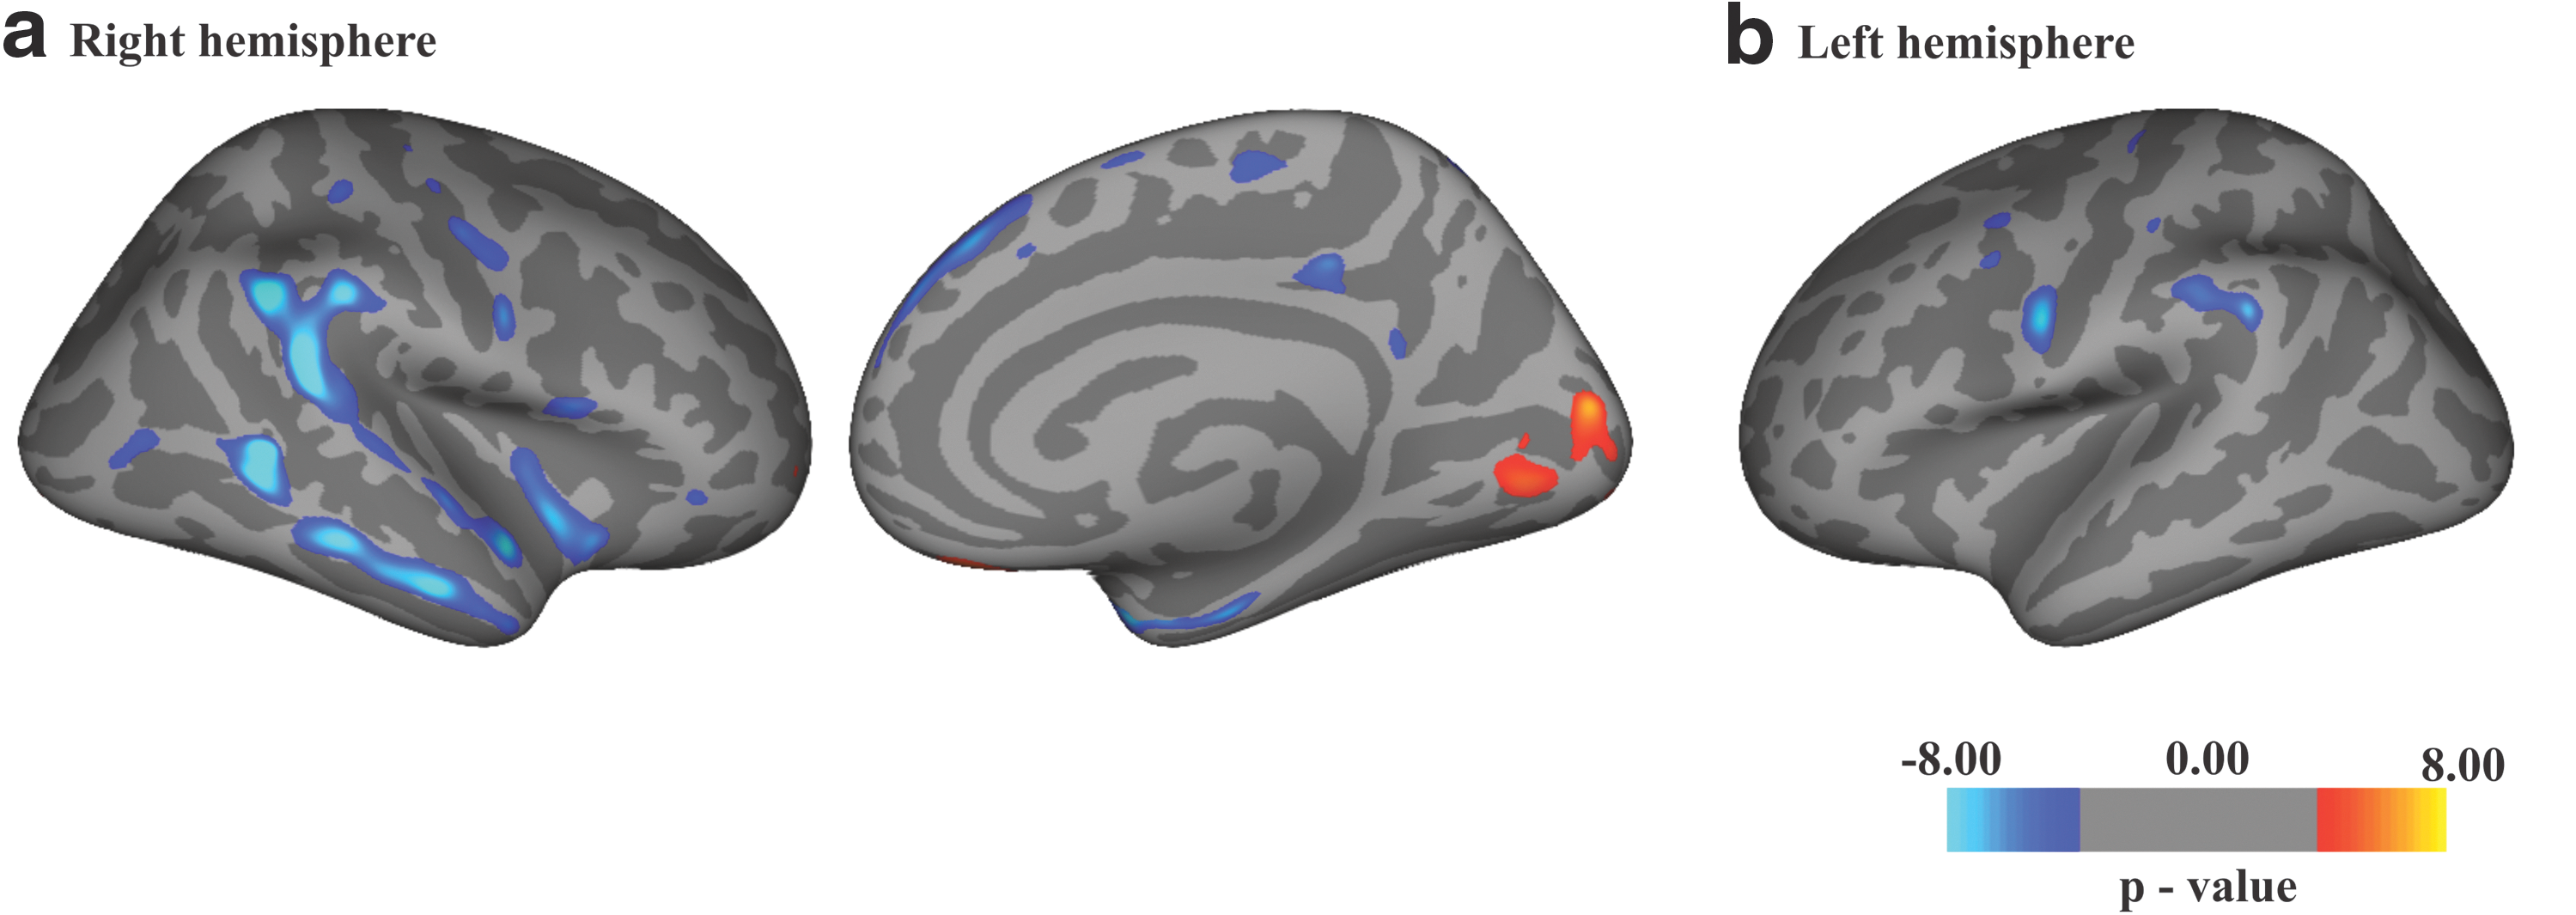
Statistical maps showing clusters (p < 0.05, false discovery rate corrected) of cortical thinning (blue) and thickening (red) in epilepsy patients compared with healthy subjects. The two slices in
Thalamic volumes were markedly reduced in epilepsy patients compared with healthy subjects. Volumes of left (7362.1 ± 848.3 mm3, p = 0.00005) and right (7186 ± 848.3 mm3, p = 0.0037) thalami of FE patients were significantly smaller in comparison with healthy controls (left thalamus 9360.5 ± 1382 mm3, right thalamus 8088.7 ± 683 mm3).
Correlation effective connectivity and thalamic volume
In the theta band, the temporo-thalamic effective connectivity significantly correlated with the volumes of both thalami (r = 0.8981, p < 0.001), whereas the fronto-thalamic connectivity did not show significant correlations with the thalamic volumes (p > 0.1) or only a trend for the thalamo-frontal connection (r = −0.5, p = 0.058). In the alpha band, only the fronto-thalamic effective connectivity significantly correlated with the volumes of both thalami (r = −0.61, p < 0.01); whereas the correlations between temporo-thalamic and thalamo-frontal effective connectivities and thalamic volumes did not reach statistical significance (p > 0.1 and p > 0.5 respectively).
Discussion
In this work, we analyze information flows and structural integrity as network fingerprints of the circuits that drive the spike generation and seizure evolvement. Establishing the directionality and the causality of cerebral dynamics is essential for linking network connectivity and seizure prediction. Therefore, we investigated noninvasively the alterations of effective connectivity in a group of patients with focal epilepsy during the interictal period and specifically focused on the narrow period before spike appearance on scalp EEG. Moreover, we dissected the cortical and subcortical integrity within these networks that modulate the long-range information flows and synchronizations. We see clear connectivity alterations in the theta and alpha bands before spike generation. Our analysis addressed bidirectional information flows among cortical regions and thalamus. Significant information flows were detected in a network formed by temporal and frontal cortices and thalamus. The performed analyses demonstrate a clear breakdown of connectivity patterns 5 sec before spike generation, with a subsequent increase. Medial dorsal and ventral anterior nuclei of the thalamus were mainly involved. Widespread cortical integrity abnormalities and thalamic atrophy were attested in the patient group.
Frequency band specificity
The main effective connectivity variations were identified in theta and alpha bands. A clear physiological framework explains our results. Theta oscillations synchronize the mesial temporal lobe (MTL) with distant cortical and subcortical regions (Bettus et al., 2008; Zaveri et al., 2001), whereas pathological synchronization phenomena involving MTL could be as well mirrored in this frequency band. The underlying cause of these connectivity alterations has not yet been described. One putative explanation could be that the breakdown of effective connectivity from temporal and frontal lobes toward the thalamus in the theta band is caused by an altered physiological synchronization. The state of decreased synchronization could lead to vulnerability to following information flows, increasing the probability of spikes or seizures (Mormann et al., 2003). Consequently, we see an increase of information flows in the temporo-thalamic connections thereafter. We did not account for the influence of antiepileptic drugs on attested connectivity alterations. Lamotrigine and valproate could modify the cross-talks between regions and effective connectivity values, as shown between primary motor and pre-motor cortex (Li et al., 2011). Further studies could consider EC alteration in dependency of blood levels of antiepileptic drugs (Li et al., 2011).
A recent study investigating information flows in patients with TLE by the aid of EEG-functional MRI analysis (Faizo et al., 2014) showed similarly significant reductions in information flows before spike occurrence. A decreased connectivity between both temporal lobes has been attested before spike generation. Summated, it can be postulated that putative breakdowns of information flows in the involved structures lead to vulnerable states of decreased synchronization that can drive epileptogenesis.
Region specificity
In our study, we see a direct involvement of the thalamus, temporal and frontal lobes, sparing occipital and parietal cortices and other studied areas. The described information flows involving the thalamus utilize physiological circuits. Different thalamic nuclei are involved and modulate long-range synchronizations at distinct frequency bands (Wang, 2010). The anterior thalamus is involved in theta synchronization, whereas the pulvinar is responsible for alpha-driven information flows (Ketz et al., 2015). Through theta synchronization, the anterior thalamus modulates the information flows between the hippocampus and medial PFC, whereas pulvinar nuclei synchronize the parietal and visual cortex with medial, lateral, and orbital PFC within the alpha band (Ketz et al., 2015). In our analysis related to thalamic nuclei and temporo-thalamo-frontal connections, the anterior nucleus of the thalamus displayed significant alterations of effective connectivity in theta and alpha ranges, whereas the medial dorsal nucleus showed long-range synchronizations in theta and alpha bands, but not in beta. Lateral and inferior nuclei of the pulvinar showed a connectivity increase in theta and a decrease in alpha synchronization range.
The described connectivity dynamics show some similarities to known network determinants in generalized epilepsies. In this type of epilepsies, fronto-thalamic synchronizations are typical hallmarks of very early absence of seizure activity, as evidenced by EEG and MEG (Groppa et al., 2008, 2012; Holmes et al., 2004; Tenney et al., 2013). Disruptions of synchrony-limiting mechanisms in the thalamus might lead to hypersynchrony with cortical areas and predispose to spike-wave discharges and absence of seizures (Paz et al., 2011).
Some of the regions identified in our study such as medial temporal and frontal lobes are a part of the so-called default mode network (DMN). Studies analyzing structural and functional connectivity abnormalities within the medial temporal lobe and DMN brain areas with (Kay et al., 2013; Pittau et al., 2012) or without (Morgan et al., 2012; Voets et al., 2012) simultaneous EEG recording suggest the presence of important disconnections in DMN sites in TLE patients. Moreover, interictal discharges might be associated with significant deactivation in default mode brain areas (Laufs et al., 2007).
In the comparison of gray matter structural integrity between patients and healthy controls, we depict widespread areas in not only the temporal and frontal regions but also parietal and PFC, suggesting a putative relationship with long-range synchronization and connectivity breakdown. However, cortical thinning was more evident in the neocortical regions. Cortical changes within distant regions, such as the frontal or parietal cortex, could be related to the effects of persistent changed connectivity flows, appearing as epileptiform discharges or seizures (Keller et al., 2002; Lin et al., 2007).
Our patients showed bilateral thinning of sensorimotor regions; although the reasons for these changes still need to be clarified, one possible explanation could play a role in the modified information flows between the thalamus and frontal areas, with subsequent cortico-cortical connections to the sensorimotor cortex. The fact that pre- and postcentral cortical thinning is mentioned in studies assessing cortical thickness in TLE (Bernhardt et al., 2008; Lin et al., 2007) suggests that these regions are directly involved in the focal epileptogenesis.
Thalamic volume and connectivity
The thalamus might be one of the most strongly affected regions of extratemporal gray matter in patients with focal epilepsies (Barron et al., 2013), whereas its role in seizure propagation is still unclear (Cassidy and Gale, 1998; Guye et al., 2006). In our study, thalamic volumes showed bilateral reductions and a strong negative correlation between the duration of epilepsy and volumetric values. Of particular interest is the significant relationship between temporo-thalamic cross-talk in the theta frequency band and fronto-thalamic connectivity in alpha frequency bands and the volume of both thalami.
Thalamic regions that are the most commonly associated with TLE are pulvinar, anterior nucleus, and medial dorsal nucleus (Barron et al., 2013), which have dense reciprocal connections with MTL. Volume loss in all three nuclei has been correlated with the duration and severity of medial TLE (Bernhardt et al., 2012), further supporting their conspicuous involvement in the epileptogenic network. The pulvinar part of the thalamus has several nuclear subgroups, and the most medial–dorsal part is connected to associative cortices of the frontal and temporal lobes (Rosenberg et al., 2006). Extensive and reciprocal interconnections with the cortex imply that the pulvinar serves in the facilitation of cortico-cortical transmission through thalamic loops (Saalmann and Kastner, 2011).
Local pulvinar subnetworks receiving strong extrathalamic excitatory and inhibitory inputs are more susceptible to rhythmic bursting and, respectively, to integration into remote oscillations (Fogerson and Huguenard, 2016; Wei et al., 2011). The nuclear subgroups identified in our study were medial dorsal and ventral anterior nuclei with frontal projections, and lateral and inferior nuclei of the pulvinar with temporal connections, which are in a very good agreement with existing data (Behrens et al., 2003; Bernhardt et al., 2012). Therefore, it is of utmost importance to reveal and characterize the contributions of extrathalamic-associated cortices to the initiation and generalization of hypersynchronous oscillations in thalamic nuclei (Fogerson and Huguenard, 2016).
Different nuclei of the thalamus might have specific roles in temporo-thalamic epileptogenic synchronization. The anterior nucleus of thalamus projects to superior frontal and temporal lobe structures and the bilateral stimulation of this nucleus reduce seizure frequency (Fisher et al., 2010), thus displaying an essential modulatory role in focal epileptogenesis. Quick generalization of seizures stimulated from the medial dorsal nucleus of the thalamus implies that this region has a role in the spreading of TLE seizures (Bertram et al., 2008).
Conclusions
Our combined approach of connectivity and microstructural integrity analysis of focal epileptogenic networks identified the temporal and spatial domain specificity and the frequency spectrum of synchronization leading to spikes. These networks involving the temporal and frontal cortical areas and the thalamus are hallmarks of interictal pathological activity generation utilizing mostly physiological connection but leading to a spread to adjacent regions forming the epileptogenic network. Our findings offer clear insights into the function and structure of brain networks underlying the genesis of spikes and seizures in focal epilepsy and can be possibly targeted by future therapeutic strategies.
Footnotes
Acknowledgments
The authors thank Cheryl Ernest for proofreading this article. This work was supported by a grant from the German Research Council (DFG; CRC-1193/B5 and TR-128 to S.G.). The funders had no role in the study design, data collection and analysis, decision to publish, or preparation of this article.
Author Disclosure Statement
None of the authors have any conflicts of interest to disclose. No competing financial interests exist. The authors confirm that they have read the journal's position on issues involved in ethical publication and affirm that this article is consistent with those guidelines.
References
Supplementary Material
Please find the following supplemental material available below.
For Open Access articles published under a Creative Commons License, all supplemental material carries the same license as the article it is associated with.
For non-Open Access articles published, all supplemental material carries a non-exclusive license, and permission requests for re-use of supplemental material or any part of supplemental material shall be sent directly to the copyright owner as specified in the copyright notice associated with the article.