
Abstract
Simultaneous multislice echo-planar imaging (SMS-EPI) can enhance the spatiotemporal resolution of resting-state functional MRI (rs-fMRI) by encoding and simultaneously imaging “groups” of slices. However, phenomena, including respiration, cardiac pulsatility, respiration volume per time (RVT), and cardiac rate variation (CRV), referred to as “physiological processes,” impact SMS-EPI rs-fMRI in a manner that is yet to be well characterized. In particular, physiological noise may incur aliasing and introduce spurious signals from one slice into another within the “slice group” in rs-fMRI data, resulting in a deleterious effect on resting-state functional connectivity MRI (rs-fcMRI) maps. In the present work, we aimed to quantitatively compare the effects of physiological noise on regular EPI and SMS-EPI in terms of rs-fMRI data and resulting functional connectivity measurements. We compare SMS-EPI and regular EPI data acquired from 11 healthy young adults with matching parameters. The physiological noise characteristics were compared between the two data sets through different combinations of physiological regression steps. We observed that the physiological noise characteristics differed between SMS-EPI and regular EPI, with cardiac pulsatility contributing more to noise in regular EPI data but low-frequency heart rate variability contributing more to SMS-EPI. In addition, a significant slice-group bias was observed in the functional connectivity density maps derived from SMS-EPI data. We conclude that making appropriate corrections for physiological noise is likely more important for SMS-EPI than for regular EPI acquisitions.
Introduction
R
Until recently, most rs-fcMRI studies have used MRI acquisitions involving single-shot echo-planar imaging (EPI) with relatively low temporal resolution (e.g., TR = 2 sec, corresponding to a sampling frequency = 0.5 Hz). This type of protocol has the well-known limitation that the resulting rs-fcMRI brain network measurements can be negatively affected by aliasing of “physiological noise processes,” which occur at higher frequencies, such as nonstationary and variable respiration (∼0.3 Hz) and cardiac (∼1 Hz) fluctuations. The locations of these oscillations in functional MRI (fMRI) signals would vary with TR (Cordes et al., 2001). In addition, the heart rate and respiratory volume naturally vary, resulting in low-frequency variations on the BOLD signal (Birn et al., 2006). These respiration volume per time (RVT) and cardiac rate variations (CRV) have been documented to occur at ∼0.03 Hz (Birn et al., 2006) and 0.01 Hz, respectively (Shmueli et al., 2007).
The contributions of respiratory and cardiac cycles have been assessed using Fourier analysis (Biswal et al., 1996; Cordes et al., 2001; Razavi et al., 2008), by isolating the power spectra related to known physiological cycles. Furthermore, correlation analysis with the physiological signals has shown that the association between fMRI and physiological signals is highly variable spatially and across subjects (Chang and Glover, 2009; Shmueli et al., 2007). In addition, the variance explained by individual physiological sources has shown that CRV and RVT account for unique contributions to the resting-state-fMRI (rs-fMRI) signal, different from those of the pulse and respiration cycles (Chang et al., 2009; Cordes et al., 2014; Shmueli et al., 2007). Yet, the commonalities between the regions affected by the former and the latter are not consistently defined.
A typical rs-fMRI signal preprocessing pipeline includes some type of band-pass filtering, typically to preserve the range between 0.008 and 0.01 Hz (Whitfield-Gabrieli and Nieto-Castanon, 2012). In addition, there are various ways to reduce the impact of the abovementioned physiological processes, mainly classified into model-based (Birn et al., 2008; Chang and Glover, 2009; Glover et al., 2000) and model-free (Beckmann and Smith, 2004; Correa et al., 2005; Pruim et al., 2015; Salimi-Khorshidi et al., 2014) approaches. However, from a signal-processing perspective, irrespective of the denoising approach adopted, temporal aliasing likely remains a problem (Birn et al., 2006; Biswal et al., 1996; van den Heuvel and Hulshoff Pol, 2010). Thus, exploiting MRI techniques that offer significantly higher sampling rates, both for denoising purposes and for providing additional neural information (Feinberg and Setsompop, 2013; Moeller et al., 2010), helps to alleviate the detection of false correlations by preventing aliasing of high-frequency oscillations (Lowe et al., 1998).
Various techniques have been proposed for this purpose, including simultaneous multislice, also known as multiband (SMS) slice, acceleration (Feinberg and Setsompop, 2013). SMS acceleration has been widely adopted with increasing applicability to rs-fcMRI. Nevertheless, implications of SMS acceleration on rs-fcMRI are yet to be fully investigated. The SMS technique achieves acceleration by encoding and imaging “groups” of slices simultaneously. The slices in a group are superimposed on each other, resulting in a “collapsed image” with spatial aliasing. Parallel imaging reconstruction techniques are commonly used to “unfold” the spatial aliasing. However, increasing the acceleration factor of parallel imaging decreases the signal-to-noise ratio (SNR), placing a practical limit on the maximum acceleration achievable with specific MRI system hardware. To mitigate this issue, the “controlled aliasing in parallel imaging results in higher acceleration” (CAIPIRINHA) technique was proposed by Breuer et al. (2005), introducing an in-plane “phase-encoding shift” between simultaneously acquired slices to increase the distance between aliased voxels and thus make aliasing effects easier to remove. This in-plane phase-encoding shift was achieved using a different phase-modulated radio frequency (RF) pulse for each k-space line acquisition. However, single-shot EPI uses only a single RF excitation pulse, preventing the use of CAIPIRINHA with phase-modulated RF pulses to create in-plane shifts between the simultaneously acquired slices. Alternative approaches were developed to create the relative in-plane shifts between simultaneously acquired slices, including the wideband method (Nunes et al., 2006; Weaver, 1988) and blipped-CAIPIRINHA (Setsompop et al., 2012). Both of these methods rely on the use of slice gradients to introduce phase modulation during the readout. Unfortunately, the wideband method (Weaver, 1988) causes a continuous accumulation of through-slice phase that results in considerable voxel tilting on the slice axis and degrades the in-plane resolution. This limitation was resolved by introduction of blipped-CAIPIRINHA that uses gradient pulses specifically designed to periodically refocus (“phase rewind”) the through-slice phase accumulation.
Application of phase-encoding shifts results in improved image quality by reducing “cross talk” or “leakage” between the slices in a group, with a subsequent increase in SNR. However, even with CAIPIRINHA, residual spatial aliasing has the potential to introduce spurious signals from one slice into another in the same group, creating a “slice-grouping effect” (artifactual temporal dependencies induced in voxels within a slice group). These voxels can be erroneously interpreted as belonging to the same functional network, confounding the estimation of SMS rs-fcMRI brain networks. Notably, the simultaneously acquired slices sample similar physiological noise processes, which, in addition to the respiration and cardiac cycles themselves, include other time courses such as the RVT and CRV. Any or all of these processes can also be correlated with head motion (Jones et al., 2008). Moreover, spurious thermal noise correlation between aliased imaging voxels can create undesirable bias in rs-fcMRI analysis, particularly for low-SNR acquisitions where thermal noise is the dominant noise source (Setsompop et al., 2013b). Such slice leakage effect accentuates with the increase of the slice acceleration factor (Xu et al., 2013). However, minimizing the influence of slice-leakage artifacts, otherwise known as “leak block,” during the calibration of slice-generalized autocalibrating partially parallel acquisitions (GRAPPA) (Griswold et al., 2002) kernel has been shown to significantly improve image reconstruction accuracy (Cauley et al., 2014; Setsompop et al., 2013a). Yet, in the presence of dynamic shifts in the MR signal introduced by motion and physiological processes, it is unclear whether leak block would eliminate residual aliasing from one slice into another in the same group. The unique potential effect of physiological noise processes on slice group in SMS-EPI data with leak-block and the corresponding rs-fcMRI brain networks is important for interpreting SMS rs-fcMRI results and is yet to be well studied.
In the present work, we compare the effect of physiological noise on SMS-EPI data to that on regular EPI fMRI data via six different physiological noise metrics, taking into account the effects of applying five different physiological regression schemes. Furthermore, by demonstrating the effect of physiological regression schemes on SMS-derived rs-fcMRI maps, we confirm, in the inverse sense, the influence of each physiological component on functional connectivity measures. Overall, this work investigates the hypotheses that (1) physiological noise has different effects on rs-fMRI signals acquired using SMS-EPI and using regular EPI; (2) residual aliasing and physiological noise effects introduce a slice-group effect in rs-fcMRI maps acquired with SMS-EPI; and (3) this slice-group effect can be effectively alleviated through appropriate physiological correction.
Materials and Methods
Participants
Twelve healthy participants (6 male, 29 ± 6 years, age between 21 and 36) were imaged at Baycrest, Toronto, Canada. Participants were recruited through the Baycrest Participants Database. The study was approved by the local Research Ethics Board (REB) for imaging of young healthy adults. The experiments were performed with written informed consent of each participant before imaging was undertaken, according to institutional REB guidelines.
MRI acquisition
All images were acquired on a TIM Trio 3 T MRI system (Siemens, Erlangen, Germany), using a 32-channel phased-array head coil for reception and the body coil for transmission. Participants were instructed to close their eyes and relax during rs-fMRI scans. Each participant was imaged with both SMS-EPI and a regular EPI sequence with matching TR. For each participant, the order of the runs was randomized to control for systematic confounds. Single-shot SMS rs-fMRI data were acquired based on gradient-echo (GE)-EPI (TR = 323 ms, TE = 30 ms, flip angle = 40°, 15 oblique axial slices, 3.44 × 3.44 × 4.6 mm, 2230 time points, acceleration factor = 3, phase-encoding shift factor = 2, slices ascending, leak-block with slice-GRAPPA kernel of 3 × 3) (Setsompop et al., 2013a). For SMS-EPI, the 15 slices were grouped as 1–6–11, 2–7–12, 3–8–13, 4–9–14, 5–10–15, and acquired in this order, as shown in Figure 1. Regular EPI rs-fMRI was performed using a nonaccelerated GE-EPI sequence (“regular EPI”: TR = 323 ms, TE = 30 ms, flip angle = 40°, 7 oblique axial slices acquired in a sequential order, 3.44 × 3.44 × 4.6 mm, 2230 time points). The seven slices acquired by regular EPI were prescribed to overlap slices 9–15 of the SMS-EPI scan. In addition, T1-weighted anatomical images were collected for anatomical registration and segmentation (magnetization prepared rapid acquisition gradient echo [MPRAGE]: TR = 2400 ms, TE = 2.43 ms, FOV = 256 mm, TI = 1000 ms, readout bandwidth = 180 Hz/px, voxel size = 1 × 1 × 1 mm).
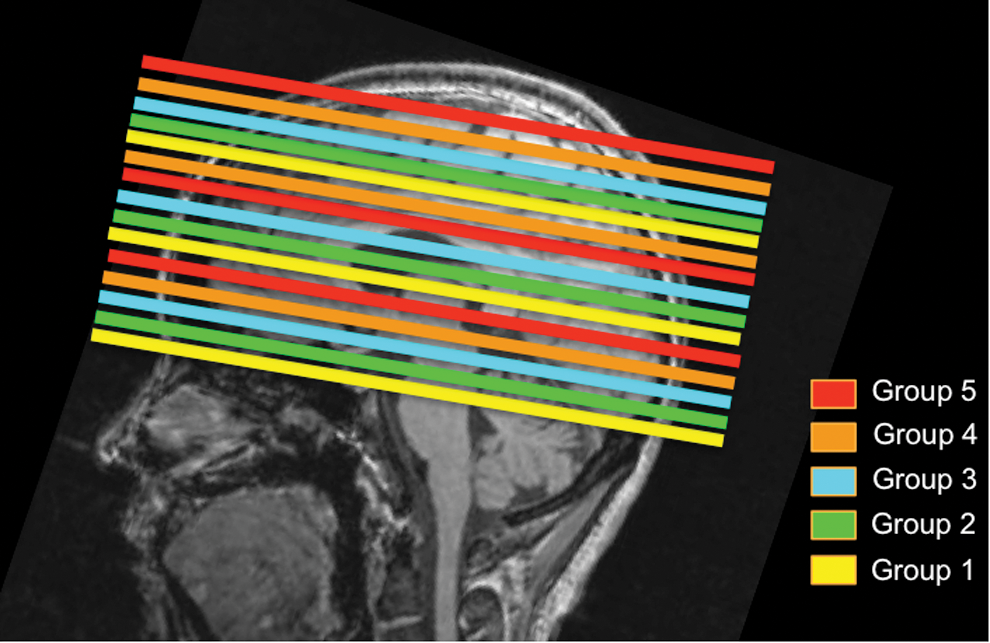
Schematic of multislice acceleration paradigm. This schematic pertains to the SMS-EPI acquisition used in this work, overlaid on a representative T1 anatomical image. Slices within the same slice group are acquired simultaneously, and the slice groups themselves are acquired in an ascending order. SMS-EPI, simultaneous multislice echo-planar imaging. Color images available online at
Physiological monitoring
For each participant, the cardiac signal was recorded at a rate of 50 Hz, using the standard photoplethysmograph placed on the left hand index finger. The respiratory volume signal was recorded using a BIOPAC system (Biopac, Goleta), at a rate of 200 Hz, using an elastic belt placed around the chest. Both signals are synchronized to scanner triggers recorded during rs-fMRI sessions. The sampling delay with respect to the fMRI data acquisition was determined via a deep breath taken at the start of the recording and was accounted for in the analysis. Cardiac and respiratory peak detection was performed using an in-house developed script, with faulty peaks identified and corrected manually (replaced with peaks in accordance with the neighboring peak spacings). For the purpose of variance analyses, these physiological waveforms were corrected for drift. In addition, for each participant, we used MATLAB (MathWorks, Natick, MA) to compute two physiological signals that capture low-frequency variations in physiological noise processes: the RVT, defined as the respiration depth (difference between the local maxima and minima of the respiration signal) divided by the period of respiration (Birn et al., 2006); and the CRV, defined as the average time interval between successive R peaks in a four-beat sliding window (Chang et al., 2009). All the physiological signals were resampled to match the TR of the fMRI data (323 ms).
Data analysis
Preprocessing
Functional MRI data were preprocessed using the Oxford Centre for Functional MRI of the Brain (FMRIB) Software Library v5 (FSL5) (Smith et al., 2004), and included (in order) motion correction (Jenkinson et al., 2002), brain extraction, spatial smoothing (8 mm full-width at half-maximum), high-pass filtering (>0.01 Hz), and regression of six degrees of freedom motion parameters. To facilitate the comparison between the two EPI data sets, all images in the time series of the regular EPI data set were registered to a specific reference image volume in the SMS-EPI data time series (corresponding to time point 10). The same reference was used in volume registration of the SMS-EPI fMRI data.
The T1 anatomical scans were used in defining noise regions of interest (ROIs) for verifying the presence of cardiac and respiratory noise peaks. Specifically, we used FMRIB Automated Segmentation Tool (FAST) for segmentation of gray matter, white matter, and cerebrospinal fluid ROIs. The FSL-FAST segmentation routine is based on a Hidden Markov Random Field model that is optimized using the expectation-maximization algorithm (Zhang et al., 2001). The ROI masks are then aligned with the fMRI data using anatomical-to-fMRI transformation matrices determined using FSL Flirt (Jenkinson and Smith, 2001; Jenkinson et al., 2002).
Physiological noise metrics
To quantify the contribution of cardiac and respiratory processes to both SMS-EPI and regular EPI rs-fMRI data sets after preprocessing, we computed the variance in the BOLD time series explained by each of the following noise sources: the (a) respiratory, (b) cardiac, (c) RVT, and (d) CRV signals. In addition, the spectral energy of the time course of each voxel was also calculated in the (e) respiration and (f) cardiac pulsation frequency bands. These bands were previously targeted for removal to enhance BOLD signal-to-noise (Biswal et al., 1996). We determined the locations of these bands on an individual basis by manual inspection of the physiological recordings obtained for each participant. Note that noise metrics (a, b, e, f) capture the high-frequency physiological processes (respiratory and cardiac pulsations at ∼0.3 and ∼1 Hz, respectively), whereas metrics (c, d) capture the low-frequency processes (variabilities in respiration and heart rate, occurring at ∼0.03 and ∼0.01 Hz, respectively). The low TR values used for both rs-fMRI data sets allowed the first harmonics of both respiration and cardiac processes to be captured. Each of the six physiological noise metrics (a–f) was obtained for SMS-EPI and regular EPI rs-fMRI data processed by the five noise-regression schemes.
To assess the relative contributions of high-frequency versus low-frequency physiological fluctuations from cardiac and respiratory sources, we resorted to using retrospective image-based correction (RETROICOR) (Glover et al., 2000) as implemented in the Analysis of Functional NeuroImages (AFNI) freeware package (Cox, 1996). By fitting onto the fMRI data low-order Fourier series constructed from the phases of the cardiac and respiratory cycles, RETROICOR allows us to assess the contribution of high-frequency physiological processes to the BOLD time series, even when some of the noise is aliased into lower frequencies (Glover et al., 2000). We used second-order Fourier series as is recommended in the original publication, and manually inserted slice-timing information in the image headers for both SMS and regular EPI. Furthermore, to assess the contributions of low-frequency variability in the cardiac- and respiratory-related pulsations, voxelwise linear regressions were also used to remove the effect of RVT and CRV signals from the BOLD signal. These steps are subsequently referred to as RVTreg and CRVreg, respectively. Five different physiological regression schemes were then implemented by including various combinations of the physiological noise signals into the linear regression model to generate corrected rs-fMRI data: (1) no physiological regression; (2) RETROICOR; (3) RETROICOR+RVTreg; (4) RETROICOR+CRVreg; and (5) RETROICOR+RVTreg+CRVreg. These schemes are described in detail in Table 1. The CRVreg and RVTreg steps using convolution with the canonical cardiac and respiratory response functions are described in previous literature (Birn et al., 2008; Chang et al., 2009). Individual subject analyses were performed in native space.
A description of noise sources and regression schemes for investigating the effect of various physiological effects targeted in this study.
BOLD, blood oxygen level dependent; CRV, cardiac rate variations; RVT, respiration volume per time.
Comparison between regular EPI and SMS-EPI
In the above comparisons, we focused only on the seven slices that overlapped between the EPI and SMS-EPI acquisitions. To ensure a fair comparison between the two data sets for all subjects, subjects with statistically significantly different framewise displacements during regular EPI and SMS-EPI were excluded from further analysis. Moreover, to reduce the effect of inflow on the whole-brain noise metrics, the top and bottom slices of the regular EPI scans were discarded. For both SMS-EPI and regular EPI rs-fMRI data sets, the whole-brain average of the absolute values of the six (a–f) physiological noise metrics under the regression schemes (1–5) was calculated for each subject, from which the group mean and the standard deviation were obtained. Furthermore, for each spatially averaged physiological noise metric, a one-way repeated-measures analysis of variance (rANOVA) (Girden, 1992) was performed in MATLAB to evaluate the effect of different correction schemes for both the regular EPI and SMS-EPI. The Anderson–Darling test (Anderson and Darling, 1952) was performed before all statistical testing to verify normal distributions.
Statistical analysis of noise metrics for SMS-EPI
The noise characteristics of the SMS-EPI data were investigated further, given the focus of the study on slice-group effects. As described in the MRI Acquisition section, the SMS-EPI data for each subject (and thus each regression scheme) were divided into five slice groups each consisting of three slices based on the acquisition. To evaluate the slice-group effect on each physiological noise metric, each metric was averaged across the three slices in each slice group and for each correction scheme, independent linear mixed effect (LME) analyses (Faraway, 2016; Myers, 2008) were carried out in R (R Core Team, 2012). The subject was designated as the random variable and the slice group as the fixed variable. This resulted in five LME analyses spanning the different regression schemes.
SMS-EPI rs-fcMRI maps
For functional connectivity (rs-fcMRI) estimation, only the SMS-EPI data set was considered, as the regular EPI data set did not provide whole-brain coverage. The rs-fcMRI processing was carried out using FSL5, following which the signal is filtered to retain frequencies below 0.1 Hz. Following each of the five physiological regression schemes, we obtained local and long-range functional connectivity density (FCD) maps (Tomasi and Volkow, 2010). For each brain voxel, a resting-state connectivity map is generated using Pearson correlation between the BOLD signal of the voxel and those in the remaining brain voxels. To reduce the amount of spurious correlations, correlation is only estimated for voxels with an image SNR >60. The correlation maps are then thresholded (r > 0.6) to create a binary connectivity map, as described by Tomasi and Volkow (2010). We computed global FCD (gFCD), defined at each voxel as the total number of voxels globally that are connected to a given voxel, as well as local FCD (lFCD), defined as the equivalent but within a cluster immediately surrounding the voxel of interest. The cluster is in turn defined as the congruent 3D volume that satisfies (r > 0.6 and SNR >60). The FCD maps are subsequently registered to the MNI152 atlas (Evans et al., 1992) using FSL Flirt (Jenkinson and Smith, 2001; Jenkinson et al., 2002) and averaged across subjects for visualization.
The impact of physiological regression on rs-fcMRI maps
The influence of multiple physiological regressions on the gFCD and lFCD maps generated from SMS-EPI data was investigated in terms of the slice-group effect. For each participant and each regression scheme, the gFCD and lFCD values were spatially averaged across all gray matter voxels. For statistical comparison of the effect of the correction schemes on the gFCD and lFCD, multiple paired two-tailed t-tests were performed across the cohort. Furthermore, the gFCD and lFCD values for each participant were then entered into separate vectors, one for each physiological correction scheme. A one-way rANOVA was performed to evaluate the effect of different correction schemes.
In addition, for each participant and each physiological correction scheme, the numbers of gFCD and lFCD were spatially averaged over individual slices and consecutively grouped based on their time of acquisition within the five SMS-EPI slice groups. FCD values corresponding to different regression schemes were compared through multiple paired t-tests. Moreover, to evaluate the slice-group effect on gFCD and lFCD values, five independent LME analyses (one for each correction scheme) were carried out in R, with the participants as the random variable and the slice groups as the fixed variable.
Results
Physiological noise metrics
All 12 participants completed the study successfully. The regular EPI and SMS-EPI protocols yielded images that were quite similar in quality, as observed in the representative raw images (Fig. 2) as well as group average temporal SNR (tSNR) maps (Fig. 3; examples of individual SNR maps are presented in Supplementary Fig. S1; Supplementary Data are available online at

A comparison of regular and SMS-EPI images. Select slices in regular EPI and SMS-EPI data sets are shown for a representative subject. All the images are windowed in the same manner.
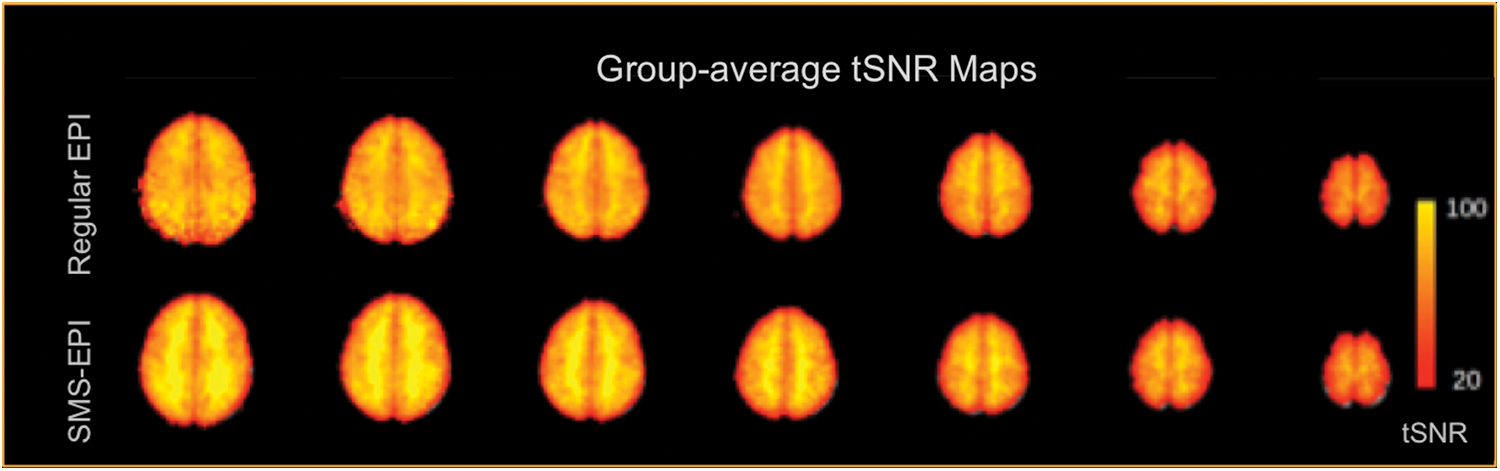
Group average temporal SNR (tSNR) maps for regular and SMS-EPI acquisitions. There are no visible differences across the two types of acquisitions. SNR, signal-to-noise ratio. Color images available online at
Absolute head motion (i.e., absolute displacement) and root mean square framewise intensity differences (DVARS) were similar across regular and SMS-EPI data sets (Table 2) for all participants (N = 12). However, marginal framewise displacement was significantly higher in the regular EPI case. Specifically, one subject exhibited significantly higher framewise displacement (across frames) in regular EPI than in SMS-EPI data and was hence excluded, resulting in 11 subjects for the subsequent analyses. Furthermore, we manually verified that the fundamental cardiac frequency was captured at the Nyquist rate in all subjects. Representative single-subject frequency spectra of the SMS-EPI data along with the corresponding respiratory and cardiac frequency spectra are shown in Figure 4.
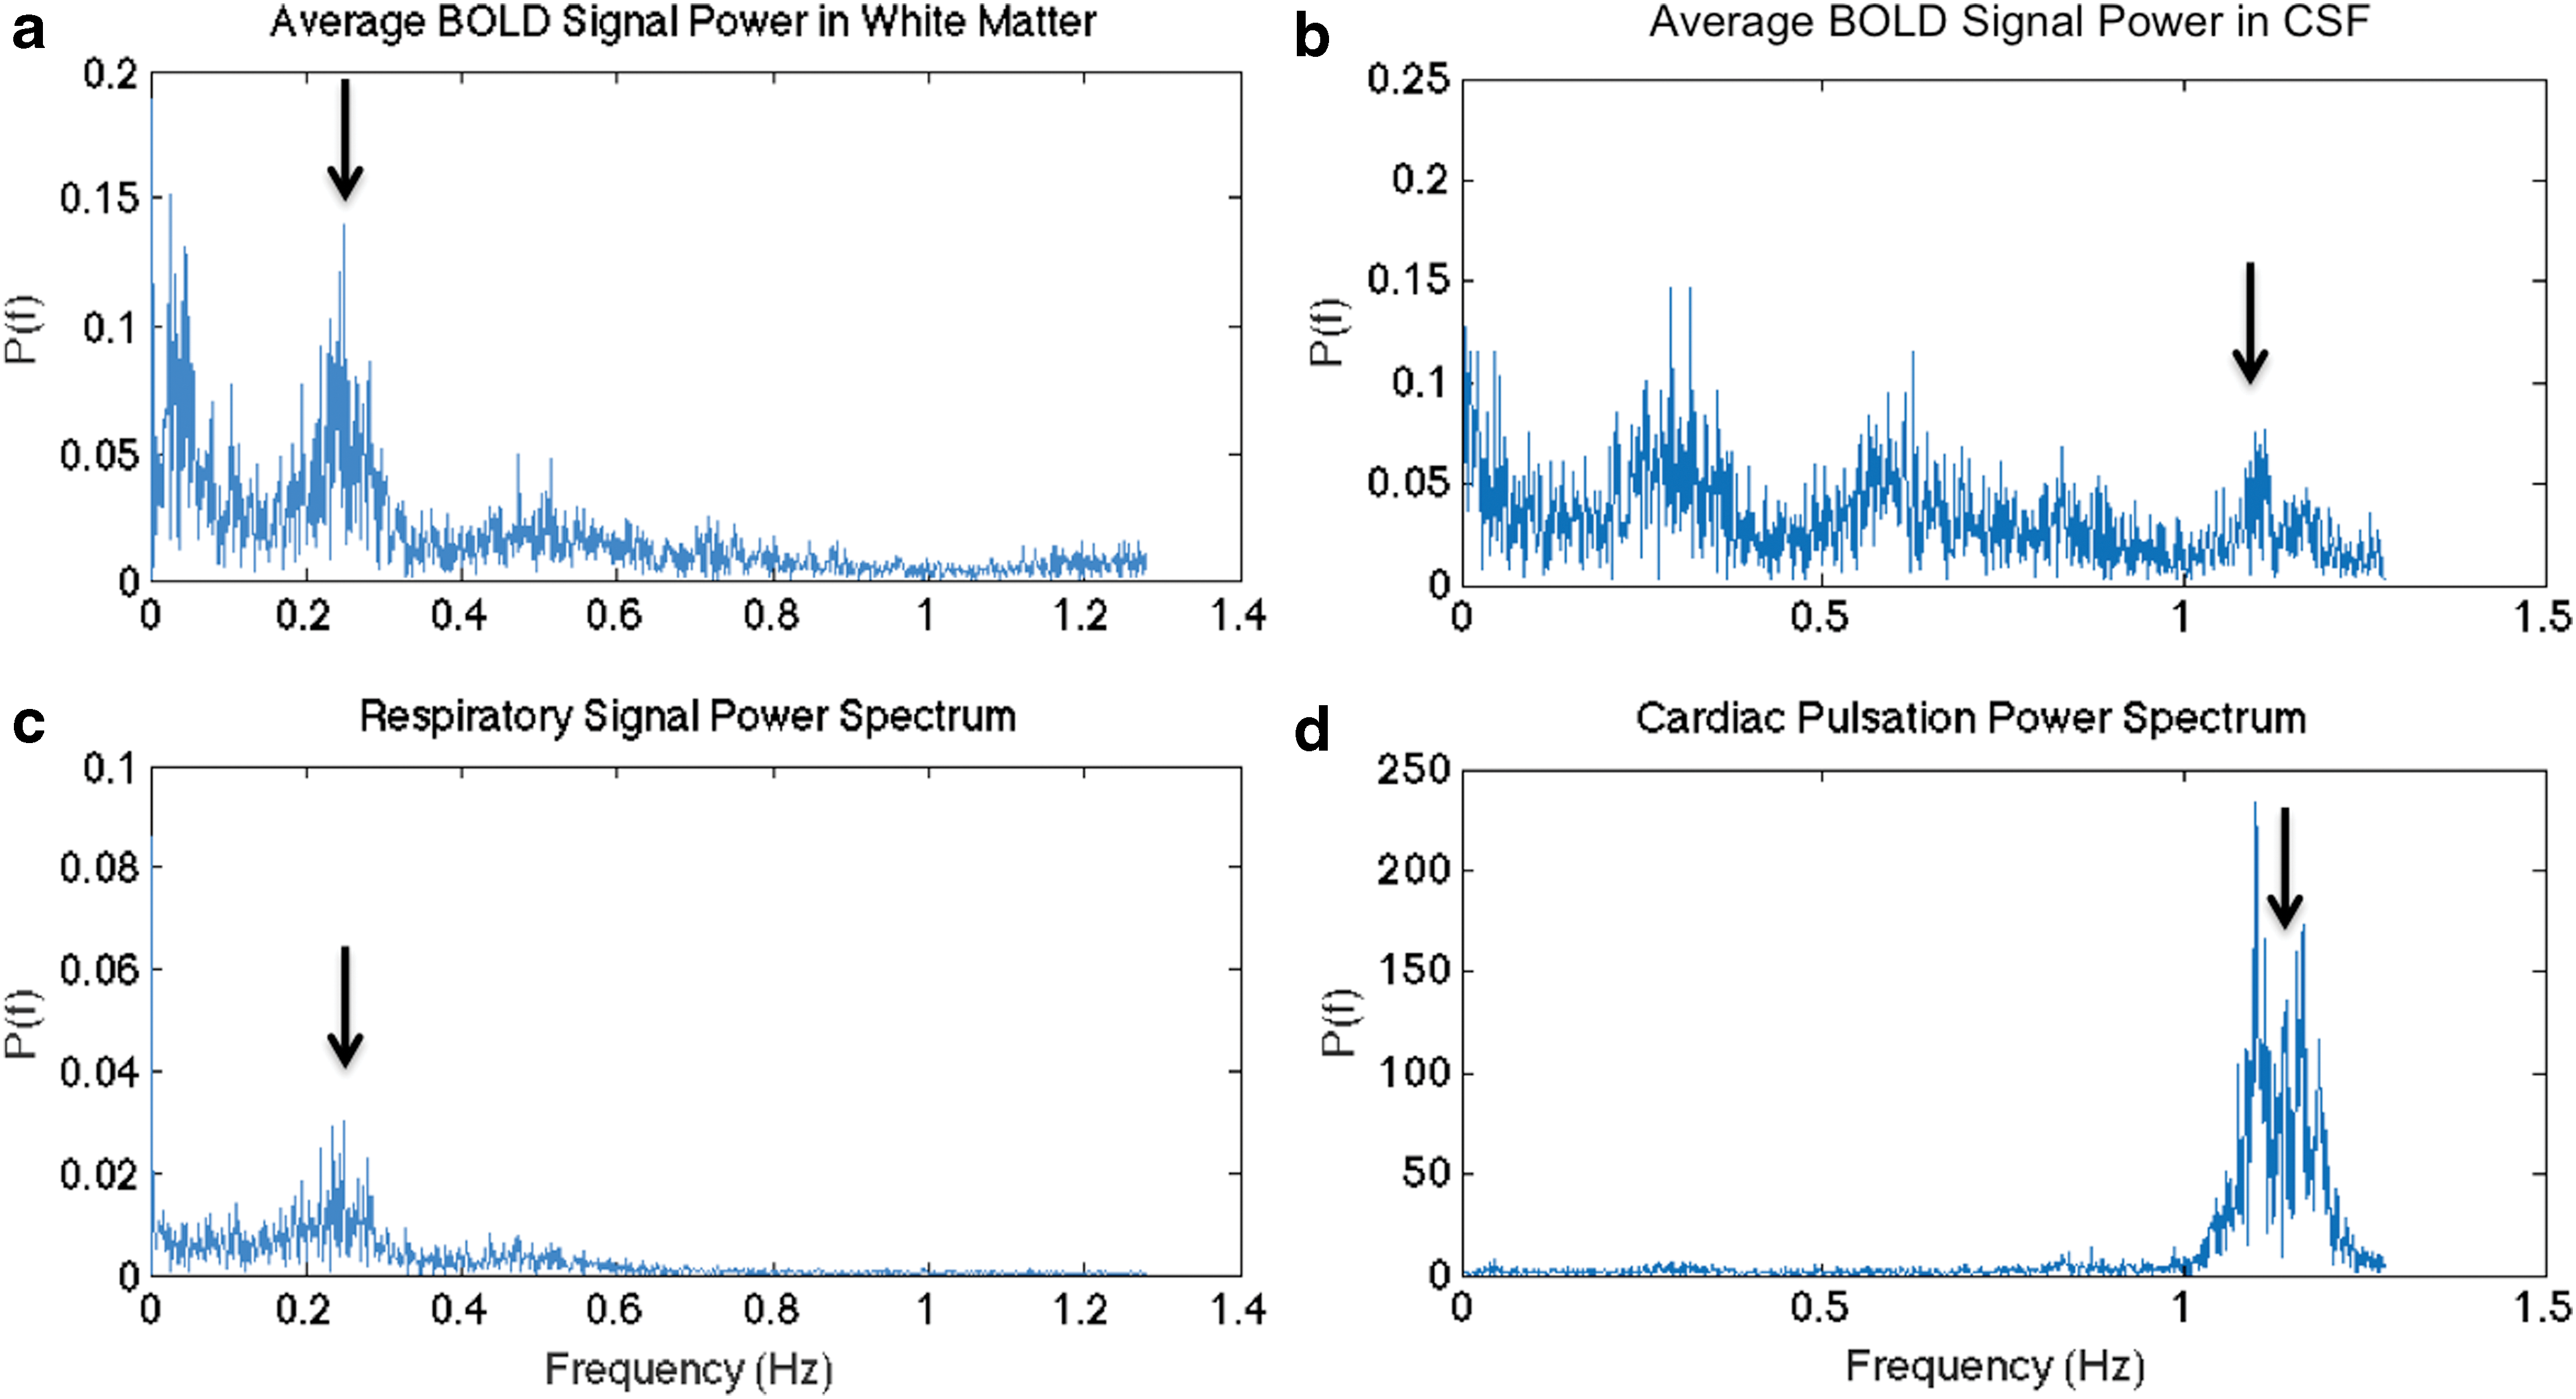
Respiratory and cardiac cycles captured in SMS-EPI data. WM is chosen as a region dominated by respiratory fluctuations
Motion parameters indicate that regular EPI and SMS-EPI are not significantly different in terms of the influence of absolute head displacement and DVARS (root-mean-squared intensity difference between consecutive frames). However, SMS-EPI is associated with significantly lower framewise displacement. For the physiologically induced variances, we first computed whole-brain (gray and white matter) averages for individual subjects, and report their mean and standard deviation across the group of subjects. Statistically significant differences between regular and SMS-EPI are shown in bold.
SMS-EPI, simultaneous multislice echo-planar imaging.
The group average effects of various physiological effects on regular and SMS-EPI data are summarized in Figure 5. The plotted values are the whole-brain means averaged across all subjects. At baseline (i.e., no regression), SMS-EPI and regular EPI data were associated with similar levels of respiratory and cardiac spectral powers. However, after RETROICOR, SMS-EPI data are found to contain significantly lower cardiac power than regular EPI data (p < 0.05). At baseline, CRV is found to contribute significantly higher variance to SMS-EPI than to regular EPI signals (Table 2). Conversely, RVT is seen to contribute to lower variance in SMS-EPI data, which is also a significant finding.
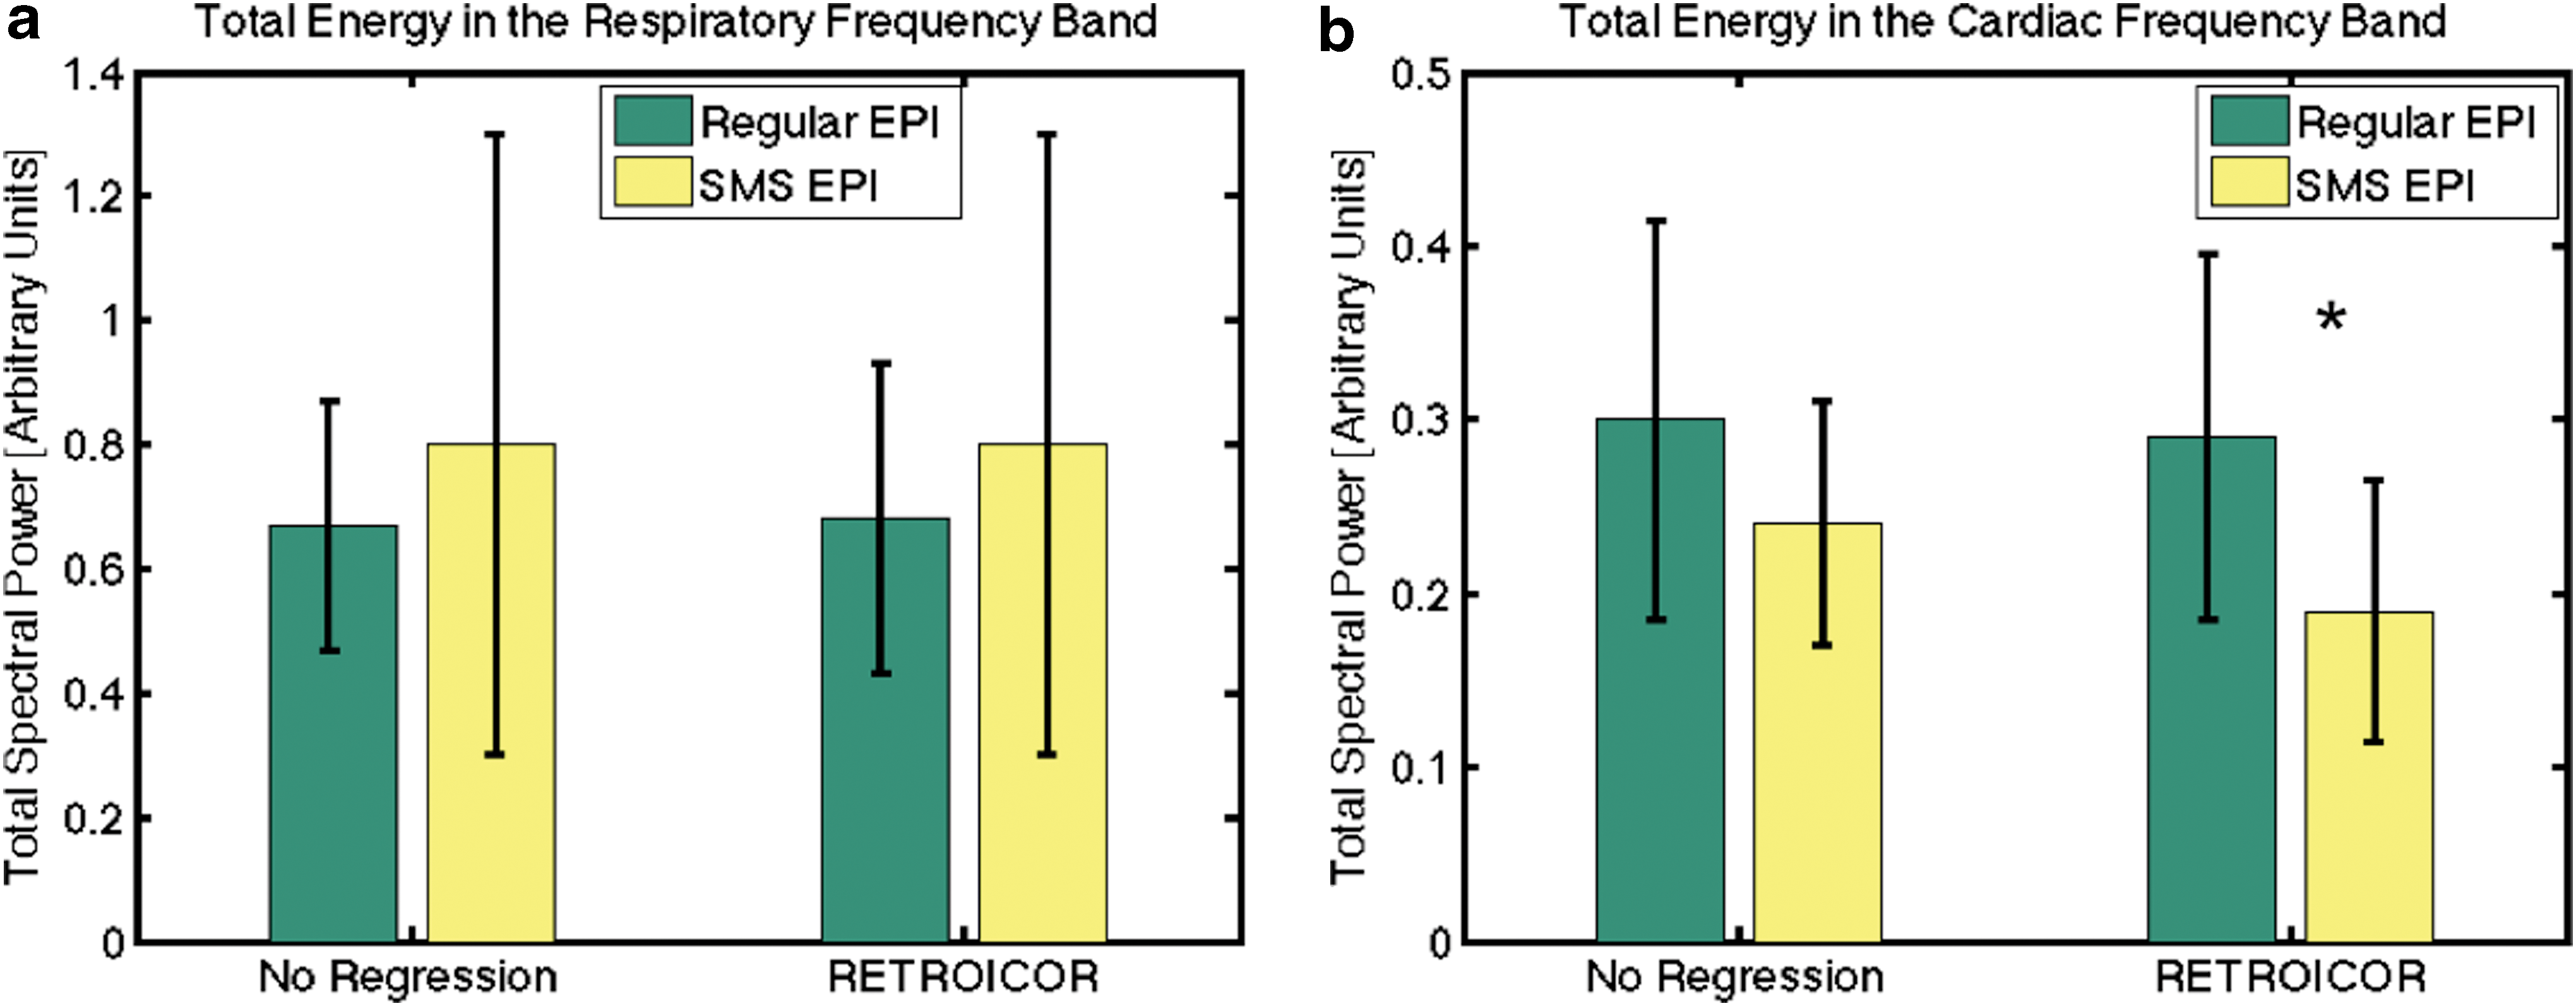
Comparison of respiratory and cardiac spectral power captured by regular and SMS-EPI data. The plotted values represent the whole-brain mean spectral power values averaged across all subjects, and the error bars indicate the standard deviation across subjects.
We list in Table 3 the p-values associated with LME analyses of slice-group effects in SMS-EPI data for the different physiological noise metrics after applying different physiological regression schemes. Without physiological regression (“No Regression”), all physiological noise metrics exhibit significant slice-group effects. After RETROICOR, the slice-group effects in the SMS-EPI data are no longer significant in terms of contributions from the respiratory spectral power, cardiac spectral power, and CRV. However, slice-group effects in the variance explained by respiratory cycles, cardiac pulsation, and RVT remain significant until either RVT regression or CRV regression is performed.
The p-values are associated with the slice-group effect in the linear mixture model analysis.
SMS-EPI rs-fcMRI maps
In Figure 6, we show the gFCD maps averaged across subjects corresponding to the five physiological regression schemes. The group average gFCD and lFCD values are summarized in Figure 7, in which the group mean and standard deviation of both values are plotted for each of the five different physiological regression schemes. The gFCD and lFCD values are both seen to increase as we regress out physiological processes. Significant pairwise differences are shown by asterisks. Notably, for gFCD, significant increases are seen simply after the first-level physiological regression (RETROICOR).
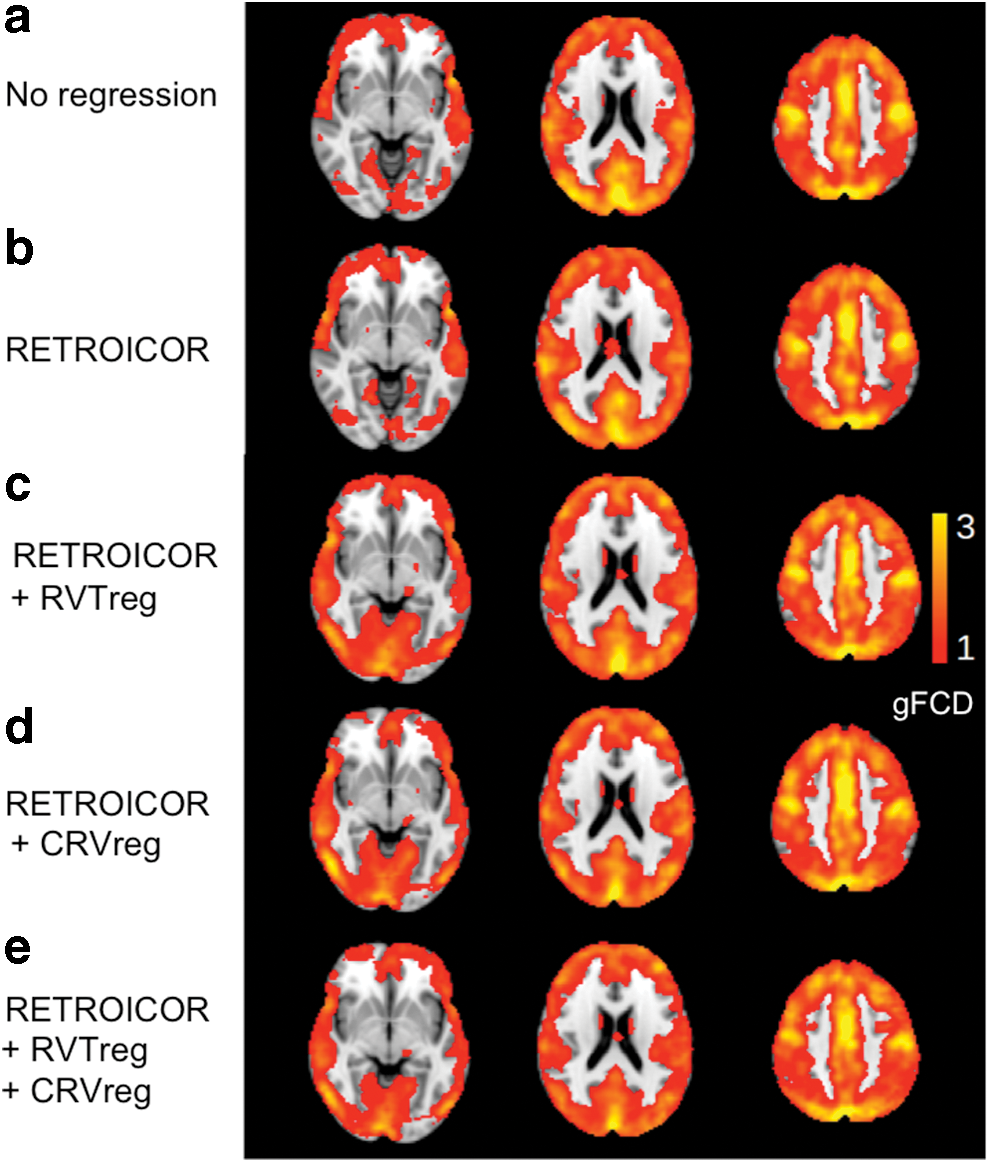
Group average gFCD maps associated with each physiological regression scheme:
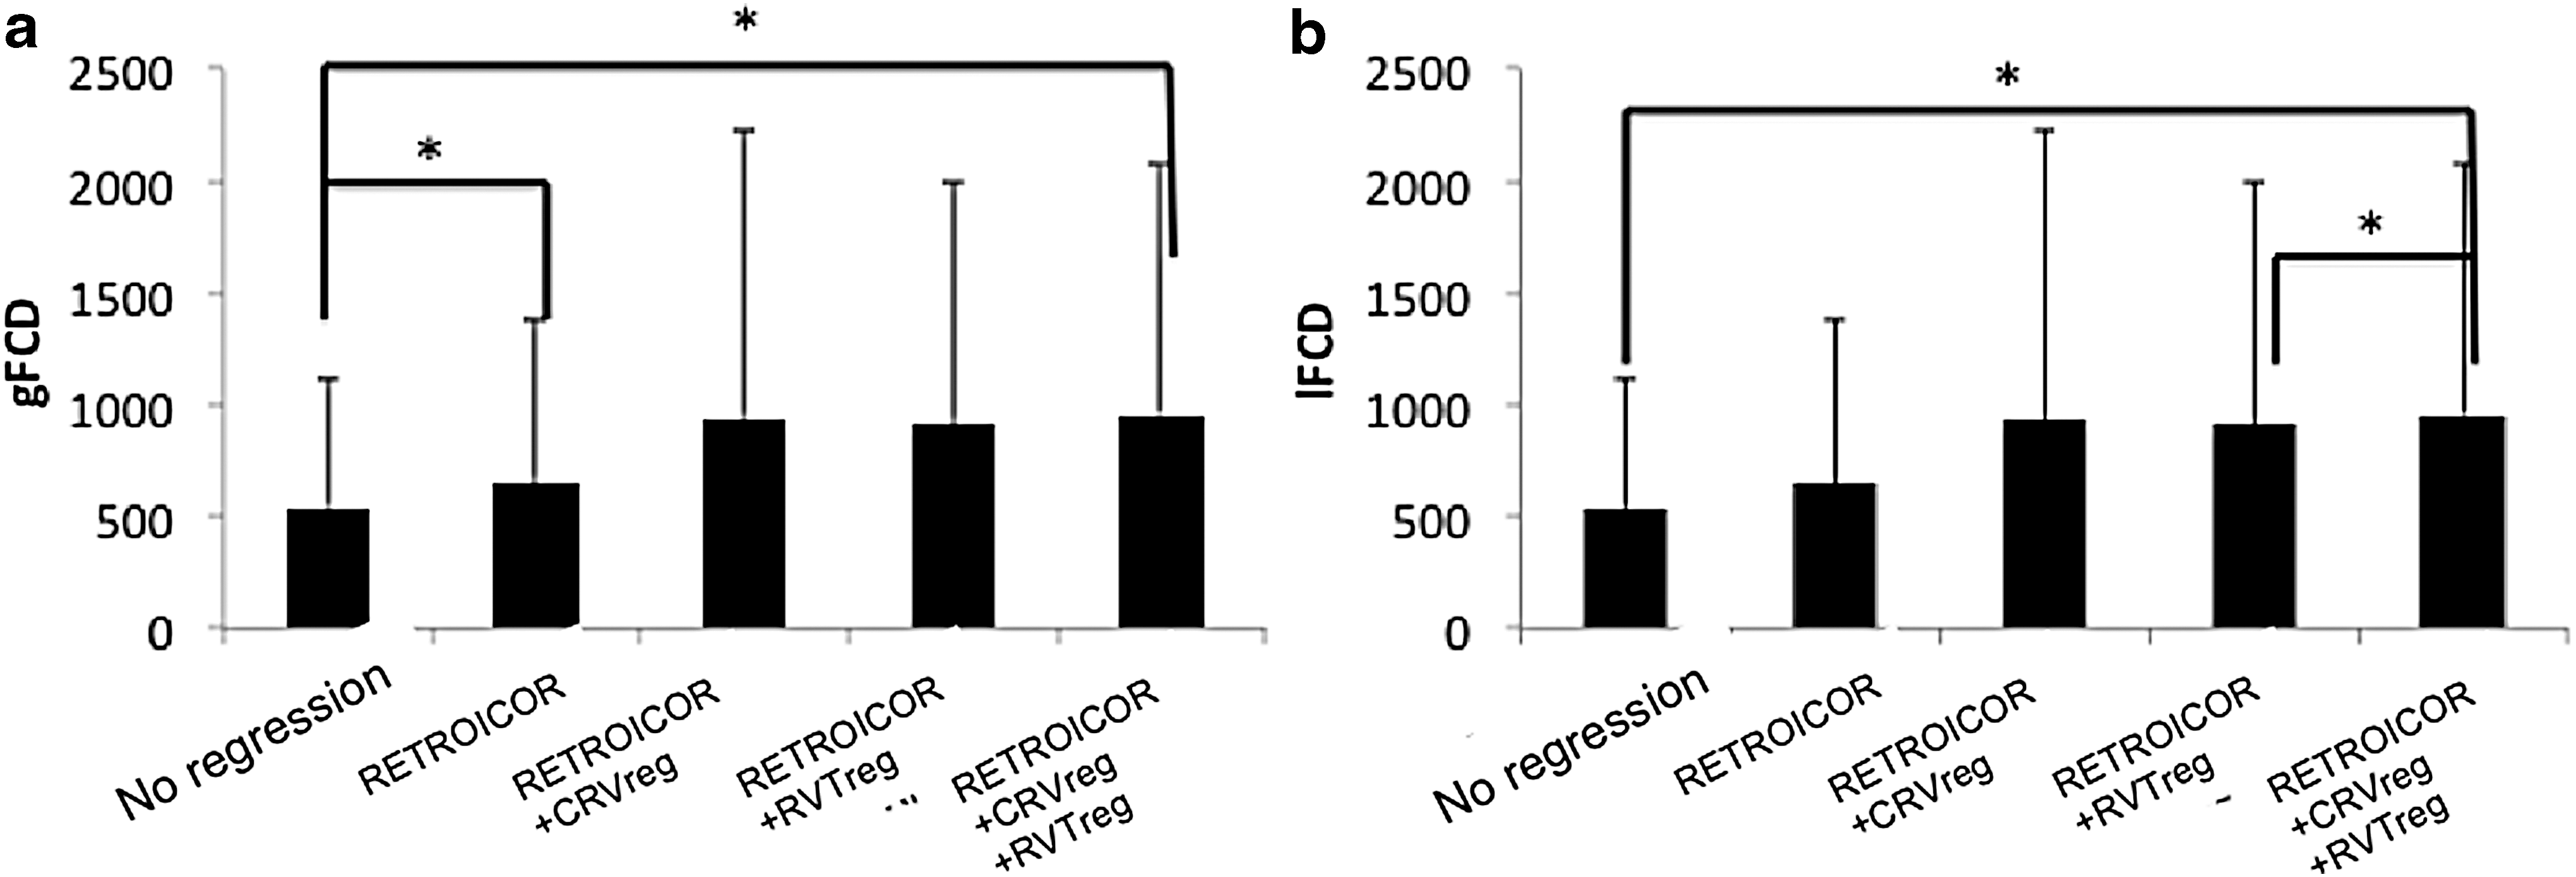
Group average gFCD and lFCD values vary with regression scheme. According to the rANOVA results, physiological regression has a significant effect on both
In Table 4, we summarize the p-values resulting from the slice-group LME modeling for different physiological regression schemes. Without physiological noise correction, the number of local and global FCDs exhibits a significant slice-group effect. With simply first-level regression (i.e., RETROICOR, which implemented regression of the base and harmonics of cardiac and respiratory frequencies), the slice-group effect in both the gFCD and lFCD values is removed.
The p-values associated with the slice-group linear mixed-effect analysis after applying different physiological regression schemes (a–e) are summarized for both global and local FCD. Significant p-values are shown in bold.
gFCD, global functional connectivity density; lFCD, local functional connectivity density.
Discussion
Residual spatial aliasing in SMS acceleration (referred herein as SMS-EPI) can potentially introduce spurious signals from one slice into another in the group of slices acquired simultaneously, and thus can yield temporal dependencies in the aliased voxels within a slice group (referred to as the “slice-group effect” in this work). This slice-group effect can be exacerbated by the presence of physiological fluctuations, the effects of which are widespread. Specifically, as the slices in a slice group are all acquired at the same head position and simultaneously sample the physiological processes, spurious correlations can result and masquerade as functional connectivity. We investigate the preponderance of the SMS-grouping effect on the rs-fMRI signal as well as in the resulting functional connectivity measures, specifically investigating the individual contributions of various physiological processes to this slice-group effect. We found that (1) by default, slice-group dependence exists in the variance contributed by all physiological processes included in this study; (2) slice-group dependence is also found in FCD measurements based on SMS-EPI data; (3) the primary source of the slice-group effect appears to be high-frequency cardiac and respiratory fluctuations; (4) the only physiological process that influences SMS-EPI data more than regular EPI data is low-frequency heart rate variability (CRV).
Physiological contributions to the rs-fMRI signal
The effects of physiological noise on fMRI signals are reasonably well understood, with respiration causing accompanying bulk head motion as well as modulation of the magnetic field by thoracic and abdominal movement (Birn et al., 2006; Glover et al., 2000), and cardiac pulsatility causing partial volume effects adjacent to large-scale as well as small-scale vasculature with a correlation of CRV and fMRI signals in gray matter (Chang et al., 2009; Golestani et al., 2015; Shmueli et al., 2007). SMS-EPI data were associated with greater cardiac-driven variability but less respiratory-driven variability than regular EPI (as seen in Table 2). These findings support our hypothesis that SMS schemes by nature can complicate the effects of physiological fluctuations due to the need for acquiring multiple slices simultaneously. One possible reason for this observation is the intersubject variation in the efficacy of the parallel imaging reconstruction used for unaliasing of the SMS-EPI data, with associated residual-aliasing artifacts containing physiological contributions. Given that the pulse sequence and the coil sensitivity information used for image reconstruction were static (i.e., not updated in real time), the inefficiency of parallel imaging reconstruction could be due to head motion-induced variations in the coil sensitivity profiles that are required for image reconstruction (Faraji-Dana et al., 2016).
The slice-group effect was significant in all physiological metrics included in Table 3. Our results suggest that the physiological mechanisms behind this slice-group effect are high-frequency respiratory and cardiac fluctuations rather than low-frequency variations such as RVT and CRV. This finding establishes the importance of removing these sources of artifacts for SMS-EPI acquisitions, which are becoming increasingly adopted. However, removal of these artifacts becomes more challenging when the fMRI data sampling rate is below the Nyquist rate, causing the high-frequency physiological fluctuations to become aliased. The efficacy of various physiological correction schemes in the face of such aliasing needs to be further investigated. Furthermore, it should be noted that the extent of physiological contribution also depends on the flip angle used in the acquisition (Gonzalez-Castillo et al., 2011). In this study, due to the short TRs used, we opted for flip angles of ∼40°, much lower than the typical rs-fMRI acquisition flip angles of 70–90°. Higher flip angles would be associated with greater physiological noise contributions than documented herein.
Importantly, our results indicate that slice-grouping effects are not a significant concern so long as physiological denoising is included in the preprocessing pipeline. For the most part, no significant difference between SMS and regular EPI was found in terms of the results of regression schemes. However, the regression strategies reduce the impact of cardiac cycles in multiband EPI to a slightly greater extent than in regular EPI, as shown in Figure 5b. This finding suggests that SMS-EPI may be more amenable to physiological correction than regular EPI, although this conclusion remains to be further tested by applying multiple physiological correction approaches. Notwithstanding, the main objective of this work is to demonstrate the physiological mechanisms of the slice-group effect, and not to recommend a specific physiological denoising approach. As some debate remains regarding the correct approach to both denoising and motion correction (Power et al., 2015; Bright et al., 2017), we are not in a position with this article to provide a fair comparison of various model-driven and data-driven physiological denoising strategies.
rs-fcMRI maps
To determine the translation of slice-group effects to functional connectivity measurements, we adopted the FCD approach (Cohen et al., 2017; Tomasi and Volkow, 2010). FCD measurements are not biased by specific seed locations or specific choices of functional network templates, offering the opportunity for a more generalized interpretation of our results.
Removing physiological contributions generally brought about an increase in FCD values (Fig. 7), although to a less extent in lFCD than in gFCD. This is expected, as lFCD reflects local connectivity patterns, and its neighborhood is likely to consist of fewer slices.
Furthermore, in the absence of physiological regression, a significant slice-group effect is present in both the gFCD and lFCD values (as seen in Table 4). As the slice-group effect is mitigated mainly by RETROICOR, we can postulate that the FCD-related slice-group effects are also mediated mainly by the high-frequency respiratory and cardiac cycles. However, we do not preclude the possibility that with improved tSNR, we may be able to distinguish the contributions of low-frequency variabilities such as RVT and CRV to the slice-group effect.
As FCD values are simply an extension of thresholded correlation values, the FCD results can be potentially translated to studies using correlation-based functional connectivity measurements. In a recent study (Cohen et al., 2017), SMS-EPI is shown to improve the reproducibility of FCD maps as well as enhance the gray/white matter FCD difference. The increasing recognition of the advantages of SMS-EPI in resting-state imaging highlights the need to understand the origins of the perceived connections.
Main contributions and recommendation
The main results of this work are that (1) cardiac pulsation influences regular EPI more substantially than SMS-EPI; (2) low-frequency cardiac rate variability influences SMS-EPI more than regular EPI, and in a manner that depends on the slice grouping in the acquisition process; (3) physiological processes affect FCD maps derived using SMS-EPI data in a slice-group-dependent manner; (4) the main observable sources of slice-group effects in signal variability and functional connectivity appear to be high-frequency respiratory and cardiac fluctuations.
While the observed slice-grouping effects on fcMRI results are small in the general sense, these small effects are often pivotal findings in fcMRI studies, in which the sought after effects can often be subtle. Therefore, we caution against neglecting these effects. At the same time, our results suggest a promising follow-up comparison of various physiological correction techniques in terms of addressing the observed slice-group effects.
Potential caveats
All the participants were asked to close their eyes during the rs-fMRI scans. Tracking the participant's state of vigilance was not possible and we are not able to comment on the extent that variability in vigilance influenced our findings. This is a well-known confound in rs-fMRI, and yet, eyes-closed rs-fMRI is commonly performed. Although standardizing the level of alertness among participants was not possible, the inherent interparticipant differences are more representative of the variability expected in typical rs-fcMRI data sets and therefore relevant to current standard practices. As we used repeated-measures statistics, the interparticipant variability does not undermine our conclusions regarding the impact of physiological regression. Furthermore, bias was avoided by randomizing the order of regular EPI and SMS-EPI acquisitions across participants.
In computing CRV, we used a four-beat window instead of the 6-sec window used previously by Chang et al. (2009). The previously used 6 sec was equivalent to 3 TRs (TR = 2 sec). In contrast, in our study, as we had much shorter TRs, we were not constrained to using windows that are integer multiples of TR. Our previous publication used a similar approach to compute CRV when addressing the heart rate variability response function (Golestani et al. 2015) and did not observe a marked difference with the findings of Chang et al.
Another caveat involves the signal variations induced by head motion that potentially affect evaluation of the physiological noise metrics both for regular EPI and SMS-EPI, and the SMS-EPI rs-fcMRI maps. In this work, head motion characteristics were in the same range for both regular and SMS-EPI data sets across all participants. Retrospective rigid body volume alignment was also used to correct for this issue. However, residual nonrigid body artifacts such as dynamic geometric distortion and changes in coil sensitivity reference maps (Cohen et al., 2017; Faraji-Dana et al., 2016) can still affect the data sets differently and thus can create biases in the comparison process or in SMS-EPI rs-fcMRI maps. Applying further regressions to both the regular EPI and the SMS-EPI fMRI data sets can potentially provide a more robust comparison as well as more reliable SMS-EPI rs-fcMRI maps.
A further limitation of the present work involves the analysis of only seven slices of the brain when comparing with regular EPI data. Due to the desire to sample quickly, we were unable to acquire whole-brain regular EPI data. As a result of this restricted spatial coverage, we will need to establish the global generalizability of our findings in the first half of the study. However, it is expected that any bias introduced by studying a restricted set of slices was reduced by averaging over the cohort.
In contrast to the work of Xu et al. (2013), where the performance of multiple slice acceleration factors and phase-encoding shift factors was compared in rs-fMRI, the present work compared only one SMS-EPI parameter set to that of regular EPI. Thus, no claims of generality can be made, and other SMS-EPI settings may show different physiological noise patterns than the ones chosen here. Nonetheless, our approach was informed by the typical acceleration and phase-encoding shift recommendation provided by the Center for Magnetic Resonance Research (CMRR), and is therefore informative to those adopting similar recommendations. The work provides initial evidence, rather than detailed characterization, of the effects of physiological noise in SMS-rs-fMRI, and highlights the potential for differences in physiological noise sensitivity between MR-EPI and regular EPI. Additional research will be required to confirm and replicate the effects and to determine their generality.
Finally, the “ground truth” in rs-fcMRI maps is unfortunately unavailable (i.e., precise knowledge of the true spatial pattern of brain activity). Thus, our target is not “accuracy” but rather the slice-group effect, which is presumably undesirable and detrimental to accuracy. Nonetheless, in most applications of rs-fcMRI, the target is the “between-group effect,” and averaging across connectivity maps is the norm. We recognize that the improvement of our ability to perceive “true connectivity” remains one of the greatest challenges in the field.
Conclusions
The present work characterizes the slice-group effects in the contribution of physiological processes to the rs-fMRI signal, a topic of specific interest to slice-accelerated fMRI (SMS-EPI). We find that physiological noise inherently affected SMS-EPI and the regular EPI fMRI data sets differently, and that, without correction, slice-group effects would permeate not only the signal time courses but also functional connectivity values. Such effects could provide misleading fcMRI results when SMS-EPI is used. Our findings suggest that comprehensive physiological correction is arguably even more important for SMS-EPI than for regular EPI.
Footnotes
Acknowledgments
This work was made possible with the support of the Natural Sciences and Engineering Research Council of Canada (NSERC) and Queen Elizabeth II scholarships.
Author Disclosure Statement
No competing financial interests exist.
References
Supplementary Material
Please find the following supplemental material available below.
For Open Access articles published under a Creative Commons License, all supplemental material carries the same license as the article it is associated with.
For non-Open Access articles published, all supplemental material carries a non-exclusive license, and permission requests for re-use of supplemental material or any part of supplemental material shall be sent directly to the copyright owner as specified in the copyright notice associated with the article.