
Abstract
Radiation therapy (RT) is a critical treatment modality for patients with brain tumors, although it can cause adverse effects. Recent data suggest that brain RT is associated with dose-dependent cortical atrophy, which could disrupt neocortical networks. This study examines whether brain RT affects structural network properties in brain tumor patients. We applied graph theory to MRI-derived cortical thickness estimates of 54 brain tumor patients before and after RT. Cortical surfaces were parcellated into 68 regions and correlation matrices were created for patients pre- and post-RT. Significant changes in graph network properties were tested using nonparametric permutation tests. Linear regressions were conducted to measure the association between dose and changes in nodal network connectivity. Increases in transitivity, modularity, and global efficiency (n = 54, p < 0.0001) were all observed in patients post-RT. Decreases in local efficiency (n = 54, p = 0.007) and clustering coefficient (n = 54, p = 0.005) were seen in regions receiving higher RT doses, including the inferior parietal lobule and rostral anterior cingulate. These findings demonstrate alterations in global and local network topology following RT, characterized by increased segregation of brain regions critical to cognition. These pathological network changes may contribute to the late delayed cognitive impairments observed in many patients following brain RT.
Introduction
R
Previous research has focused on the adverse effects of RT on white matter (Connor, 2016; Steen et al., 2001) and the hippocampus (Karunamuni et al., 2016; Khuntia et al., 2006). However, less attention has been given to neocortical atrophy; until recently, the neocortex was thought to be radioresistant. Recent research has shown widespread RT-induced atrophy to association cortex (Karunamuni et al., 2016; Kim et al., 2004), and there is emerging evidence that cortical atrophy is dose dependent and most pronounced in temporo-limbic and parietal regions (Karunamuni et al., 2016; Seibert et al., 2016). Karunamuni and colleagues (2016) demonstrated cortical thinning of up to 0.3 mm in the highest dose regions 1 year post-RT, which exceeds the annual atrophy rate (0.07–0.1 mm) observed in patients with Alzheimer's disease (AD) (Sabuncu et al., 2011; Thompson et al., 2003). Given the magnitude of cortical thinning and the well-established role of association cortex in memory and other aspects of cognition, RT-induced neocortical atrophy could represent an important substrate for longer term cognitive disability.
A major advance within neuroscience in the past decade has been a shift in focus from how disease and treatment-related factors affect discrete brain regions to how they disrupt large-scale brain networks. Because complex cognitive processes depend on the orchestration of multiple brain regions (Barbey et al., 2014), a closer look at network disruption may provide insight into the development of cognitive dysfunction in patients undergoing RT.
One approach to quantifying both local and global damage caused by RT is to probe changes in the underlying network topology using measures derived from network models, such as graph theory (Bosma et al., 2009; Douw et al., 2010). Transitivity and global efficiency are among the major graph theory parameters that illustrate the degree of brain segregation and integration, respectively (Bullmore and Sporns, 2012; Griffa et al., 2013). Furthermore, previous studies have shown that the brain is organized into modules of interconnected regions with the same functional specialization (Bressler and Menon, 2010; Ghazanfar and Schroeder, 2006; Hagmann et al., 2008). Therefore, modularity is a parameter that can represent this network characteristic (Hagmann et al., 2008), with increases in modularity suggesting that brain regions are well connected within their module, but are poorly connected with regions belonging to other modules. Hubs represent another major concept in graph theory and are defined as important brain regions that interact with many other nodes, ease functional integration, and play an essential role in network resilience to insult. Measures of node centrality variously evaluate the importance of individual nodes on the above criteria (Rubinov and Sporns, 2010; Sporns, 2011).
In addition to the above measures, local network connectivity metrics (e.g., local efficiency and clustering coefficient) can be derived, which exploit topological changes at a regional level that may not be represented by the global network structure. In particular, clustering coefficient represents the amount of segregation in the whole network and has previously been shown to correlate with cognitive decline (Liu et al., 2008; Yu et al., 2015). Collectively, these metrics have been combined to characterize topological brain changes across a range of neurological and psychiatric disorders, including mild cognitive impairment (MCI) (Pereira et al., 2016), AD (Bullmore and Sporns, 2009; Pereira et al., 2016; Tijms et al., 2013a), vascular dementia (Tomasi and Volkow, 2011; Wang et al., 2016), Parkinson's disease (Helmich et al., 2010), and schizophrenia (Alexander-Bloch et al., 2013c). Although different MRI modalities and metrics have been used to probe network changes across studies, results have consistently revealed aberrant network organization in patients that deviates from an efficient small-world configuration observed in healthy controls (Stam et al., 2007; Uehara et al., 2014).
Neuronal loss, axonal damage, and demyelination associated with RT may lead to a loss of connections and/or the development of abnormal connections among distributed brain regions and, consequently, result in either the fragmentation or reorganization of structural brain networks (Alexander-Bloch et al., 2013b). Changes in these inter- and intraregional connectivity patterns can be evaluated by measuring the covariance of cortical thinning before versus after RT (Alexander-Bloch et al., 2013a). Evidence that cortical thickness in one region affects the thickness of structurally and functionally connected regions has been illustrated in previous studies that have tracked large cohorts of individuals through adolescence with longitudinal imaging and shown that areas that are structurally covariant are also correlated in terms of the rate of change in cortical thickness (Alexander-Bloch et al., 2013a; Raznahan et al., 2011). Therefore, we choose changes in the covariance of cortical thinning across brain regions as our measure of structural network connectivity associated with RT.
To date, no studies have examined the effects of fractionated RT on cortical network changes in patients with brain tumors. Due to evidence that RT may result in damage to vascular endothelial cells and to the hippocampus (Kim et al., 2004; Seibert et al., 2017), studies that have applied graph theory to examine cortical networks in patients with AD may serve as good models (He et al., 2008; Pereira et al., 2016; Tijms et al., 2013b). He and colleagues (2008) used cortical thickness to investigate large-scale structural brain networks in AD and normal controls. They show increased segregation in patients with AD compared with normal controls, characterized by increased average clustering coefficient of all nodes (He et al., 2008). In another large-scale structural connectivity study (N = 1008) of patients with MCI and AD, Pereira and colleagues (2016) demonstrated abnormal global network organization, characterized by an increased path length, reduced transitivity, and increased modularity, in both patient groups relative to controls. In contradiction, Tijms and colleagues (2013b) used single-subject gray matter graphs to show that cortical networks in patients with AD were characterized by a decreased clustering coefficient, which indicates decreases in segregation (Tijms et al., 2013b). Thus, there is some disagreement across studies, both in terms of the graph theory metrics tested and the directionality of findings at both the local and global network levels (e.g., increased vs. decreased segregation). However, the existing literature uniformly suggests that patients with AD show abnormal cortical network topology compared with controls that may underlie their insidious cognitive decline (Dai and He, 2014; He et al., 2009; Reid and Evans, 2013; Tijms et al., 2013b).
The aim of the current study was to establish whether fractionated RT leads to global and/or local changes in structural network topology. We applied graph theory to MRI-derived cortical thickness estimates of 54 patients with primary brain tumors before and after RT. We selected cortical thickness as our metric of interest due to previous literature demonstrating the sensitivity of this measure to both radiation injury (Karunamuni et al., 2016; Seibert et al., 2016) and vulnerability in other patient populations (He et al., 2008; Li et al., 2012). We examined both global and local changes in network topology and analyzed the effects of regional RT dose on local network properties. We also evaluated whether RT affects the identification and distribution of major network hubs in the brain that are known to be critical to cognitive processing. Based on proposed mechanisms of brain injury from RT (i.e., neuronal loss and axonal injury) and existing research in AD, we hypothesize that (a) whole-brain segregation will increase and brain integration will decrease in patients post-RT and (b) local network connectivity metrics (e.g., local efficiency and clustering coefficient) will decrease with increases in radiation dose.
Materials and Methods
Patients
We analyzed a cohort of 58 patients with primary brain tumors. All patients underwent fractionated (1.8–2.0 Gy per fraction) partial brain irradiation at UC San Diego Moores Cancer Center between 2010 and 2014. Radiation dose is measured in Gray (Gy), the unit of biologically absorbed dose. To be included, the patients also had to have acquired MRI before RT (or within the first week of RT start) and approximately 1 year after RT start (9–15 months). Three patients were excluded due to poor image quality and one was excluded due to a large surgical resection, resulting in a final cohort of 54 patients for analysis. Forty-four of the 54 patients (age: median = 54, range = [19–77]) were treated with a total of 30 fractions (treatments). Radiation dose for the other 10 patients was converted using alpha/beta = 2 Gy at each location in the volume to a 30-fraction equivalent for direct comparison (Fowler, 1989).
Image acquisition and preprocessing
MR images were acquired on a 3T Signa Excite HDx system (GE Healthcare, Milwaukee, WI) using an 8-channel dedicated head coil. Images were acquired before start of RT and at approximately 1 year after completion of RT. The standardized protocol included a 3D T1-weighted inversion recovery spoiled gradient-echo sequence (TE, 2.8 ms; TR, 6.5 ms; TI, 450 ms) and T2-weighted FLAIR sequence (TE, 126 ms; TR, 6000 ms; TI, 1863 ms). Images were corrected for geometric distortions (Jovicich et al., 2006) before rigid-body coregistration of the pre-RT MRI to the CT simulation images used in radiation treatment planning using custom software (Karunamuni et al., 2016). Quality control was performed on the registration and they were confirmed visually, thereafter the resulting transformation matrix was used to resample the delivered radiation dose distribution from the treatment plan to the MRI volume space.
Cortical thickness
Cortical thickness was estimated by reconstructing the cortical surface from each T1-weighted MRI volume, weighted by T2-weighted FLAIR to correct for edema or hypointensity using FreeSurfer software (
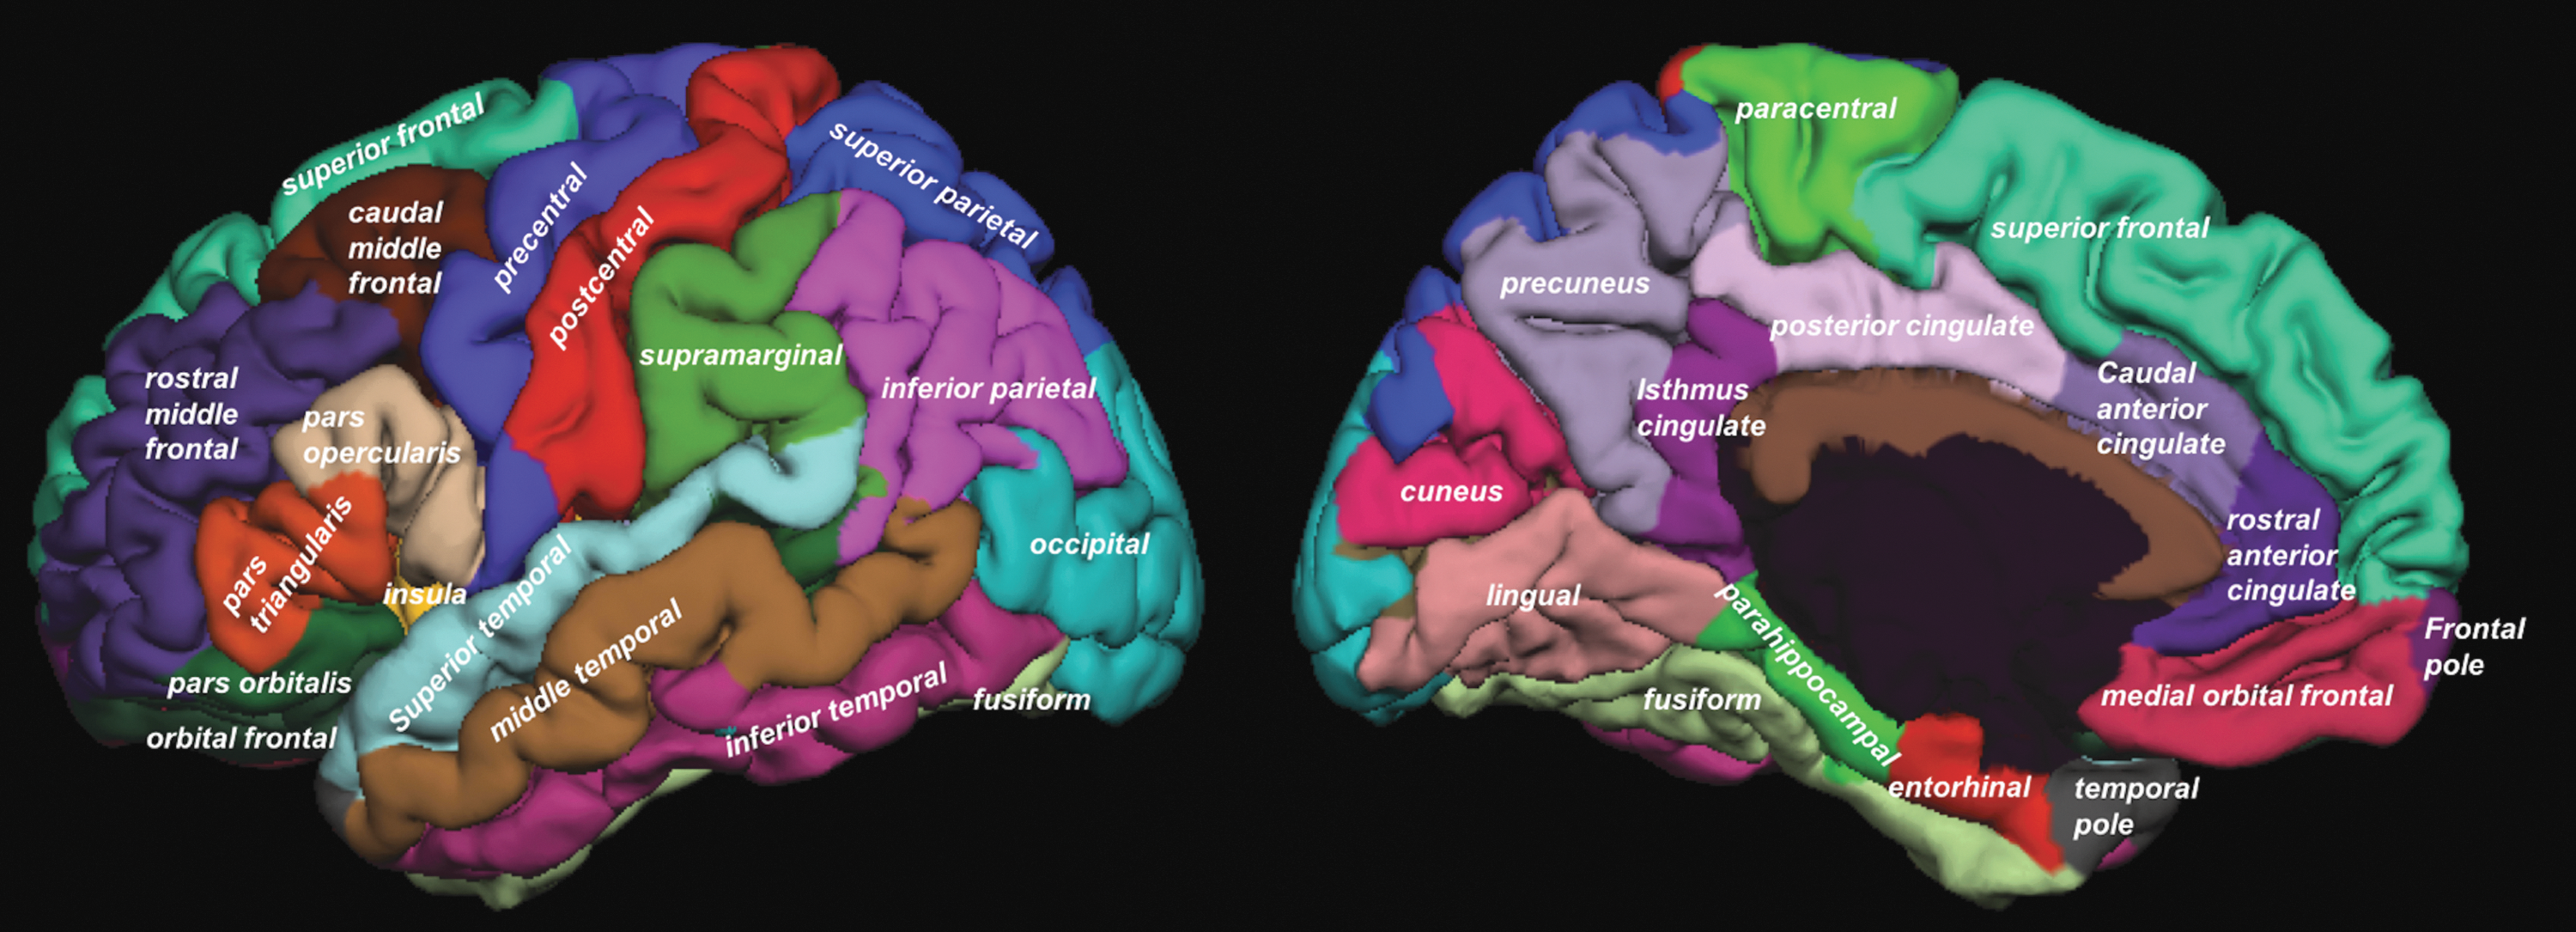
Cortical regions from the Desikan–Killiany atlas using FreeSurfer. Color images available online at
Network construction
For each time point (pre- and post-RT), a 68 × 68 symmetric–weighted network (matrix) of the structural connectivity in the whole brain was constructed at the group level using partial correlations with patients' age and sex as covariates. Each value in this matrix represents the connectivity strength between two related nodes (regions). We constructed population brain networks over a wide range of network densities, 0.1 ≤ Sthr ≤ 0.6, with an increment of the threshold by 0.01, where the global structural network metrics were analyzed. Structural network connectivity metrics of integration (global efficiency), segregation (transitivity and modularity), and local properties (local efficiency and clustering coefficient) were then extracted from the correlation matrices using the Brain Connectivity Toolbox at each time point (Rubinov and Sporns, 2010). All of these metrics have been shown to have good to excellent test-retest reliability in a recent systematic review (intraclass correlation coefficients >0.60 in 21 of 25 studies) (Welton et al., 2015).
Network properties
A detailed description of graph theory and the following network parameters can be found in a study by Rubinov and Sporns (2010). We briefly describe each metric calculated in our study below.
Modularity is a statistic that quantifies the degree to which the network may be subdivided into clearly delineated groups (Fig. 2A). It is calculated as the fraction of the edges that fall within the given groups minus the expected fraction if edges were distributed at random (Newman, 2006).
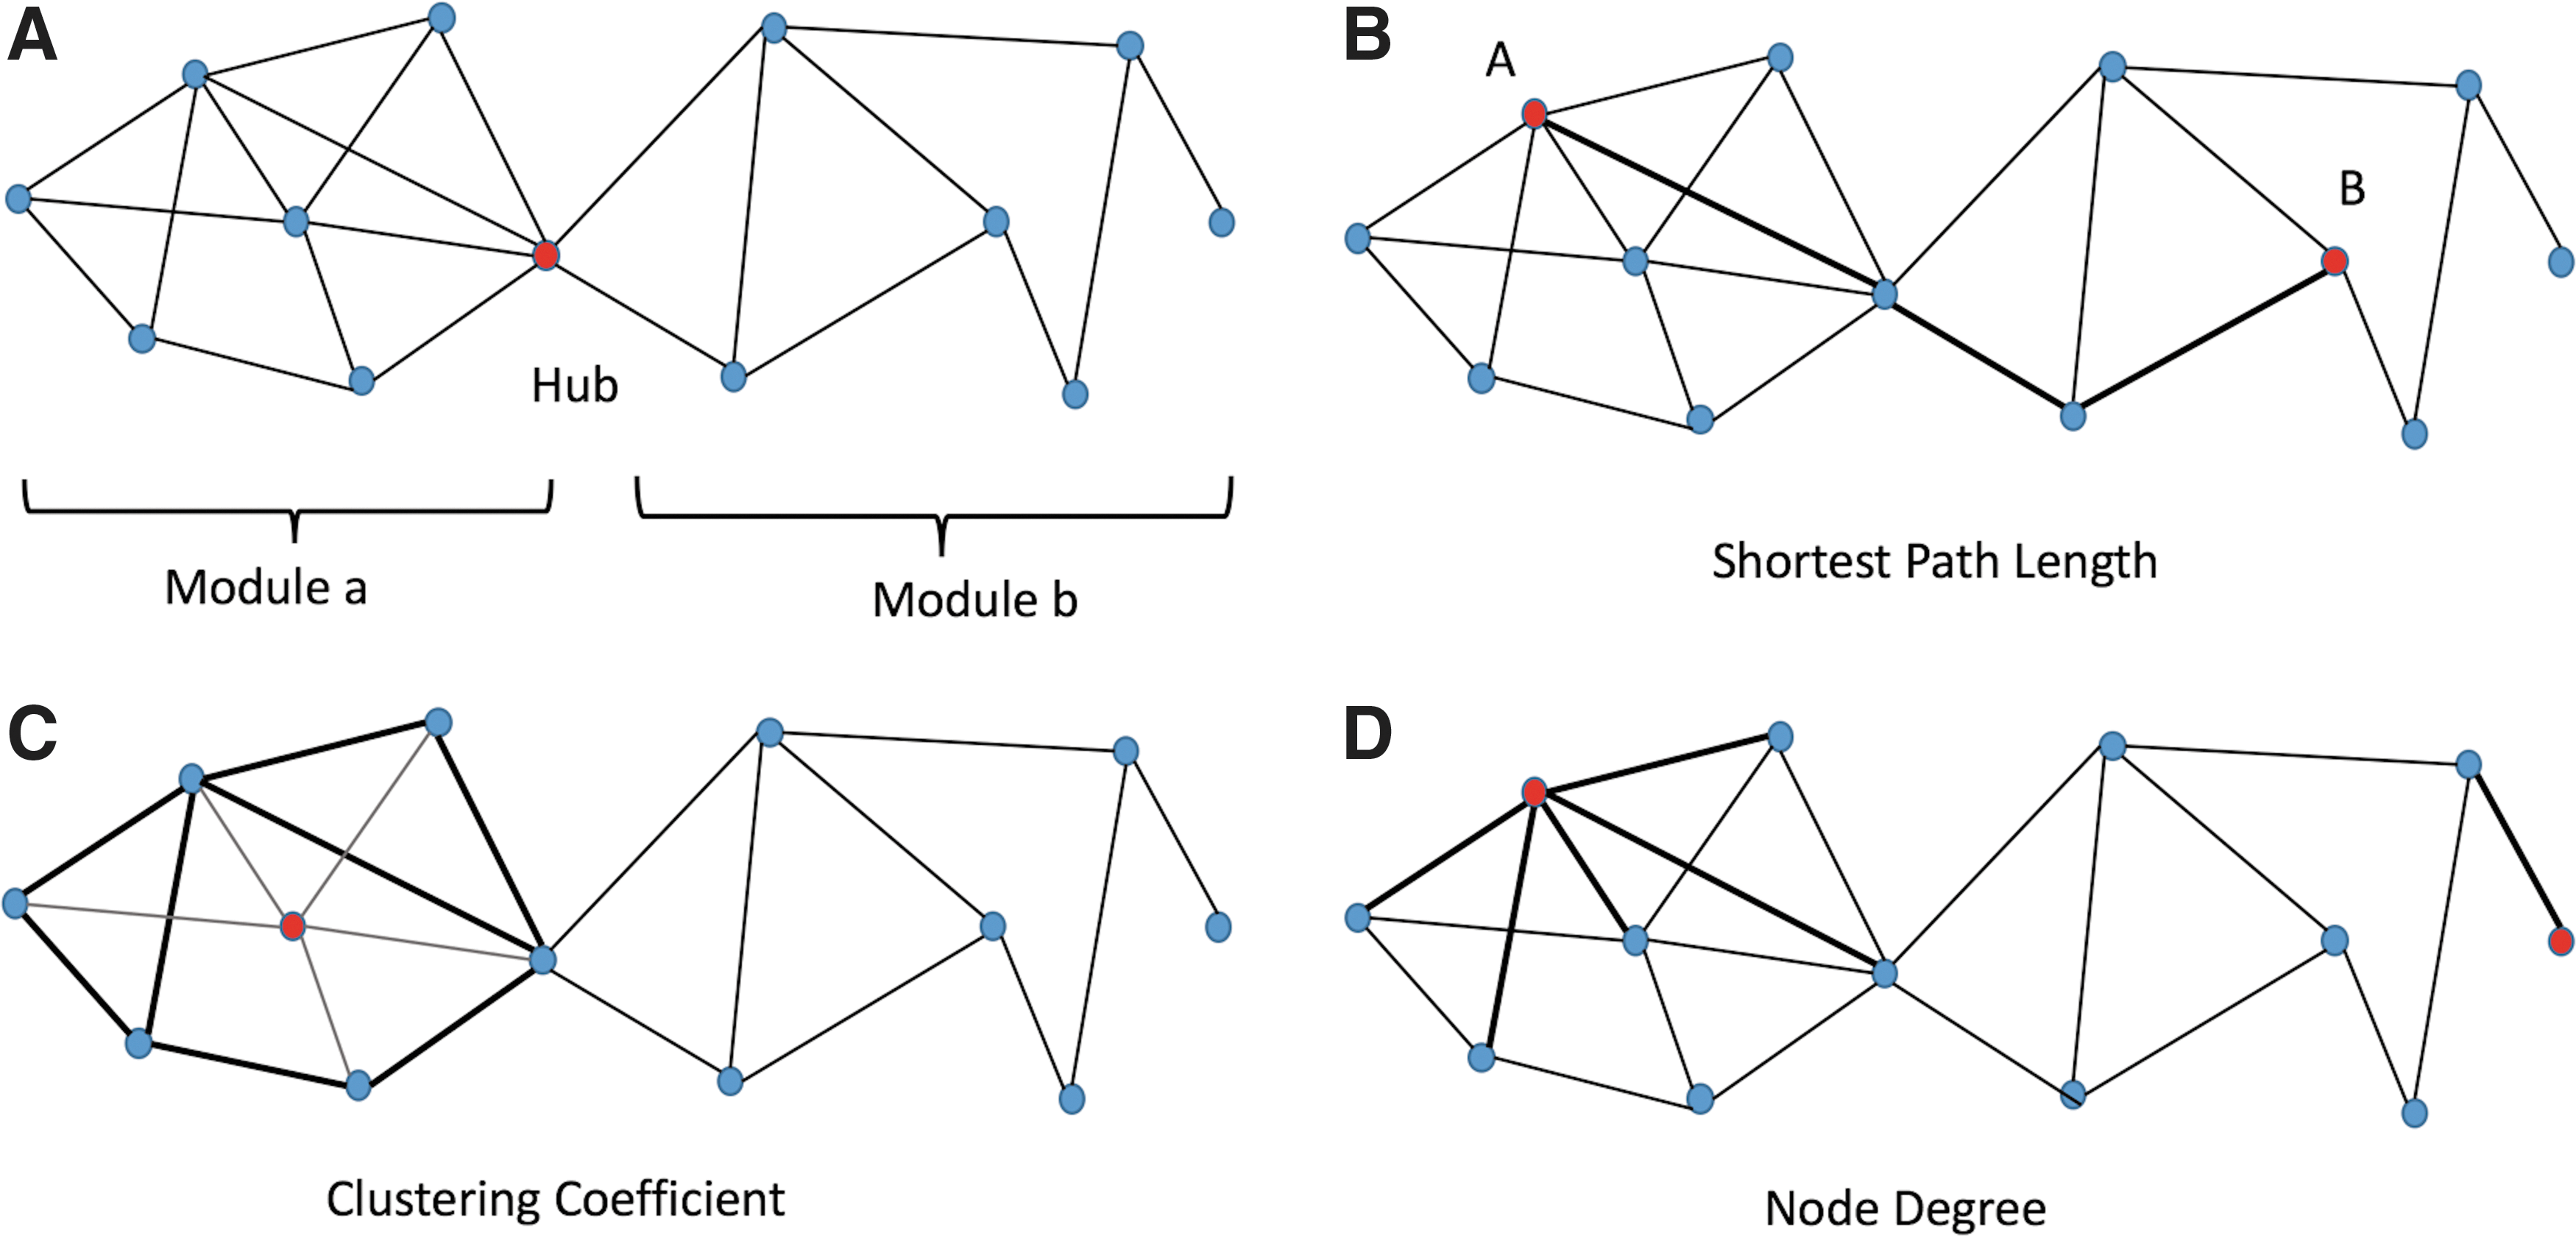
Graph theory measures are depicted in a rendering of a simple graph with 13 nodes and 21 edges.
Transitivity is quantified based on the fraction of triangles over triplets of nodes. A triplet involves three nodes that are connected by either two or three undirected ties. A triangle involves the three closed triplets, in which one of them is in the middle of the other nodes. Transitivity is the number of maximum triplets (3 × triangles) divided by the total number of triplets (Holland and Leinhardt, 1971; Rubinov and Sporns, 2010) as shown below:
where t is number of triangles and T is number of triplets in the whole network.
To create the network efficiency properties, we measured the shortest path length (dij) (Fig. 2B) between each pair of nodes in the network and computed the inverse value of this length. In a network with N nodes, the inverse value of mean dij
is the network global efficiency as follows (Latora and Marchiori, 2001):
Local efficiency was calculated using the global efficiency from the adjacent subgraph of the node. We averaged the local efficiencies across all nodes to estimate the total network local efficiency as described below:
Clustering coefficient is the fraction of triangles around a node and can be computed as described below (Fig. 2C) (Watts and Strogatz, 1998):
where k is the degree of the node.
Hub identification
Centrality is a topological measure of the importance or influence of a node or edge for network organization (Bullmore and Sporns, 2012). The centrality of a node measures how many of the shortest paths between all other node pairs in the network pass through it (Bullmore and Sporns, 2009; Freeman, 1977). Node degree (Fig. 2D), closeness, and betweenness centralities are among the different types of centralities that are tested in brain connectivity studies (Bullmore and Sporns, 2009; Crossley et al., 2014).
Hub nodes generally show an above average number of connections, a high level of (betweenness) centrality, a short characteristic path length in the network, and a low clustering coefficient (Heuvel et al., 2010; Sporns et al., 2007). We identified major hubs in the network both pre-RT and post-RT to examine whether patients undergo changes in hub distribution as a result of RT. We scored each region based on their node degree, betweenness centrality, characteristic path length, and clustering coefficient (Heuvel et al., 2010). Nodes were scored a one if they were in the highest 20th percentile of node degree and betweenness centrality and lowest 20th percentile of clustering coefficient and path length. The rest of nodes were scored zero. Nodes with a sum score of 2 or more were identified as hubs (Heuvel et al., 2010).
Statistics
Significant pre- to post-RT changes were tested using nonparametric permutation tests with 1000 permutations (Bassett et al., 2008; He et al., 2008). The randomization procedure was repeated 1000 times for every density value (50) and network parameters were extracted for every density in both time points. Correlation matrices (68 × 68) using partial Pearson correlation coefficients (with age and sex as covariates) were created for each time point. Matrix calculations and permutations were conducted using R. Two-tailed t-tests were conducted to demonstrate the difference in network connectivity metrics pre- and post-RT in all connectivity densities. Bonferroni correction was conducted to correct for multiple comparisons across various network densities (N = 50 density levels; p-value = 0.001) (Haynes, 2013). Linear regression (adjusted for age and sex) was conducted to measure the association between radiation dose (continuous variable) and changes in nodal network connectivity metrics in each region using JMP (JMP Pro, Version 12.0.0. SAS Institute, Inc., Cary, NC, 1989–2007).
Results
Patient, tumor, and treatment characteristics of the cohort are shown in Table 1, including sex, age, histology, tumor location, and radiation fractionation schemes.
Global network analysis
With increasingly higher values of network density, the modularity decreased, whereas the global efficiency and transitivity increased at both time points (Fig. 3). Higher density values indicate the existence of a denser matrix and a more conservative cutoff point to calculate the graph properties.
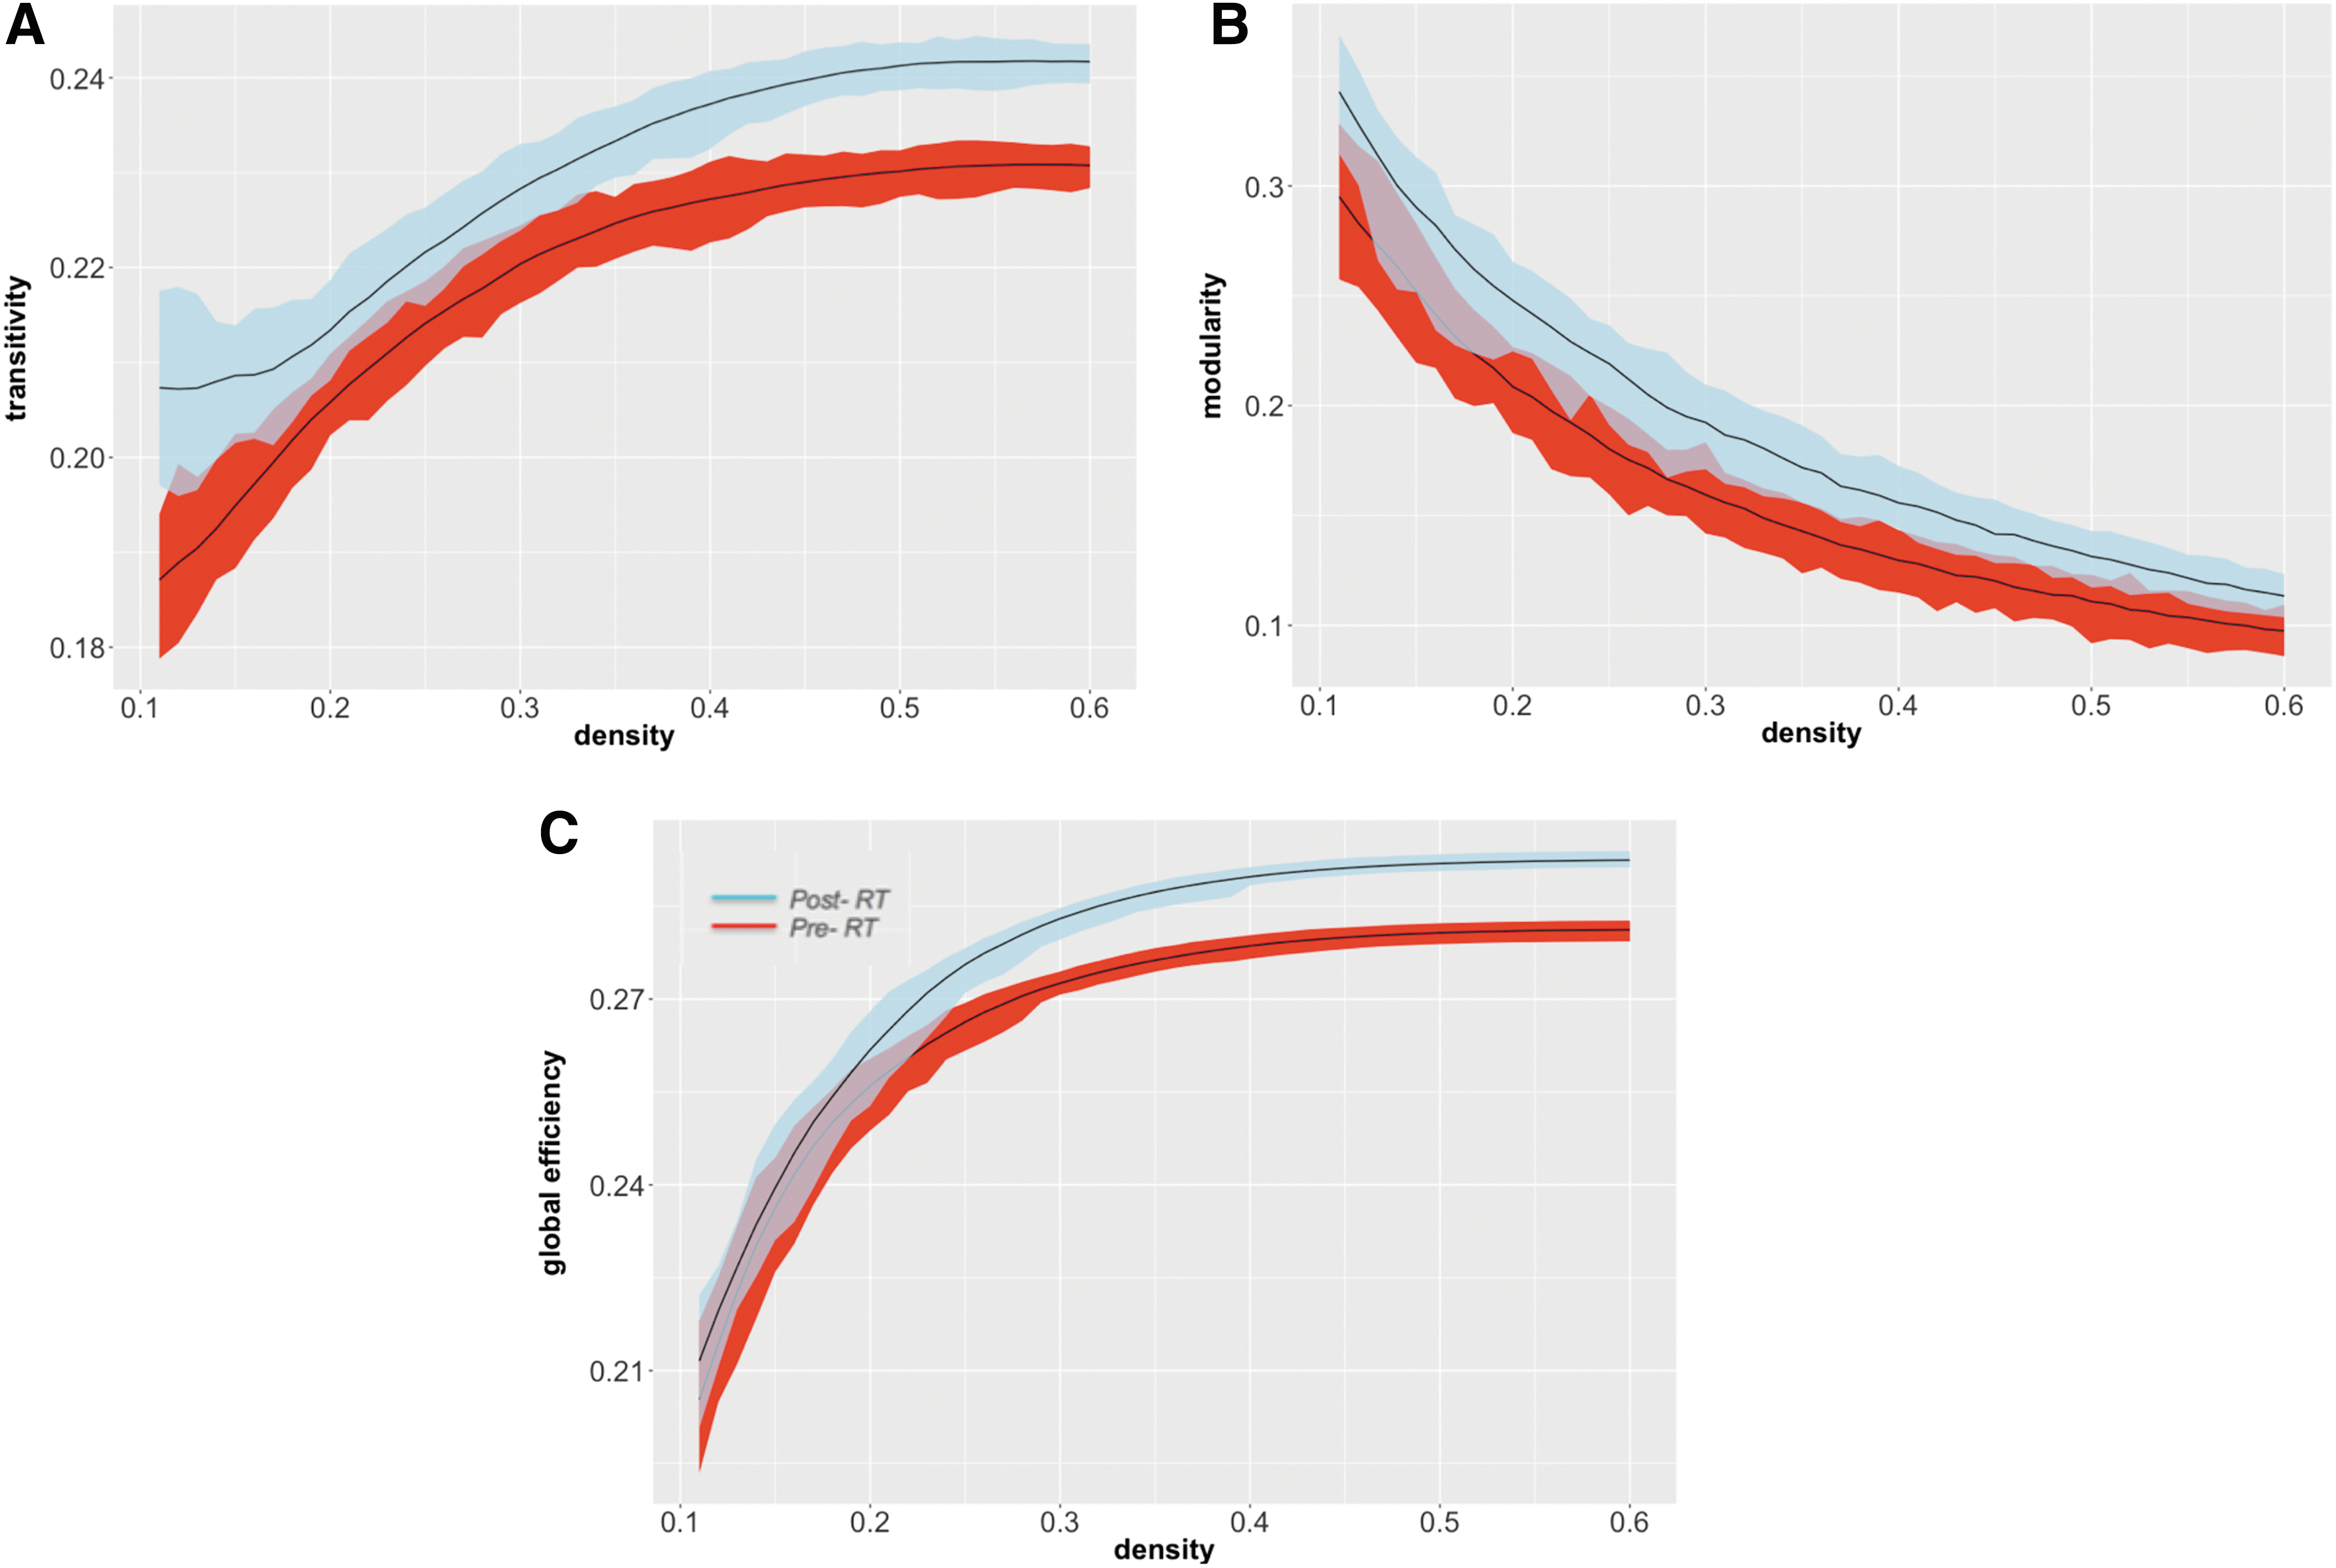
Pre- to post-RT changes in global network measures. Plots show the differences in transitivity
Whole-brain analysis
Increases in transitivity (p < 0.0001, CI = [0.0110, 0.0171]; Fig. 3A), modularity (p < 0.0001, CI = [0.0176, 0.0406]; Fig. 3B), and global efficiency (p < 0.0001, CI = [0.0072, 0.0112]; Fig. 3C), relative to pre-RT, were observed in brain tumor patients after RT. These changes were particularly robust at higher network densities for global efficiency and transitivity, suggesting that group differences are more noticeable in denser matrices due to removal of the noisy and extremely weak connections.
Contralateral hemisphere analysis
We also analyzed changes in network properties in the hemisphere contralateral to the tumor location to ensure that network changes were not associated with local tumor effects (34 regions in each hemisphere). Pre- to post-RT changes in the network properties showed the same patterns as demonstrated for the whole-brain analysis. For patients with left hemisphere brain tumors (N = 31), increases in transitivity, modularity, and global efficiency after RT were observed in the right hemisphere (p < 0.0001, CI = [0.0155, 0.0299]; p < 0.0001, CI = [0.0234, 0.0333]; and p < 0.0001, CI = [0.0038, 0.0185], respectively). In patients with right hemisphere brain tumors (N = 23), similar increases were observed in the left hemisphere (transitivity: p < 0.0001, CI = [0.0029, 0.0437]; modularity: in 42% of the densities p < 0.0001, CI = [0.0341, 0.0136]; and global efficiency: in 82% of the densities p < 0.0001, CI = [0.0217, 0.0292]).
Local network analysis
We identified two major nodal network measures (i.e., local efficiency and clustering coefficient) based on the RT dose to each region. Decreases in local efficiency (p = 0.007, r = −0.321, Fig. 4A) and clustering coefficient (p = 0.005, r = −0.335, Fig. 4B) were seen in regions receiving higher doses of RT. Inferior parietal lobule (IPL), postcentral gyrus (PC), and rostral anterior cingulate (RAC) were among the regions with the highest decreases (top 5th percentile) in local efficiency (−2.80%, −2.92%, and −2.25%, respectively) and clustering coefficient (−6.12%, −5.90%, and −5.30%, respectively).
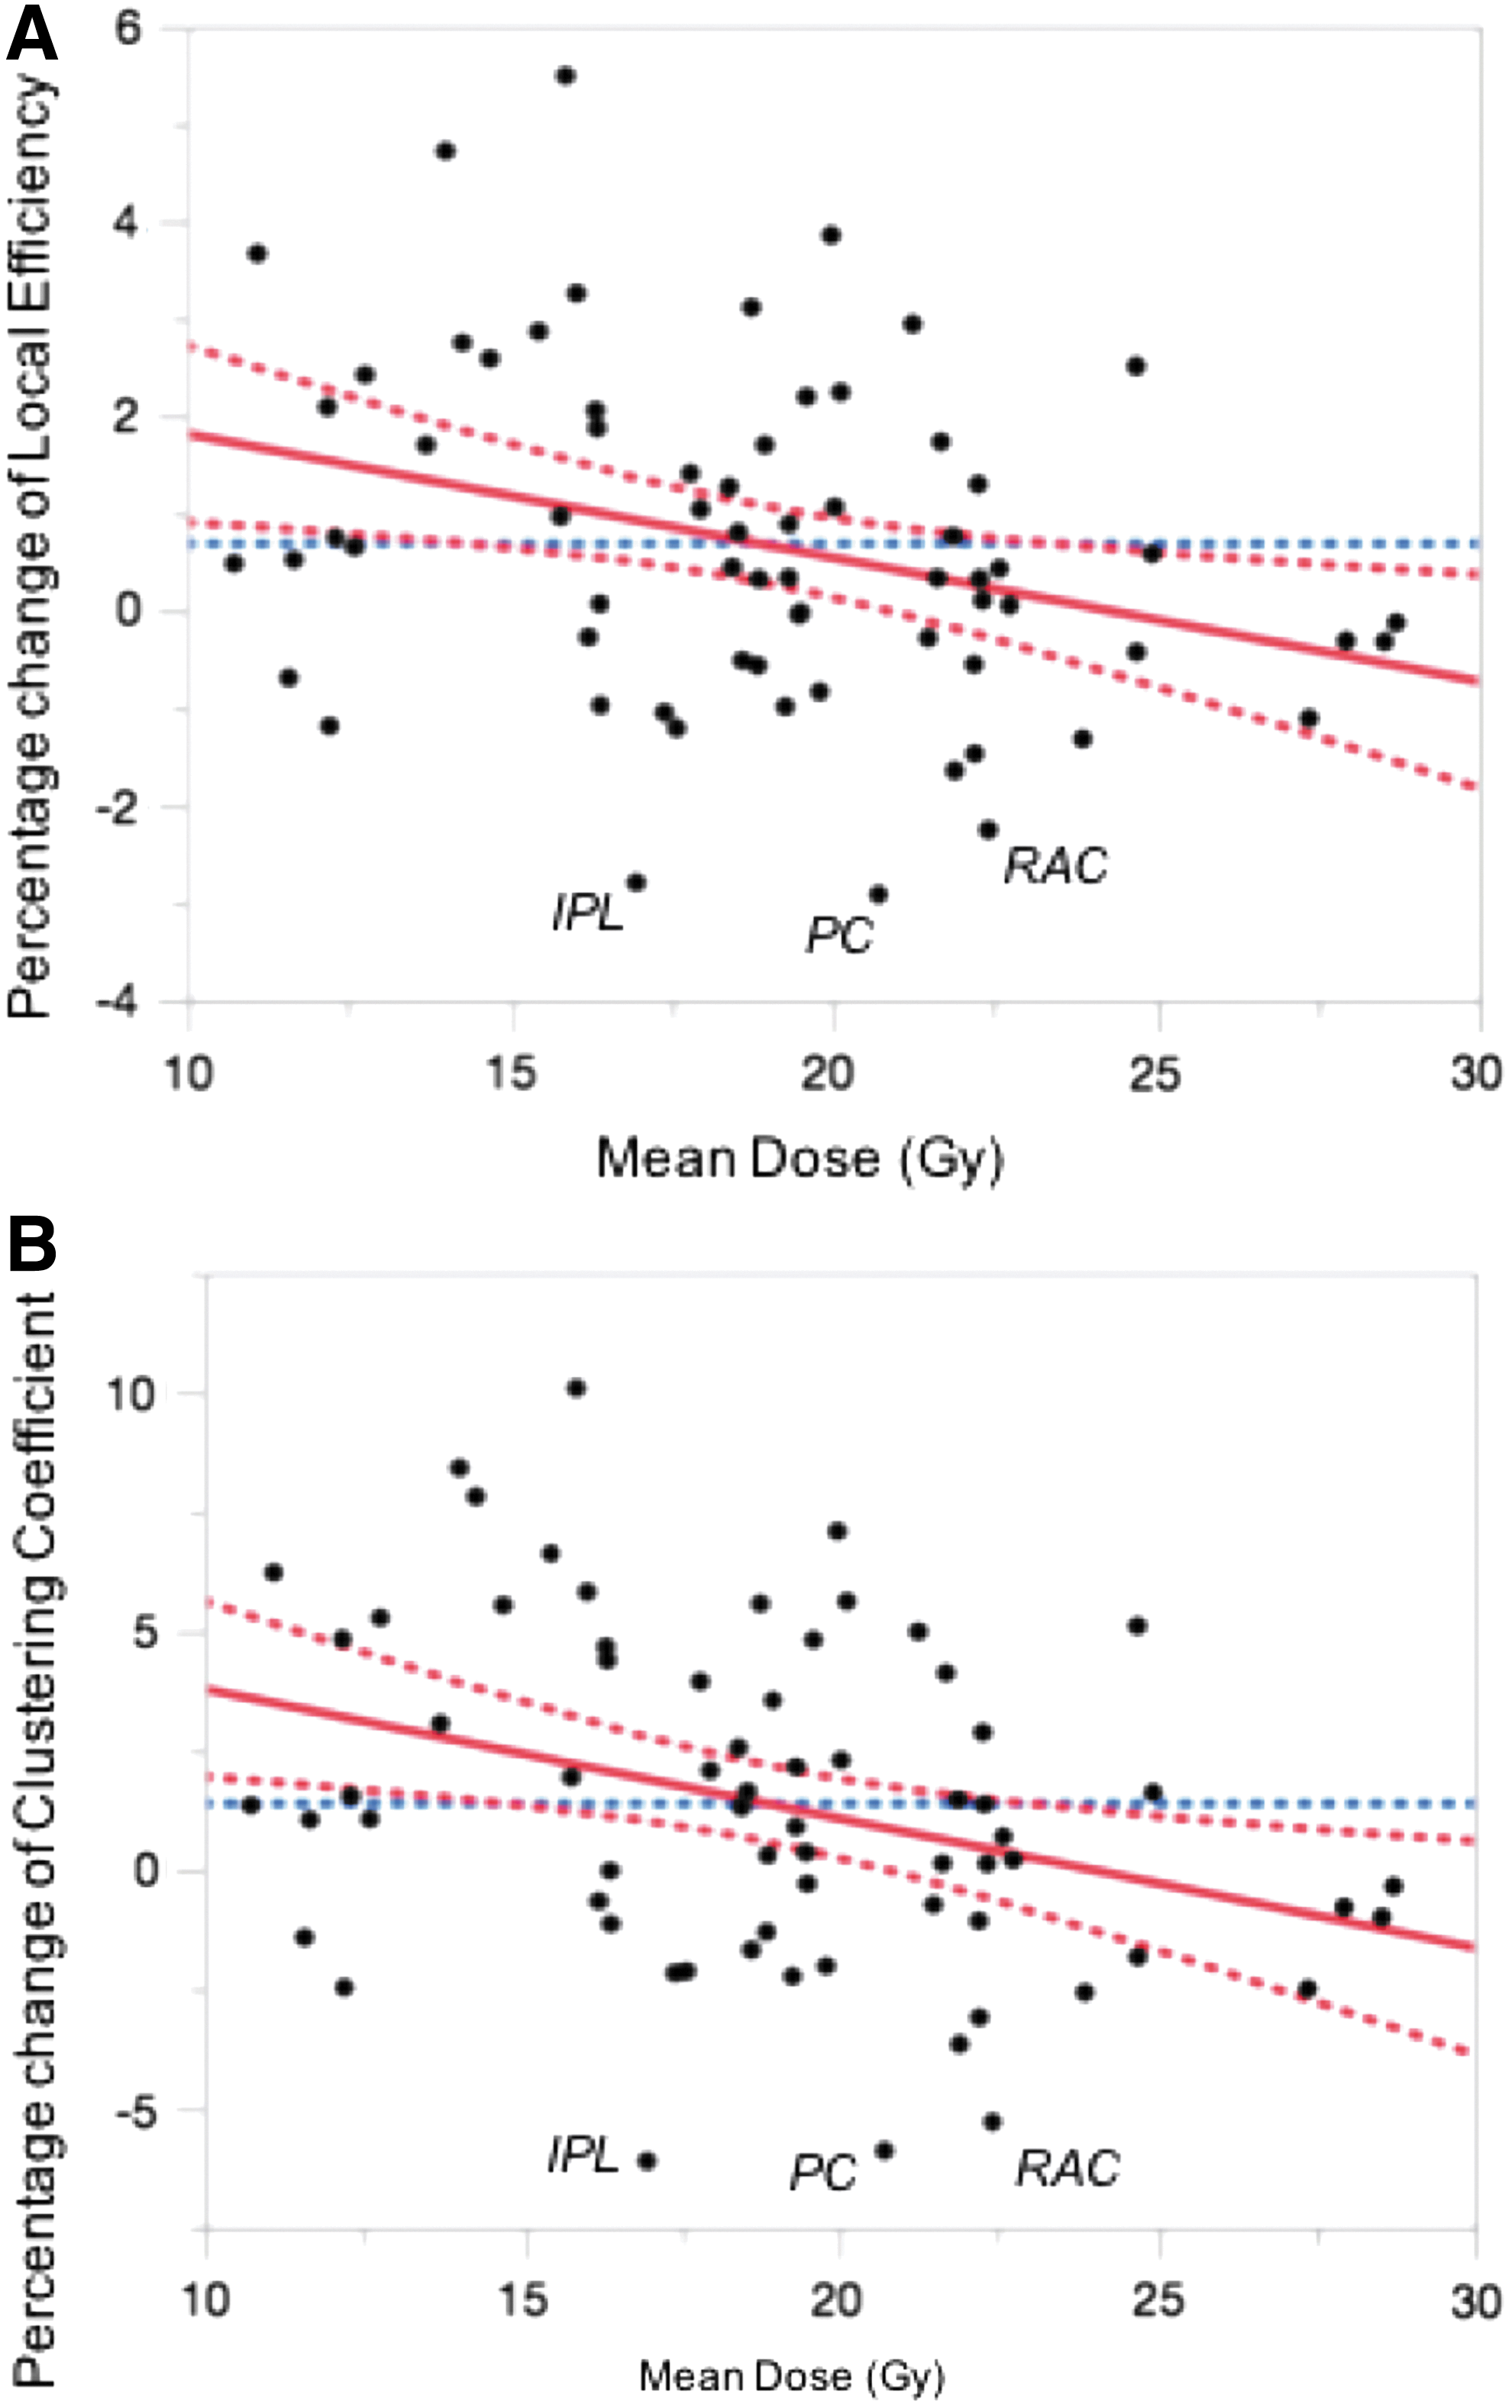
Scatterplots depict the association between pre- to post-RT changes in local efficiency
Hub identification
Pre-RT, the IPL, inferior temporal, lateral occipital, lateral orbito-frontal, precuneus, and superior parietal regions were all identified as major network hubs, whereas post-RT, the IPL, lateral occipital, and superior parietal regions were no longer classified as hubs (Fig. 5).
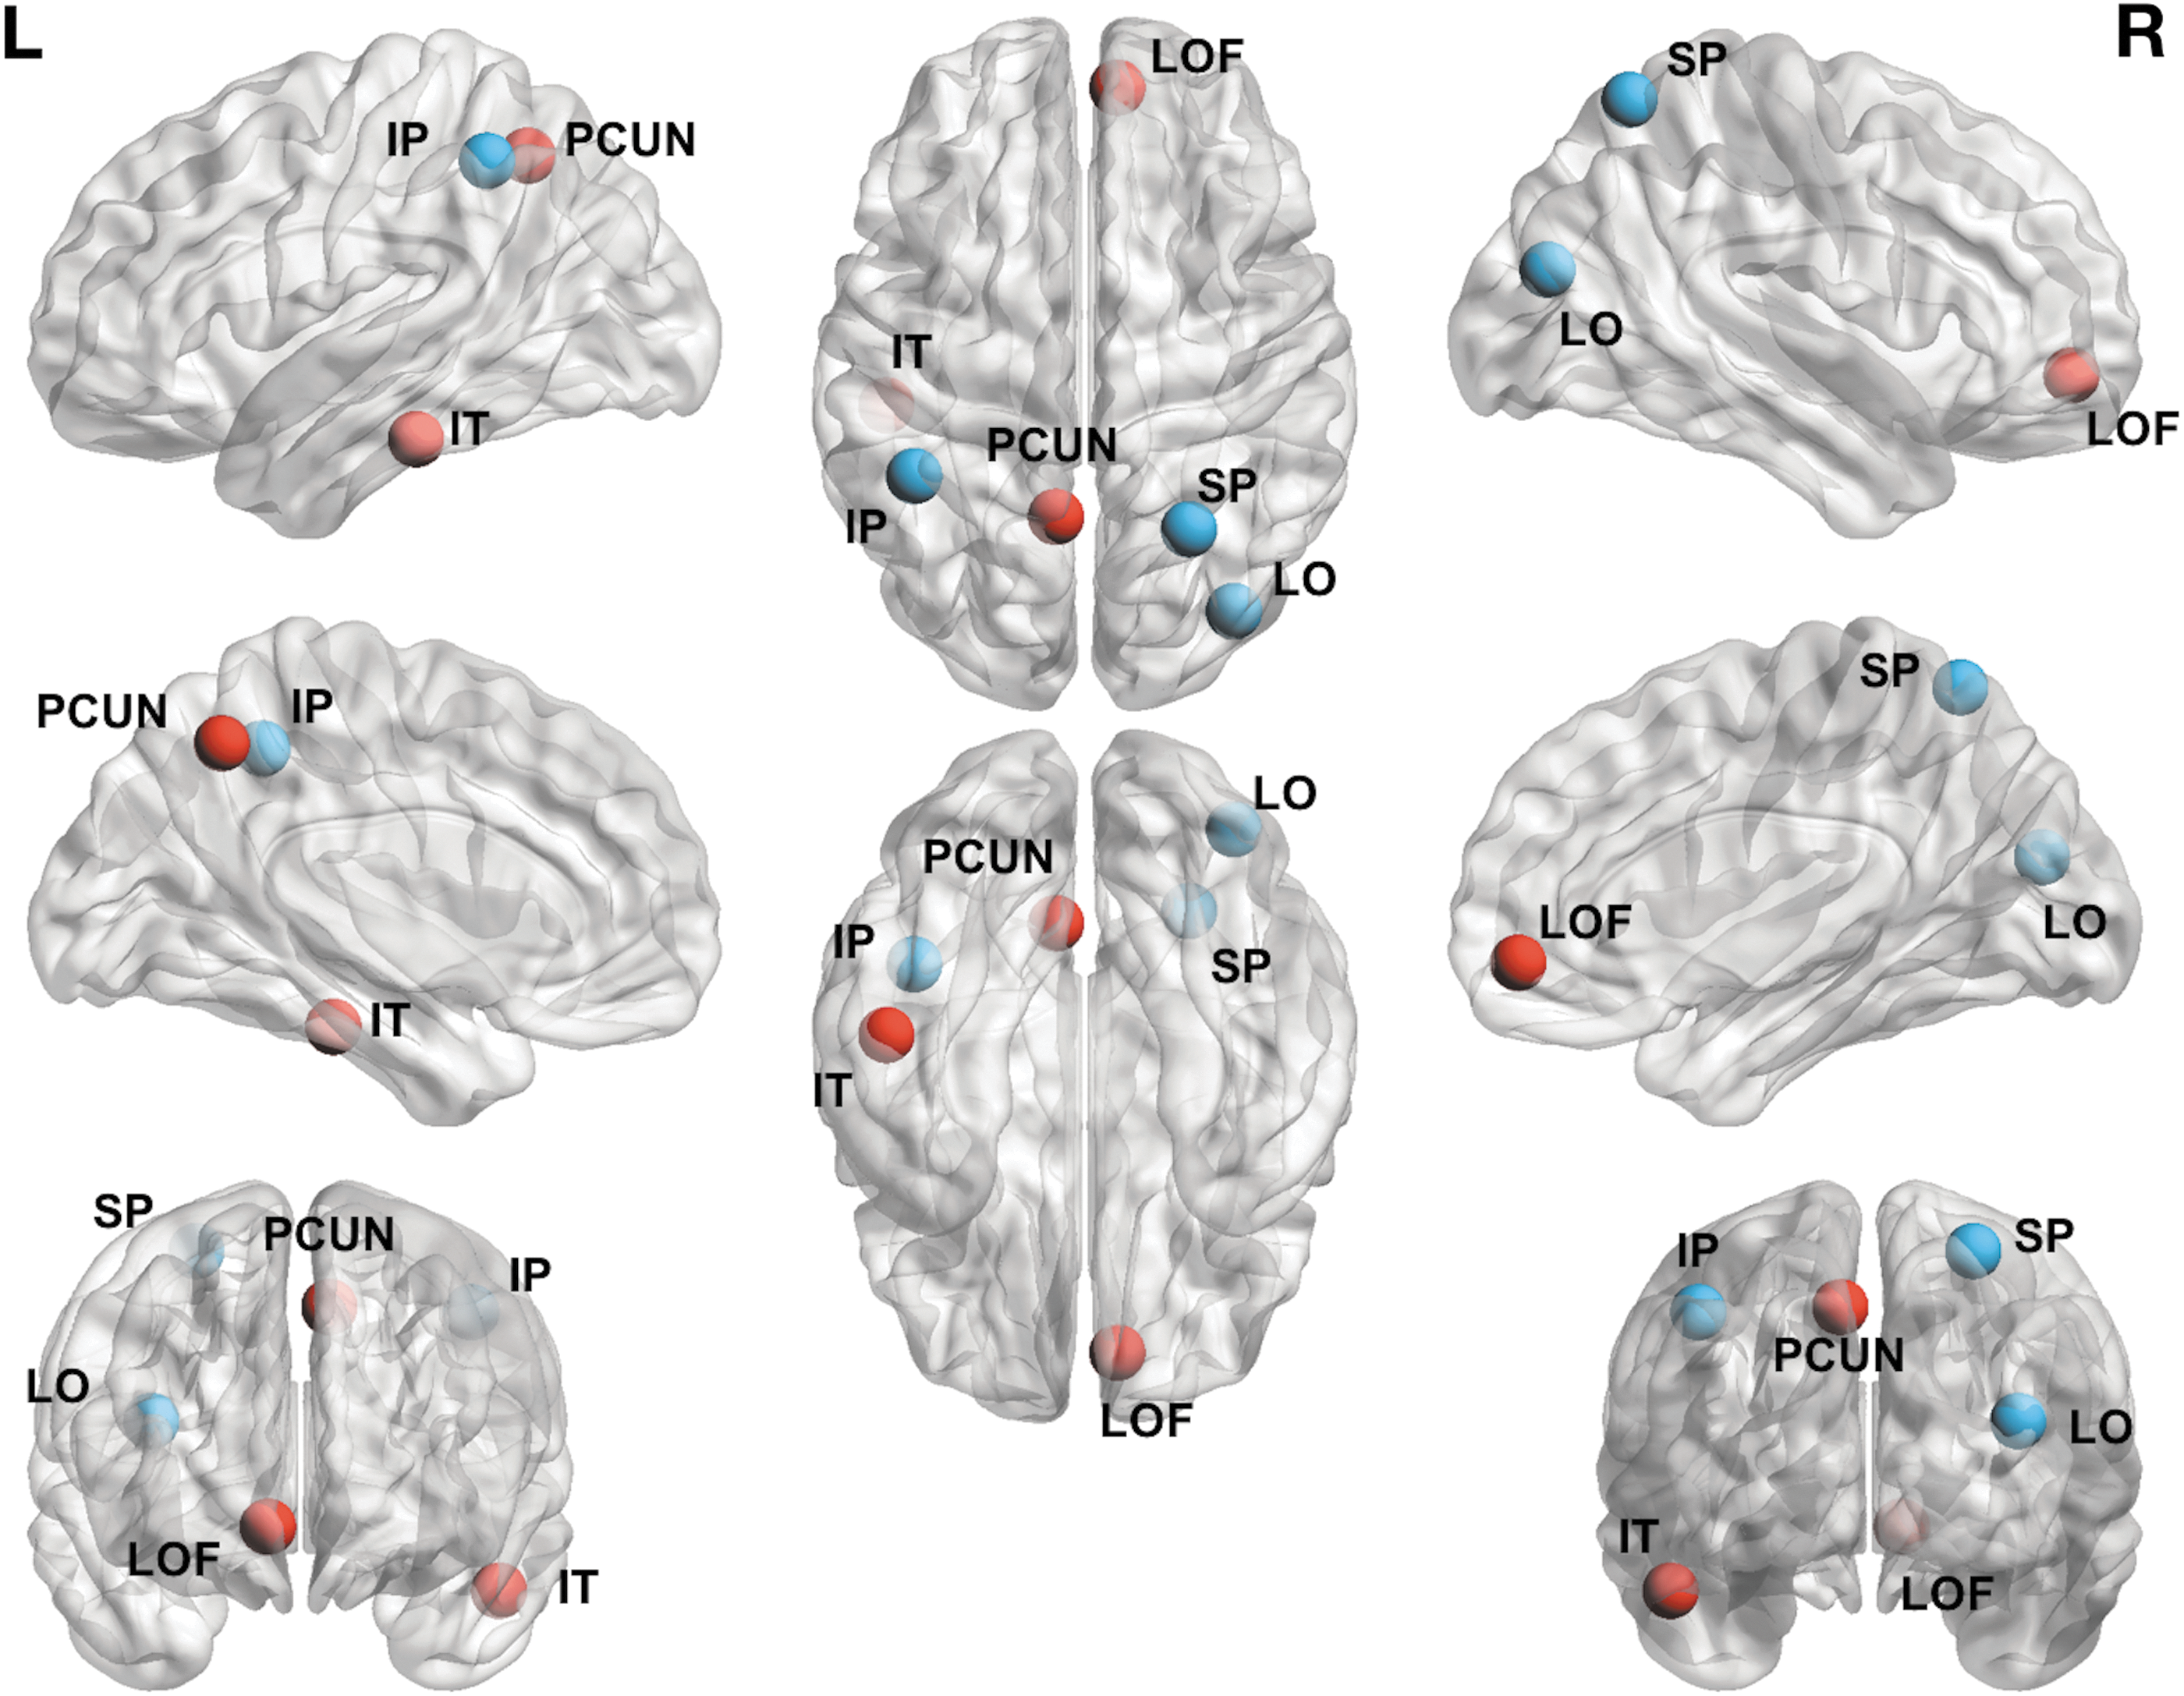
Network hubs depicted on the cortical surface. Red nodes are those that were identified in the pre-RT analysis that remained as hubs in post-RT analysis. Blue nodes are those that were no longer identified as hubs in the post-RT analysis. IP, inferior parietal; IT, inferior temporal; LO, lateral occipital; SP, superior parietal; LOF, lateral orbito-frontal; PCUN, precuneus. Color images available online at
Discussion
Our study applies the graph theory to illustrate that fractionated partial brain RT contributes to structural network changes in patients with brain tumors, characterized by increases in global network segregation (i.e., increased transitivity and modularity) and integration (i.e., global efficiency) of cortical subnetworks in the brain. We also found decreases in both local efficiency and clustering coefficient as a function of RT-dose. Finally, we demonstrate changes in hub distribution in patients post-RT in regions critical to cognition, including inferior and superior parietal regions. Collectively, these findings suggest there may be dose-dependent pathological changes within cortical networks, which may contribute to the late delayed cognitive decline observed in many patients following RT. In addition, this study is the first to demonstrate that a local treatment such as focal brain RT may have more global network effects on brain function.
One of the most robust findings in this study is the increased segregation of cortical subnetworks in patients after RT. Specifically, transitivity is a metric that quantifies the connectivity of different brain regions to their neighbors (Ingalhalikar et al., 2014). Greater transitivity indicates a tendency for nodes to be highly integrated within their local cluster. In addition, modularity describes the degree to which a network is capable of being divided into modules or groups of regions with a high number of within-module connections and a low number of between-module connections (Newman, 2004, 2006). When brain regions are well connected within their own module, but are weakly connected with regions belonging to other modules, the modularity of the network increases. In the current study, we found increased modularity in patients after RT, which may suggest greater isolation of individual brain modules and poorer communication across modules after RT. Baggio et al. (2015) found that increased modularity was associated with memory and visual impairments in patients with Parkinson's disease (Baggio et al., 2015). Increased modularity has also been associated with working memory deficits in patients with multiple sclerosis (Gamboa et al., 2014). In our study, increases in modularity along with increases in transitivity may indicate that the brain is less able to communicate across cortical subnetworks, which may contribute to impairment in higher-level cognitive processes that rely on distributed neural networks (e.g., executive functions). We further showed that these changes occur both ipsilateral and contralateral to the tumor, providing further evidence that increased network segregation is likely the result of RT-induced damage and not local tumor-related effects.
Increases in global efficiency were also observed in our study. Although not hypothesized, increased global efficiency may stem from either stronger short-range connections or shorter paths between nodes (Latora and Marchiori, 2001) and indicate that the communication between pairs of nodes is more direct. This finding may reflect the development of abnormal connections between brain structures following RT-induced damage, resulting in the reorganization of cortical networks (Bonilha et al., 2012). RT may cause alterations in cellular and small vessel structure, which leads to the elimination or weakening of long-range projections and connections, preferentially supporting stronger short-range connections (Bullmore and Sporns, 2009; Netoff et al., 2004). The topology of the network may become relatively overconnected as a result of these aberrant cellular and vascular changes (Belka et al., 2001; Khuntia et al., 2006).
In addition to global network changes, we demonstrated that local efficiency and clustering coefficient decrease as a function of RT dose. This supports previous findings that higher doses of RT result in greater cortical thinning (Karunamuni et al., 2016) and white matter compromise (Connor, 2016). Furthermore, Yu and colleagues (2015) showed decreased local efficiency and clustering coefficient across many brain regions in patients with vascular cognitive impairment compared with healthy controls. Similarly, Liu and colleagues (2008) found that reduced clustering coefficient and local network efficiency were associated with duration of illness and medication dose in patients with schizophrenia. The relationship between dose and decreased clustering coefficient suggests that higher doses of RT lead to a greater disruption of local network connectivity both within and across regions. In addition, we identified several regions (including the IPL, PC, and RAC) that appear to be highly vulnerable to RT (Seibert et al., 2016). This finding is of particular interest given the importance of the IPL and RAC to the well-described central executive network (CEN)—a network of fronto-cingulo-parietal regions that subserves a broad range of executive functions, including sustained attention, mental flexibility, inhibition, and working memory (Niendam et al., 2012). Furthermore, both the IPL and superior parietal region lost their status as major network hubs post-RT, providing further evidence for the degradation or possible restructuring of connectivity within the CEN. It is of note that of the six hubs identified in our study, the IPL, superior parietal region, and precuneus have been identified as major hubs in previous studies (Hagmann et al., 2008). In fact, both the superior parietal and IPL have been identified within the top 25th%ile in terms of their efficiency, degree, and network strength in previous research. In addition, in a functional connectivity study, Buckner and colleagues (2009) investigated cortical hubs in AD and IPL, precuneus, and superior parietal were among the major hubs identified. Thus, their loss as major hubs post-RT could have deleterious effects on large-scale network communication.
Because the most common late delayed cognitive effects associated with RT include deficits in executive functions, processing speed, attention, and memory, poor communicating across distributed regions within the CEN provides a plausible substrate for post-RT cognitive decline (McDuff et al., 2013; Meyers and Brown, 2006; Saad and Wang, 2015). As noted above, the inferior parietal cortex has been shown to be critical to attention and memory (Cabeza and Nyberg, 2000; Ciaramelli et al., 2008; Seibert et al., 2011) and the superior parietal region has also been implicated in working memory and attention (Koenigs et al., 2009; Posner et al., 1984). The loss of both of these hubs post-RT suggests that they become less central to their networks, which may decrease the efficiency of processing within the CEN and associated networks. These findings are in agreement with a previous study that used probabilistic tractography to probe CEN changes in children with medulloblastoma following cranial irradiation (Duncan et al., 2016). The above study demonstrated decreased white matter integrity throughout the CEN post-RT, including connections from the striatum to cingulate and parietal regions bilaterally. Thus, RT may have deleterious effects on distributed cortical and subcortical networks in patients, which could preferentially disrupt the CEN.
Strengths of this study include the network analysis employed, the longitudinal design, and the sizable patient cohort available for analysis. However, there are several limitations that should be noted. First, brain tumor patients are subject to systemic therapy, tumor effects, and surgical sequelae that may impact their structural connectivity at a global and a local level. However, we demonstrate that network changes are seen both globally and in the contralateral hemisphere, making it less likely that local tumor effects or surgical changes were driving our results. Furthermore, the association between changes in local network properties and radiation dose makes it unlikely that systemic therapy was a primary cause. Second, the underlying pathophysiology of radiation-associated cortical atrophy and altered structural connectivity has not been well described. We selected MRI (i.e., cortical thickness) and graph theory metrics that are commonly used in studies of neurological disease and have been previously linked to cognitive decline (Bullmore and Sporns, 2009; Karunamuni et al., 2016; Wijk et al., 2010). However, it is possible that other MRI (e.g., gray matter volume or contrast) or graph theory metrics that were not tested in our study may also show significant changes that may further inform our understanding of these network alterations. Finally, although we propose that RT-associated network changes within the CEN may be directly related to much of the late-delayed cognitive decline seen in many patients, cognitive data were not available for the current patient sample. However, our future work will address whether these observed changes in network topology represent biomarkers for domain-specific cognitive decline (e.g., executive dysfunction) post-RT.
Conclusions
Taken together, our findings demonstrate alterations in global and local network topology following RT in patients with primary brain tumors. Further studies are needed to determine whether this kind of topology-based technique could be used to predict or monitor neurocognitive decline in patients following RT or other cancer-related therapies.
Footnotes
Acknowledgment
The authors would like to thank patients at the UCSD Moores Cancer Center Neuro-Oncology Program for their generous participation. They also acknowledge the funding from National Institutes of Health grants R01NS065838 (C.R.M.); National Institutes of Health UL1TR000100 (J.A.H.) and KL2TR00144 (J.A.H.); American Cancer Society Award ACS-IRG 70-002 (J.A.H.); and American Cancer Society RSG-15-229-01-CCE (C.R.M).
Author Disclosure Statement
No competing financial interests exist.