




Abstract
Generalized anxiety disorder (GAD) and social anxiety disorder (SAD) are currently considered distinct diagnostic categories. Accumulating data suggest the study of anxiety disorders may benefit from the use of dimensional conceptualizations. One such dimension of shared dysfunction is emotion regulation (ER). The current study evaluated dimensional (ER) and categorical (diagnosis) neurocorrelates of resting-state functional connectivity (rsFC) in participants with GAD and SAD and healthy controls (HC). Functional magnetic resonance imaging (fMRI) rsFC was estimated between all regions of the default mode network (DMN), salience network (SN), and bilateral amygdala (N = 37: HC-19; GAD-10; SAD-8). Thereafter, rsFC was predicted by both ER, (using the Difficulties in Emotion Regulation Scale [DERS]), and diagnosis (DSM-5) within a single unified analysis of covariance (ANCOVA). For the ER dimension, there was a significant association between impaired ER abilities and anticorrelated rsFC of amygdala and DMN
Introduction
D
One prominent clinical construct that has been suggested as central to both GAD and SAD is emotion regulation (ER). ER is a broad term referring to the ways in which individuals perceive and respond to emotional stimuli, including the ability to effectively modulate emotional responses (Uchida et al., 2015). The neural mechanisms of ER are complex and depend on various factors, including goals, tactics, type of emotion regulated (Ochsner et al., 2012), and timing (Kalisch, 2009). However, evidence from healthy individuals strongly suggests the involvement of specific frontal regions (including dorsomedial prefrontal cortices [dmPFCs] and dorsal anterior cingulate cortex [dACC]), parietal regions (including inferior parietal lobule), and limbic regions (including amygdala and insula). These regions have been hypothesized to be part of an ER network, in which cortical frontal and parietal components modulate the activity of the amygdala and additional limbic areas (Cisler et al., 2013; Ochsner et al., 2012).
Clinical data indicate ER deficits in both GAD (Mennin et al., 2005; Roemer et al., 2009; Salters-Pedneault et al., 2006; Tull et al., 2009) and SAD (Mcclure and Pine, 2006; Helbig-Lang et al., 2015), and it has been hypothesized that ER dysfunction may play a role in the etiology and maintenance of anxiety disorders (Cisler et al., 2010; Etkin et al., 2010). Several neuroimaging studies examined neural mechanisms of ER in either GAD or SAD, compared with healthy controls (HC). Abnormal activation patterns were found in several brain regions, with some similarities between the two disorders, including within the PFC (Andreescu et al., 2011; Ball et al., 2013; Gaebler et al., 2014), ACC (Andreescu et al., 2011; Etkin et al., 2010; Goldin et al., 2009), and amygdala (Burklund et al., 2015; Etkin et al., 2010).
Abnormal functional connectivity (FC; i.e., the synchronous change in activity fluctuations between remote brain areas [Fox and Raichle, 2007; Friston et al., 1993]) between ER-related brain regions was also demonstrated using task-based designs, in both GAD and SAD. A combined sample of GAD and SAD patients (vs. HC) was examined by Robinson et al. (2014), using an emotion identification task. Results indicate increased amygdala-ACC FC in both patient groups compared with HC, although no direct comparison of the patient groups was presented. Notably, the FC pattern was found to follow a continuum of trait anxiety.
Most other FC studies were confined to either patient group, indicating various alterations to FC patterns: GAD patients showed alterations in medial PFC (MPFC)-insula, MPFC-dorsolateral PFC (DLPFC), and amygdala-paraventricular nucleus (Andreescu et al., 2015). SAD patients showed alterations in ACC-precuneus, ACC-occipital cortex, amygdala-middle temporal gyrus, amygdala-supramarginal gyrus, amygdala-occipital cortex (Pannekoek et al., 2013), and amygdala-orbitofrontal cortex (Sladky et al., 2015).
Presently, it is unclear whether the inconsistent GAD and SAD results represent true dissimilarities between the disorders for two main reasons: (a) the reviewed studies used a variety of ER tasks, possibly activating different neural mechanisms (even within a single GAD sample and identical ER instructions, a task can elicit very different results depending merely on the presented stimuli [Gaebler et al., 2014]); and (b) none of the aforementioned studies directly compared individuals with a primary diagnosis of GAD versus SAD.
A single study to date has compared GAD and SAD directly using an ER task (Blair et al., 2012). In this study, HC subjects showed increased ER-related activation in dACC and parietal cortices. All three patient groups (GAD, SAD, and comorbid GAD-SAD) differed from HC, but not from each other, suggesting a common reduced capacity for engaging ER brain networks in these populations. However, research is needed to address several additional essential questions. First, this study was confined to regional brain activation, thus warranting the exploration of FC. FC can be seen in the absence of activation changes and provides a broader network representation of neuropathology (Robinson et al., 2014). Second, the relationship between the severity of ER deficits and neural abnormalities was not examined and should be addressed. Finally, task-independent brain activity should be explored as it allows assessment that is not confined to a particular task as well as provides the opportunity to study trait characteristics of anxiety that are present in the absence of any anxiety-provoking stimulus (Gentili et al., 2015).
Resting-state functional connectivity (rsFC) is a powerful and reliable analysis method in which synchronous activity of brain networks can be examined in task-free conditions (Beckmann et al., 2005; Woodward and Cascio, 2015; Zuo et al., 2010). Among the networks that are consistently identified in rsFC studies, the default mode network (DMN) is of considerable interest as it shows increased activity during rest conditions (Raichle et al., 2001) and plays a central role in self-referential processes (Buckner et al., 2008; Fox and Raichle, 2007; Fox et al., 2005; Qin and Northoff, 2011). The main regions of the DMN include the MPFC, posterior cingulate cortex (PCC), and lateral parietal (LP) regions (Buckner et al., 2008; Fox et al., 2005). Another network of interest to ER is the salience network (SN). The SN integrates information and responds to behaviorally significant events and is anchored by the insula and ACC (Menon and Uddin, 2010; Seeley et al., 2007). Importantly, key regions within DMN and SN are central to ER processes (i.e., MPFC, ACC, insula [Ochsner et al., 2012]), suggesting these networks as potential candidates for exploration of ER abnormalities in GAD and SAD. Indeed, several studies demonstrated rsFC abnormalities in regions within the DMN (
The current preliminary study examined the potential contribution of the dimensional approach to the understanding of anxiety disorders by evaluating the association between the ER continuum and rsFC in healthy subjects and individuals with GAD and SAD. To provide a wider frame of reference, we have also included clinical diagnosis in our model as a separate predictor of rsFC, serving as a preliminary pilot comparison. We focused on connectivity within and across three key brain networks (DMN, SN, and bilateral amygdala) to provide a multicircuit framework of analysis.
Materials and Methods
Participants
Thirty-seven participants were included in the study (19 HC, 10 individuals with GAD as a primary DSM-5 diagnosis, and 8 with SAD as a primary diagnosis).
Data were pooled from three studies (conducted at the Institute of Living, Hartford, CT) that enrolled HC participants and individuals with SAD and GAD (see Diefenbach et al., 2015); data presented here are pretreatment. Data were screened to identify individuals with a single primary diagnosis of either GAD or SAD (excluding subjects with comorbidity) or no psychiatric diagnosis (HC), thus only a subset of participants was included in the current report.
Main admission criteria for the clinical groups included Hamilton Anxiety Rating Scale (HAM-A; Hamilton, 1969) total score ≥18, Hamilton Rating Depression Rating Scale (HAM-D; Hamilton, 1960) total score ≤17, Clinical Global Impressions (CGI; Guy, 1976a) severity score ≥4, no confounding medical condition, no concurrent psychotherapy, and no functional magnetic resonance imaging (fMRI) safety hazards (e.g., metal in the body). Pharmacotherapy was stabilized (type and dose) for three months before study entry, with the exception of benzodiazepines, which were stabilized for at least 2 weeks.
All procedures were approved by Hartford Hospital's institutional review board, and participants gave written informed consent before participation. Assessments were conducted by a licensed clinical psychologist or trained Masters-level interviewer supervised by a licensed psychologist.
Measures
Diagnostic status
Diagnostic status was determined using the Mini-International Neuropsychiatric Interview (Sheehan et al., 1998), a commonly used, standardized, clinician-administered, structured diagnostic interview (Sheehan et al., 1997).
Emotion regulation
Emotion regulation was assessed using the Difficulties in Emotion Regulation Scale (DERS; Gratz and Roemer, 2004), a 36-item, 6-subscale self-report questionnaire designed to assess multiple ER aspects (higher scores indicate greater difficulties). Current analysis was performed on the total score only to maximize statistical power.
Anxiety symptoms
Anxiety symptoms were assessed using the Hamilton Anxiety Rating Scale (HAM-A; Hamilton, 1969), a 14-item clinician-administered scale that measures psychic and somatic aspects of anxiety (higher scores indicate greater anxiety).
Global clinical severity
Global clinical severity was assessed using the CGI scale (Guy, 1976b)-severity of illness measure (CGI-S), a one-item assessment of the clinician's view of patients' symptoms, behavior, and functioning (higher scores indicate greater severity).
Imaging data acquisition
During rsfMRI, participants were instructed to lie still with open eyes, fixating on a centrally presented cross for 5 min and 15 sec. Blood oxygenation level-dependent (BOLD) signal was obtained with T2*-weighted echo planar imaging sequence (TR/TE = 1500/27 msec, flip-angle = 70°, 29 slices, 3.4 × 3.4 × 5 mm3 voxels) using a Siemens 3T Allegra. The first six images of the scan were discarded to allow image intensity to reach equilibrium.
Data preprocessing
Analysis of rsFC was performed using FC (CONN) toolbox, version 14.n (
Region of interest definition
For region of interest (ROI) to ROI analysis of temporal correlation (i.e., FC), ROI masks were defined (Fig. 1). For DMN, we used the masks provided within CONN (i.e., MPFC, PCC, left LP, and right LP) based on Fox et al. (2005).
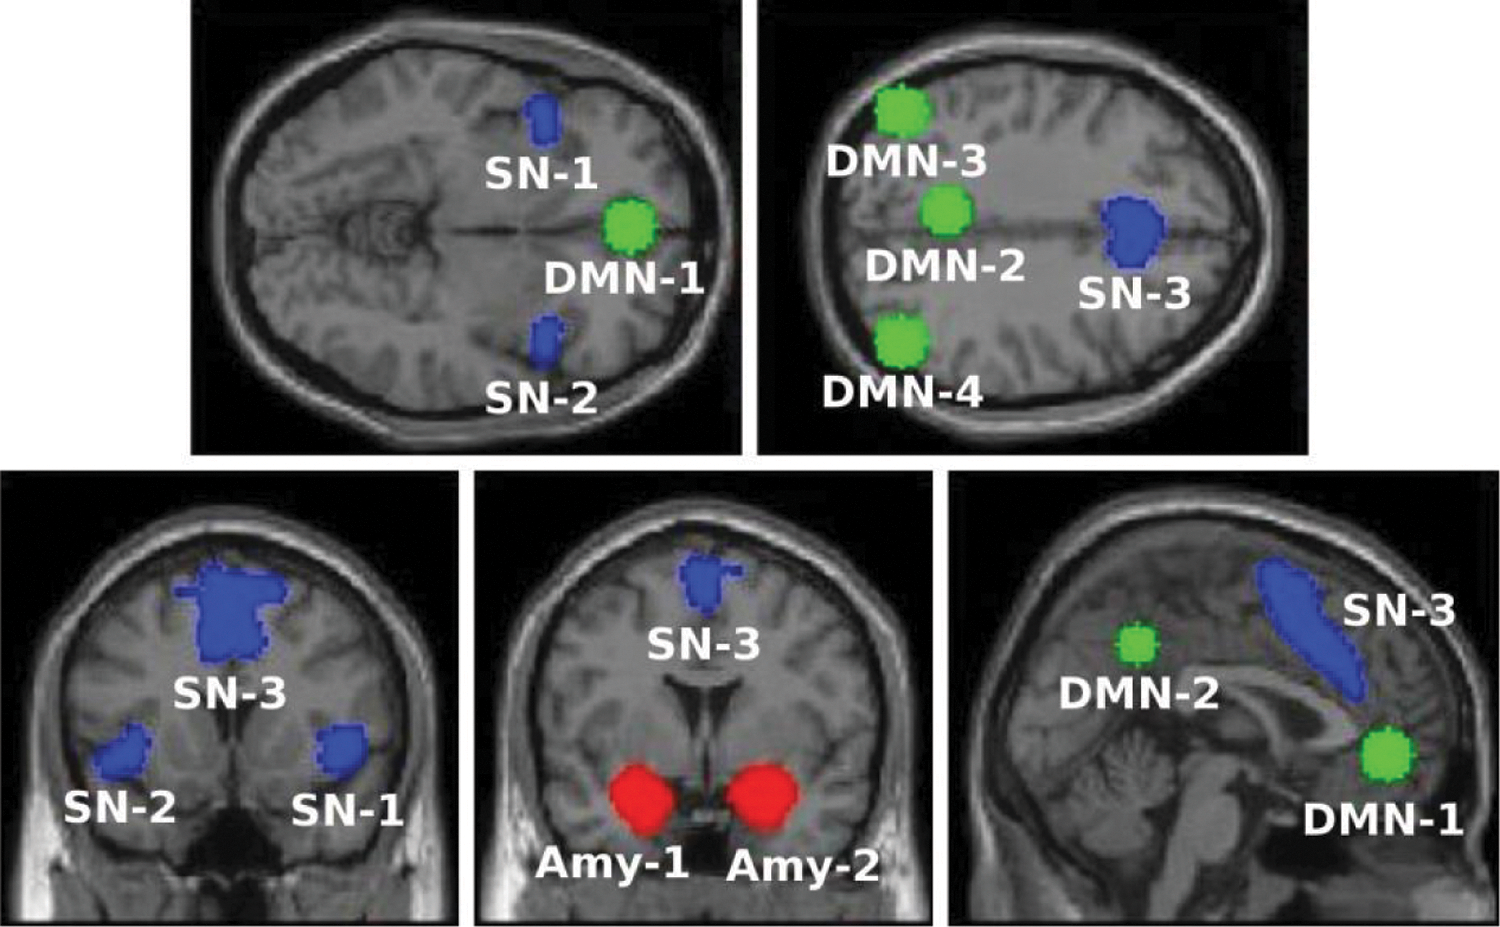
Seed-ROI masks for the DMN (green), SN (blue), and bilateral amygdala (red). The specific regions within each system are as follows:
As CONN toolbox does not include predefined masks for the SN, we used the anterior SN masks as defined by the Stanford Atlas of Functional ROI (
For amygdala masks, we have used the Harvard–Oxford structural atlas, (
rsFC analyses
Following the aforementioned preprocessing steps, rsFC analysis was performed in CONN toolbox, followed by post hoc analyses using the Statistical Package for the Social Sciences (SPSS, version 21.0), to obtain parameter estimates that are not available within CONN toolbox (as described hereinafter):
ROI-to-ROI analysis was performed at an individual-subject level in CONN, by calculating BOLD signal temporal correlations for all 36 pair-wise ROI combinations. Next, group-level univariate ANCOVA was conducted in CONN, to identify ROI-pairs for which FC was associated with either ER or diagnosis. (producing a single, global-model level p-value for each ROI-pair). To control for potential confounding variables- age and gender, as well as the status of benzodiazepines and antidepressants intake were entered as covariates of no-interest. For ROI-pairs that were significantly predicted by either diagnosis or ER (p < 0.1), further analysis was conducted to determine the nature of the effect: the ANCOVA was repeated in SPSS to provide separate parameter estimates (P and F values) for diagnosis and ER, in order to identify which of these variables drove the effect. Subsequently, post-hoc analyses were conducted accordingly: for ROI-pairs whose FC was predicted by diagnosis (categorical variable) Tukey post-hoc tests were performed for the effect of group, to determine which of the three comparisons (HC-GAD; HC-SAD; GAD-SAD) was the source of the model-level significant result (controlling for the effect of the covariates of no-interest and the other independent variable, i.e., ER). For ROI-pairs whose FC was predicted by ER (continuous variable) standardized regression coefficient (beta) values were calculated for the ER variable (single beta-value per pair, for the combined three groups, controlled for the effect of the covariates of no-interest and diagnosis).
To ensure an inclusive screening step (that will not eliminate potential ROIs) and a more conservative concluding step, significance thresholds were set to p < 0.1 for the screening step and p < 0.05 for the final analyses.
Results
Sample characteristics
Sample characteristics are presented in Table 1. No differences were found in anxiety (HAM-A score, p = 1.00), overall clinical severity (CGI-S score, p = 0.21), and ER (DERS score, p = 0.10) between the GAD and SAD groups in post hoc comparisons, allowing comparison of the clinical groups.
Sample sizes for all above variables HC = 19; GAD = 10; SAD = 8, except DERS HC = 18. Accordingly, degrees of freedom for all variables (2, 34), except DERS (2, 33).
Represents significant difference.
CGI, Clinical Global Impressions; DERS, Difficulties in Emotion Regulation Scale; GAD, generalized anxiety disorder; HAM-A, Hamilton Anxiety Rating Scale; HC, healthy controls; SAD, social anxiety disorder.
Unified model
The screening step identified four pairs of ROIs, for which rsFC was predicted by either ER or clinical diagnosis (or both). Follow-up ANCOVAs indicated that rsFC of two pairs (L. amygdala-PCC, L. amygdala-ACC) was significantly associated with ER, and rsFC of two other pairs (PCC-MPFC, ACC-R. LP) was significantly associated with clinical diagnosis (Table 2). One pair that reached statistical significance for ER (L. amygdala-PCC) also showed trend-level significance for diagnosis. DERS scores were continuously distributed across patients and healthy individuals, permitting regression analysis. Results did not survive multiple comparison correction and are thus presented as preliminary.
Results are presented for the two predictors (ER/diagnosis), controlling each predictor for the effect of the other predictor and the coavriates of no interest (age, gender, benzodiazepines intake and antidepressants intake).
Represents significant results; p < 0.05.
Represents trend level results; p < 0.1.
ACC, anterior cingulate cortex; DMN, default mode network; ER, emotion regulation; MPFC, medial prefrontal cortex; PCC, posterior cingulate cortex; ROI, region of interest; SN, salience network.
Prediction of rsFC by ER
For the two pairs whose FC was predicted by ER (all 37 subjects combined), results indicated that higher DERS scores were associated with stronger negative rsFC (i.e., anticorrelations; Fig. 2):
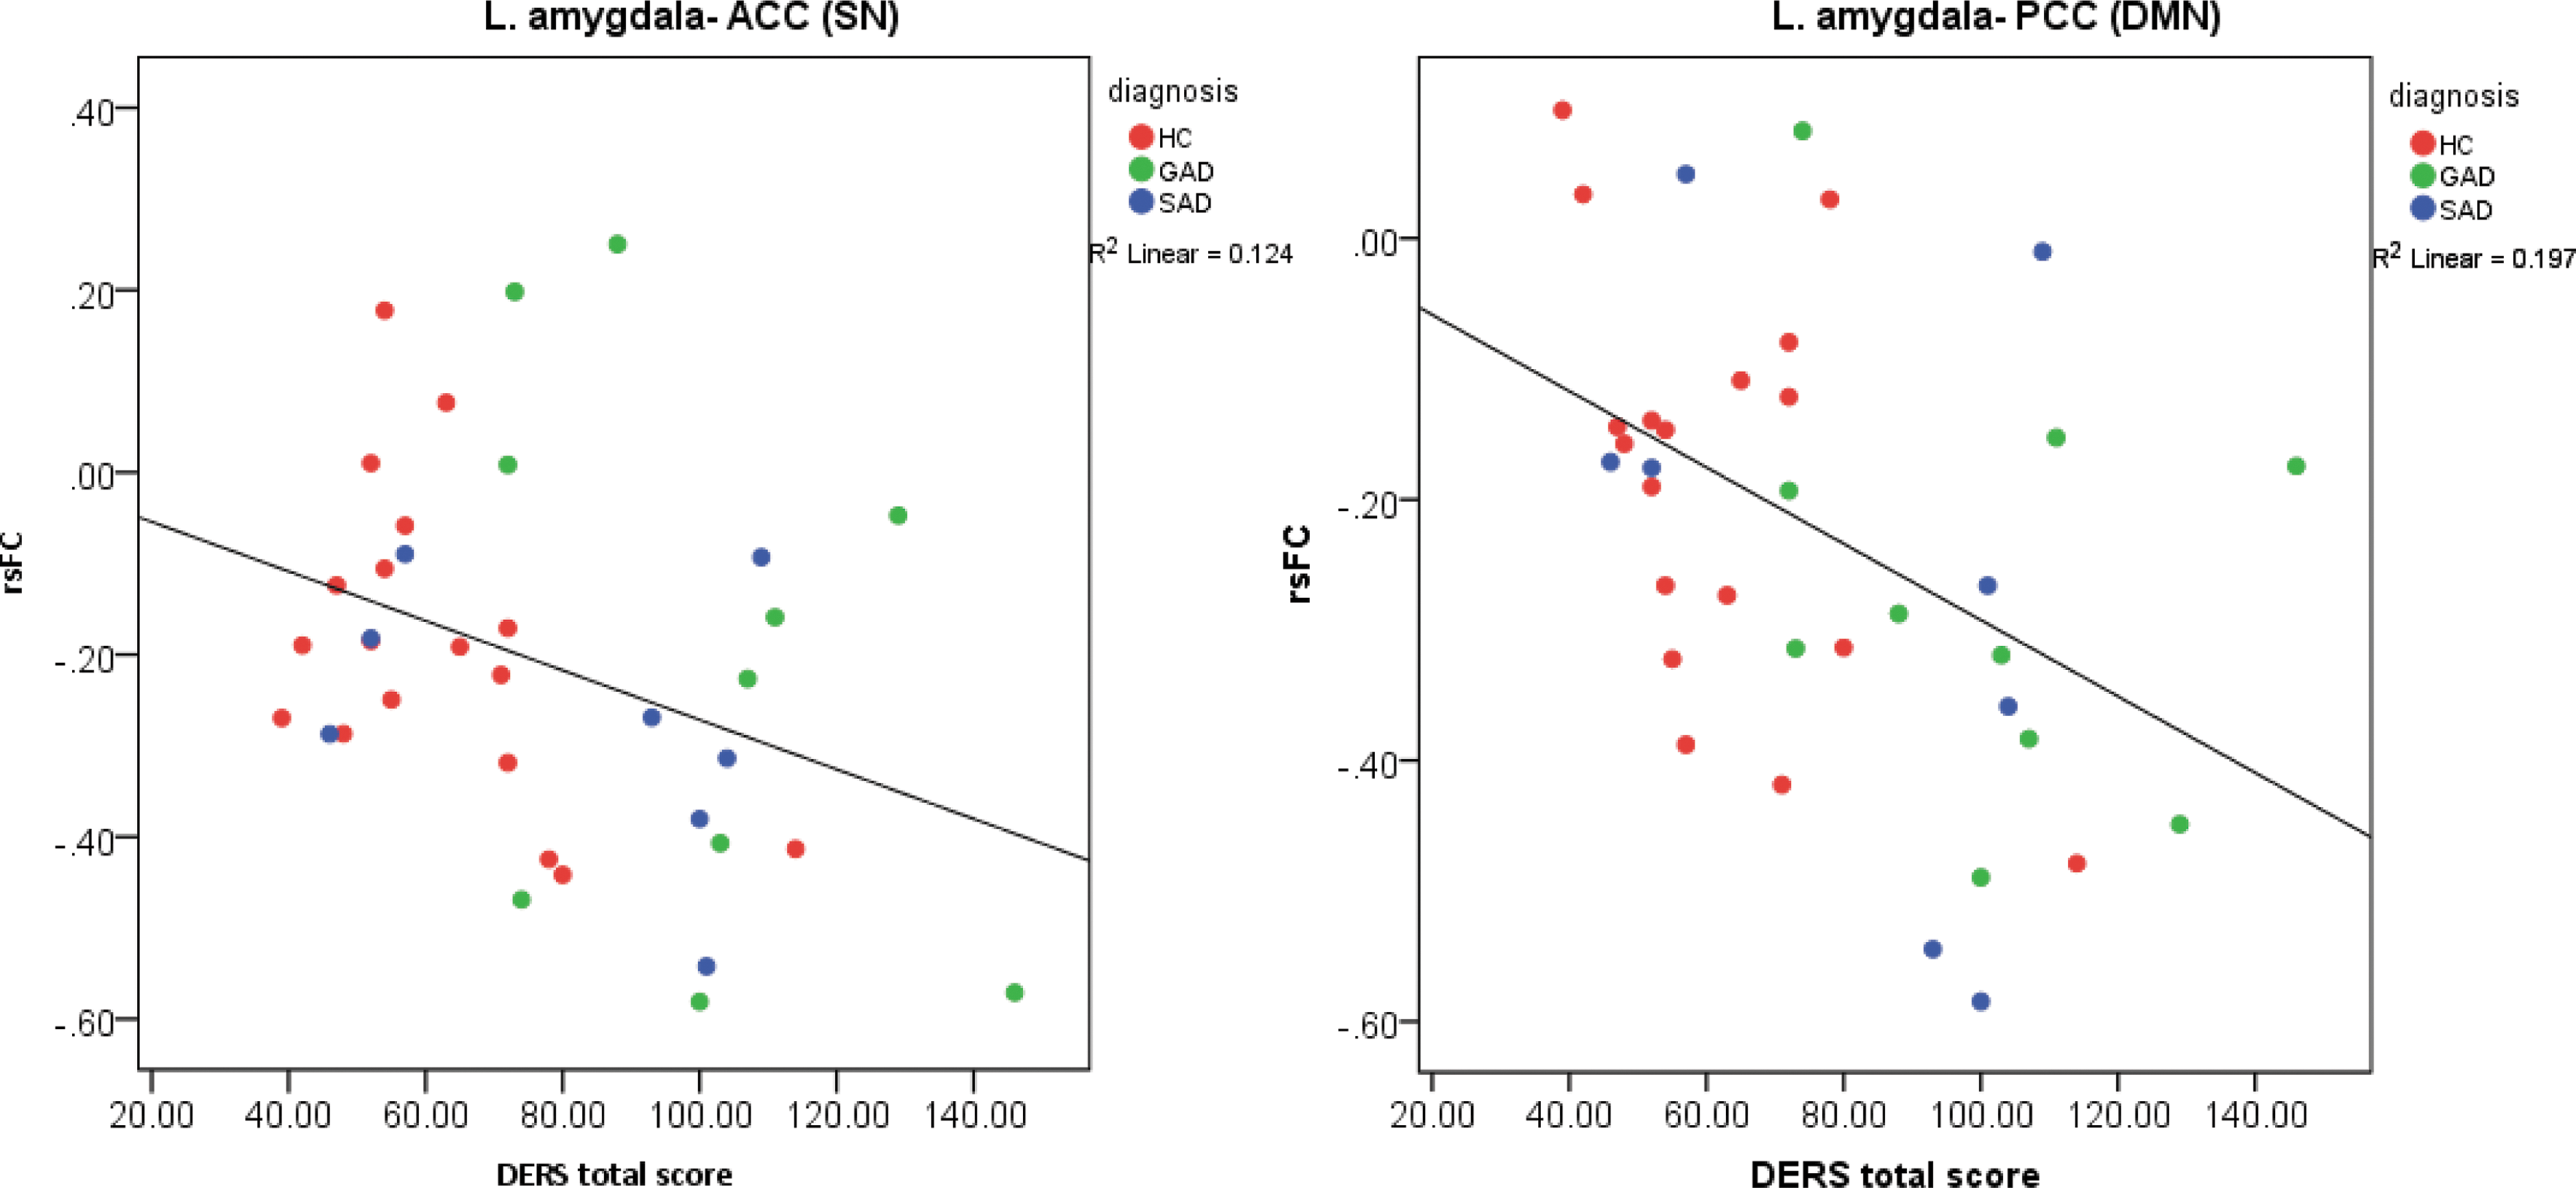
Partial residual plots for the prediction of rsFC by ER, presenting strength of rsFC (controlled for diagnosis and covariates of no interest), by DERS score; fitted with a regression line. Higher DERS score indicates more pronounced ER impairments.
Similar trends, although with lower significance, were demonstrated in each group separately (see Supplementary Data, Supplementary Fig. S1; Supplementary Data are available online at
Prediction of rsFC by clinical diagnosis
For the pairs whose FC was predicted by clinical diagnosis, post hoc tests (Fig. 3) indicated differences between the SAD and HC groups (adjusted group mean{±SE} hereinafter):
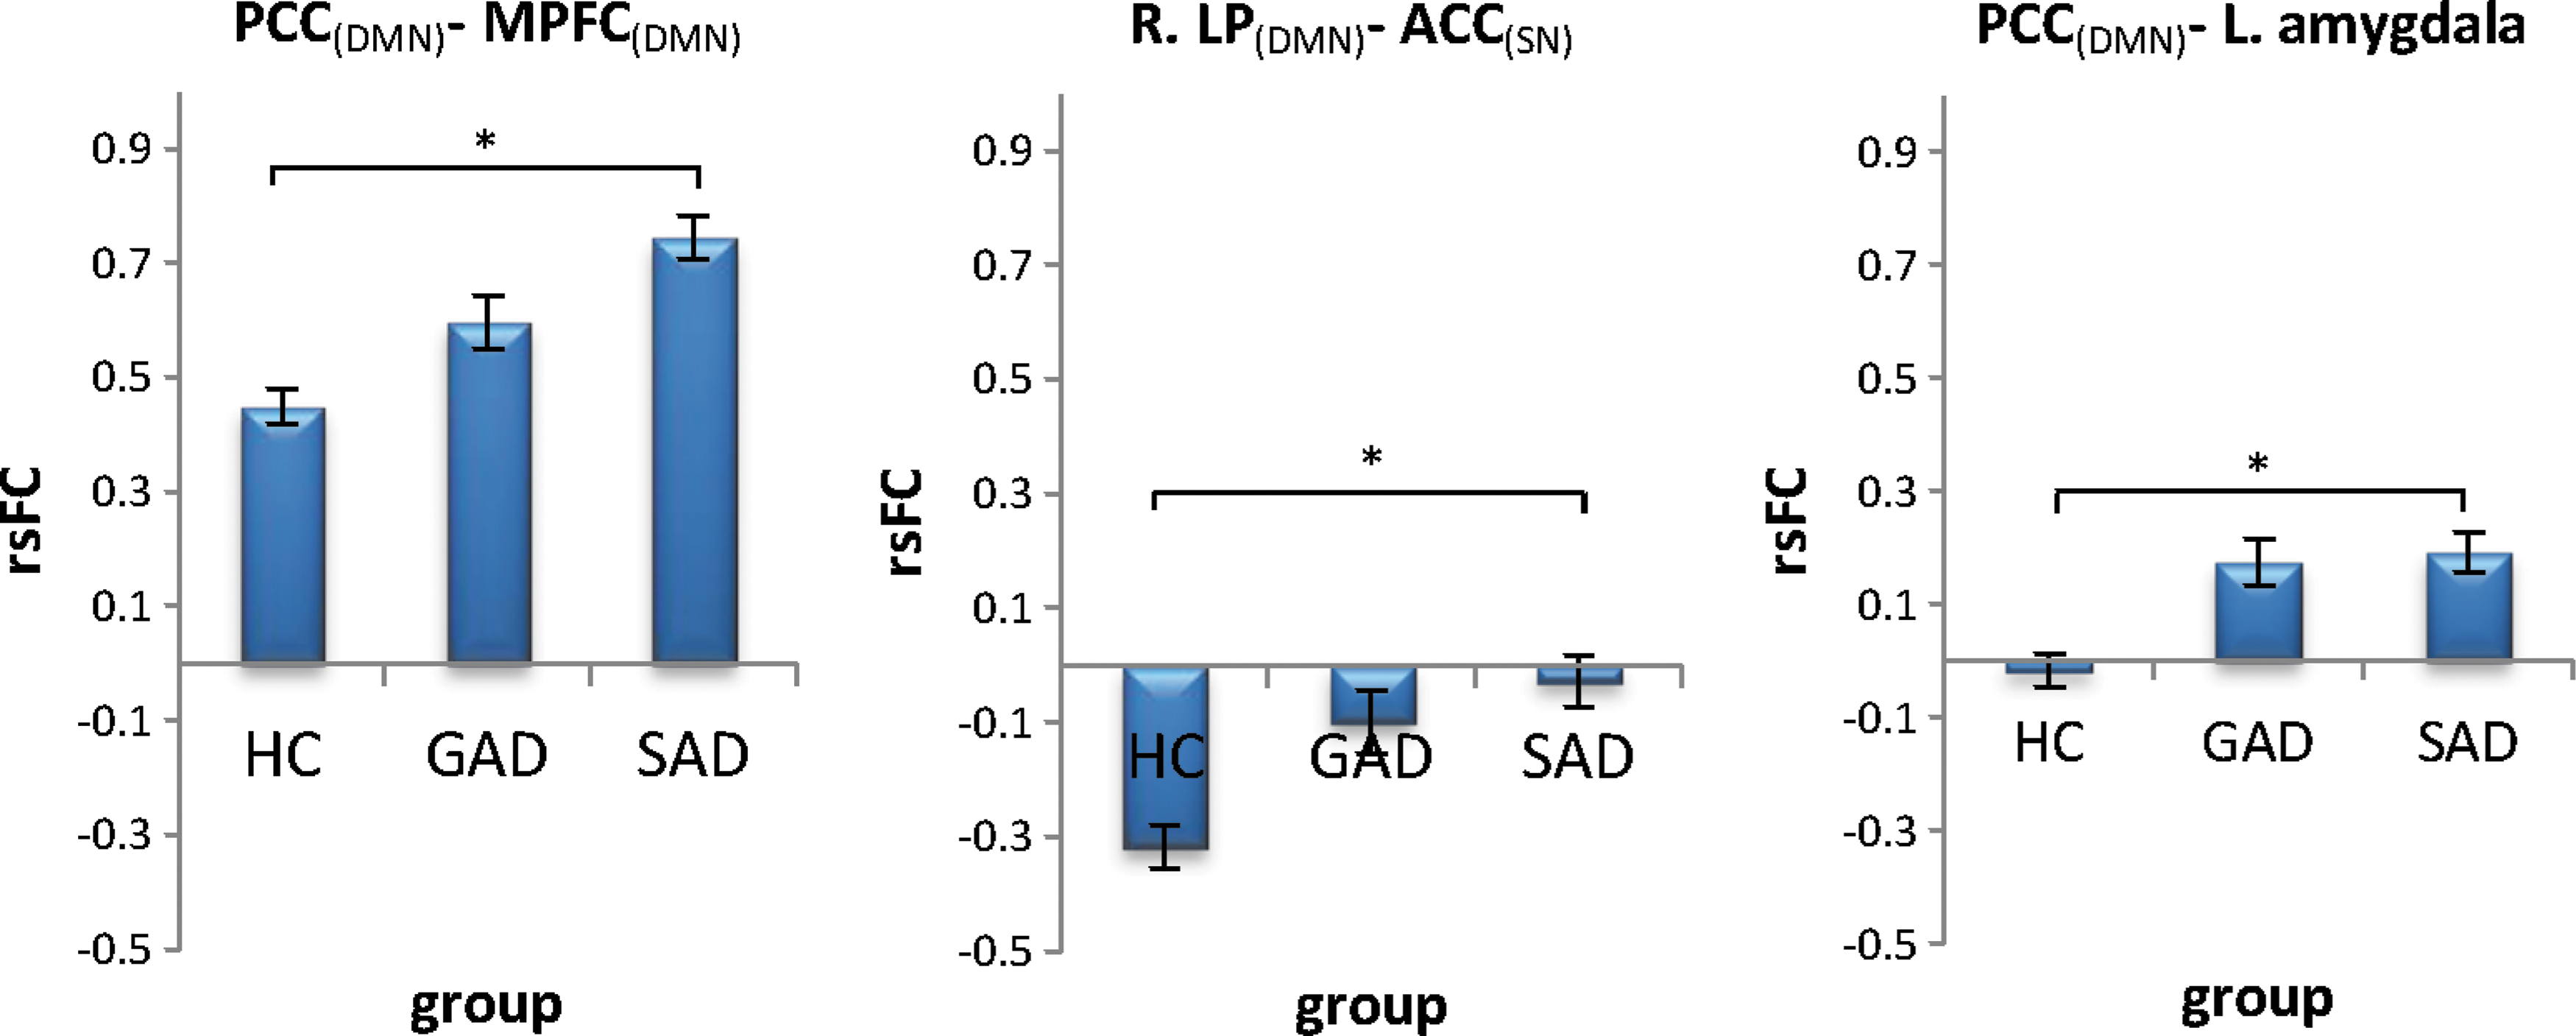
Estimated marginal means of the HC, GAD, and SAD groups, controlled for DERS total score, and the covariates of no interest.
No post hoc differences were found between GAD and SAD (
Discussion
In recent years, accumulating evidence suggests that psychiatric disorders may not fall exclusively within the categorical definitions of existing diagnostic criteria, but rather lie along dimensions of clinical symptoms and neurobiology (Cuthbert and Insel, 2013; Kupfer and Regier, 2011). The present study examined a dimensional approach to the study of anxiety disorders by exploring the association between the ER continuum and rsFC in healthy subjects and individuals with GAD and SAD. We evaluated, within a unified model, the predictive value of both ER and clinical diagnosis on rsFC within and across regions of the DMN, SN, and amygdala.
The ER continuum was found to predict amygdala connectivity with both the DMN and SN across all groups, suggesting ER as a shared dimension of dysfunction in GAD and SAD. Clinical diagnosis predicted intra-DMN and DMN-SN connectivity differences between the SAD group and HC (no significant differences in connectivity were found between the GAD and SAD samples, although this could be due to the small sample size of the clinical subgroups). Overall, our findings support the contribution of a dimensional approach to the study of anxiety disorders, demonstrating its ability to uncover neuropathological processes that were not tapped by clinical diagnosis. It should be noted that ER was chosen to exemplify the concept of a dimensional correlate and was not presumed to encompass all of the neural variability associated with GAD and SAD, which is multifaceted.
Our results are in line with a recent study by Oathes et al. (2015) that explored resting-state fMRI in GAD and major depressive disorder and found that neither clinical diagnosis nor the examined dimensional model explained neurobiology to the exclusion of the other. This is consistent with a recent large-scale paradigm shift in neuroscience, exemplified by the research domain criteria (RDoC) initiative that aims to develop new ways of classifying mental disorders based on dimensions of observable behavior and neurobiological measures (Cuthbert and Insel, 2013). The present study, together with Oaths et al., provides a step toward a continuum-based approach to anxiety disorder understanding and classification, in accordance with RDoC principles. Hereinafter, we discuss the specific findings for each of the predictors.
Prediction of rsFC by ER
ER skills predicted connectivity of the amygdala with both dACC (a core SN region [Seeley et al., 2007]) and PCC (a core DMN region [Buckner et al., 2008; Fox et al., 2005]) across all groups. Individuals with unimpaired ER abilities showed practically no rsFC between the amygdala and either dACC or PCC, while participants with ER deficits displayed negative connectivity (i.e., anticorrelation). This pattern, found for the unified group, was also replicated for each of the groups separately (although not in all groups found significant, possibly owing to smaller sample sizes within the separate groups). Given that both dACC (Etkin et al., 2006; Hahn et al., 2011; Ochsner and Gross, 2005; Quirk and Beer, 2006; Schiller and Delgado, 2010; Vogt et al., 1992) and PCC (Hahn et al., 2011) have been proposed to have a regulatory influence on the amygdala and that fear and anxiety have been the functions most associated with the amygdala (LeDoux, 2007), our results could possibly indicate a lack of ability of these regions to balance the anxiety signals produced by the amygdala as part of the neural mechanism of ER difficulties. This finding resonates with the concept of an ER network, in which cortical components modulate the activity of the amygdala (and additional limbic areas) to enable effective regulation of emotions (Cisler et al., 2013; Ochsner et al., 2012).
Some recent studies also suggest a feed-forward role of the amygdala, by which the amygdala is not only regulated by cortical regions but it also regulates such regions (Todd and Anderson, 2009). Specifically, the cingulate cortex was shown to have strong bidirectional connections with the amygdala (Blackford et al., 2014). In the context of network analysis, ACC and PCC are main hubs of key neural networks, SN and DMN (Seeley et al., 2007; Utevsky et al., 2014, respectively). Our anticorrelation pattern may indicate an impaired regulation feedback loop between the amygdala and those significant resting-state networks in individuals with impaired ER. Given that the SN functions to identify the most behaviorally relevant stimuli (Seeley et al., 2007), the amygdala-SN anticorrelation may indicate that when the amygdala is active, it is more difficult for individuals with ER deficits to allocate attention to other stimuli. Similarly, given that DMN typically shows increased activity during rest (Buckner et al., 2008; Raichle et al., 2001), the DMN-amygdala anticorrelation may suggest a mechanism that impedes the ability of those with ER difficulties to disengage from anxiety-provoking stimuli and return to neural patterns of rest.
Taken together, the amygdala-SN and amygdala-DMN anticorrelation pattern may point to a neural mechanism, which hinders the ability of individuals with ER deficits to disengage from amygdalar signals and allocate resources to other important stimuli, or (in the absence of such) to typical patterns of rest.
Prediction of rsFC by clinical diagnosis
Comparison of the diagnostic categories indicated differences between the SAD and HC groups in connectivity of the PCC with MPFC and dACC with right LP (as well as a trend for PCC with the left amygdala).
Specifically, we found PCC-MPFC connectivity to be elevated in SAD compared with the HC group (the GAD group displayed a similar, but smaller, nonsignificant increase). PCC and MPFC are considered the two most prominent components of the DMN (Buckner et al., 2008). The PCC (often clustered together with the adjacent precuneus) is implicated in perception of socially relevant emotional stimuli (Gobbini and Haxby, 2006, 2007; Leibenluft et al., 2004) and is closely related to the pathophysiology of SAD (Hahn et al., 2011; Liu et al., 2015a,b; Liao et al., 2010) and possibly GAD (Strawn et al., 2012). MPFC is implicated in the regulation of emotion in general and anxiety-related processing in particular (Fossati et al., 2004; Kelley et al., 2002). Connectivity between the PCC and the MPFC has been associated with self-reflection during resting state (Gusnard et al., 2001) and their activity during rest was found to be modulated by the degree of self-relatedness of preceding affective stimuli (Schneider et al., 2008). Given these findings, our results could be interpreted as reflecting excessive introspection taking place in SAD patients during rest (as well as GAD patients to a lesser extent). This is consistent with cognitive behavioral models of SAD that hypothesize a tendency toward increased self-awareness and monitoring as a response to fear of being observed and evaluated by others (Rapee and Heimberg, 1997).
For dACC-R.LP, the HC group exhibited negative FC, while the SAD group displayed virtually no FC. The LP cortex is part of the DMN (Buckner et al., 2008) involved in emotion-mediated activity (Sheline et al., 2009) and memory retrieval (Wagner et al., 2005). The dACC is a main hub of the SN (Seeley et al., 2007), which is typically anticorrelated with DMN during rest (Krebs et al., 2012; Seeley et al., 2007). Our results of reduced anticorrelations thus indicate diminished network segregation of the DMN and SN in the SAD group compared with HC. As the DMN is typically active during resting state, while SN is quiescent (Sripada et al., 2012), the diminished segregation we found might reflect sustained and inappropriate activation of SN during periods of rest (although an alternative pattern, in which DMN activity is decreased, cannot be ruled out). A similar result pattern was found in post traumatic stress disorder (PTSD; Sripada et al., 2012), and taken together, results may reflect sustained hypervigilance and hyperarousal in anxiety disorders.
Connectivity of the left amygdala with the PCC that was associated with ER, as discussed above, was also associated at trend-level significance with clinical diagnosis (the HC group showed no FC between these regions, whereas both GAD and SAD groups displayed positive correlation). While this result should be interpreted cautiously, it may suggest amygdala-DMN connectivity as a possible mechanism that links ER and anxiety disorders.
No differences were found between the SAD and GAD groups in any of the tested region pairs. Importantly, the lack of differences could be due to relatively small sample sizes of the subgroups. It should be noted though that the GAD and SAD groups show similar mean rsFC values and small standard deviations for the most part (Fig. 3), suggesting that the lack of differences between the groups may potentially reflect genuine similarities. Nonetheless, given the small sample size of the groups, this result should be taken as preliminary only.
Altogether, diagnostic status was associated with intra-DMN, DMN-SN, and DMN-amygdala FC differences between the SAD and HC groups, thus suggesting an overarching aberration in DMN connectivity in this population. The GAD group presented a similar, yet smaller, effect for all pairs of regions, not significantly different from either SAD or HC group. DMN is known to play a pivotal role in self-referential processes (Buckner et al., 2008; Fox and Raichle, 2007; Fox et al., 2005; Qin and Northoff, 2011), which are altered in anxiety disorders (Clark and Wells, 1995; Paulus and Stein, 2010; Schulz et al., 2008), and abnormal DMN activity was suggested to reflect persistent rumination or anxiety-related thoughts (Gentili et al., 2009). Additionally, DMN is central to social cognition (Gentili et al., 2009; Gobbini et al., 2007; Mitchell, 2006) and hypothesized to take part in the development of the feeling of wariness of others' judgment (Gentili et al., 2009), thus tying it to SAD in particular. Our results are in line with a corpus of literature, indicating alterations in SAD patients both within the DMN (Gentili et al., 2009; Liao et al., 2010; Liu et al., 2015a,b; Qiu et al., 2011) and between DMN and other networks (Dodhia et al., 2014; Liu et al., 2015a; Prater et al., 2013) and tying them together within a triple-network analysis and a cross-diagnostic comparison.
Several limitations of the current study should be noted. First, the modest sample size renders the results of this study as preliminary only. Second, our sample was deliberately limited to noncomorbid subjects to identify differences between the groups and to best contrast neuropathology associated with GAD and SAD. However, to fully examine the dimensional nature of ER in these disorders, a third group, including patients diagnosed with comorbid GAD and SAD, would be advisable. Third, our study focused on specific networks to avoid multiple comparisons and maximize statistical power. It is clear that the full scope of ER-related processes, as well as group differences, is more complex and warrants an analysis of all brain networks. Such an analysis should also include an overall anxiety severity variable to better dissociate the neurocorrelates of anxiety and ER.
In conclusion, ER abilities predicted connectivity of the amygdala with both the DMN and SN, lending support to a dimensional approach to anxiety disorders. Diagnostic status was associated with alterations in DMN connectivity in SAD patients compared with HC (no differences were found between GAD and SAD groups). These results exemplify the potential contribution of dimensional conceptualizations to uncovering of the neuropathology underlying anxiety disorders and call for further research. Future studies should explore a multifaceted model (including a broader range of anxiety-related traits, such as threat bias and worry) to reveal the full putative power of dimensional conceptualization in explaining pathophysiology of GAD, SAD, and other anxiety disorders.
Footnotes
Author Disclosure Statement
No competing financial interests exist.
References
Supplementary Material
Please find the following supplemental material available below.
For Open Access articles published under a Creative Commons License, all supplemental material carries the same license as the article it is associated with.
For non-Open Access articles published, all supplemental material carries a non-exclusive license, and permission requests for re-use of supplemental material or any part of supplemental material shall be sent directly to the copyright owner as specified in the copyright notice associated with the article.
