
Abstract
Parkinson's disease (PD) is a neurodegenerative disorder that predominantly affects the motor system. Diffusion magnetic resonance imaging (MRI) has demonstrated deficits in anisotropy as well as increased diffusivity in the sub-cortical structures, primarily in the substantia nigra in PD. However, the clinical spectrum of PD is not limited to motor symptoms; rather, it encompasses several nonmotor symptoms such as depression, psychosis, olfactory dysfunction, and cognitive impairment. These nonmotor symptoms underscore PD as a complex neurological disorder arising from dysfunction of several network components. Therefore, to decipher the underlying neuropathology, it is crucial to employ novel network-based methods that can elucidate associations between specific network changes. This study aimed at assessing the large-scale structural network changes in PD. Structural connectomes were computed by using probabilistic fiber tracking on diffusion MRI between 86 regions of interest. Graph theoretic analysis on the connectome was carried out at several levels of granularity: global, local (nodal), lobar, and edge wise. Our findings demonstrate lower network clustering capability, overall lower neural connectivity, and significantly reduced nodal influence of the hippocampus in PD. In addition, extensive patterns of reduced connectivity were observed within and between the temporal, parietal, and occipital areas. In summary, our findings corroborate widespread structural disconnectivity that can be potentially linked to the nonmotor symptoms in PD.
Introduction
P
With the advent of neuroimaging techniques, multiple studies have explored the gray and white matter (GM and WM) correlates of PD. Majority of the studies have demonstrated volume deficits in regions included in the basal ganglia (Fioravanti et al., 2015; Lewis et al., 2016) and several cortical areas that include left temporal gyrus (Pereira et al., 2012), parietal cortex (Fioravanti et al., 2015), and parieto-occipital and frontal cortices (Jia et al., 2015; Lee et al., 2013). Recent studies have employed diffusion tensor imaging to gain insight into the WM architecture and the underlying fiber tracks of patients with PD (Tessitore et al., 2016). The majority of studies have reported lower values of the fractional anisotropy (FA) and higher mean diffusivity (MD) not only in the SN (Vaillancourt et al., 2009) but also in other areas of the brain, which include the corpus callosum (Melzer et al., 2013), orbitofrontal cortex (Zhang et al., 2011), superior longitudinal fasciculus (Gattellaro et al., 2009), olfactory cortex (Rolheiser et al., 2011), cerebellum (Zhang et al., 2011), as well as in the sub-cortical structures such as the thalamus and hippocampus (Hall et al., 2016; Zhang et al., 2016). On the contrary, a small number of studies have demonstrated higher FA (Lenfeldt et al., 2015) or no change in FA in the SN (Worker et al., 2014).
Although all these studies have well documented the alterations in the integrity of WM in PD, they are limited to using ROI-based, track-based, or voxel-wise analysis performed on FA and diffusivity measures that are derived from the diffusion tensor. However, pathological changes in the brain are seldom confined to focal regions and considering the marked heterogeneity in the clinical features of PD, it is inadequate to employ a model where various regions are analyzed in isolation to explain the complete clinical and behavioral spectrum. It is, therefore, crucial to understand how brain regions communicate with one another and how they change in pathology. This can be achieved by analyzing the comprehensive interconnected brain network known as the structural connectome (SC) (Hagmann et al., 2007; Sporns et al., 2005), which in recent years has played a major role in elucidating pathology-induced changes in various neuropsychiatric disorders (Griffiths et al., 2016; Vydrova et al., 2015) as well as facilitated a better understanding of brain development (Jakab et al., 2015), aging (Zhao et al., 2015), and sex differences (Ingalhalikar et al., 2014).
A recent study on differences in the SC in PD has revealed neural deficits in the limbic/paralimbic/subcortical and cognitive/control/attention module as well as lower global efficiency in patients with PD (Li et al., 2016). However, no differences in the circuits involving regions of the basal ganglia were demonstrated, which, nevertheless, were observed in another study on de novo PD patients where authors noted reduced clustering coefficient (CC) and strength in putamen, amygdala, and olfactory cortex (Nigro et al., 2016). Other than the two aforementioned studies, Kim and Park (2016) hypothesized deficits in the cortico-basal ganglia-thalamo-cortical structural network in PD patients with and without scans without evidence of dopaminergic deficits and demonstrated significant changes in the complete circuit. Recently, another study demonstrated widespread disruptions in the structural connectivity in PD with mild cognitive impairment (MCI); however, no significant differences were noted between controls and PD without MCI (Galantucci et al., 2016). Taking into account the limited understanding of the neurobiology of PD, a detailed connectomic analysis is essential to elucidate systemic underpinnings of PD.
This work, therefore, presents a comprehensive study of a moderately large PD cohort by using state-of-the-art probabilistic fiber tracking to compute the SCs and analyzing the connectome at various levels of granularity that include the global network, the nodal connectivity, and the lobar intra- and inter-connectivity as well as edge-wise analysis.
Materials and Methods
Participants
This study included 65 patients with PD (mean age: 52.8 ± 10.5 years, 51 men) and 65 age- and gender-matched controls (mean age: 49.8 ± 9.04 years, 53 men). The patients were recruited from the general neurology outpatient clinics and movement disorders services of the National Institute of Mental Health and Neurosciences (NIMHANS), Bangalore, India. A single movement disorder neurologist (author—P.K.P.) evaluated all the patients, and the diagnosis of PD was based as per the UK Parkinson disease society brain bank criteria (Hughes et al., 1992). All patients were screened for the presence of cognitive impairment by using the Mini Mental State Examination, and a score below 24 was set as one of the exclusion criteria. The disease severity was evaluated by using the motor section of Unified Parkinson's Disease Rating Scale (UPDRS-III), and stage of the disease was assessed as per the modified Hoehn and Yahr staging system. The exclusion criteria for controls included history of any neurological or psychiatric disorders or brain injuries, and family history of any neuropsychiatric disorders. Table 1 summarizes the demography and clinical characteristics of the participants.
H & Y, Hoehn and Yahr stage; HAM-A, Hamilton rating scale for anxiety; HAM-D, Hamilton rating scale for depression; LEDD, Levodopa equivalent dose per day; MMSE, Mini Mental Status Examination; PD, Parkinson's disease; UPDRS, unified Parkinson's disease rating scale.
All the subjects had provided written informed consent for their participation in this study, and the Institute Ethics Committee of NIMHANS had approved this study.
Image acquisition
Imaging data were acquired at NIMHANS, Bangalore, by using a Philips Achieva® 3T MRI scanner with a 32-channel head coil. The diffusion magnetic resonance imaging (MRI) data for each subject were acquired by using a single-shot spin-echo, echo-planar sequence in axial sections with the following settings: repetition time (TR) = 8783 msec, echo time (TE) = 62 msec, field of view (FOV) = 224 × 224 mm, section thickness = 2 mm, and voxel size = 1.75 × 1.75 × 2 mm (without any intersection gap), in 15 diffusion-sensitive gradient directions with b-value = 1000 sec/mm2. In addition, the images without diffusion weighting were acquired corresponding to b = 0 sec/mm2. High-resolution 3D T1 TFE images were acquired with TR = 8.1 msec, TE = 3.7 msec, flip angle = 8°, sense factor = 3.5, FOV = 256 × 256 × 155 mm, voxel size = 1 × 1 × 1 mm, slice thickness = 1 mm, acquisition matrix = 256 × 256, and 165 sagittal slices.
Image preprocessing
The preprocessing of diffusion weighted imaging (DWI) images included manual quality assessment, where each image was checked for missing slices and slice ordering and then stored in left-posterior-superior orientation after converting from dicom to nifti format. Eddy current and motion correction was then performed by using FSL employing an affine transformation between the baseline b = 0 image and the gradient images (Smith et al., 2004). Based on the rotation parameter in the affine transformation, the gradients were rotated to match the transformed images. The nonbrain tissue was stripped to reduce intensity inhomogeneity for each individual DWI.
Creating the SC
The T1 image of each subject was preprocessed and parcellated into 86 regions of interest (ROIs) (68 cortical and 18 subcortical regions) of the Desikan atlas (Desikan et al., 2006) by using Freesurfer (Fischl, 2012) to act as node labels. The preprocessing steps involved skull stripping, bias correction, and tissue segmentation. Subsequently, a surface-based nonlinear registration using Freesurfer (Fischl, 2012) was employed to accurately map the cortical sulci and gyri. For mapping the sub-cortical structures, a volume-based registration was performed. From the multiple regions created from Freesurfer pipeline, 86 ROIs (68 cortical and 18 subcortical) were extracted. Segmentation of these regions in each of the subjects was checked manually. To locate the seed voxels in each of the 86 regions, a boundary between GM and WM regions was computed by dilating the WM mask generated via Freesurfer and intersecting it with the segmented labels (Fig. 1). The segmented boundary was then mapped into the DWI space by using intra-individual T1 to DWI affine transformation using FSL (Jenkinson et al., 2012; Smith et al., 2004).
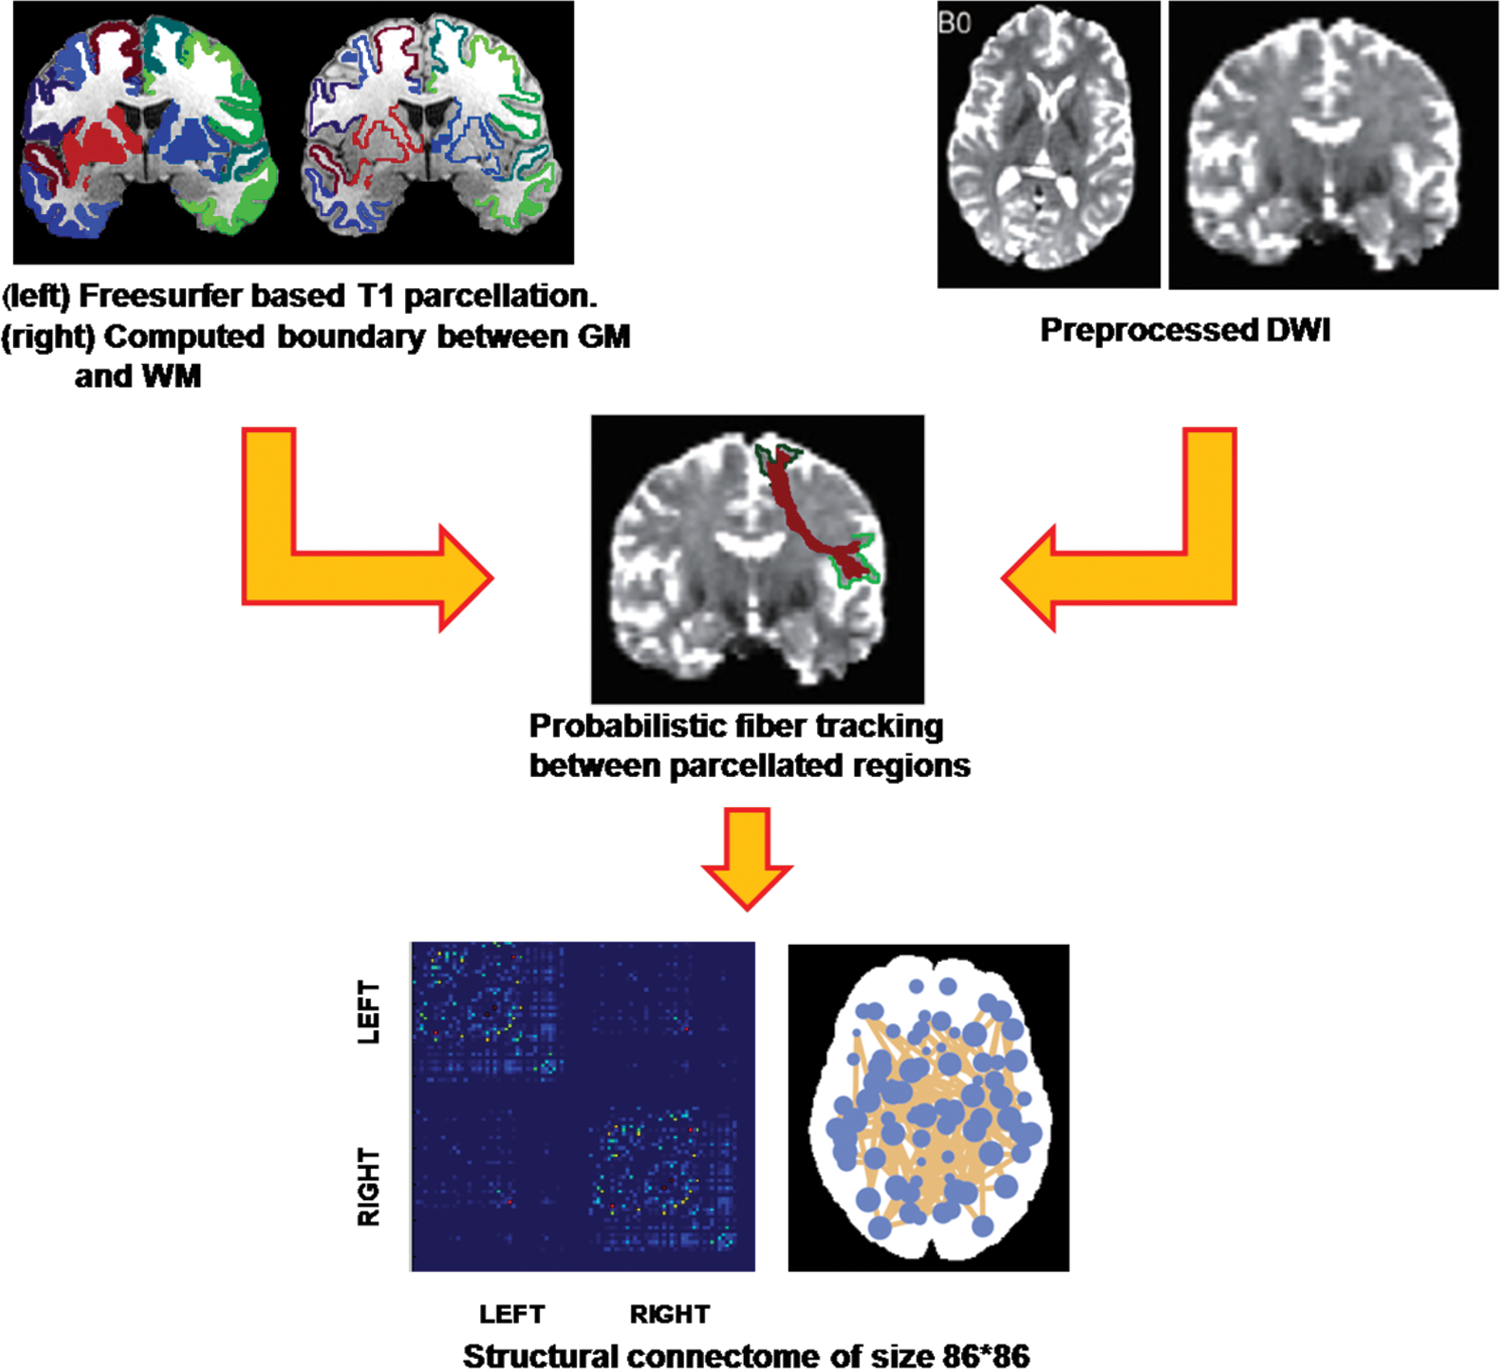
Pipeline for creating the SC. The T1 images were preprocessed and parcellated into 86 GM regions. The boundary between GM and WM was computed. The DWI images were eddy and motion corrected. The segmented regions were overlaid on the DWI by using an intrasubject affine transform. Probabilistic fiber tracking was performed between each of the regions to get an 86 × 86 connectivity matrix. DWI, diffusion weighted imaging; GM, gray matter; SC, structural connectome; WM, white matter. Color images available online at
To compute the edges (links) of the SC, probabilistic tractography (Behrens et al., 2007) was employed by using FSL (Smith et al., 2004). For this, in the first stage a Markov Chain Monte Carlo sampling was performed to construct voxel-wise distributions on principal diffusion directions. Probabilistic fiber tracking was then run from each seed region boundaries to every other region boundary, by repeatedly sampling from the diffusion distributions at each seed voxel, calculating the streamline such that each sample followed, and finally using the results to create a distribution of possible tracks weighted by their probability (Behrens et al., 2007). Tracking parameters were set to two fibers per voxel and 5000 sample streamlines per voxel. Although several connectivity measures have been used in previous studies (Gong et al., 2009; Hagmann et al., 2010), we used the conditional probability Pij between the seed ROI, i, and the target ROI, j, given by Pij = Si→j , where Si →j denotes the number of fibers reaching the target region j from the seed region i whereas Si is the number of streamlines seeded in i. This measure quantifies connectivity such that Pij ≈ Pji , which on average gives an undirected weighted connectivity measure. The diagonal of the matrix, which can be interpreted as self-connections, is zero (Pii = 0). The resulting Pij measures are contained in an 86 × 86 undirected symmetric weighted connectivity network W, which is the SC. Figure 1 displays the complete pipeline for computing the SC.
SC-based analysis
The population analysis between the connectomes of the healthy controls and PD patients was performed at various levels: at the edge level, the node level (local), the lobe level (lobar), and the entire network level (global). We used the brain connectivity toolbox (Rubinov and Sporns, 2010) for computing the standard topological features of the graph and in-house written programs in MATLAB for performing lobe-based analysis and group statistics. For performing the edge-wise analysis, we employed the network-based statistic (NBS) toolbox introduced by Zalesky et al. (2010).
Global measures
To evaluate the differences in the overall organization of the network, graph theoretic features that include density, global efficiency, CC, modularity and characteristic path length of the SC were computed. Density describes how full or sparse the connectivity matrix is and equals to 1 if all the edges in the SC are nonzero. Global efficiency is a measure that is used to evaluate the brain's ability to integrate information from different regions in the brain, based on a weighted combination of the connections between these regions, whereas the characteristic path length is the average of the number of edges comprising the shortest path between any pair of nodes (Rubinov and Sporns, 2010). The modularity demonstrates how well the network can be delineated into groups (or communities), as defined via spectral clustering that maximizes the number of intra-module connections and minimizes the number of inter-module connections. A modularity measure is then calculated from the community structure based on the proportion of links connecting regions in different modules. Finally, the CC quantifies the capability of segregation and is defined by the proportion of possible connections that exist between the nearest neighbors of a node.
The group analysis between the controls and the PD patients on each of the global graph metric was carried out by employing a multivariate analysis of covariance (MANCOVA) model with age and sex as covariates, and the group t-statistic was used to identify the significance.
Nodal measures
To investigate the nodal connectivity, several important regional graph metrics were computed: (1) degree of a node, which characterizes the number of connections to and from each node; (2) strength of a node, which is the sum of all the weights of the links connecting to a certain node; (3) local efficiency, which illustrates the efficiency of communication among the first neighbors of the node i when it is removed; and (4) participation coefficient (PC), which is the ratio of connections within a module and connections outside the module. In our case, we considered each of the lobes as a module instead of computing the modules by using spectral clustering. Therefore, the PC for each node reveals the connectivity of the node within the lobe with respect to connectivity outside the lobe. (5) Eigenvector centrality (EC), unlike strength or degree, does not focus on overall weighted connectivity of the node but signifies the node only when it is connected to other important nodes regardless of fewer connections arising from that node. Details about these topological measures can be found in Rubinov and Sporns (2010).
For each of the nodal measures, we performed a test for significance between the two groups by using the MANCOVA model where age was used as a covariate. To address the problem of multiple comparisons, we employed false discovery rates (FDR), which is a known powerful method for controlling false positives and is explained in detail by Benjamini and Hochberg (1995).
Intra- and inter-lobar connectivity
To obtain insights into the PD underpinnings in structurally cohesive areas that are the lobes of the brain, we compared the within-lobe connectivity as well as between-lobe connectivity between the two groups. The 86 brain regions were divided into 10 anatomically cohesive parts: frontal, temporal, parietal, occipital, and sub-cortical (all L and R). We did not consider the cerebellum as the entire cerebellum was only one node. The within-lobe connectivity was computed by summing up all the edge weights between the nodes belonging to that particular lobe. In other words, the total of all the edges contained in a particular lobe was computed.
The inter-lobar connectivity was calculated by summing up all the edge weights that connected any node from one lobe under consideration to any node from the other lobe under consideration. Statistical analysis that included a hypothesis testing on the intra- and inter-lobar connectivity was performed between the two groups while accounting for age and sex. Similar to nodal and edge-wise analysis, multiple comparisons correction was performed by using FDR on the inter-lobar analysis.
Edge-wise analysis
Edge-wise analysis alleviates the localization of specific edges, where one group may perhaps demonstrate lower connectivity than the other. To compare the connectivity between the groups, we performed edge-wise analysis by using the NBS tool, which performs univariate statistics at each edge (3612 total edges) while controlling for family-wise error rate. At each edge, a test for significance was carried out between the two groups while covarying for age and sex. A design matrix was created and fed into the NBS tool, where the first column models the global mean (intercept term), the second one models the grouping of population, and further columns model the covariates. To address the problem of multiple comparisons, 10,000 random permutations were employed, and only the edges with p-value <0.1 were considered significant. These tests were carried out for both the contrasts: patients > controls and controls > patients.
Results
Global measures
Of the several indices tested for network integrity, the global CC demonstrated a significantly lower value (p-value = 0.03) in patients with PD as compared with controls. Global CC characterizes the connectivity of a given region to its neighbors. Higher CC in healthy controls indicates an overall greater tendency for nodes to form numerous strongly connected communities compared with patients with PD. No significant differences were observed between the groups when other global measures such as the density, global efficiency, modularity, and characteristic path length were compared.
Nodal measures
At the node level, numerous regions demonstrated significantly lower nodal strength in patients with PD (FDR corrected q-value <0.05). These regions included both the hippocampi and several temporal and parietal regions as shown in Figure 2. No significant differences in the nodal degree were observed between the two groups. However, changes in local efficiency were revealed where patients demonstrated lower local efficiency in the left hippocampus (p-value = 0.0013, FDR corrected q-value = 0.03).
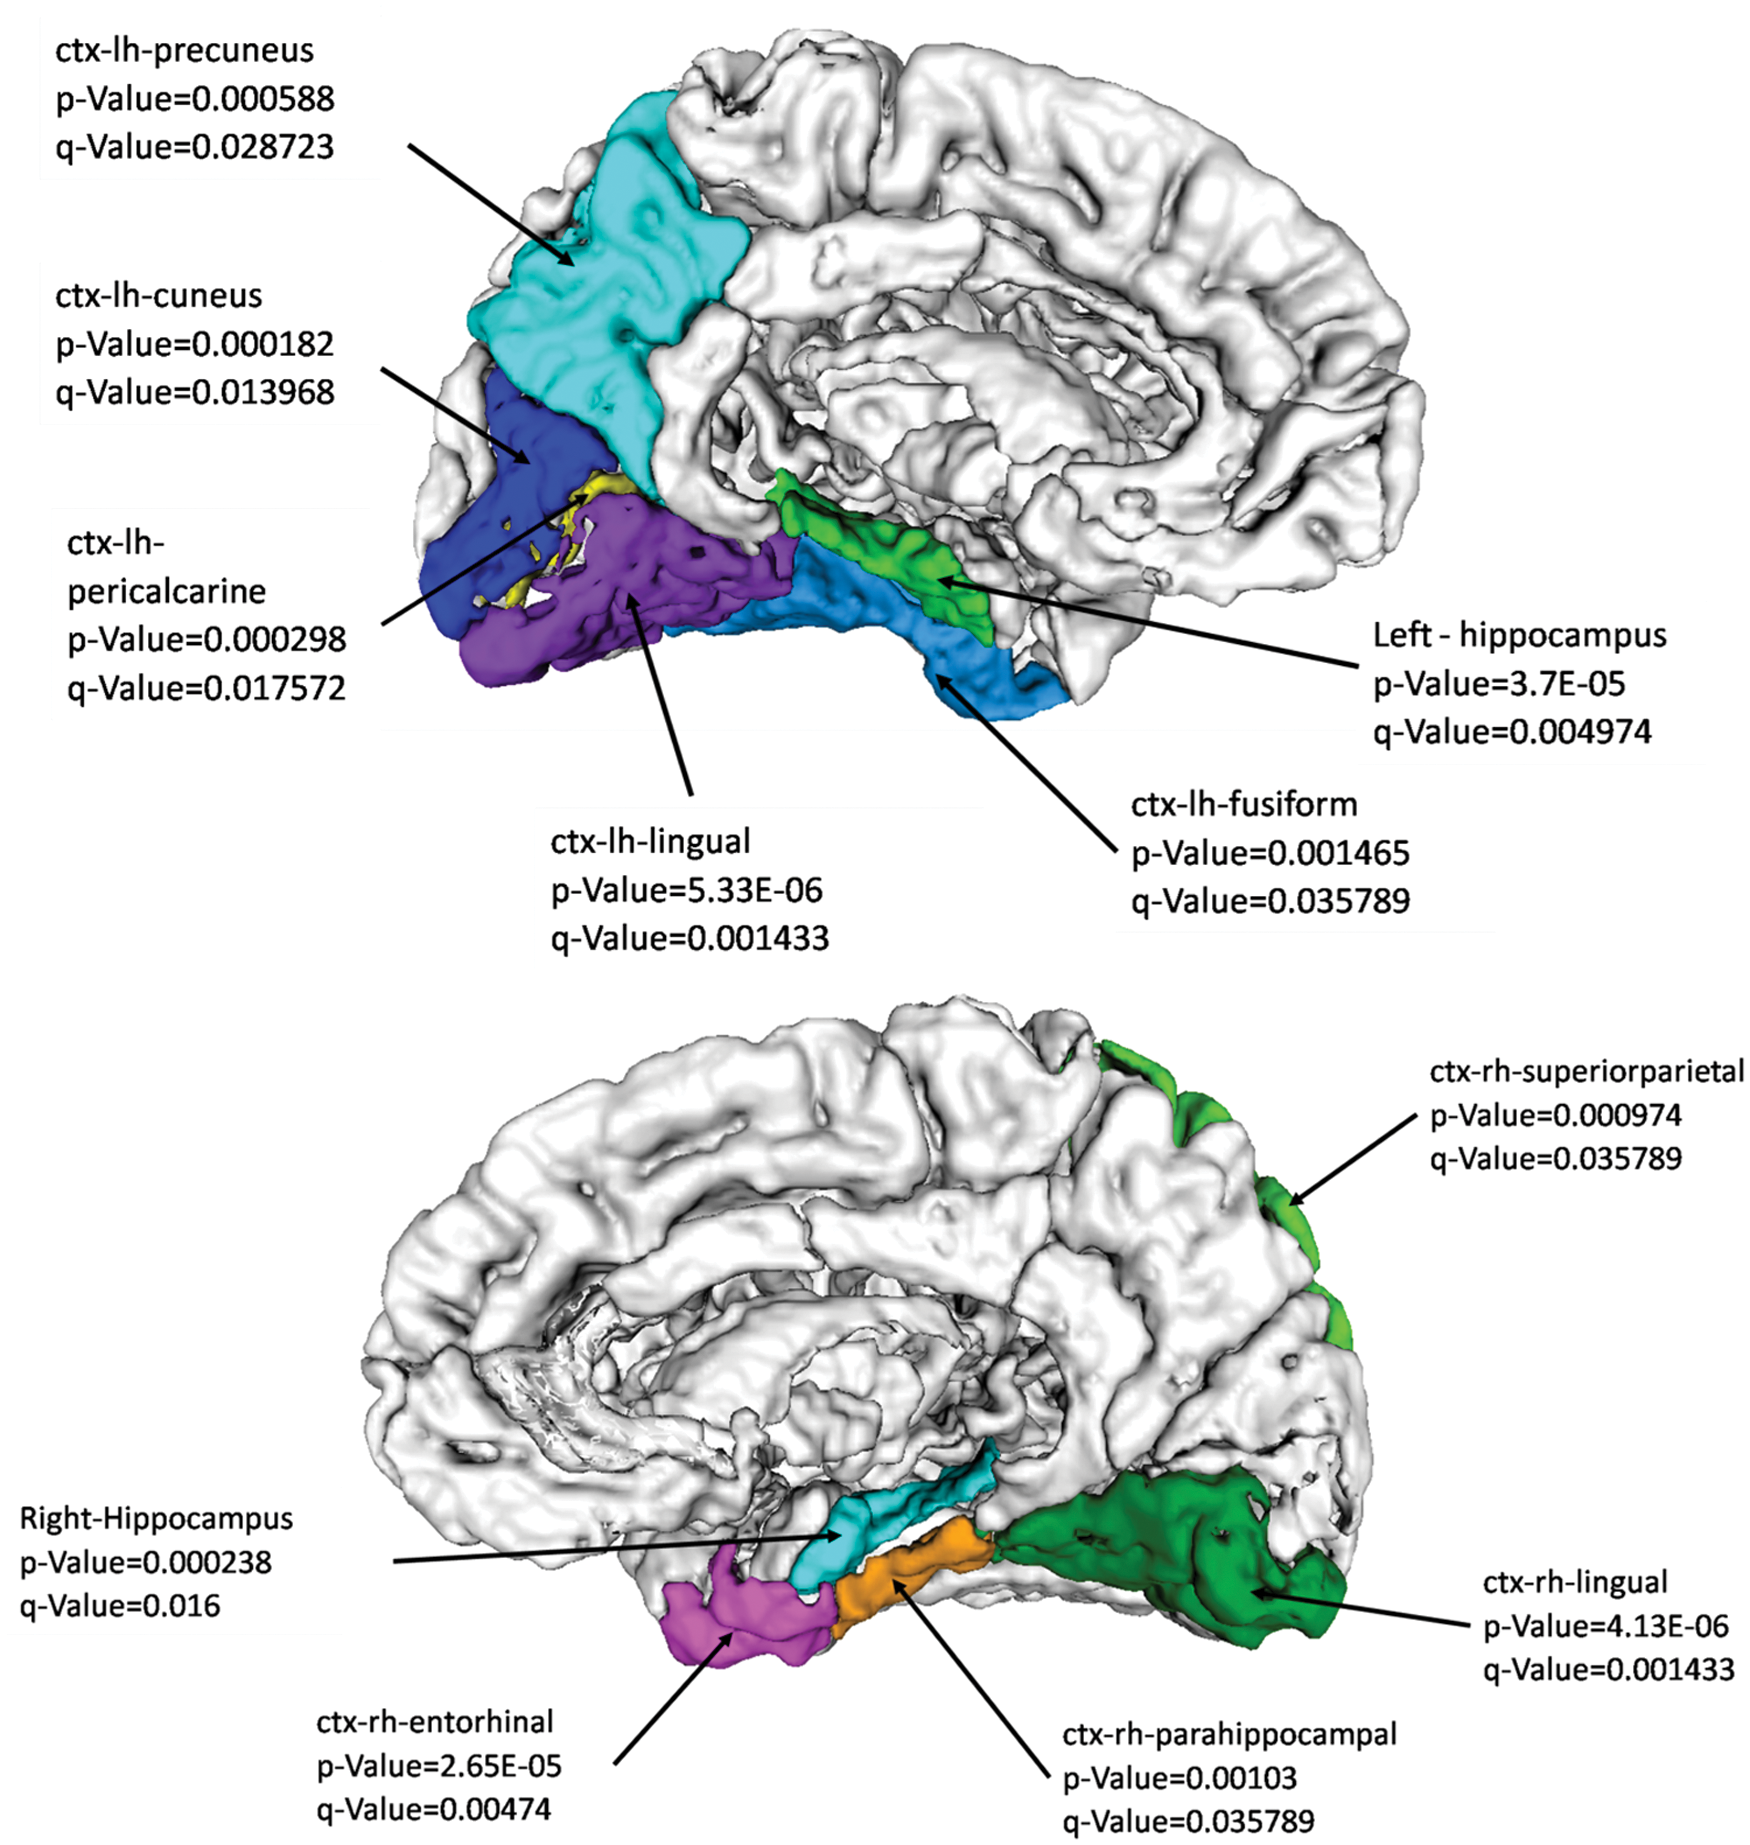
Nodal strength deficits in PD as compared with healthy controls. PD, Parkinson's disease. Color images available online at
Other than considering the nodal connectivity quantifiers, we also examined the EC of the nodes. Interestingly, the EC revealed significantly higher values in the PD patients compared with controls (q-value <0.05 after FDR correction). The EC quantifies the nodal connection to other influential nodes regardless of the number of connections it has. The regions with high EC in PD included the left caudate (p-value = 0.002, q-value = 0.04) in the basal ganglia, bilateral middle-orbitofrontal cortex, and bilateral-rostro-anterior-cingulate cortex as shown in Figure 3, suggesting that these regions retained only the central connections in PD; whereas in controls, these regions connected to not only the central hubs but also many other nonhub areas.
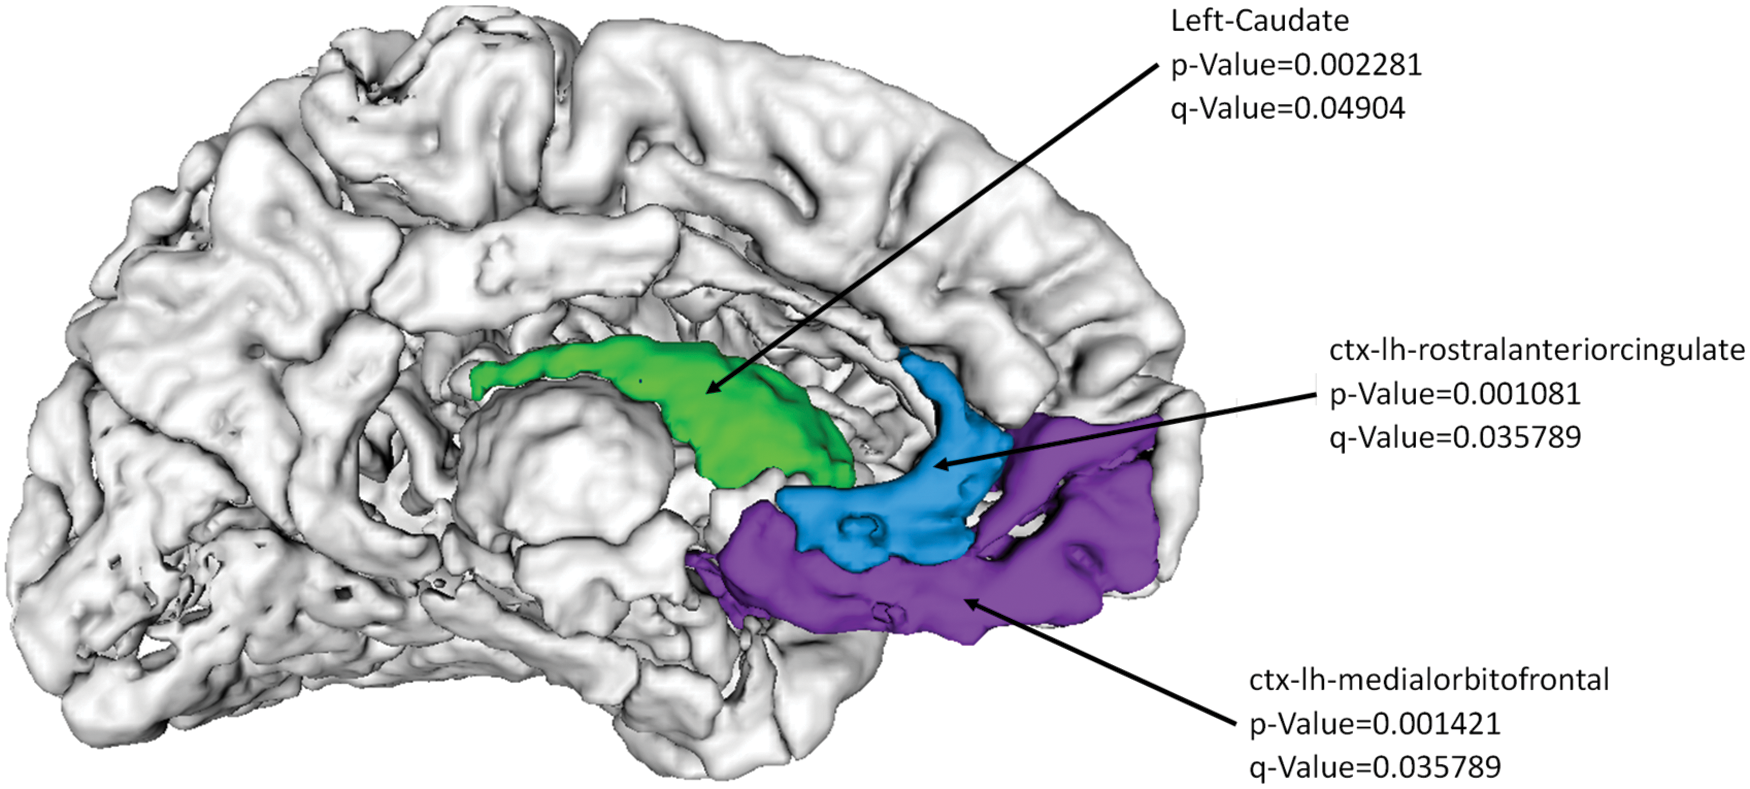
Nodal Eigenvector centrality is significantly higher in PD compared with controls in the regions shown. Color images available online at
Finally, we examined the lobar participation coefficient (LPC) of each node with respect to the lobe it was contained in. The LPC is close to one if its connections are uniformly distributed among all the lobes, and it is zero if all links connect within its own lobe. We found that both the hippocampi and the left precuneus cortex demonstrated significantly lower LPCs as compared with controls (Fig. 4).

Nodal LPC differences between PD and controls. PD patients demonstrated significantly lower LPCs in the areas shown. LPC, lobar participation coefficient. Color images available online at
Lobar measures
To provide insight into changes occurring in the anatomically cohesive regions, which are the lobes of the brain, we performed intra- and inter-lobar analysis between the two groups. Consistent with the results presented earlier, the within-lobe connectivity revealed deficits in PD in the temporal (L and R) (p-value = 0.007 and 0.009 respectively), parietal (R) (p-value = 0.02), occipital (L) (p-value = 0.001), and sub-cortical (L) (p-value = 0.02) networks. The inter-lobe analysis demonstrated lower connectivity between the temporal–parietal and occipital lobes within and between the hemispheres as shown in Table 2.
FDR, false discovery rates; OL, occipital left; OR, occipital right; PL, parietal left; PR, parietal right; TL, temporal left; TR, temporal right.
Edge-wise analysis
The edge-wise analysis revealed noticeable and highly significant differences between the groups with substantially higher edge weights in healthy controls (32 connections) as compared with PD patients as shown in Figure 5. No significant connections were found with patients > controls. Major hippocampal disconnection was revealed as both the hippocampi demonstrated lower connectivity to sub-cortical structures that include the thalamus and the ventral diencephalon (VDC) as well as connections to numerous cortical regions such as cuneus, precuneus, inferior and superior parietal regions, temporal pole, and the banks of superior temporal sulcus (Table 3 and Fig. 5). In addition, widespread connectivity deficits were observed in PD, especially within and between temporal, parietal, and occipital regions as displayed in Table 3.
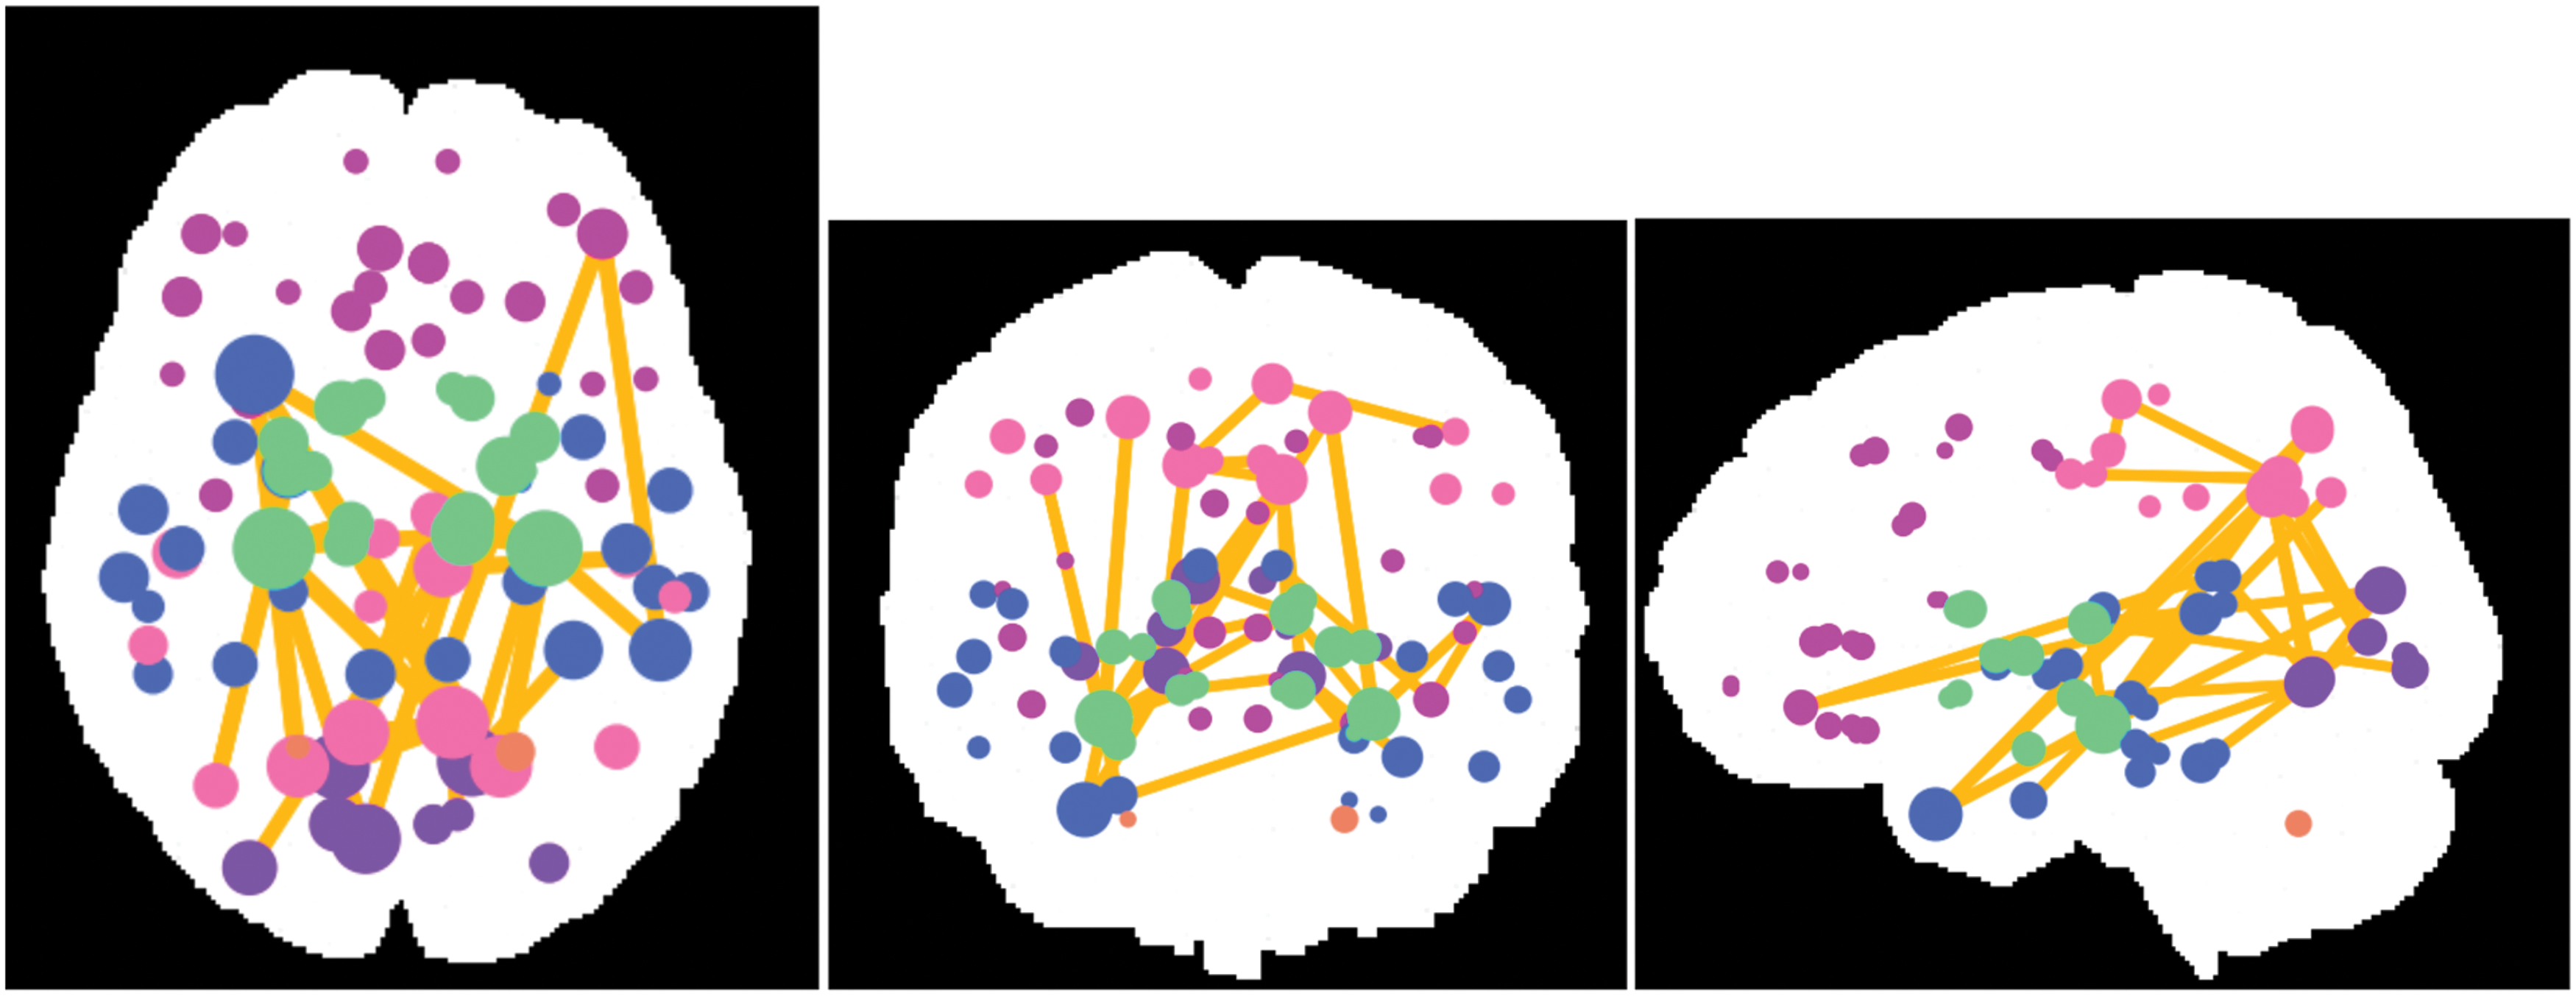
Results from the NBS-based edgewise analysis. We found 32 significant edges after correcting for multiple comparisons out of total 3655 edges. The figure displays all the significant connections. The color of the node depicts the lobe of the brain. The size of the node depicts the number of significant connections from that node. All the connections were significantly higher in controls than in PD patients. NBS, network-based statistic. Color images available online at
Discussion
This study comprehensively investigated the diffusion MRI-based SCs in patients with PD and age-matched healthy controls. Our analysis revealed several findings, some endorsing the previous results and some providing unique insights into the neurobiology of PD. Our results demonstrate complex and subtle structural network deficits in PD that involve not only pathways connecting deep GM regions such as thalamus and VDC but also hippocampus, and multiple regions in occipital, temporal, and parietal cortices.
At the level of global network metrics, we discerned PD patients from the healthy controls based on the global CC. The reduced CC in PD implies less efficient overall local segregation resulting in impaired information processing and has been reported in previous studies based on structural connectomics (Nigro et al., 2016). At the node level, nodal strength and efficiency were significantly lower in PD in the parietal and occipital regions. However, the EC was higher in PD in the left caudate, bilateral middle-orbitofrontal cortex, and the bilateral rostral-anterior-cingulate, suggesting that these nodes retain only the vital connections to the hubs whereas the minor connections are disrupted. Recently, similar negative centrality results have been demonstrated by Galantucci et al. (2016) in patients with PD and MCI. At the lobe level, the within- and between-lobe connectivity was significantly lower in PD as shown in Table 2. The inter-lobe connectivity was significantly lower between the temporal-parietal and occipital lobe within each hemisphere.
At the edge level, we observed multiple networks with significantly lower connectivity in PD compared with healthy controls. The deficits in connectivity patterns were widespread as shown in Figure 5 and included connections from the thalamus, hippocampus, and multiple cortical regions. The disrupted network architecture between the thalamus, VDC, and several parietal and occipital regions in addition to low connectivity in the pathways from the hippocampus to multiple regions as well as connections between multiple cortical regions render a complex picture of simultaneous motor and nonmotor changes observed in PD. These results provide novel insights into the various patterns of disconnection and disruptions of the WM pathways in PD. Moreover, when tested for a negative contrast (patients > controls), no significant connections were found. Thus, these results reveal widespread loss of WM integrity and architecture in PD.
Further, throughout the analysis at the edge- and the node level, loss of hippocampal connectivity was observed. Table 3 demonstrates the edge-wise connectivity deficits between hippocampus and several cortical areas. Figures 2 and 4 display significantly lower nodal strength and LPC, respectively, in both the hippocampi in PD. Significantly lower lobar PC in PD demonstrates that the connectivity of hippocampus with other sub-cortical structures is affected as compared with connectivity with the frontal, temporal, parietal and occipital lobes. Recently, the role of hippocampus in PD neurobiology has been studied extensively (Calabresi et al., 2013; Camicioli et al., 2003). For example, studies based on animal models of PD as well as on humans have demonstrated interactions between dopamine transmission and hippocampal synaptic plasticity in memory and behavior (Costa et al., 2012; Pessiglione et al., 2006). Our findings not only confirm but also provide novel insights into the widespread disconnectivity patterns of the hippocampus in PD.
Earlier, voxel-wise studies demonstrated lower FA and high MD in several regions of the brain in patients with PD with various motor phenotypes and nonmotor symptoms. Hall et al. (2016) have summarized the diffusion MRI-based alterations in PD-related symptoms. In addition to the regions corresponding to the motor network such as the motor cortex, striatum, and thalamus, the cortical and subcortical areas such as hippocampus, cingulate, and several other areas in fronto-parieto-occipital cortices that have been speculated to have associations with the nonmotor symptoms have shown alterations in the WM architecture (Hall et al., 2016). Our results, therefore, further reinforce the results of the previous studies as we report the widespread loss of WM integrity in PD. However, it is important to note that all the previous studies used a simplistic model of structure such as regional analysis or voxel-wise analyses, which treats each region or voxel independently and does not account for the interactions occurring between the multiple areas of the brain. SC analysis, on the other hand, elucidates the interplay between various regions and aids in deciphering specific network changes. Recently, few connectomic studies demonstrated widespread changes in PD under medication (Li et al., 2016), PD with MCI (Galantucci et al., 2016) and in de novo PD patients (Nigro et al., 2016). However, these studies employed small datasets and have limited themselves to deterministic tracking, which inherently may not track through WM crossings. The fiber streamlines employed in these studies achieve the desired symmetry expected from a structural connectivity measure; however, the use of every WM voxel as a seed causes an oversampling of large central fiber bundles, underestimating the smaller fibers and association fibers. Our work relied on the probabilistic Monte Carlo–based fiber tracking, which is an improved model of the WM anatomy and architecture. We tracked directly from the GM nodal regions where the paths of individual samples are tracked to determine the connecting fibers between regions.
Global metrics such as density, characteristic path length, global efficiency, and modularity did not demonstrate any significant differences that have previously been shown in a small group of de novo PD patients (Nigro et al., 2016). In addition, in the basal ganglia, we observed significant difference between the EC of caudate and significant deficits in the thalamus and VDC connectivity. Further, lower connectivity trends in PD patients in the striatal regions were found; however, these were not significant after multiple comparisons that matched the results by Li et al. (2016) and that have been previously shown to be highly significant in the de novo PD population (Nigro et al., 2016). The patients included in this study were not de novo and were on anti-Parkinsonian medication for few years, which might facilitate partial restoration of the connectivity deficits as demonstrated by previous functional MRI and magnetoencephalography-based studies in patients with PD (Delaveau et al., 2010; Luo et al., 2015).
We also recognize few limitations of our study. First, our diffusion protocol did not involve high angular resolution and, therefore, may not guarantee a robust diffusion model (Jones et al., 2013). Second, assessment of nonmotor symptoms and detailed neuropsychological evaluation was not performed, which could have provided better insights into the role of the network disruption that we have demonstrated in patients with PD. Studies in future with high angular resolution diffusion imaging, higher sample size, and involving a clinically homogenous cohort of PD patients are warranted to understand the role of altered SC in the neurobiology of PD.
In summary, this study presents unique insights into the neurobiology of PD by using structural connectivity measures. Deficits in the SC are observed in the multiple pathways and regions. In addition, hippocampal pathways demonstrate major disconnectivity in PD. Our findings corroborate loss of connectivity in several networks, which include the thalamus, hippocampus, regions from the visual cortex, and other cortical regions that have been linked to the nonmotor symptoms of PD, and thus contribute toward an improved understanding of PD.
Footnotes
Acknowledgments
The authors would like to thank CDAC BRAF for providing their parallel computing facility as well as Dr. Ragini Verma and Dr. Birkan Tunc for helping with connectome visualizations. They would also like to acknowledge DST SERB for funding this project (ECR/2016/000808).
Author Disclosure Statement
No competing financial interests exist.