
Abstract
Resting-state functional connectivity is one promising biomarker for Alzheimer's disease (AD) and mild cognitive impairment (MCI). However, it is still not known how accurately network analysis identifies AD and MCI across multiple sites. In this study, we examined whether resting-state functional connectivity data from the Alzheimer's Disease Neuroimaging Initiative (ADNI) could identify patients with AD and MCI at our site. We implemented an index based on the functional connectivity frequency distribution and compared performance for AD and MCI identification with multivoxel pattern analysis. The multivoxel pattern analysis using a connectivity map of the default mode network showed good performance, with an accuracy of 81.9% for AD and MCI identification within the ADNI, but the classification model obtained from the ADNI failed to classify AD, MCI, and healthy elderly adults from our site, with an accuracy of only 43.1%. In contrast, a functional connectivity index of the medial temporal lobe based on the frequency distribution showed moderate performance, with an accuracy of 76.5–80.3% for AD identification within the ADNI. The performance of this index was similar for our data, with an accuracy of 73.9–82.6%. The frequency distribution-based index of functional connectivity could be a good biomarker for AD across multiple sites.
Introduction
R
Previous resting-state fMRI studies seem to provide optimistic rates for the classification of AD, MCI, and healthy elderly individuals. A number of different approaches, such as region of interest (ROI) (Balthazar et al., 2014; Challis et al., 2015; Chen et al., 2011; Wang et al., 2006), graph theory (Li et al., 2013; Supekar et al., 2008), regional homogeneity (Zhang et al., 2012), and multimodal analysis (Dai et al., 2012; Dyrba et al., 2015; Koch et al., 2012), have shown very high performance (72–94% accuracy) for identification of AD patients. However, most previous evidence has demonstrated their usability based on analysis of just one site or dataset, except for a recent study by Teipel et al. (2017). Their ROI-based approach achieved 74% and 72% accuracy for AD and MCI classification, respectively, using data from five sites with different scanners and measurement parameters (Teipel et al., 2017). Significant and quantitatively important intersite differences remained in the temporal signal-to-noise ratio of resting-state fMRI data, and these were plausibly driven by hardware and pulse sequence differences across scanners, which could not be harmonized (Jovicich et al., 2016). An AD identification model or index should be robust across these differences. Such robustness necessitates that the model or index obtained from a given database can identify AD in an individual from another site, given that all sites cannot necessarily prepare their own healthy control (HC) data.
Recently, multivoxel pattern analysis (MVPA) using machine learning (Mahmoudi et al., 2012) has been frequently used for AD identification. However, it is not clear whether the MVPA identification model at a given site or dataset can accurately classify AD, MCI, and healthy elderly adults from other sites. One of the aims of our study was to undertake a performance evaluation of AD and MCI identification based on MVPA across databases. In addition, we propose a simpler index based on the functional connectivity frequency distribution. Decreased functional connectivity of the DMN has been repeatedly reported in AD (Joo et al., 2016; Krajcovicova et al., 2014; Sheline and Raichle, 2013) and is expected to be a good marker for AD identification across databases. More voxels within the DMN are presumed to show decreased functional connectivity in AD, but the spatial distribution differs according to individuals or databases. To cancel out spatial differences between connectivity changes within the DMN, we applied an analysis based on the functional connectivity frequency distribution. This analysis depends on the notion that the mean connectivity of lower ranked voxels in the frequency distribution would be smaller for AD patients than for healthy elderly adults, and might be more sensitive compared to the overall mean of the voxels within the local regions of the DMN. Our second aim for this study was to evaluate the performance of frequency distribution-based analysis for AD and MCI identification across different databases.
Materials and Methods
Subjects
Alzheimer's Disease Neuroimaging Initiative (patients and controls)
The first dataset used in this study was obtained from the Alzheimer's Disease Neuroimaging Initiative (ADNI) database
AD, Alzheimer's disease; ADNI, Alzheimer's Disease Neuroimaging Initiative; CDR, Clinical Dementia Rating Scale; HC, healthy controls; MCI, mild cognitive impairment; MMSE, mini-mental state examination.
SHIMANE (patients, controls, and young)
We recruited patients at Shimane University hospital to provide test data for AD and MCI identification. The inclusion criteria were defined as follows: (1) age >60, (2) no signs of depression, (3) no presence or history of neurological or psychiatric disorders except for MCI or AD, and (4) no presence or history of alcohol or drug abuse. Twenty-six patients with AD (mean age = 73.4 years old, 12 females), 19 patients with MCI (73.4 years old, 9 females), and 20 HCs (71.3 years old, 8 females) provided data for this study. The AD patients met the National Institute of Neurological and Communicative Disorders and Stroke and the Alzheimer's Disease and Related Disorders Association criteria for probable AD. The MCI patients fulfilled the criteria developed at a workshop convened by the National Institute on Aging and the Alzheimer's Association (Albert et al., 2011). During the selection of age-matched control subjects, we recruited from local communities and excluded subjects with a mini-mental state examination (MMSE) score of ≤26, CDR of ≥0.5, and a history of neurological and/or psychiatric disease. Many additional subjects were tested, but excluded because of missing data (n = 1) or CDR = 2 (n = 7) or excessive head movements during fMRI (n = 3). The demographic information for these subjects are also summarized in Table 1. There were again no significant group differences for age or sex.
In addition to the patients and healthy elderly controls, we used resting-state fMRI data from 44 healthy young subjects to make a template image of the DMN (see DMN template section). These individuals were 25.7 ± 3.1 years old, and the gender ratio was 22/22. All of the young subjects had no neurological or psychiatric disease. The Shimane University medical ethics committee approved this study, and all subjects gave their written informed consent to participate.
Image acquisition
Functional MRI data were acquired using Philips 3T scanners for the ADNI, a GE 3T scanner for the patients and elderly controls from SHIMANE, and a Siemens 1.5T scanner for the young subjects from SHIMANE. Measurement parameter details are summarized in Supplementary Table S1 (Supplementary Data are available online at
Overview of analysis
First, we performed preprocessing for all resting-state fMRI data. We used an independent component analysis (ICA) approach to evaluate functional connectivity because ICA yields more reliable DMN connectivity measurements relative to seed-based analysis (Jovicich et al., 2016). A multicentric resting-state fMRI study by Jovicich et al. (2016) revealed that test-retest reproducibility error for DMN connectivity in the elderly was lower for ICA than seed-based analysis. Moreover, ICA is relatively unaffected by different temporal sampling rates (De Luca et al., 2006). To make a DMN template, an ICA was applied to the preprocessed data from the SHIMANE young subjects group. Then, a constrained ICA (CICA) using a mask image of the DMN extracted by the first ICA was performed for each individual (except the young group). Using the DMN functional connectivity map, we examined whether AD and MCI identification models based on the ADNI data could identify the AD and MCI patients from SHIMANE. The identification methods in this study were MVPA and frequency distribution analysis of functional connectivity.
Preprocessing of functional images
Statistical Parametric Mapping (SPM12) was used for preprocessing. The functional images were realigned to remove any artifacts from head movement. Subjects who moved their head excessively (over 2 mm) were excluded from the following analysis. There were no head movement differences between the three groups for both ADNI and SHIMANE datasets (ADNI: AD 0.58 ± 0.43 mm, MCI 0.45 ± 0.27 mm, HC 0.47 ± 0.35 mm; SHIMANE: AD 0.59 ± 0.43 mm, MCI 0.45 ± 0.31 mm, HC 0.41 ± 0.27 mm). The images were corrected for differences in image acquisition time between slices, and were normalized to a Montreal Neurological Institute (MNI) template space by using diffeomorphic anatomical registration through exponentiated Lie algebra (DARTEL) method. The effect of head movement parameters ([x y z pitch yaw roll] and their frame-wise displacements) and mean blood oxygenation level-dependent (BOLD) signals from whole brain, white matter, and cerebrospinal fluids was removed at each voxel. Spatial smoothing was applied with full-wide half maxima equal to 6 mm.
DMN template
To develop templates of resting-state networks, datasets were used from younger individuals. This technique was used because many previous studies have reported aging effects on DMN (Biswal et al., 2010), suggesting that not only AD patients but also healthy elderly exhibit altered DMN. We performed a spatial ICA for the SHIMANE young group data using the Group ICA of the fMRI toolbox (GIFT). ICA is a data-driven multivariate signal-processing approach. In ICA, the signal observed at a given voxel is assumed to be the sum of the contributions of all the independent components (ICs). The spatial distributions of the IC voxel values are statistically independent from each other; the degree of contribution reflects the functional connectivity of the IC network. GIFT can confirm the contributions of all voxels to each IC as whole-brain images of z-scores. The maps were averaged to produce a component map, and a one-sample t-test was performed. An IC map, including the medial prefrontal cortex, posterior cingulate cortex, precuneus, and inferior parietal lobe, was selected as the DMN, and was binarized with the criteria of p < 0.05 with family-wise error correction and voxel size >200. Because the CICA requires at least two templates, we made a frontoparietal network (FPN) map in the same way. The DMN and FPN are task-negative and task-positive networks, respectively, and they are basically in an exclusive relationship. The binarized DMN and FPN images were used as templates for the CICA.
Constrained independent component analysis
CICA helps to eliminate order ambiguity in the standard ICA. CICA is capable of extracting the desired ICs by incorporating prior information into the ICA contrast function when rough templates are available (Lu and Rajapakse, 2005). We performed CICA using the DMN and FPN templates for each individual. In this case, CICA allowed us to detect ICs for each individual in the same manner, and to obtain stable DMN and FPN as first and second ICs with fixed order. This is an advantage considering actual AD identification in clinical contexts, because it avoids manual IC selection. The z-values of the DMN map were used for AD identification in this study. First, we compared the DMN map of the three groups in both datasets using a whole-brain analysis of variance (ANOVA) in SPM. The statistical criteria were set to uncorrected p < 0.001 at the voxel level and false discovery rate (FDR)-corrected p < 0.05 at the cluster level.
Multivoxel pattern analysis
The Pattern Recognition for Neuroimaging Toolbox (PRoNTo) was used for MVPA. An MVPA flow chart is depicted in Figure 1. The z-value maps of the DMN were treated as spatial patterns, and statistical learning models were used to identify statistical properties of the data that could discriminate AD, MCI, and HC.
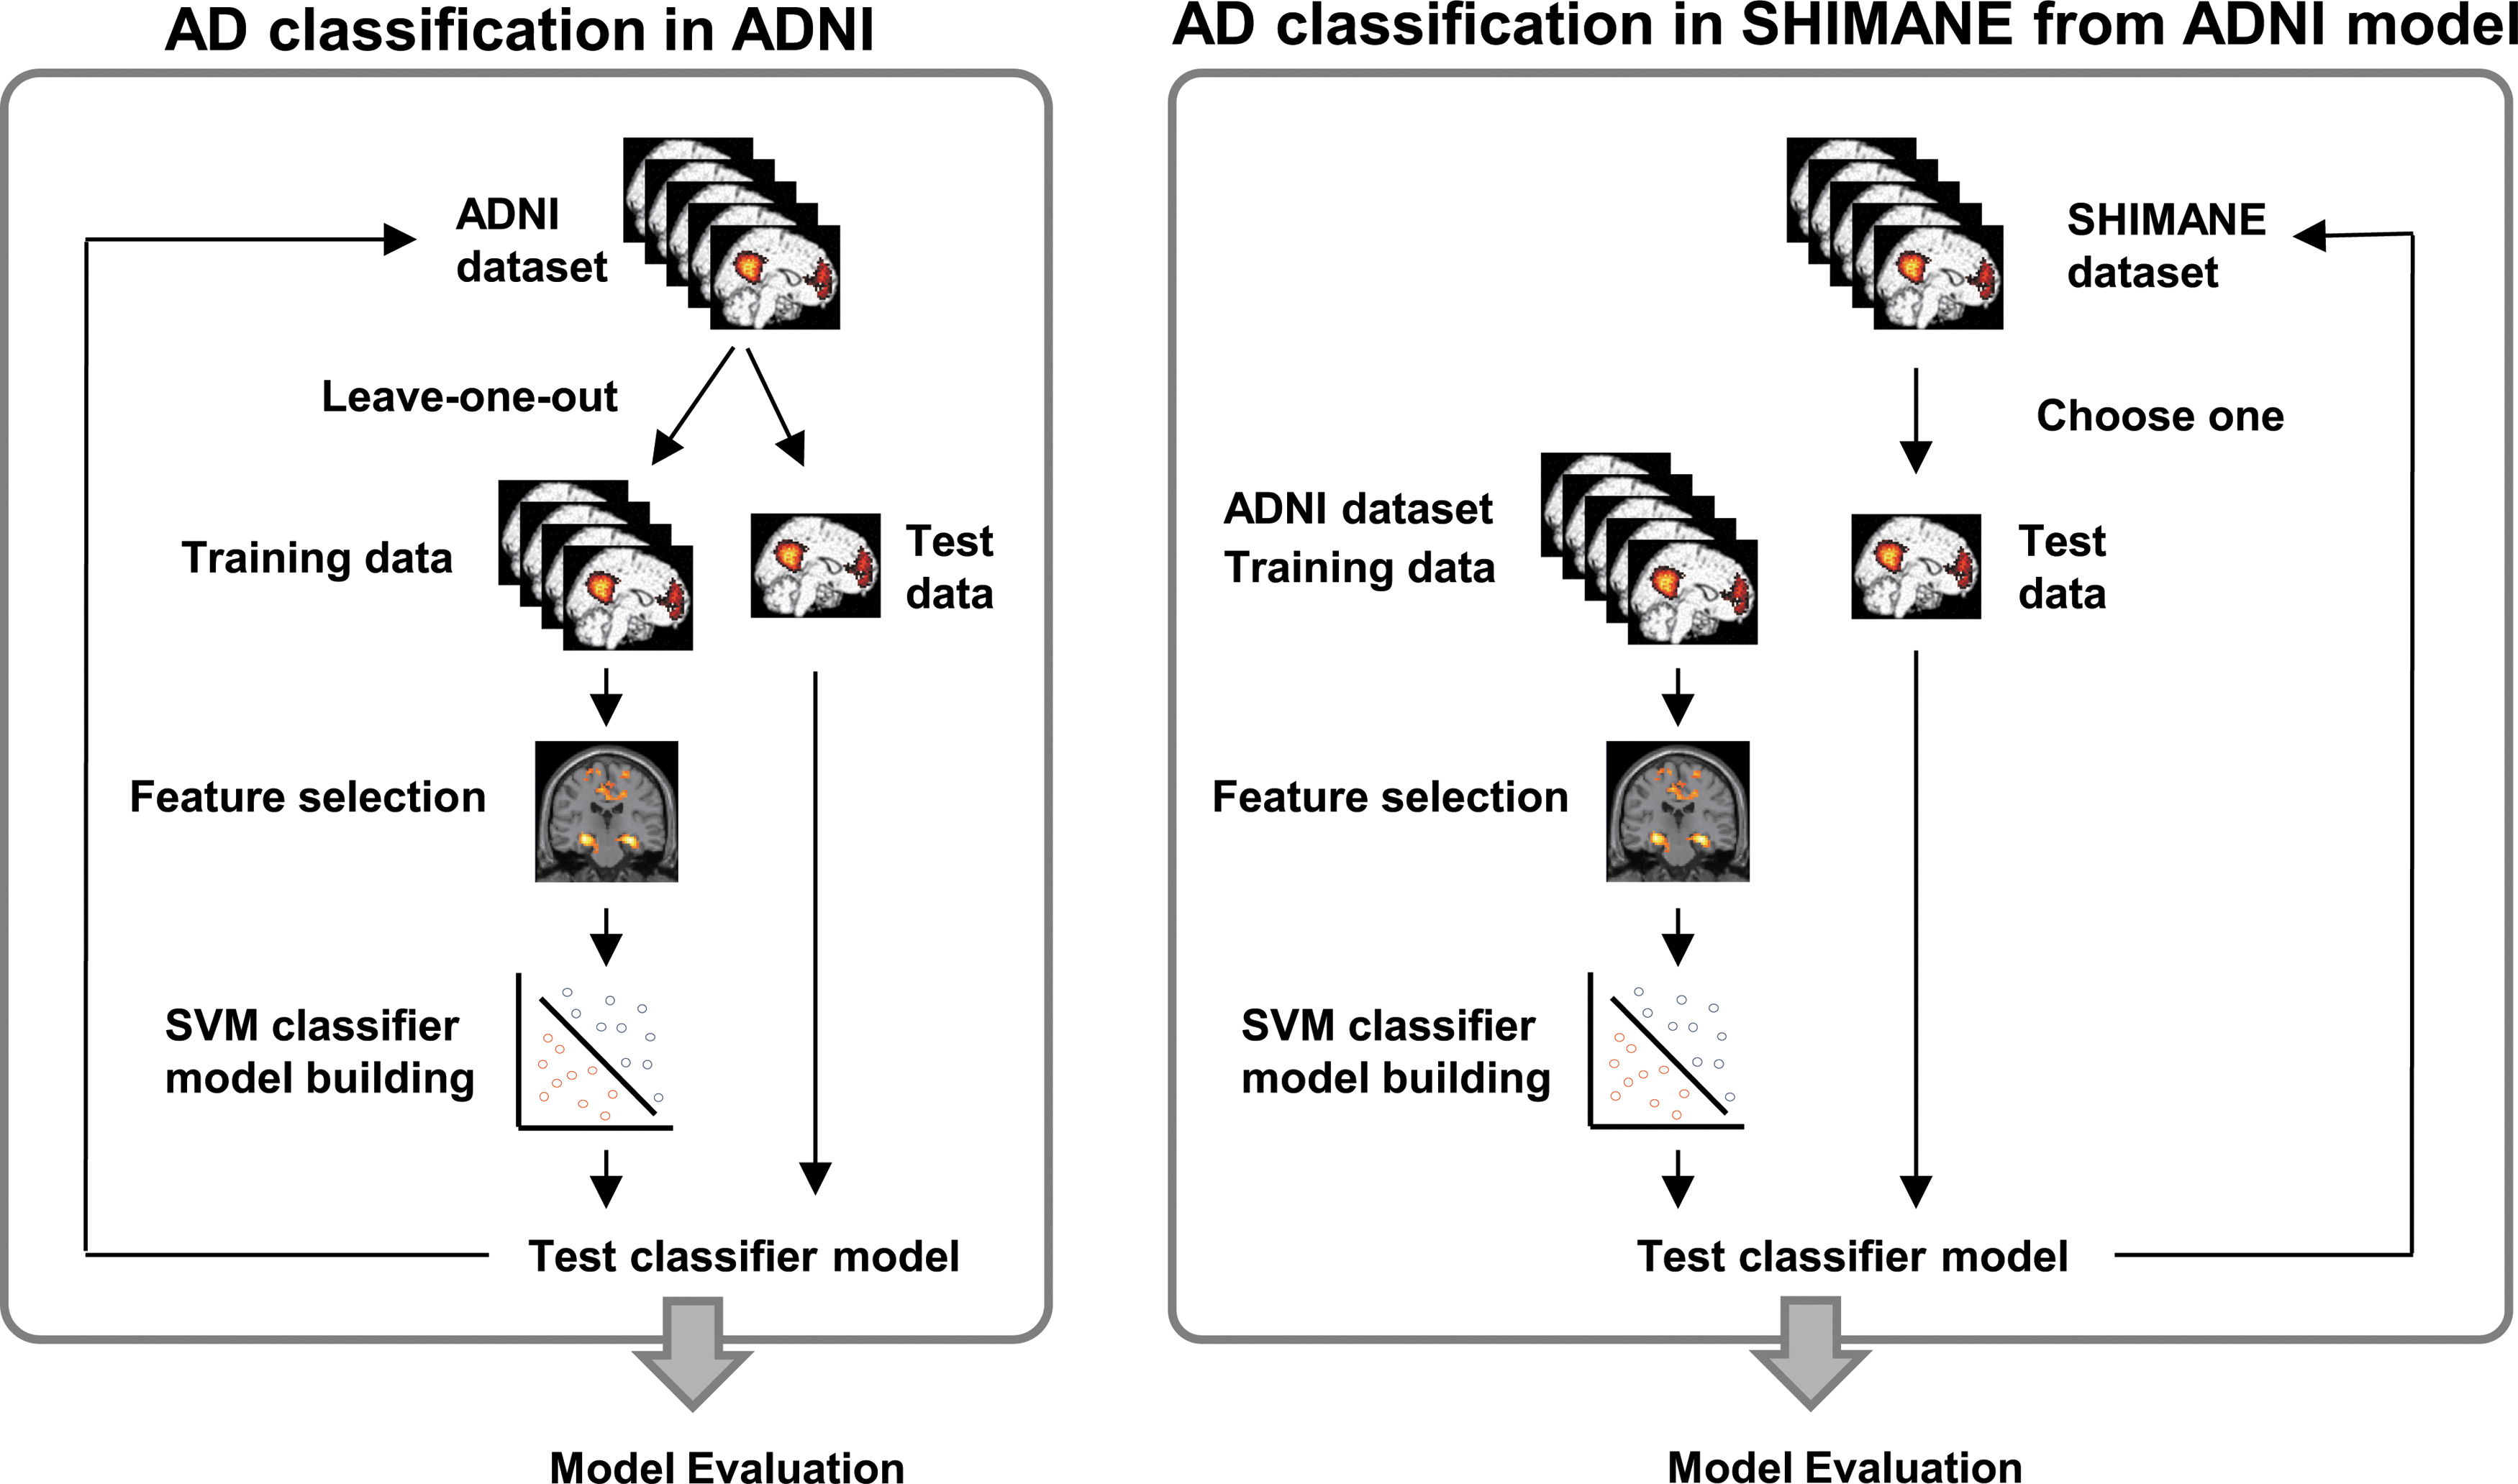
Flowchart of the multivoxel pattern analysis. ADNI, Alzheimer's Disease Neuroimaging Initiative; SVM, support vector machine.
First, we examined whether the DMN map could identify patients within the ADNI database. The learning and classification process involves four steps: (1) dividing the subjects into training and test sets, (2) selecting discriminative regions, (3) training the classifier model using the training data, and (4) evaluating the performance of the model using the test data (see Fig. 1, left). To examine the performance of the classifier, a leave-one-out cross-validation approach was taken, and every subject was selected once as the test data, with the remaining subjects forming the training data. AD, MCI, and HC in the training data were compared using ANOVA. Binary mask images, which had regions showing a significant decreased functional connectivity (p < 0.05 at voxel level), were created. The voxel values of the DMN map masked by the binary image were used as features. The support vector machine classifier (binary) and Gaussian process classifier model (multiclass) were trained by using the features of the training data. The default setting of PRoNTo was used as the parameter of the machine learning. The classifier models were applied to the test data to evaluate AD and MCI identification performance.
Next, we examined whether the classifier models based on the ADNI data could identify AD and MCI on the basis of the SHIMANE data. This analysis was similar to the above-described one, but the ADNI dataset was used as the training data. A whole-brain ANOVA was applied to the training data (all subjects of ADNI) for feature selection, and all the voxels that showed a significant group difference (p < 0.05 at the voxel level) were included as input features in the machine learning. The classifier models calculated from the training data were applied to each individual's data from SHIMANE to evaluate the performance of AD and MCI identification across databases (see Fig. 1 right).
Frequency distribution-based analysis of functional connectivity
We propose a new simple index to classify AD and MCI. Because the MTL of AD patients commonly showed decreased functional connectivity in both databases (see Results section), we focused on the MTL in this analysis. Based on the notion that more voxels in the MTL of AD patients show decreased functional connectivity compared to HCs, we carried out a frequency distribution-based analysis. A flow of this analysis is depicted in Figure 2. In this approach, the z-value of voxel i of the DMN obtained through the CICA was normalized by using the mean (m) and standard deviation (σ) of the ADNI control group as follows: z i′ = (z i−m i)/σ i. When normalizing individual data for the ADNI control group, the m and σ did not include data from the present individual. The normalized DMN map was masked to extract the functional connectivity change (z′) of voxels within the MTL. The MTL was defined using automated anatomical labeling, and consisted of the hippocampus, parahippocampal gyrus, and amygdala (1295 voxels in this study). The z′ within MTL was reshaped to a one-dimensional array and was sorted in ascending order. The distribution of z′ is depicted in the bottom right of Figure 2. Each voxel was ranked based on the order of sorted z′. We predicted that a distribution (histogram) of z′ within the MTL would shift to a negative value in AD patients. To confirm the prediction, we calculated mean z′ scores for the lower ranked voxels (range: 10–100% for MTL voxels, step: 10%), for each individual. The mean score for all voxels (100%) in the MTL corresponds with the normal ROI analysis. We performed receiver operated characteristic (ROC) analysis for mean z′ scores of lower ranked voxels for each range to assess AD and MCI identification performance in each dataset. Similarly, we performed this analysis for core regions of DMN, including the posterior cingulate cortex/precuneus, medial prefrontal cortex, and inferior parietal cortex. These ROIs were defined by the DMN mask obtained by data from young individuals (see DMN template section).
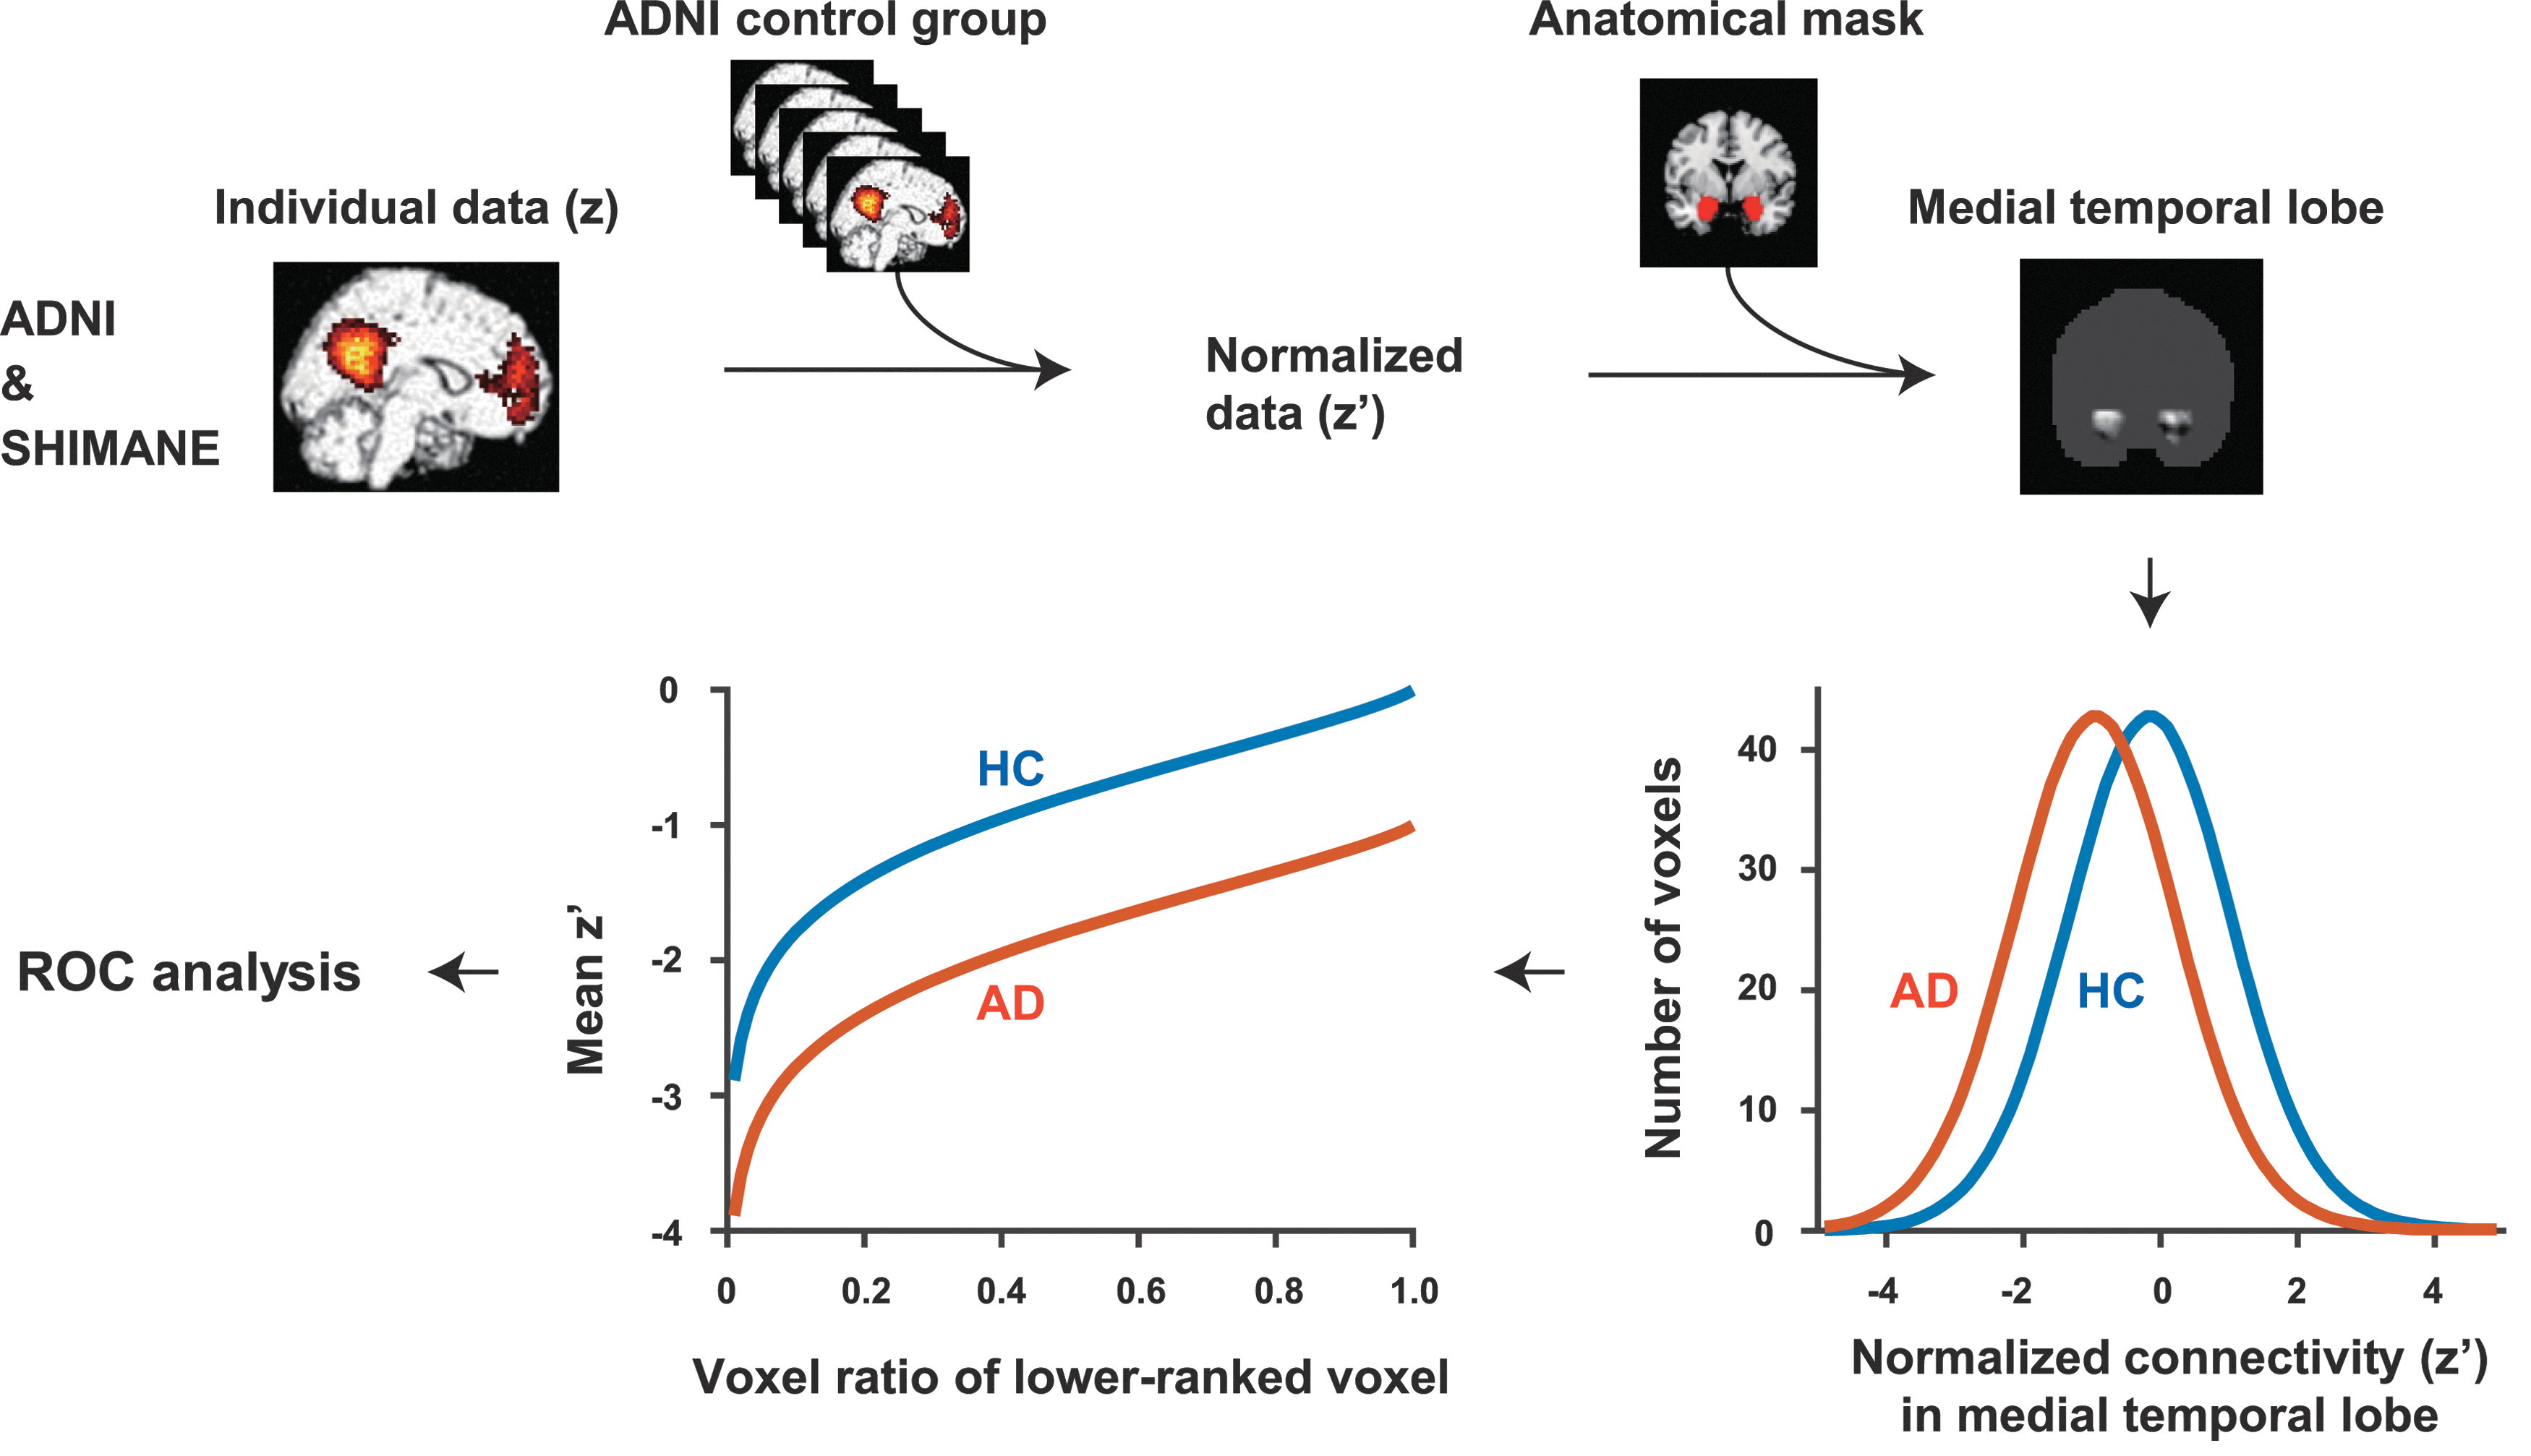
Flowchart of analysis based on frequency distribution of functional connectivity. AD, Alzheimer's disease; HC, healthy controls; ROC, receiver operated characteristic.
Results
Constrained independent component analysis
Figure 3 shows the group differences for DMN connectivity among AD, MCI, and HC subjects. A whole-brain ANOVA revealed a significant main effect of group for the bilateral hippocampus, and the functional connectivity of the regions were decreased in AD compared with MCI and HC (Fig. 3 and Supplementary Table S2). MCI did not show decrements of functional connectivity in the region in both datasets. To test effects of brain atrophy, we conducted reanalyses after adding the voxel-wise gray matter density map as a covariate using Biological Parametric Mapping (Casanova et al., 2007). The method permits solving a general linear model by incorporating information obtained from other modalities, such that we could investigate group differences after excluding the effect of brain atrophy. The differences among the groups were still significant even after controlling for the effects of brain atrophy (Supplementary Table S3), which means that the decreased functional connectivity of the hippocampus is independent of any effects of regional atrophy.

Comparison of functional connectivity in default mode network.
Multivoxel pattern analysis
Figure 4 shows confusion matrixes and ROC curves obtained through MVPA. In the multiclass case, the model obtained by Gaussian process classifier identified patients with AD and MCI with high accuracy for the ADNI data (accuracy: 81.9%, Fig. 4A). However, when applying the classifier model from the ADNI data to the SHIMANE data, AD and MCI identification accuracy decreased markedly (accuracy: 43.1%, Fig. 4C). Similarly, the binary classification models between each group were able to precisely identify patients with AD or MCI in the ADNI data (accuracy of AD/HC: 91.4%, AD/MCI: 79.8%, MCI/HC: 90.4%), whereas the models failed to classify the SHIMANE data (accuracy of AD/HC: 58.7%, AD/MCI: 60.0%, MCI/HC: 51.3%) (Table 2).
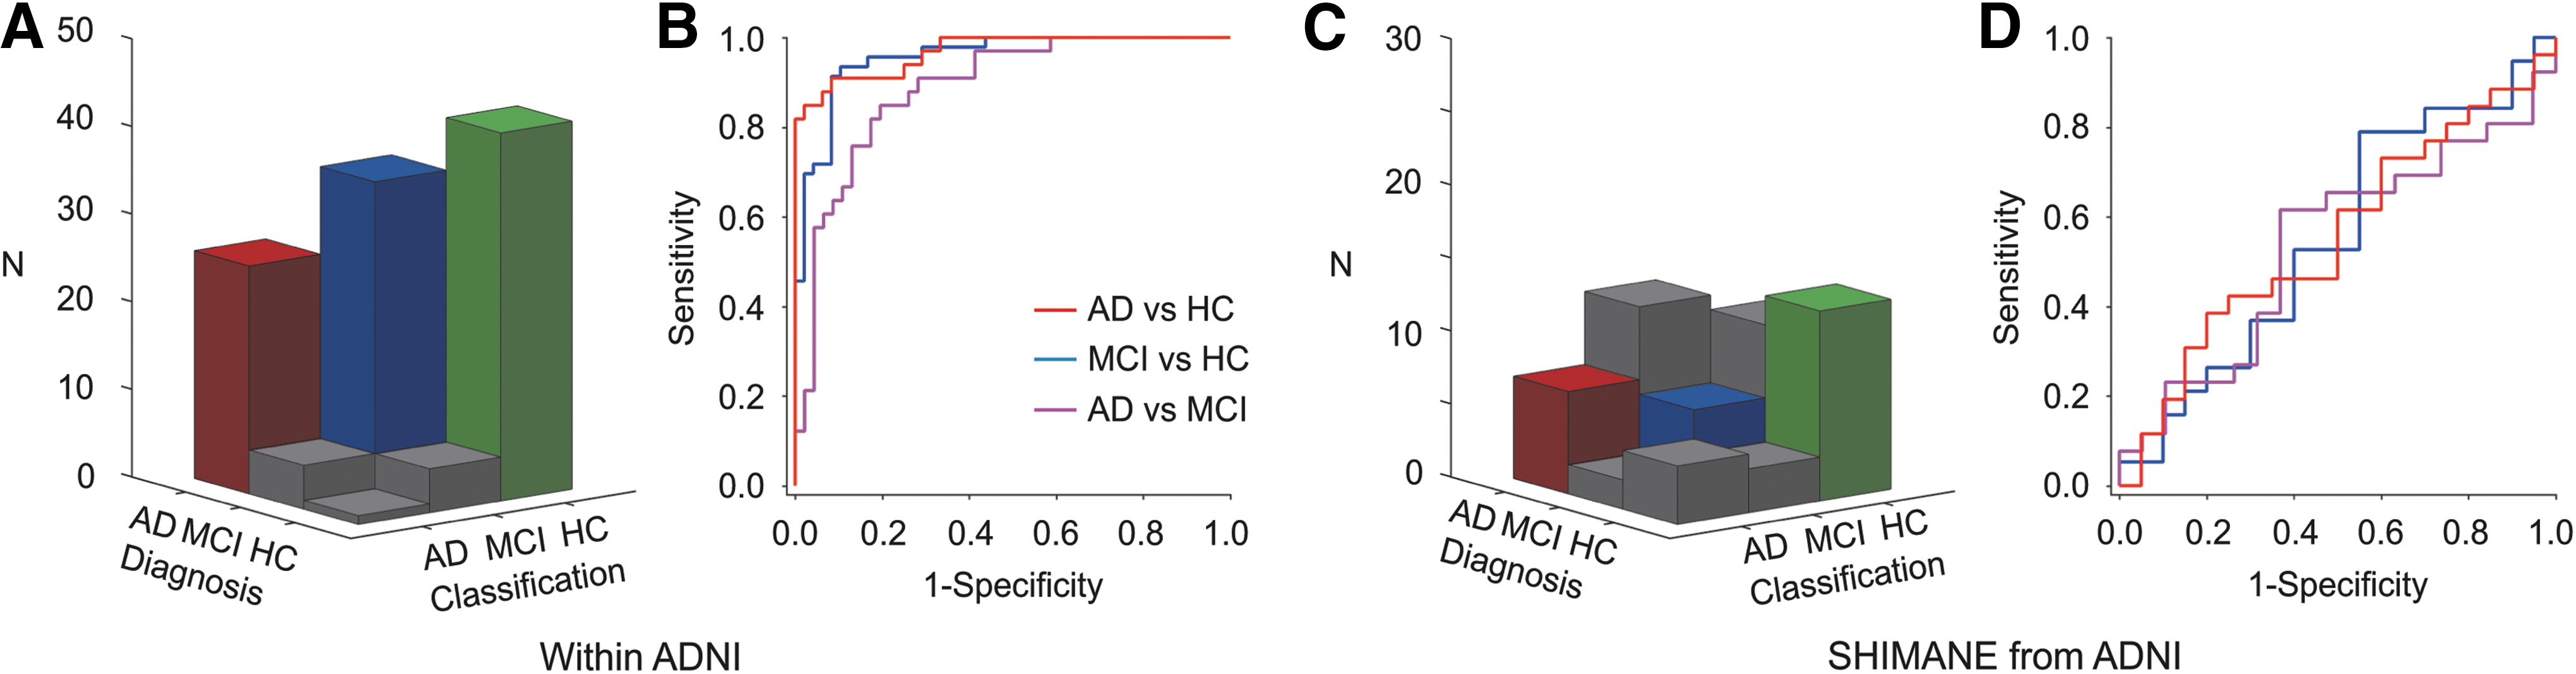
Multivoxel pattern analysis (MVPA) results.
Values within parenthesis denote p-values of permutation tests, and the iteration was 1000.
Frequency distribution-based analysis of functional connectivity
The DMN functional connectivity map (z) was normalized for the ADNI healthy subjects, for both ADNI and SHIMANE data. Normalized functional connectivity (z′) within the MTL was extracted, and the frequency distribution of z′ was examined (Fig. 5A, E). The distributions for the AD group shifted to the negative, which means that more voxels in the MTL tended to show decreased functional connectivity in AD patients compared to MCI and HC individuals. This tendency was same for ADNI and SHIMANE data. We calculated the z′ averages within voxels, which showed stronger declines of functional connectivity among all voxels in the MTL, and compared the mean connectivity between the groups (Fig. 5B, F). Mean connectivity was lower for AD than MCI and HC in each dataset (p's < 0.001). We conducted ROC analyses of mean connectivity (Fig. 5C), and accuracy performance for the ADNI data was 76.5–80.3% across the voxel ratio for the classification of AD and HC. The classifications of AD/MCI and MCI/HC showed lower performances (under 70%). Similarly, the accuracy performance for mean connectivity in the SHIMANE data was 73.9–82.6% for classification of AD and HC (Fig. 5G). Figure 5D and H show the ROC analysis result for mean functional connectivity of the lower ranked 50% voxels: There was no decrement in AD identification performance from the ADNI data to the SHIMANE data.
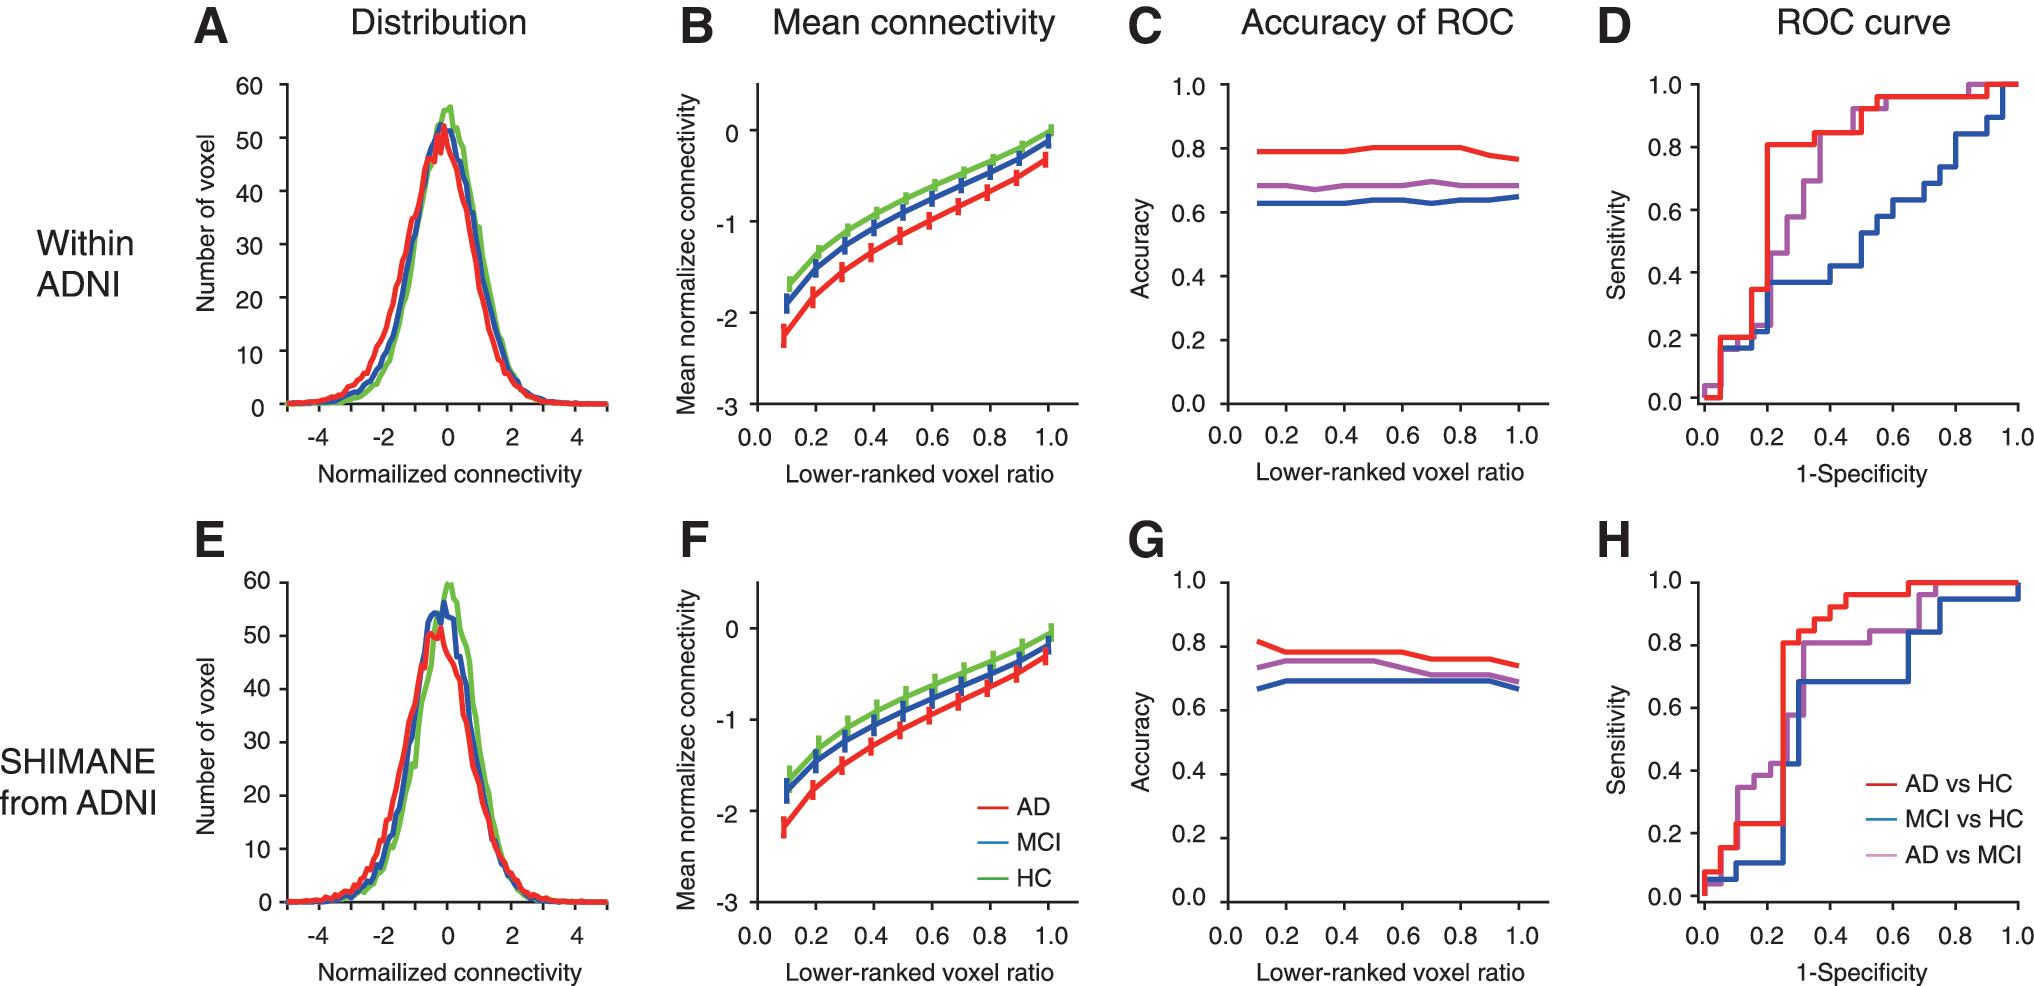
Frequency distribution analysis results for functional connectivity in the medial temporal lobe (top: ADNI; bottom: SHIMANE). Left plots
Moreover, to compare the performance between MTL and other DMN core regions, we applied our approach to posterior cingulate cortex, medial temporal cortex, and inferior parietal lobe. Figure 6 shows the identification accuracies using normalized functional connectivity of each region in ADNI and SHIMANE datasets. In both datasets, the AD classification accuracy-based MTL were higher than those of each DMN core region and the entire DMN.

Accuracy of identification using frequency distribution analysis for functional connectivity in regions of DMN (top: ADNI; bottom: SHIMANE). DMN, default mode network; IPL, inferior cingulate cortex; MPFC, medial prefrontal cortex; MTL, medial temporal lobe; PCC, posterior cingulate cortex.
Discussion
The aim of this study was to evaluate the AD and MCI identification performances of MVPA and frequency distribution-based analysis across two distinct databases. While MVPA failed to produce consistent identification across the databases, the frequency distribution-based analysis maintained satisfactory AD identification performance. Our results suggest that AD and MCI identification using MVPA were overlearned for the test dataset (at least in a study with a small sample size), and a simpler index of functional connectivity distribution could yield a relatively robust identification index.
There is no doubt about the usability of MVPA in a database with abundant patients when HCs are available. For example, MVPA using the support vector machine indicated that network topology parameters (clustering coefficients, etc.) can classify AD patients and healthy elderly subjects with an accuracy of 63–93% (Li et al., 2013). In addition, multimodal approaches have been proposed. Dai et al. (2012) demonstrated that a combined model of gray matter volume and resting-state fMRI achieved an accuracy of 89%. Dyrba et al. (2015) also reported that a multikernel support vector machine using resting-state fMRI, diffusion tensor imaging, and gray matter volume showed excellent performance, with a classification accuracy of 82%. Challis et al. (2015) reported that a Bayesian Gaussian process logistic regression model, including age, MMSE, and the functional connectivity matrix, achieved 97% accuracy for distinguishing AD patients from amnestic MCI subjects, and the performance of this model was better compared with the support vector machine. Although such results are very promising, all these reports were based on just one site or one database. To the best of our knowledge, no previous study has examined MVPA performance for AD classification across multiple databases or sites. Similar to previous studies, MVPA for the DMN in this study demonstrated high performance for AD identification within the ADNI database. However, when we applied that model to our database, AD identification performance remained at a chance level. This suggests that the AD identification model in question was overlearned and confined to the ADNI database. Such decreased performance of identifications across databases has also been found for other diseases. In a multisite autism study using resting-state fMRI, some sites showed high accuracy (over 80%) in the leave-one-out cross-validation of classification, but lower accuracy (60–65%) in the leave-one-site-out cross-validation (Chen et al., 2016). Considering this evidence, MVPA might be useful only when a given site can prepare its own dataset.
One of our ultimate goals was to establish a robust index for AD identification useful across multiple databases. Regarding this, MVPA might be an inadequate candidate due to the small size of available data pool. We proposed a simpler index based on the frequency distribution of functional connectivity as a candidate. We focused on the MTL, including the hippocampus. Many resting-state fMRI studies report altered functional connectivity of the MTL (Joo et al., 2016; Krajcovicova et al., 2014; Sheline and Raichle, 2013). We replicated the finding of altered functional connectivity of the MTL in the direct comparison of the DMN using CICA in both databases, which means that the MTL connectivity can provide important information to classify AD patients and healthy elderly subjects. Using the normalized functional connectivity of the MTL, the means of lower ranked voxels in the distribution were calculated. We found that the means of functional connectivity were lower for AD patients than healthy elderly subjects, in both datasets. ROC analysis revealed that the mean connectivity can distinguish AD patients and healthy elderly subjects with good performance for both database. AD identification for the SHIMANE database maintained moderately accurate, despite initial development using a different database, which means that the frequency distribution-based analysis for functional connectivity of the MTL could be a good tool in actual clinical settings.
With regard to MCI, we found that MVPA succeeded in identifying ADNI data (accuracy: 90.4%). Such high accuracy over 90% within a dataset has been reported in some rsfMRI studies, including those using an ROI-based approach (Article et al., 2014; Suk et al., 2015), multiresting networks detected by ICA (Jiang et al., 2014), and a graph theory approach (Khazaee et al., 2017). Our results suggest that if the identification is performed only within one dataset or one site, MCI can be identified by only DMN with high accuracy. However, both MVPA and our approach failed to discriminate MCI from HC across datasets. This is because there were no common features of MCI in the two datasets, even in MTL. The absence of common features might result from the variety of MCI patients. MCI is considered a prodromal state of AD; however, the annual conversion rate to AD is about 7% (Mitchell and Shiri-Feshki, 2009). Some patients appear to improve cognitive performance over time. For example, 19.5% of MCI had recovered and an additional 61% neither improved nor deteriorated (Wolf et al., 1998). MCI may not be a homogenous condition, but may comprise several disease groups unified by the propensity to cause modest cognitive impairment. MCI patients in this study were of the amnestic type, but more detailed MCI selection based on amyloid β and/or tau might contribute to improvement in MCI discrimination performance.
RsfMRI might be useful not only in early detection of AD but also in differentiating between AD and other diseases, including dementia with Lewy bodies (DLB) and frontotemporal dementia (FTD). Several studies have reported that DLB patients showed decreased functional connectivity of DMN compared with AD (Franciotti et al., 2013; Galvin et al., 2011; Kenny et al., 2012; Lowther et al., 2014). In contrast, FTD seems to be correlated with disrupted salience network consisting of the anterior cingulate cortex and anterior insula (Seeley et al., 2007), which is affected by aging (Onoda et al., 2012). It is reported that FTD patients showed decreased functional connectivity of this salience network (Filippi et al., 2013; Zhou et al., 2010). In addition, Zhou et al. (2010) suggest that the combined index of DMN and salience network discriminated AD and FTD with 100% accuracy. Future studies will focus on examining the applicability of the frequency distribution analysis for FTD and DLB.
Conclusion
In sum, we demonstrated that a simple index of MTL functional connectivity based on frequency distribution could be a better MRI biomarker for AD classification across datasets or sites. Such an index might be broadly applicable to resting-state fMRIs obtained in different sites and under different measurement conditions.
Footnotes
Acknowledgments
This research was supported by the Impulsing Paradigm Change through disruptive Technologies (ImPACT) program in Japan. Data collection and sharing for this project were funded by the ADNI (National Institutes of Health Grant U01 AG024904) and DOD ADNI (Department of Defense award number W81XWH-12-2-0012). ADNI is funded by the National Institute on Aging, the National Institute of Biomedical Imaging and Bioengineering, and through generous contributions from the following: AbbVie; Alzheimer's Association; Alzheimer's Drug Discovery Foundation; Araclon Biotech; BioClinica, Inc.; Biogen; Bristol-Myers Squibb Company; CereSpir, Inc.; Eisai, Inc.; Elan Pharmaceuticals, Inc.; Eli Lilly and Company; EuroImmun; F. Hoffmann-La Roche Ltd and its affiliated company Genentech, Inc.; Fujirebio; GE Healthcare; IXICO Ltd.; Janssen Alzheimer Immunotherapy Research & Development, LLC.; Johnson & Johnson Pharmaceutical Research & Development, LLC.; Lumosity; Lundbeck; Merck & Co., Inc.; Meso Scale Diagnostics, LLC.; NeuroRx Research; Neurotrack Technologies; Novartis Pharmaceuticals Corporation; Pfizer, Inc.; Piramal Imaging; Servier; Takeda Pharmaceutical Company; and Transition Therapeutics. The Canadian Institutes of Health Research is providing funds to support ADNI clinical sites in Canada. Private sector contributions are facilitated by the Foundation for the National Institutes of Health (
Author Disclosure Statement
No competing financial interests exist.
References
Supplementary Material
Please find the following supplemental material available below.
For Open Access articles published under a Creative Commons License, all supplemental material carries the same license as the article it is associated with.
For non-Open Access articles published, all supplemental material carries a non-exclusive license, and permission requests for re-use of supplemental material or any part of supplemental material shall be sent directly to the copyright owner as specified in the copyright notice associated with the article.