
Abstract
It is well accepted that physiological noise (PN) obscures the detection of neural fluctuations in resting-state functional connectivity (rsFC) magnetic resonance imaging. However, a clear consensus for an optimal PN correction (PNC) methodology and how it can impact the rsFC signal characteristics is still lacking. In this study, we probe the impact of three PNC methods: RETROICOR: (Glover et al., 2000), ANATICOR: (Jo et al., 2010), and RVTMBPM: (Bianciardi et al., 2009). Using a reading network model, we systematically explore the effects of PNC optimization on sensitivity, specificity, and reproducibility of rsFC signals. In terms of specificity, ANATICOR was found to be effective in removing local white matter (WM) fluctuations and also resulted in aggressive removal of expected cortical-to-subcortical functional connections. The ability of RETROICOR to remove PN was equivalent to removal of simulated random PN such that it artificially inflated the connection strength, thereby decreasing sensitivity. RVTMBPM maintained specificity and sensitivity by balanced removal of vasodilatory PN and local WM nuisance edges. Another aspect of this work was exploring the effects of PNC on identifying reading group differences. Most PNC methods accounted for between-subject PN variability resulting in reduced intersession reproducibility. This effect facilitated the detection of the most consistent group differences. RVTMBPM was most effective in detecting significant group differences due to its inherent sensitivity to removing spatially structured and temporally repeating PN arising from dense vasculature. Finally, results suggest that combining all three PNC resulted in “overcorrection” by removing signal along with noise.
Introduction
R
Among several sources of noise, physiological noise (PN) from cardiac pulsations and respiratory cycles affects the reliable quantification of rsFC MRI signals (Bianciardi et al., 2009). For example, it has been shown that cardiac pulsations are directly observed in BOLD fMRI time series (Bhattacharyya and Lowe, 2004). These cardiac pulsations cause displacement of tissue adjacent to large arteries, as well as blood volume changes in precapillary vessels (Greitz, 1993), which results in fMRI signal changes due to partial volume effects rather than neuronal function. It has also been shown that effects from cardiac pulsatility are consistently found in areas proximal to arteries, veins, and the ventricles (Glover et al., 2000), and significant cardiac-related signal changes have been observed in 28% of brain voxels (Dagli et al., 1999).
The breathing cycle causes additional unwanted signals to occur in areas adjacent to cardiac artifacts (Windischberger et al., 2002). Local respiratory signal changes have been attributed to vasodilation from fluctuations in arterial carbon dioxide (CO2) (Panerai et al., 2000) occurring at a rate within the frequency band investigated in rsFC MRI (Wise et al., 2004). Global breathing cycle effects on BOLD images have been attributed to movement of the chest and associated magnetic field changes, as well as intrathoracic pressure changes, ventricular filling, cardiac output, and heart rate (Wowk et al., 1997). Thus, both cardiac and respiratory cycles have pronounced effects on the BOLD fMRI time course and should be removed from images to improve reproducibility and interpretability.
Several groups have developed methodologies to retrospectively address the influence of such PN on rsFC MRI (Bianciardi et al., 2009; Birn et al., 2006; Biswal et al., 1996; Chang and Glover, 2009; Chang et al., 2009; Glover and Lai, 1998; Glover et al., 2000; Hu and Kim, 1994; Hu et al., 1995; Jo et al., 2010; Shmueli et al., 2007; Wowk et al., 1997), and have shown promising improvements in the interpretability of resting-state BOLD data. In particular, we study the effects of three different PN correction (PNC) methods (and their combination) on the rsFC MRI signal: RETROICOR, ANATICOR, and RVTMBPM. RETROICOR has been shown to account for distal pulsatile vessel PN by removing respiratory and cardiac waveforms time-locked with the rsFC MRI signal (Glover et al., 2000). ANATICOR has the potential to remove white matter (WM) BOLD fluctuations by fitting local WM waveforms to the rsFC time course, and removing these WM fitted contributions (Jo et al., 2010). RVTMBPM is thought to account for low-frequency vasodilatory BOLD-like fluctuations by accounting for changes in the respiratory and cardiac cycles during the rsFC MRI scan (Bianciardi et al., 2009). Although these PNC methodologies have shown promise in removing PN from rsFC MRI, there is still no consensus for their effectiveness in terms of temporal signal-to-noise ratio (tSNR), sensitivity, specificity, and reproducibility.
In this study, we explore the methodological impact of how different PNC methodologies affect rsFC signal quality, sensitivity, specificity, and reproducibility, and show their impact on connectivity laterality and group differences. How the various PNC methodologies affect identified group differences in rsFC has not been previously explored, and will provide a sense of detection impact of PNC. The relevant question is: Can PNC corrected rsFC MRI methods help better identify and distinguish two different groups of interest in our sample (typical and struggling readers)? In summary, this study's primary focus is to evaluate the effectiveness of various model-based PNC approaches in improving the estimation of rsFC MRI metrics (cross-correlation), and then to evaluate such correction's ability to identify the targeted “reading network” (the signal), even in those reading disabled subjects who frequently show atypical networks.
Materials and Methods
General procedures
Sixteen adults from low socioeconomic backgrounds (age 39 ± 13, 6 male, 10 female) were recruited from the Adult Literacy Research Center (
The study protocol involved three separate sessions. In the first, behavioral testing was administered, including the Woodcock Johnson III (WJ3) to assess reading. The other two sessions involved MRI scans and were scheduled 2–4 weeks apart to assess intersession reproducibility of rsFC MRI measures. Within this cohort we could identify two subgroups based on reading skill levels: eight typical (age = 35 ± 12, 2 male, 6 female) and eight struggling (age = 44 ± 13, 4 male, 4 female) readers. The two subgroups were identified based on their WJ3 Basic Standard Scores that fell within the typical or average reader range (WJ3 Basic Standard Score ≥90), or those that fell in the below average or struggling reader range (WJ3 Basic Standard Score ≤85). This latter group's reading abilities were all below the 15%ile compared to the age peer norms.
MRI acquisition
MRI scans were acquired on a Siemens 3T Tim Trio MRI scanner (Erlangen, Germany) using the body coil for radio frequency (RF) transmission and a 12-channel phased-array head coil for RF receiving. The subjects were instructed to keep their eyes open and blink at a normal rate, not to fall asleep, to remain motionless, and to remain calm and relaxed while gazing at a white fixation cross on a black background.
The rsFC MRI time course was acquired with a single-shot gradient recalled echo planar imaging (EPI) sequence (FoV = 220 × 220 mm2, matrix = 64 × 64, 32 slices, slice thickness = 4 mm, TR = 2000 msec, TE = 30 msec, FA = 77°, 147 measurements + 3 discards). A high-resolution T1-weighted anatomical image for spatial normalization to MNI template space was acquired with MPRAGE sequence (TR = 2250 msec, TE = 4.18 msec, TI = 900 msec, FA = 9°, isotropic resolution = 1 × 1 × mm3). A B0 field map was acquired with a dual-echo gradient recalled echo sequence to estimate the amount of EPI distortions in the rsFC MRI images (TR = 488 msec, TE1 = 4.92 msec, TE2 = 7.38 msec, FA=60°).The subject's heart rate signals were acquired using a pulse oximeter placed on the subject's left index finger, and the respiratory cycles were captured with a pneumatic respiratory belt placed around the chest. Both types of physiological data were automatically time synced with the rsFC MRI scan.
Physiological data preprocessing
The physiological data were processed in MATLAB (MathWorks, Inc., Natick, MA) to extract low-frequency vasodilatory BOLD-like fluctuations via respiratory volume per time (RVT) and mean beats per minute (MBPM) (Bianciardi et al., 2009; Birn et al., 2006). The RVT time course was shifted by −24 to 20 sec in steps of 4 sec (2 TRs), and the MBPM was shifted by −12 to 12 sec in steps of 4 sec (Bianciardi et al., 2009) to account for lag effects (Shmueli et al., 2007) of vasodilatory BOLD-like fluctuations.
Image preprocessing
The MRI images were processed systematically with a combination of AFNI, FSL, and ITK Snap software packages, and MATLAB in-house scripts. The B0 field map was used to calculate the calibrated field map in rad/sec based on the measured phase evolution between the two echoes. The rsFC MRI time course was processed by first applying RETROICOR (Glover et al., 2000) to remove time-locked cardiac and respiratory effects in the images, followed by corrections for slice-timing, global head motion, and EPI distortions using the processed B0 field map. Spatial normalization to MNI template space was performed in conjunction with the MPRAGE using nonlinear transforms. From the motion parameters captured during the global head motion correction, frame-to-frame displacement was computed (Power et al., 2014), and time points from the rsFC time series were censored at a threshold of 0.3 mm.
After spatial normalization, additional PNC was applied to the rsFC time course by detrending the shifted RVT and MBPM vectors together in one nuisance regression as described in Bianciardi et al. (2009) for a combined RVTMBPM correction step. We chose to perform RVTMBPM correction in MNI space because this is the space of final interpretation of the results, and (unlike RETROICOR) the technique is less sensitive to signal interpolation due to the use of multiple lags. The final PNC step involved regressing local WM signals using ANATICOR (Jo et al., 2010), and was used to account for any additional sources of variability not included in the RETROICOR or RVTMBPM processing steps.
To reduce influence from cerebrospinal fluid pulsatility and resulting partial volume effects near the edge of the ventricles, we masked the ventricles in the rsFC MRI time course. The rsFC MRI time course was then low-pass filtered using a Chebyshev II filter with cutoff frequency of 0.1 Hz (Krishnamurthy et al., 2015), and smoothed with a 6 mm full-width-half-maximum Gaussian filter. We intentionally did not carry out global signal regression (GSR) as GSR does not substitute for PNC (Birn et al., 2014), and artifactually centers the cross correlation (CC) distribution, resulting in more anticorrelations (Murphy et al., 2009).
PNC methods
To assess the influence from different PNC techniques and determine which combination of methodologies would result in the highest data sensitivity and specificity, we preprocessed the images in seven different ways: (1) RETROICOR only (2) RVTMBPM only (3) ANATICOR only (4) RETROICOR+RVTMBPM (5) RETROICOR+ANATICOR (6) RVTMBPM+ANATICOR (7) RETROICOR+RVTMBPM+ANATICOR (most stringent PNC)
In the Preprocessing section above, we described the RETROICOR+RVTMBPM+ANATICOR analysis for generality. The other methods do not differ from the described processing pipeline order, other than that the “missing” PNC techniques are omitted. For example, the ANATICOR-only processing pipeline would start with slice-timing correction, and the ANATICOR processing step would occur immediately after spatial normalization to MNI space.
Seed-based rsFC analysis
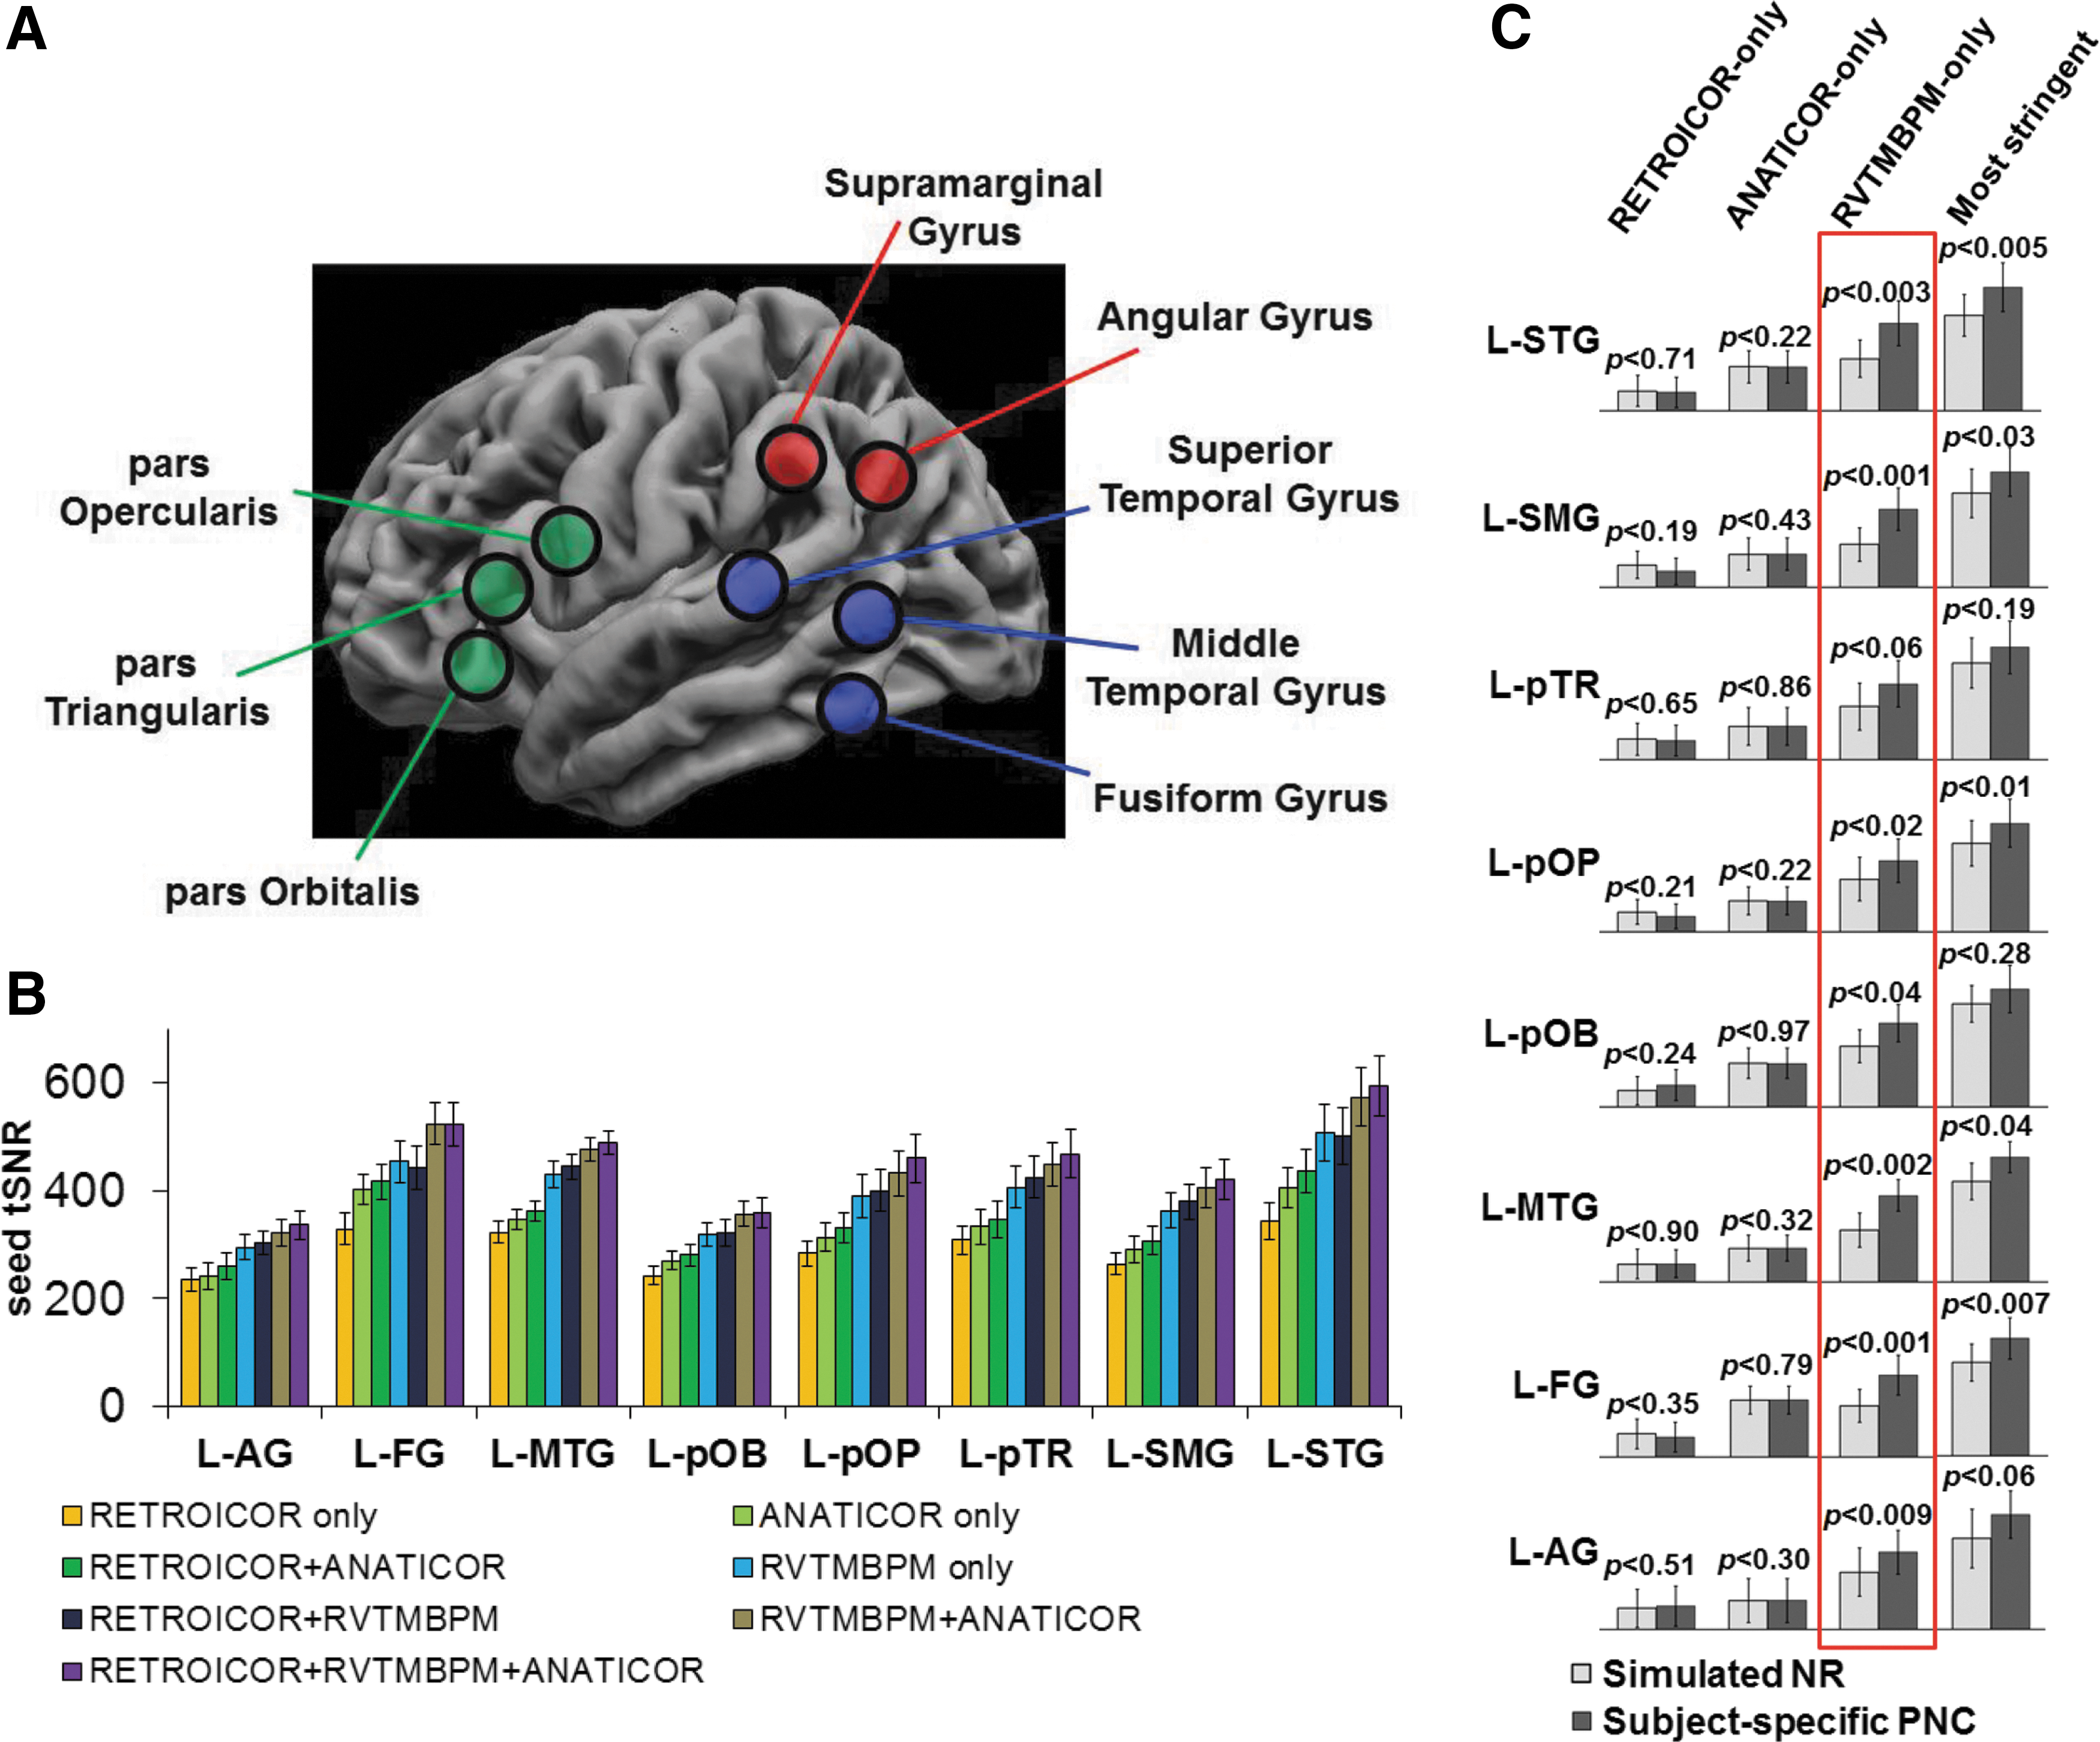
We chose the seeds (Fig. 1A, Supplementary Table S1; Supplementary Data are available online at
Quantifying tSNR, sensitivity, specificity, and reproducibility to define the optimal methodology
To understand the effects of the seven PNC methods on the fMRI time course, we evaluated the tSNR of the LH seed time courses (Equation-1) defined as the ratio of the mean signal of the rsFC seed time series (S) and the standard deviation of the seed time series (σN) (Welvaert and Rosseel, 2013).
We then systematically investigated the effects of the PNC methodologies by comparing the removal of subject-specific PN versus simulated noise regressors (NR) unrelated to the data. The NR vectors were generated from eight additional subjects that were initially scanned with the same protocol, but are not included in the present cohort of interest due to the lack of their replication scan. A detailed description of the NR construction can be found in the Seed Locations section in Supplementary Materials and Methods.
To determine the amount of variance in the signal accounted for by each PNC methodology across the entire brain, we evaluated the R2, as given in Equation-2 (Birn et al., 2014):
where R2 is the fractional reduction in signal variance, σPNC 2 is the variance in the PNC methodology time course, and σNoCorrection 2 is the variance in the time course that did not undergo PNC.
To understand the effects of the PNC methods on connection sensitivity, we chose to inspect the connection strength between left superior temporal gyrus (L-STG) seed and the following regions: right superior temporal gyrus (R-STG) (an expected connection), brain stem (BS; a region of minimal connection), and left anterior later ventricle (L-Vent; a region of no connection). The use of connectivity to areas weakly or unconnected to the seed region has been used previously to evaluate different preprocessing choices (Weissenbacher et al. 2009), and can be conceptually related to control comparisons. To inspect the connectivity with the ventricle, the connectivity profile was reprocessed on the unmasked data set for this analysis only. We also modeled the influence of tSNR on Z(CC), as described in the Supplementary Materials and Methods section.
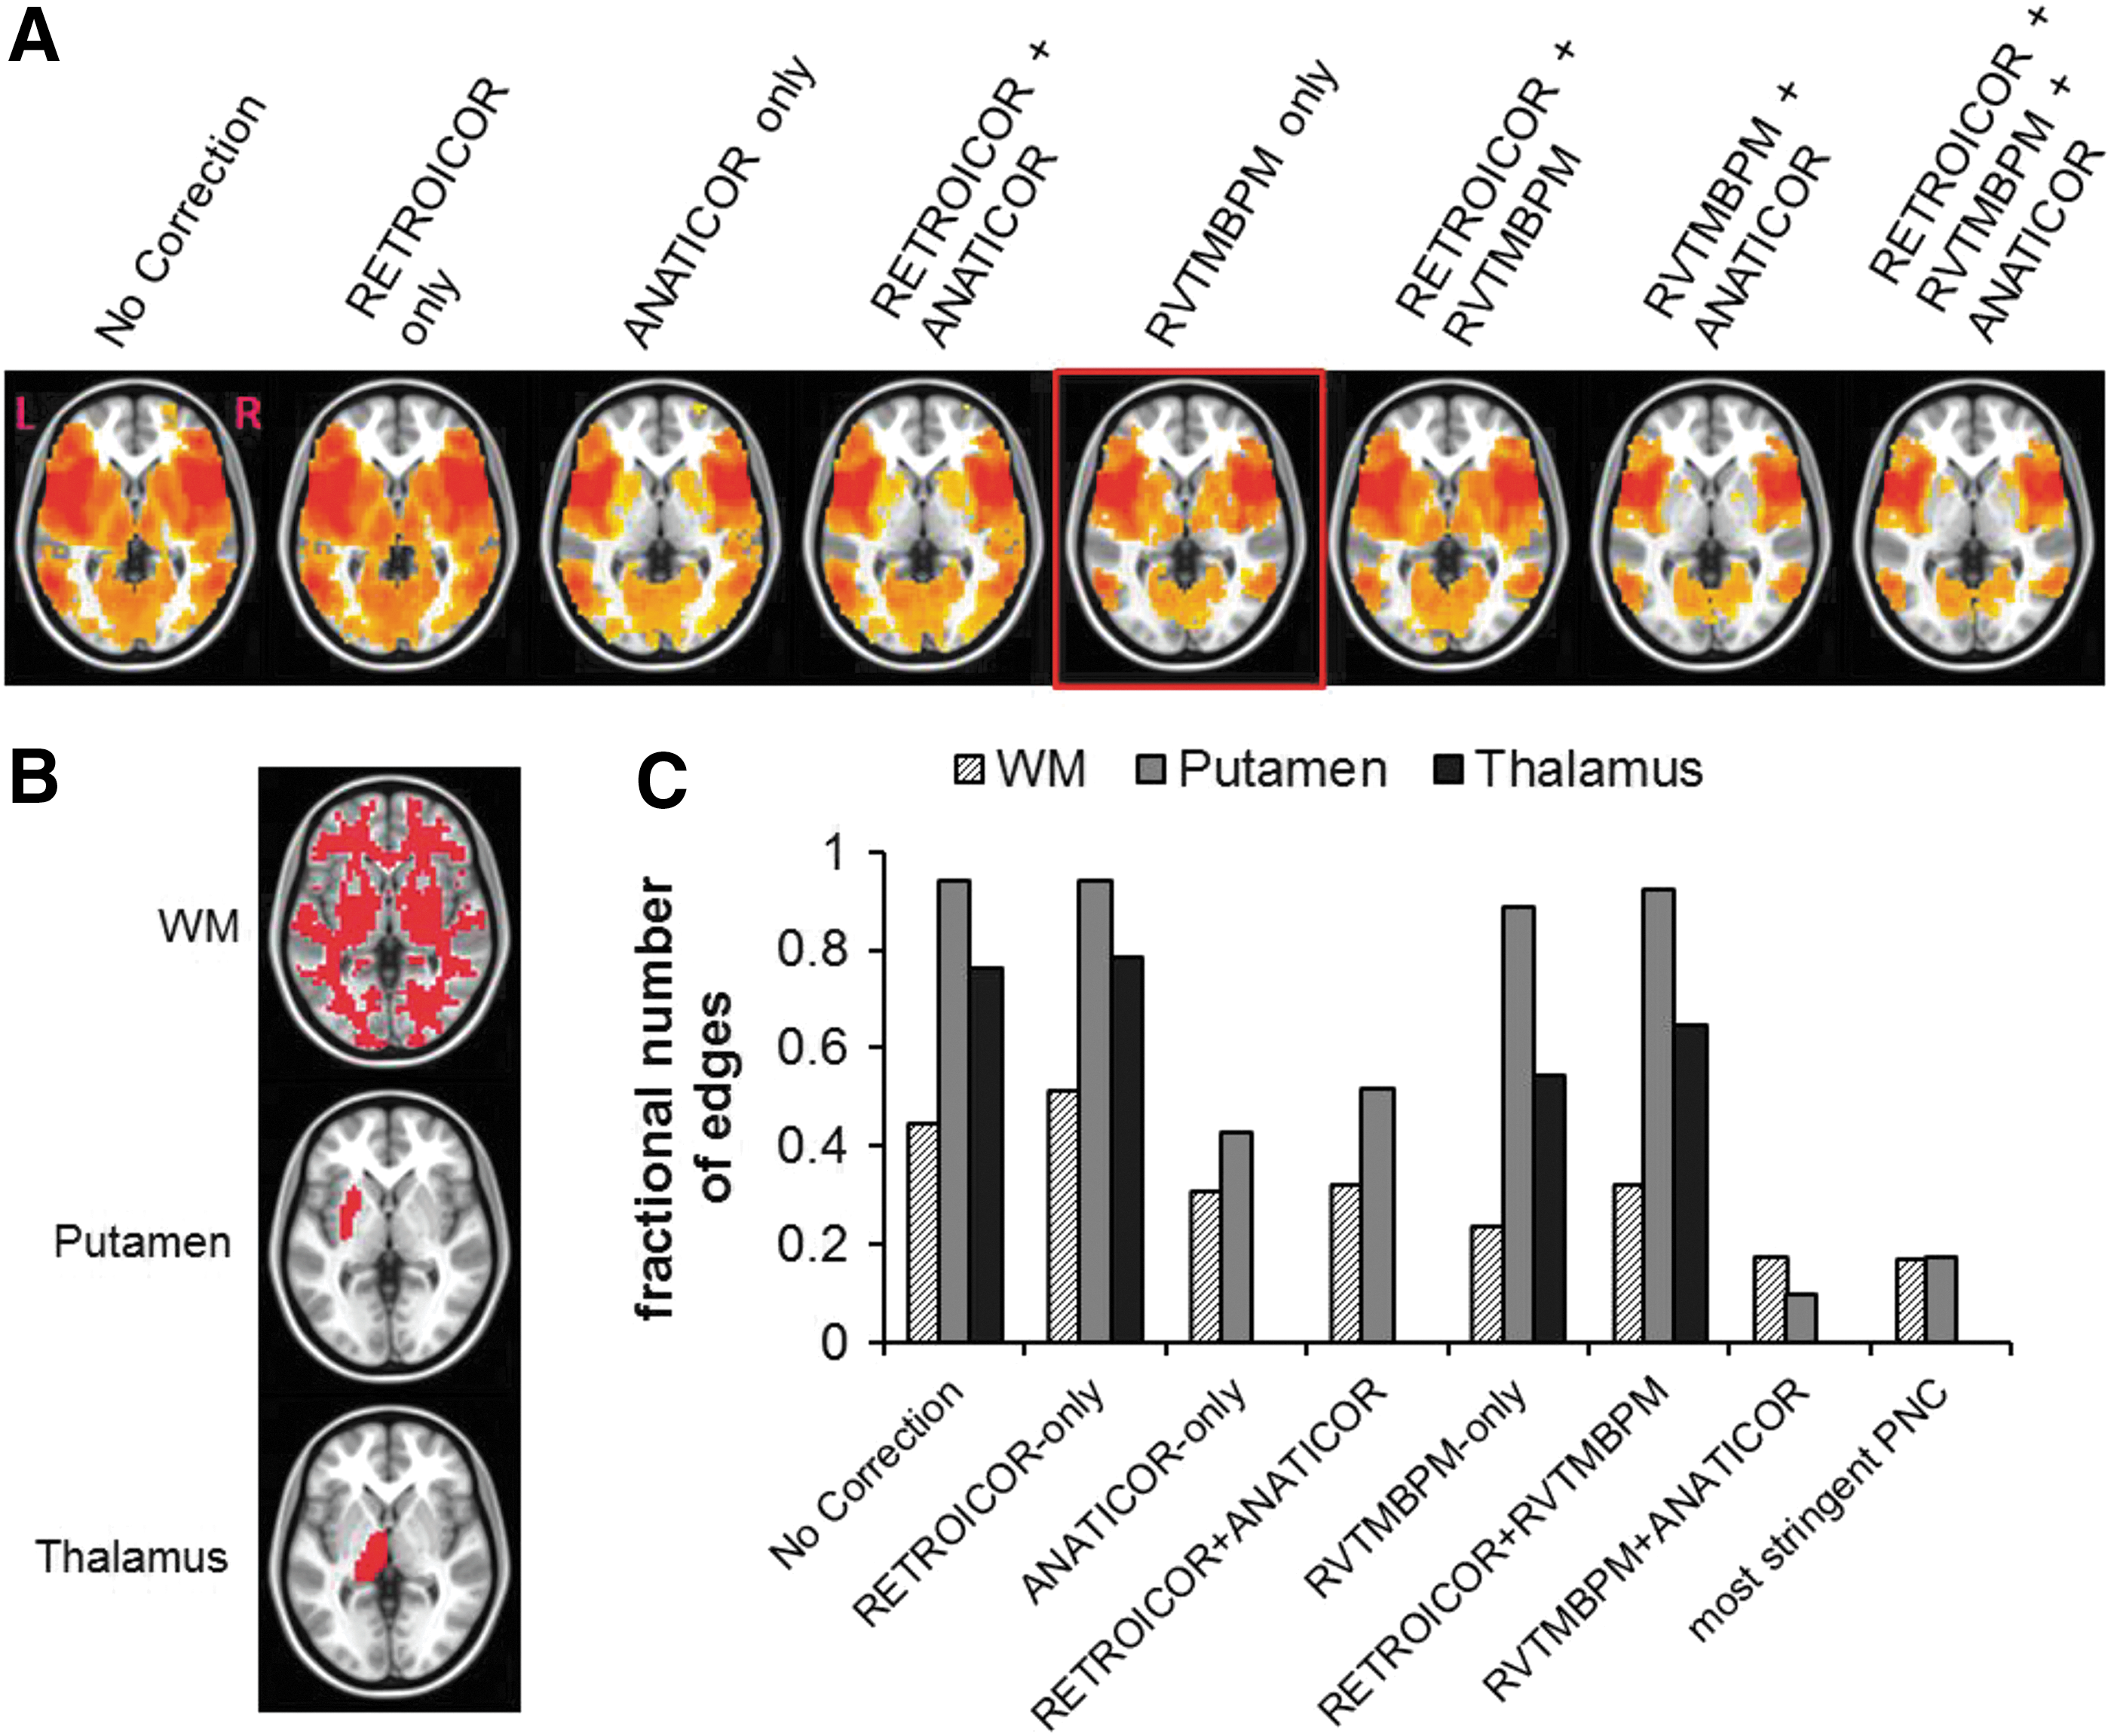
To assess the effects of PNC on the specificity of the network, we evaluated the number of significant edges (p < 0.001, cluster size = 40, family wise error [FWE] corrected) connected to WM when seeded from pOP, as well as the number of significant edges connected to regions with known structural connectivity [pOP-to-putamen and pOP-to-thalamus (Ford et al. 2013)]. The number of WM nuisance edges represents false-positive connections, whereas expected gray matter (GM) edges to putamen and thalamus represent true-positive connections. Note that the above steps were carried out on significant group maps generated from repeated ANOVA. To quantitatively determine the number of nuisance WM edges and expected GM edges, we apply the regions of interest (ROIs) in Figure 4B to each PNC method. “Improved” sensitivity is denoted by minimizing the number of WM edges, and maximizing the number of functional cortico-striatal and cortico-thalamic connections. The results are represented as a fractional number of edges for each PNC method as well as No Correction.
To investigate the reproducibility of connection strength for the seed regions significantly connected to each seed, we computed the intersession ICC(3,1) (Shrout and Fleiss, 1979) for each LH seed and each PNC method. We further explored the within-subject (MSw) and between-subject (MSb) variability for each PNC methodology within the thresholded network (p < 0.001, clust = 40, FWE corrected) when seeded from L-STG.
Group-level analysis
Connectivity laterality maps
It has previously been shown that rsFC has the sensitivity to detect hemispheric differences in connectivity profiles (Di et al., 2014; Doucet et al., 2015). The reading network for the entire cohort was assessed for both LH and RH seeds using repeated-measures ANOVA, and the R-L difference in connectivity profile was investigated for each PNC method in angular gyrus (AG) (p = 0.001, cluster = 20, FWE corrected).
Between group
Regions of significant group differences were determined using a repeated three-factor ANOVA on all seeds for each PNC method (level 1: typical and struggling reader group, level 2: LH and RH seed, level 3: random individual subjects). LH and RH group differences were determined by thresholding the resulting difference maps (p = 0.01, cluster size = 20, FWE corrected).
Within group
A within-group analysis used the optimal PNC method to establish a network of reproducible and highly connected brain regions for each subgroup. A mask of significantly connected regions was constructed for each rsFC session, and within the overlapping voxels, the voxel-wise ICC was computed and thresholded at >0.65 since this represents “good” reproducibility (Guo et al., 2012). For each subgroup, and each LH and RH seed, maps of highly reproducible and connected regions within the reading network were created.
Results
Effects of PNC on tSNR
The tSNR was quantified for each LH seed time course and plotted in order of increasing tSNR (Fig. 1B). All seed regions showed similar tSNR profiles. The lowest tSNR resulted from RETROICOR only and systematically increased across the PNC methods in order: ANATICOR only, RETROICOR + ANATICOR, RVTMBPM only, RETROICOR + RVTMBPM, RVTMBPM + ANATICOR, and RETROICOR + RVTMBPM + ANATICOR.
To determine if RETROICOR only, ANATICOR only, or RVTMBPM only accounted for unique, subject-specific variance, we compared the seed tSNR after removing simulated NRs to the subject-specific PNC (Fig. 1C). The tSNR for RETROICOR only and ANATICOR only was not different when accounting for the subject's specific physiology compared to NR. The RVTMBPM-only methodology showed significant (two-tailed paired t-test, p < 0.05) increases in tSNR when using the subject-specific physiology. When further assessing the most stringent PNC, the use of subject-specific PNC accounted for more variance than NR. However, the difference between tSNR from subject-specific and simulated NR had a smaller significant difference than RVTMBPM only.
Effects of PNC on R2
Since tSNR measures only the PNC effects on the seed, we further quantified the variance accounted for by each PNC method resulting in a whole-brain voxel-wise scale using Equation-2. The R2 for each subject-specific PNC method increases in the same order as the seed tSNR (Fig. 2). For the most stringent PNC, 60% of the fractional variance is accounted for. The application of subject-specific physiology and simulated NR leads to similar variance accounted for in both RETROICOR-only and ANATICOR-only methodologies. Alternatively, inspection of the RVTMBPM-only R2 maps indicates that subject-specific physiology accounts for more variance than simulated NR, which is in line with the tSNR results. Interestingly, the R2 of simulated NR using RETROICOR + RVTMBPM + ANATICOR is similar to NR of RVTMBPM only, indicating that the fractional explained variance did not improve beyond RVTMBPM only.
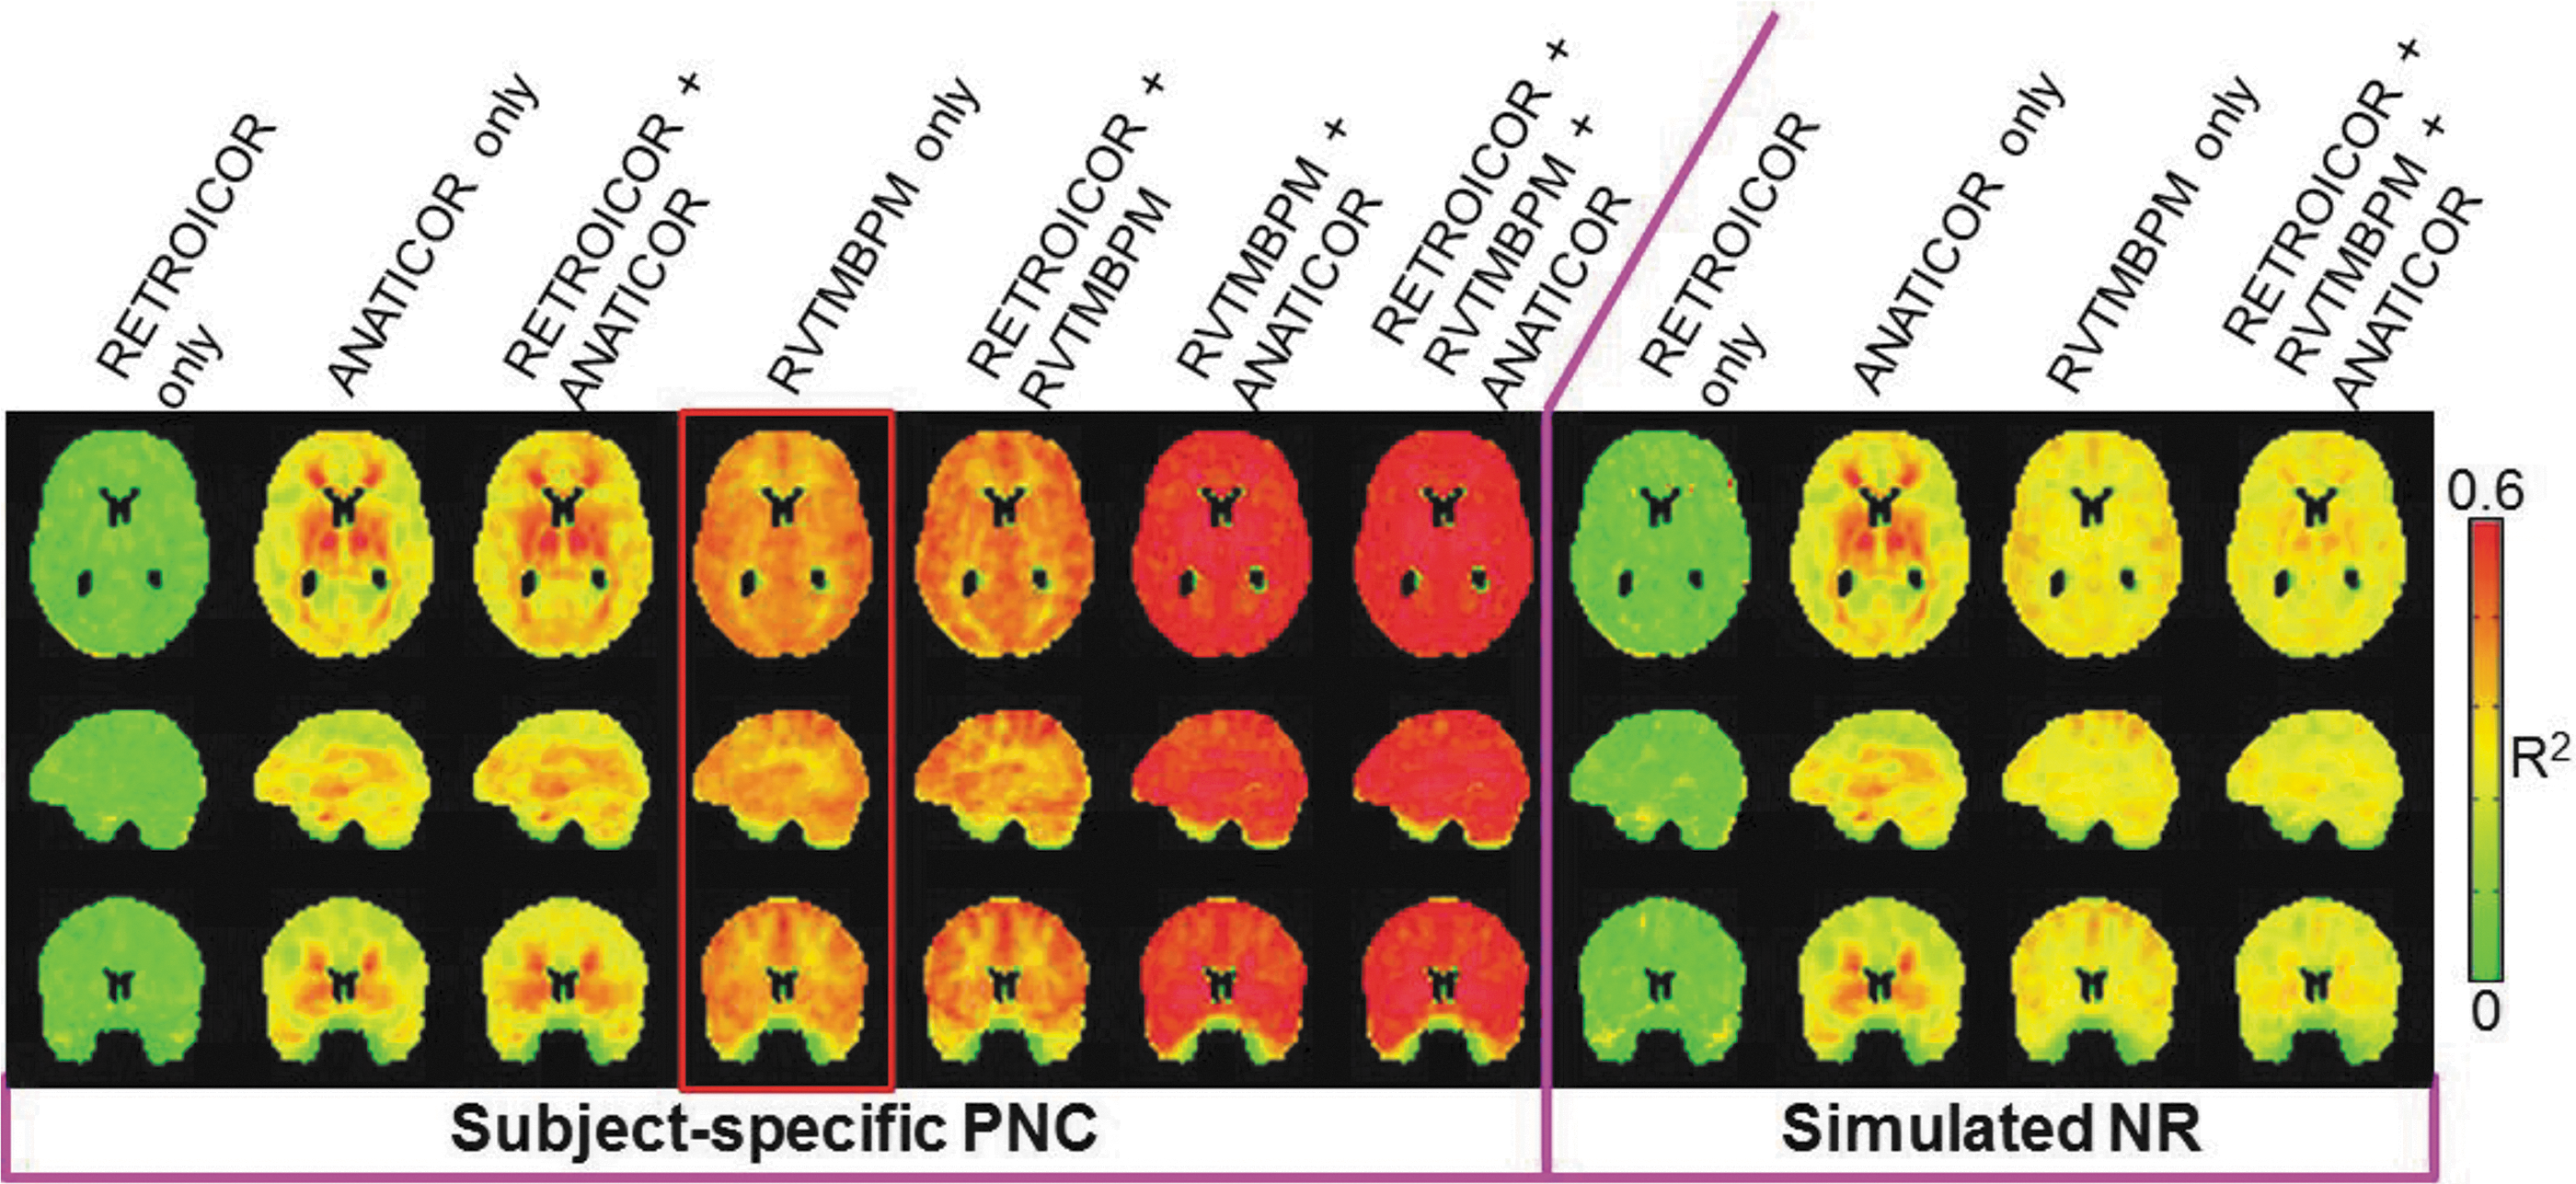
R2 maps in MNI space representing the amount of variance accounted for by each PNC methodology. Both subject-specific PN and simulated NR effects on R2 are displayed.
Effects of PNC on sensitivity to real connections
In Figure 3A, the L-STG to R-STG connections showed high connection strength with No Correction analysis, which reduced significantly with the application of most PNC, particularly RVTMBPM only (p < 0.00001). Reductions in Z(CC) with PNC are found for L-STG to BS, and L-STG to L-Vent for most methods, except for RETROICOR only. In Figure 3B, the No Correction and RVTMBPM-only L-STG to R-STG Z(CC) is significantly described by the nonlinear relationship with tSNR (A = 1.3344, B = −1.2260, C = −1.0992, D = 1.4449, full-model F = 231, p < 0.00001). The relationship between L-STG to BS (F = 20) and L-STG to L-Vent (F = 23) is also significantly described by the model. In line with Figure 3A, the modeling results in 3B show that the No Correction Z(CC) is higher than RVTMBPM only, which is, in part, due to the increased variance from PN causing the tSNR to remain low.
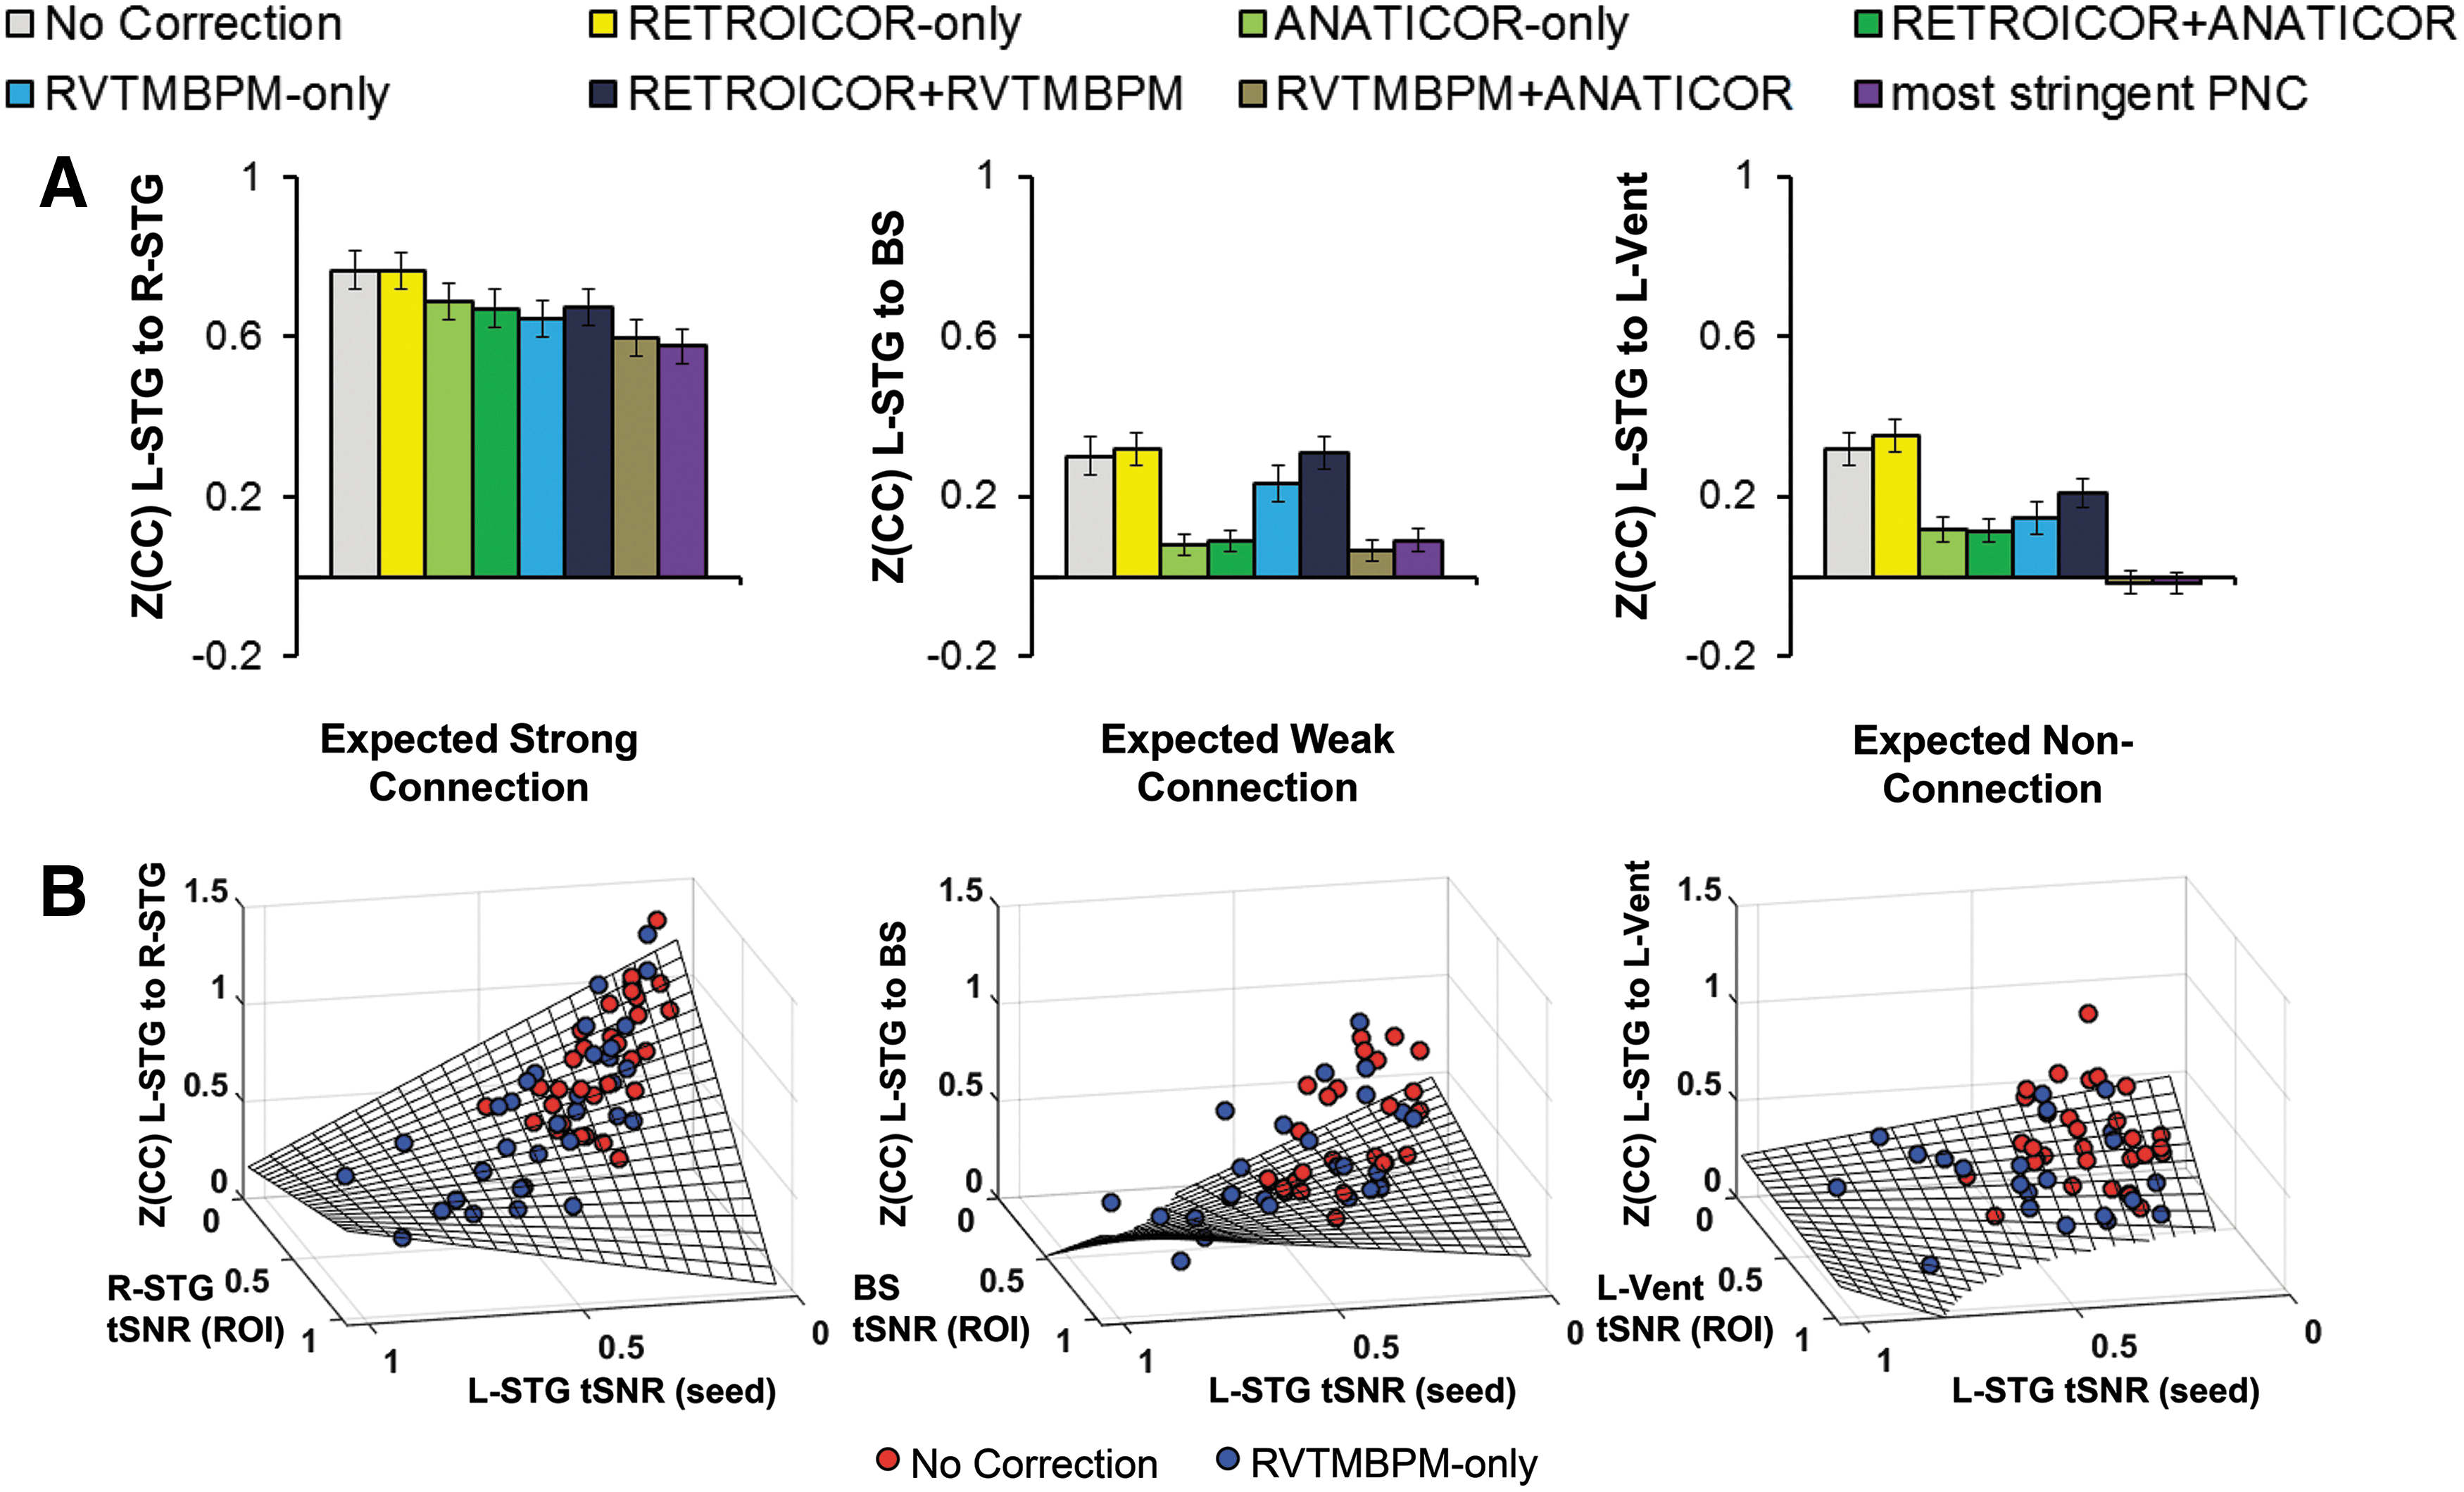
Effect of PNC methods on sensitivity to an expected strong connection (L-STG to R-STG), weak connection (L-STG to BS), and expected nonconnection (L-STG to L-Vent).
Effects of PNC on specificity of connections
We display a single slice of significantly connected regions seeded from L-pOP (Fig. 4A). The fractional number of WM edges is highest in RETROICOR only and lowest in the most stringent PNC. The fractional number of WM edges is lower in RVTMBPM only than ANATICOR only. When using ANATICOR by itself, or in combination with any methodology, the expected cortico-thalamic connection drops out. Thus, RVTMBPM only provides gray matter-to-white matter ratio increases of 34% (thalamus) and 78% (putamen) compared to No Correction.
Effects of PNC on reproducibility of connections
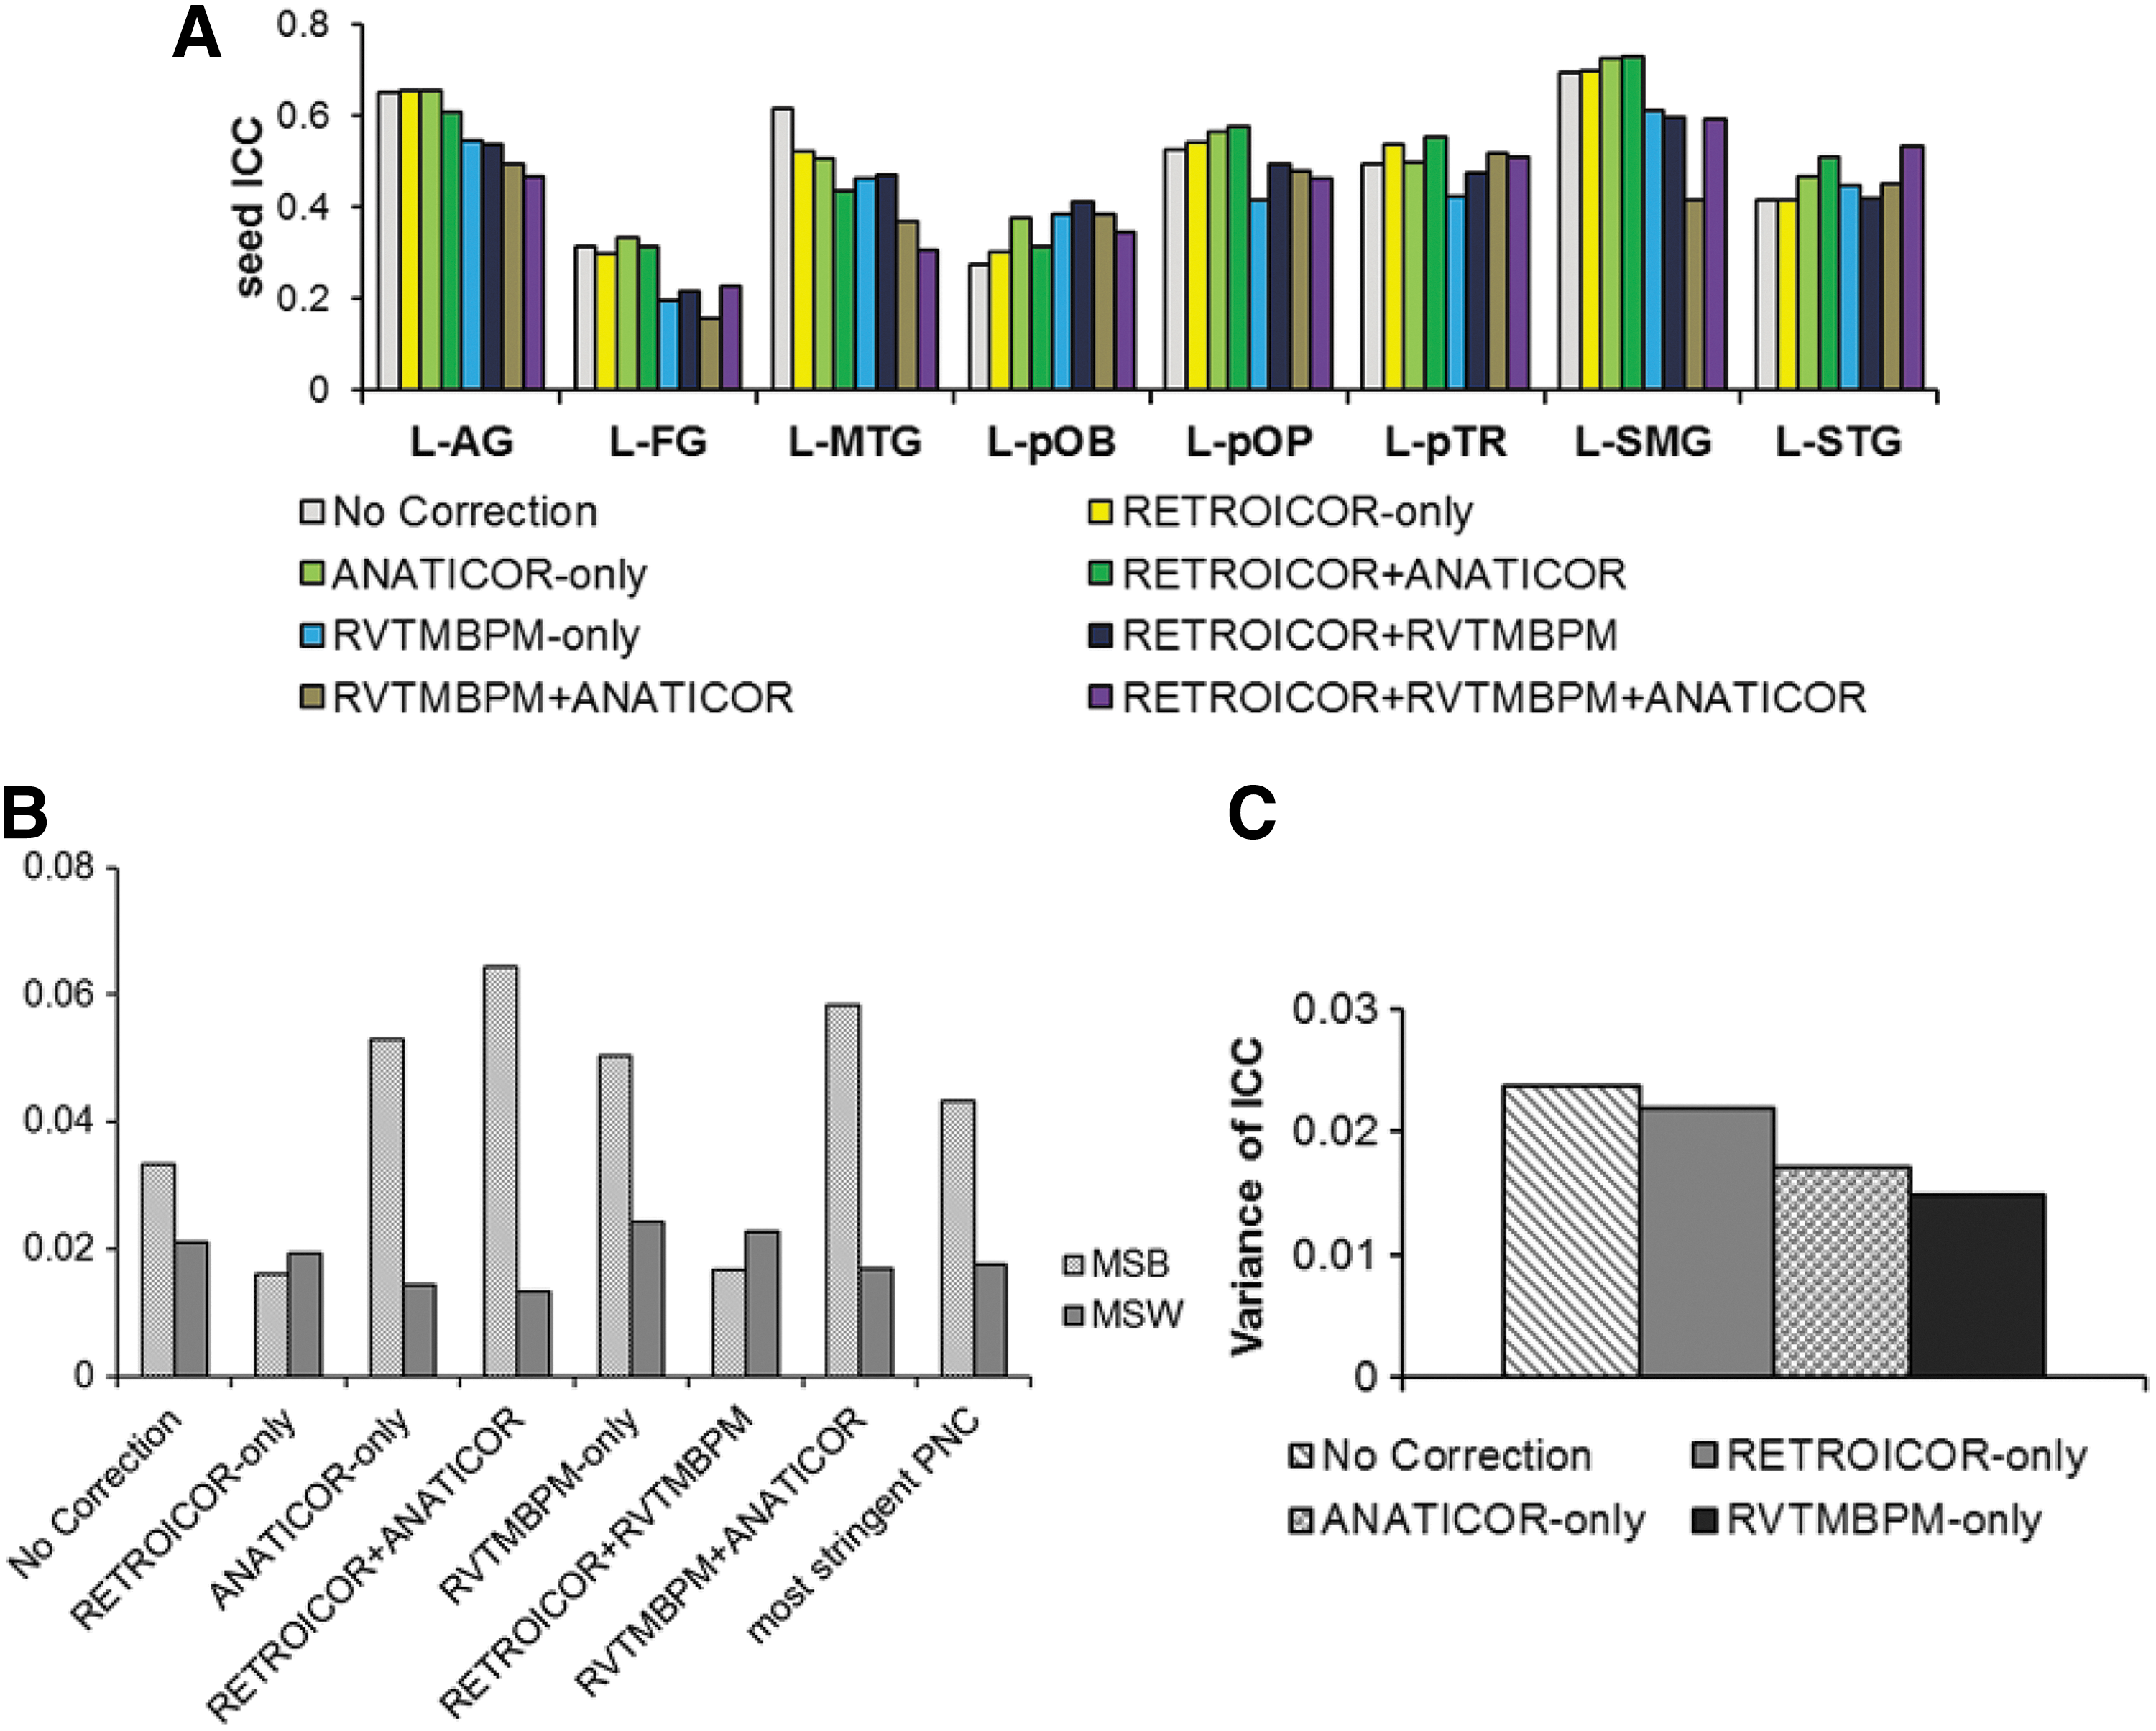
Figure 5 shows the effects of reproducibility on the seed (5A), and reading network seeded from L-STG (5B). As seen in Figure 5A, on average, ANATICOR only resulted in the highest seed ICC, and RVTMBPM + ANATICOR resulted in the lowest seed ICC. Figure 5B shows that MSb>MSw for most of the methodologies except RETROICOR only and RETROICOR + RVTMBPM. When considering the uncombined methodologies, the variance of ICC (Fig. 5C) across seed regions was highest for No Correction, followed, in order of reducing variance, by RETROICOR only, ANATICOR only, and RVTMBPM only.
Effects of PNC on connectivity laterality
The R-L difference maps for different PNC methods are shown in Figure 6. Seeding in AG, the LH dominant ventral path of the reading network is enhanced, whereas the RH has a greater connection to PCC and L-cerebellum. The laterality differences change slightly with the application of different PNC methodologies.

The R-L difference of Z(CC) maps (p < 0.01, cluster size = 20, FWE corrected) in MNI space for each PNC methodology. Note: Both L-AG and R-AG were used as the seeds; blue indicates that L-AG has higher connection strength, and red indicates that R-AG has higher connection strength. AG, angular gyrus.
Group differences
It is clear that the group differences vary with PNC methodology, with typical>struggling readers for most seeds (Fig. 7). Some methodologies (RETROICOR only and RETROICOR + RVTMBPM) flip these results across several temporal and frontal seed regions. Regardless of chosen methodology, the RH connectivity seems to be more impacted in struggling readers than LH connectivity.
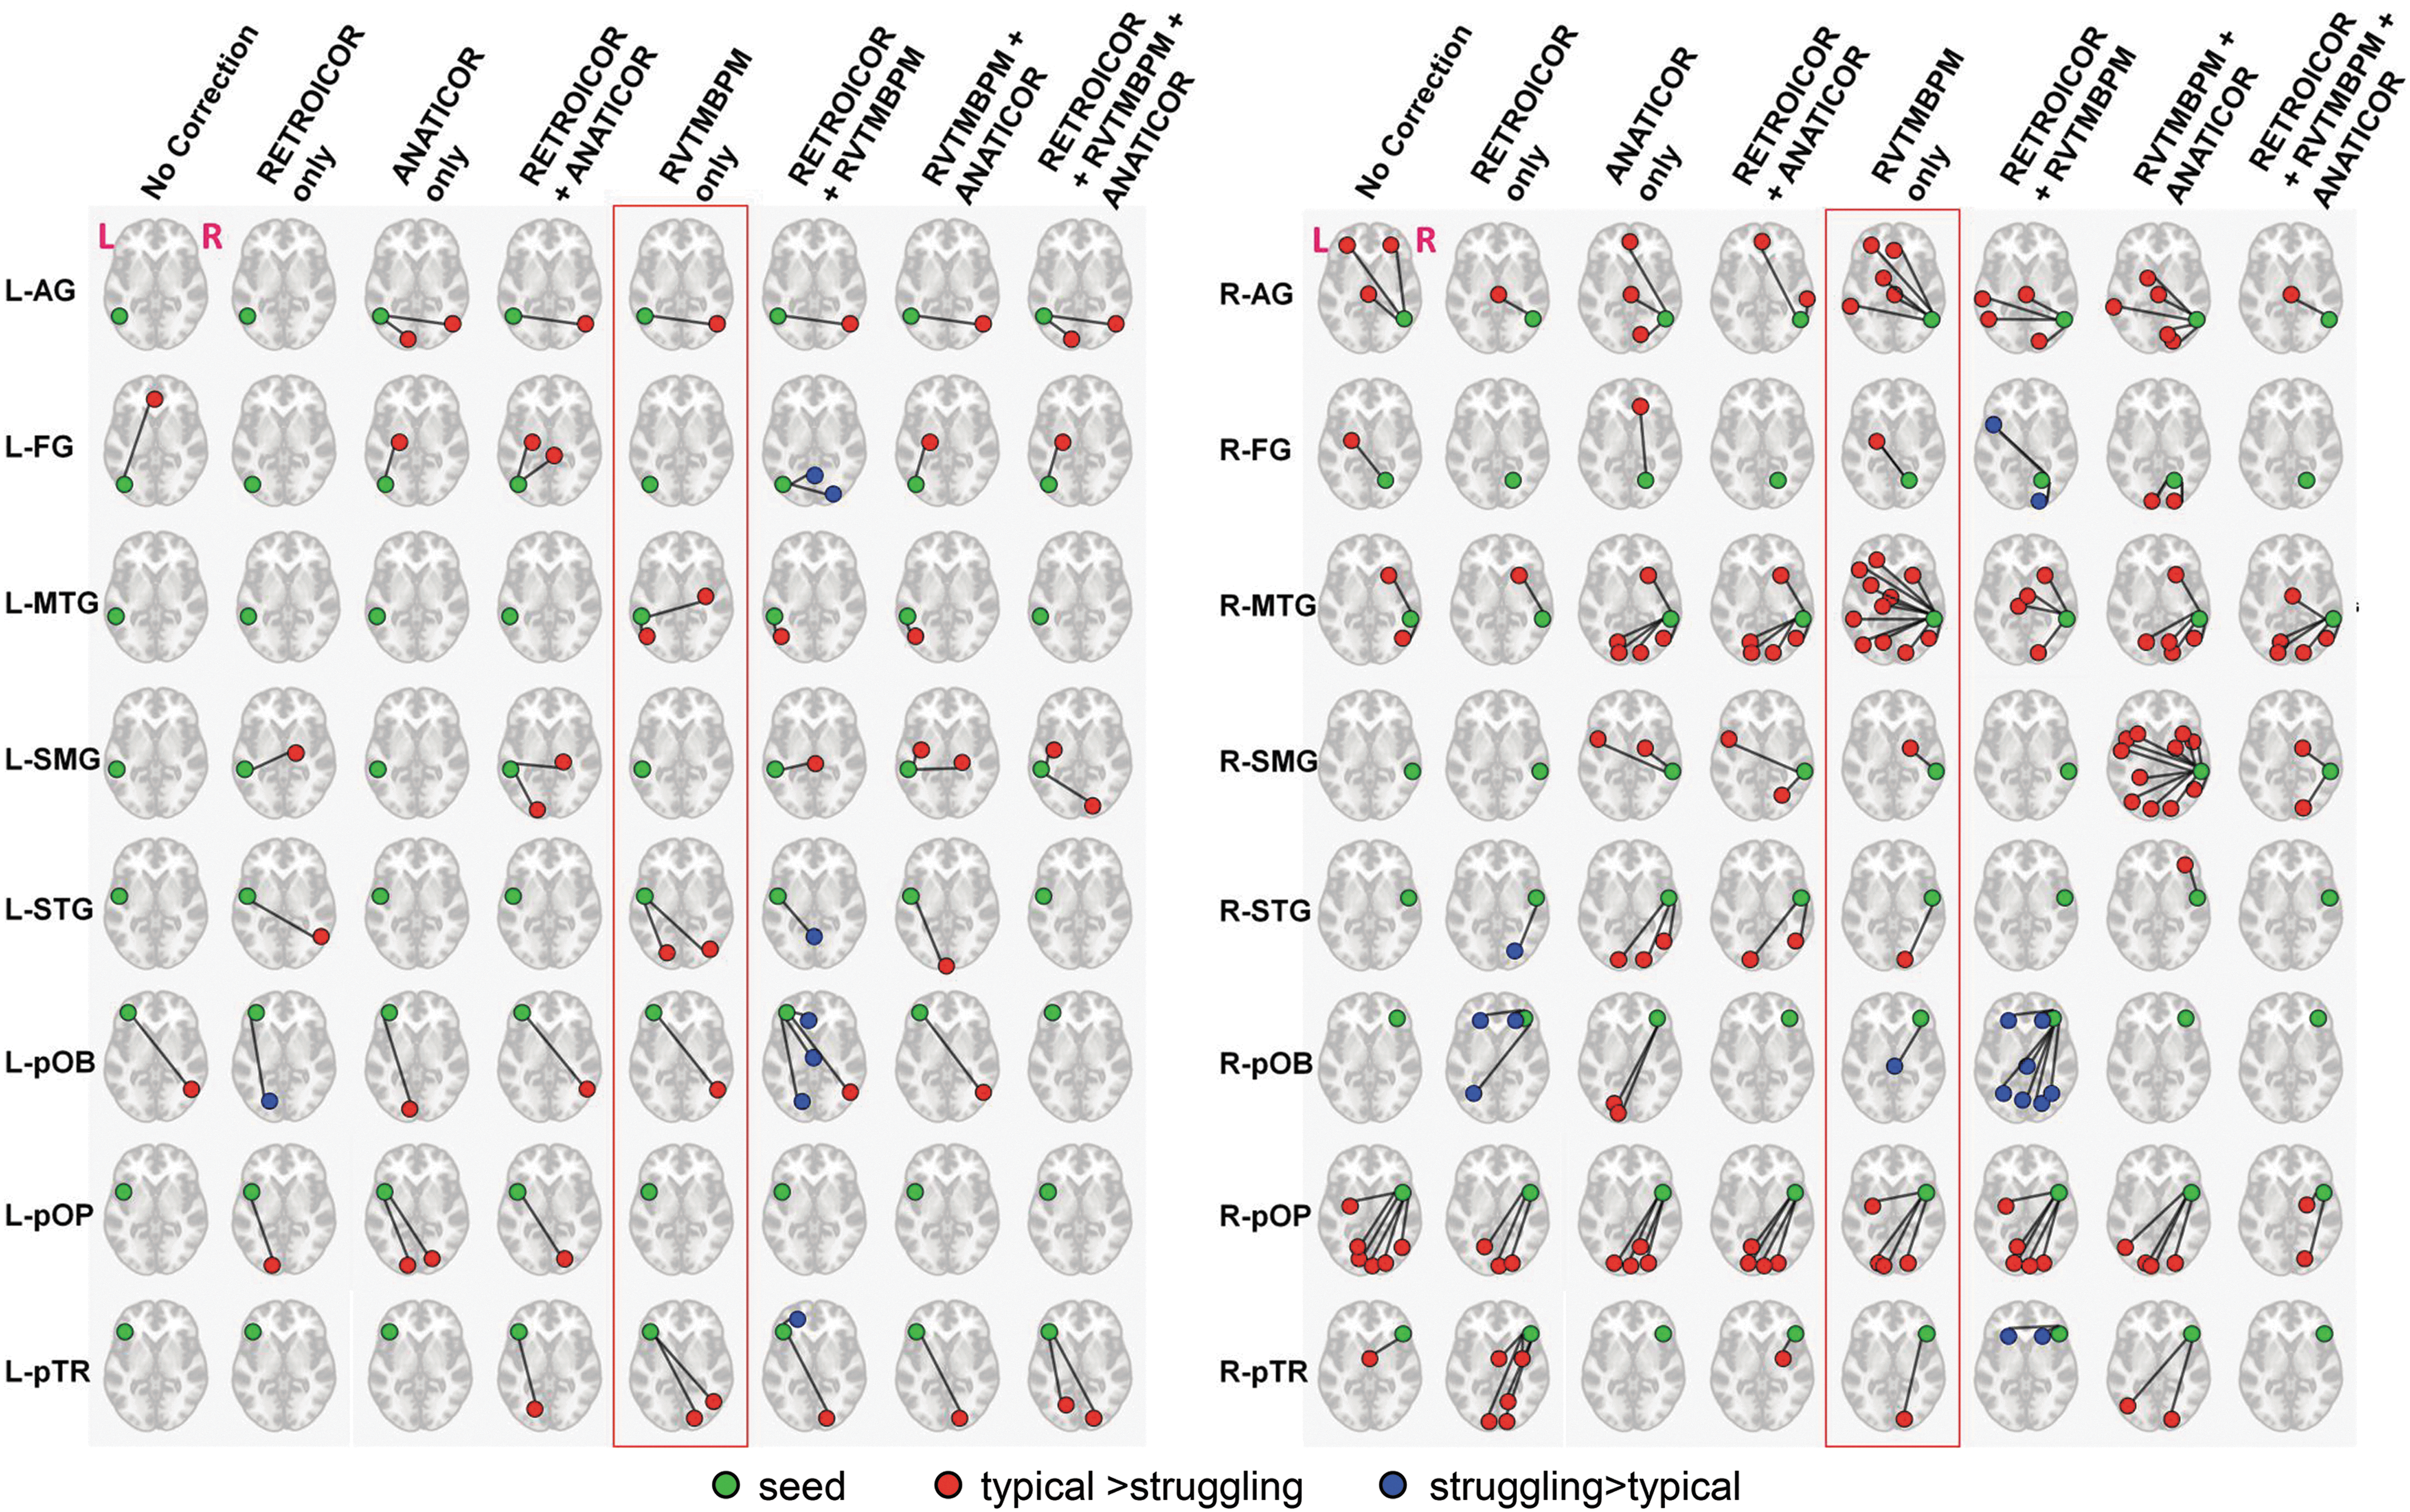
Repeatable group differences for different PNC methods across LH and RH seeds. Images in MNI space (p < 0.01, cluster size = 20, FWE corrected). The differences are displayed on axial midslice, as it covers both left and right reading areas. RH, right hemisphere
Reading network of typical and struggling readers
Using RVTMBPM only, the typical readers had more reproducible connections for both RH and LH seeds (Fig. 8), although there were some notable exceptions: L- and R-AG, L-pTR, and R-pOB had more reproducible connections for the struggling readers. The typical readers also had a higher number of interhemispheric connections than the struggling readers. Some seed regions in low signal to noise ratio (SNR) regions (open circles in Fig. 8) were not reproducible (e.g., pOB and pTR). Some areas of connectivity were shared among the typical and struggling readers (pink circles), but have differences in connectivity strength (as detailed by dotted lines, e.g., L-FG to R-FG). More details on the connections can be seen in Supplementary Tables S2 and S3.
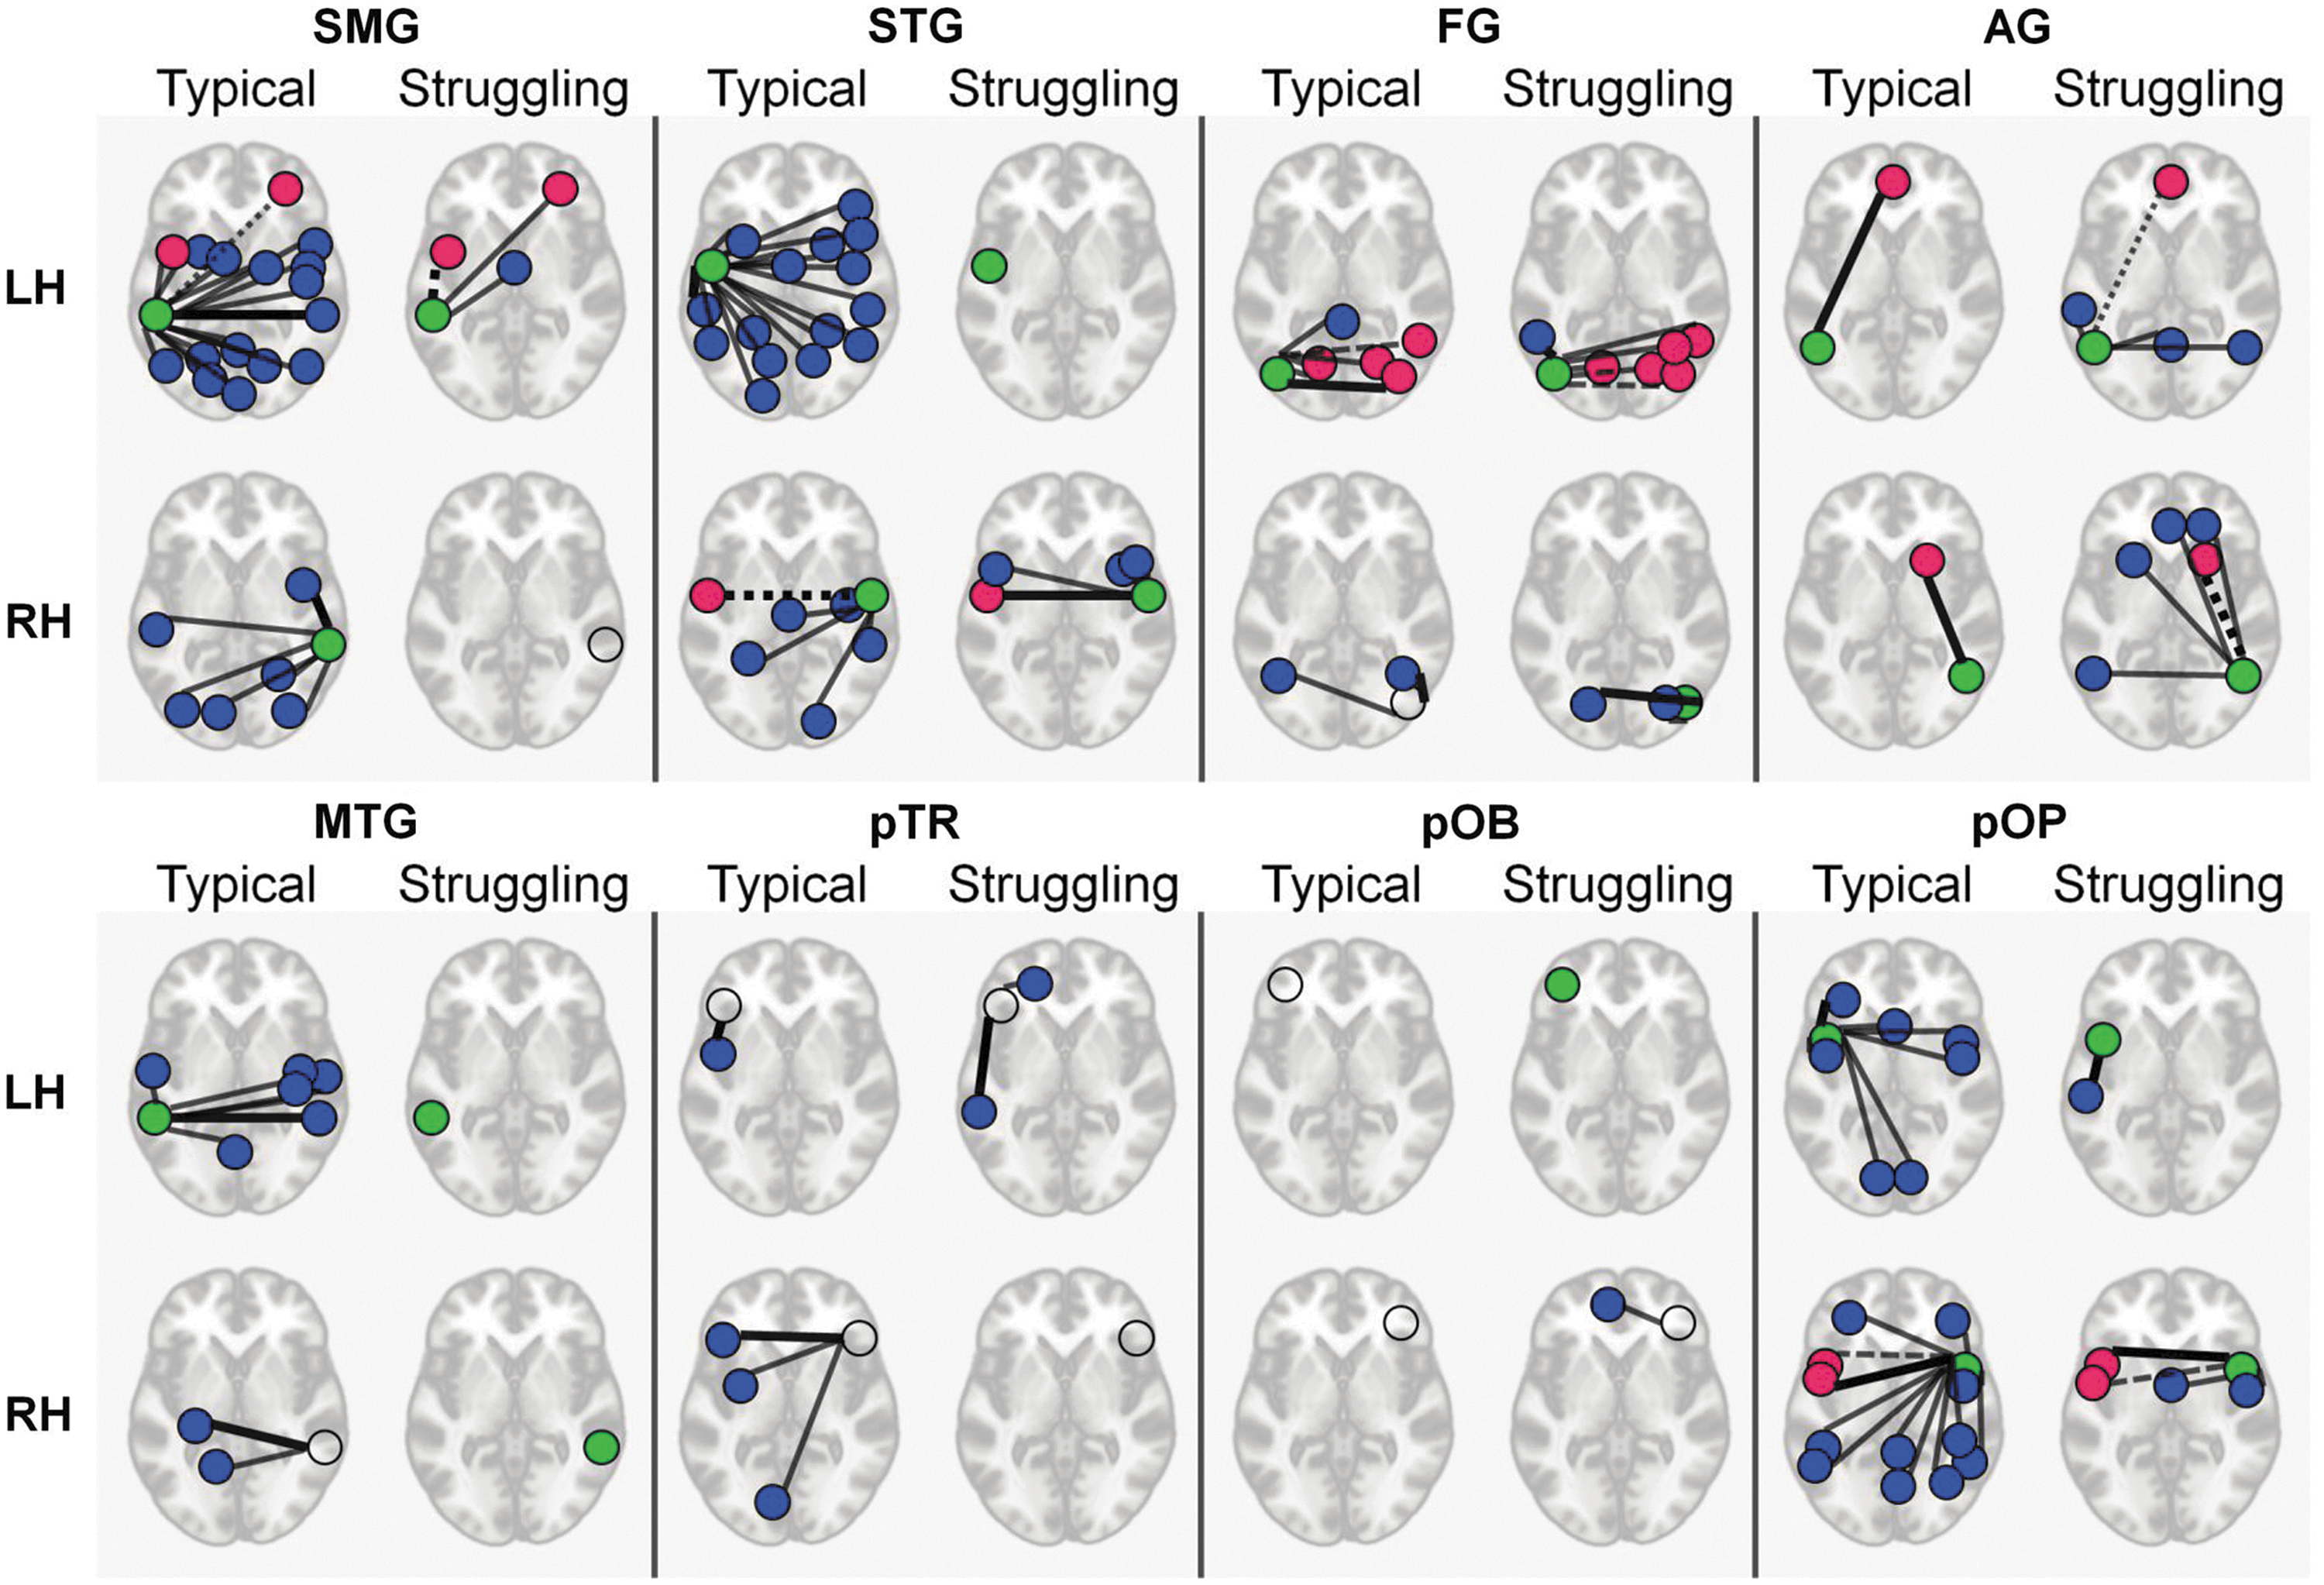
Reproducible connections found within sixteen seed regions of the reading network. If the seed was reproducible within the network, it is assigned a green circle; otherwise, it is displayed as an open circle. All other regions are highly reproducible. Regions that are shared across typical and struggling readers are indicated in pink; all other connected regions are in blue. All connections are indicated with a narrow black line, except for the strongest connection, which is indicated by a thick black line. The connected regions shared between typical and struggling readers are indicated as a dashed line when the connection is weaker.
Discussion
In this study, it was shown that systematic PNC during the preprocessing of rsFC MRI data significantly increases the tSNR (Fig. 1B). Using simulated NR, we explored the impact of removing subject-specific PN versus a regressor that was unrelated to the data. Surprisingly, the RETROICOR and ANATICOR methodologies did not show advantage compared to the subject-specific PN, such that the tSNR increase was a by-product of the signal processing step and did not necessarily reflect an “improvement” in the signal identification. RETROICOR accounts for PN influences from distant pulsatile blood vessels (Circle of Willis), and we modeled ANATICOR to account for local WM BOLD signal. From the R2 maps, it is evident that these methods had minimal effects on our data possibly because the chosen seed locations were relatively distant from both of these sources. Thus, the tSNR and R2 results suggest that RETROICOR and ANATICOR are equivalent to removing random noise. On the contrary, RVTMBPM showed significant improvement in tSNR and R2 when subject-specific physiological indices were utilized within the model, In effect, RVTMBPM appears to be removing structured and temporally repeating PN arising from the dense vasculature. The most stringent PNC methodology showed tSNR increases by utilizing subject-specific physiology compared with simulated noise (Fig. 1C), but these differences were not as significant as the RVTMBPM results (red box, Fig. 1C), suggesting that combining the RVTMBPM method with RETROICOR or ANATICOR can overcorrect the signal. It has previously been shown that adding too many NRs in such analyses can remove both structured noise and structured signal (Bright and Murphy, 2015). It should also be acknowledged that tSNR is limited in its ability to assess the quality of rsFC since variability in neural fluctuations contributes to the temporal standard deviation of the measured BOLD signal.
Improving the signal quality with PNC has direct effects on the sensitivity to connection strength. In Figure 3A, we probed the connection between L-STG and L-Vent, expecting zero connection since there are no neurons in the anterior horn of the lateral ventricle. The application of RETROICOR causes an increase in Z(CC) compared to No Correction, indicating that this processing step has reduced the sensitivity to true connection strength. Other PNC methodologies resulted in lower Z(CC) than No Correction, particularly the most stringent PNC removed all connections to the ventricles. This would be ideal, except that this comes at a loss of sensitivity to expected connections (as seen in the L-STG to R-STG). The BS is an expected weak connection, but methods that contain ANATICOR appear to be too aggressive in this area of mixed white and gray matter. Overall, RVTMBPM provides a conservative balance of sensitivity by maintaining expected strong and weak connections (including R-STG and BS), while minimizing expected nonconnections (L-Vent). Although utilized in the framework of PNC, the modeled nonlinear relationship between Z(CC) and tSNR (Fig. 3B) may be informative when optimizing rsFC MRI sequences to minimize the effects of PN.
To further understand the effects of PNC on rsFC signal, we quantified the specificity of the connected regions using the pOP seed (Fig. 4). The goal was to determine which PNC methodology provided the greatest number of expected gray matter edges (true positive), while minimizing the number of WM nuisance edges (false positives). There were three basic assumptions made in this analysis: (1) structural connections described in the literature (pOP-to-putamen and pOP-to-thalamus) exist across most subjects, (2) this structural connectivity gives rise to functional connectivity (Honey et al., 2009), and (3) WM metabolic activity does not fluctuate coherently with cortical activity. Since RETROICOR is modeled to correct for distal pulsatile vessel PN, our results suggest that it has difficulty removing WM nuisance edges. In this study, we modeled ANATICOR to account for WM BOLD fluctuations. Although it was effective in minimizing WM nuisance edges, it also resulted in reducing specificity to the expected cortico-thalamic functional connections (Fig. 4C). In effect, our implementation of ANATICOR after spatial normalization removed WM edges (false positives), but also appeared to remove expected GM connections (true positive), thereby reducing specificity. However, RVTMBPM optimally indexed specificity by minimizing WM edges and retaining expected GM connections. This appears to be related to the fact that WM tissue contains small vessels supporting the metabolic activity of axonal tracts, although not as dense as GM (Jochimsen et al., 2010). Thus, based on these results, RVTMBPM appears to be best in the removal of vasodilatory PN and local WM nuisance edges. It should be noted that these results are specific to the cortical/subcortical connections in the context of the reading model, and may differ for other models.
The concepts of sensitivity and specificity are both useful in accurately defining brain networks. Specificity helps in determining which GM edges should remain in the network (see Fig. 5A, which retains the expected GM cortico-thalamic connections by minimizing nuisance WM edges). Once specificity of the network is accomplished, the next question is how accurate is the strength of the detected GM edges? In this context, sensitivity helps because the results from Figure 3 show that PN can artificially inflate the strength of expected connections and expected nonconnections. Since there is no gold standard for determining the reading-specific neural network, we were unable to objectively quantify the balance between specificity and sensitivity. Such an endeavor should be undertaken in future studies.
From a clinical intervention perspective, the concept of signal reproducibility is very important. It is notable from Figure 5A that the ICC of No Correction is high, in some instances higher than all PNC methodologies. However, based on the sensitivity (Fig. 3) and specificity (Fig. 4) results, we know that the No Correction data contain significant amounts of noise, having a unique subject-specific signature that does not change across sessions (p < 0.63). This suggests that it is the highly reproducible structure of the individual's PN that is generating the high ICC in the No Correction analysis, rather than the signal itself. We agree with Birn et al. that a reduction in ICC with the application of PNC is not a negative finding (Birn et al., 2014), and Figure 5B shows that MSb changes more with PNC application than MSw. Since subject-specific physiology (RVT [p < 0.11] and MBPM [p < 0.63]) does not change across sessions, application of PNC should not affect MSw to a great degree. Thus, we believe that change in ICC is driven by changes in MSb, which removes the between-subject PN variability, thereby sensitizing it to group differences. This is important because even though the cardiovascular physiology between typical and struggling readers is not different (RVT [p < 0.71]; MBPM [p < 0.41]), its impact on cerebrovascular physiology, functional connectivity, or both is different between the two groups (Fig. 7). Thus, the removal of PN allows for more reproducible group-specific connections (Fig. 8). Furthermore, the application of PNC reduces the variability of ICC across the seed regions (Fig. 5C), such that the connectivity values across different brain regions can be accessed on the same reliability scale. RVTMBPM produces the greatest amount of ICC homogeneity across the reading network seeds, increasing the sensitivity and reliability of rsFC profiles. However, it should be pointed out that a homogeneous ICC does not mean a “better” reliability, only one that is more stable across the brain.
Left–right asymmetry is a well-documented finding in the language and reading fields. From that perspective, our methodology was not only sensitive to capture laterality differences, highlighting the dorsal or ventral stream of the reading network, but also sheds light on slight regional variations in vascular physiology between homologue brain areas (Fig. 6). This information may be useful to probe changes in treatment-induced lateralization of language and reading functions.
In addition to laterality differences, one of the major highlights of this work is to investigate the impact of PNC on group differences. We showed that the group differences between typical and struggling readers change depending on the applied PNC methodology (Fig. 7). If the connectivity strength were artificially inflated due to PN by the same amount in each group, then PN should subtract out in the group difference maps. However, this is not the case. The fact that the pattern of results depends on the signal processing steps applied to the data is important, because it reinforces two points: (1) that preprocessing methodology should be chosen carefully, and (2) physiological data should be acquired and used for correction.
From Figure 7, it is unclear which PNC methodology provides the most accurate group difference, but combining the information from across study results provides a basis for choosing the most appropriate methodology. As discussed previously, the No Correction analysis has considerable amounts of PN that bury group differences. Unlike other methodologies, RETROICOR has a striking group difference result where struggling>typical readers. Based on the low network specificity (Fig. 4C) and decreased sensitivity (Fig. 3) results for RETROICOR, the group difference result for RETROICOR and RETROICOR + RVTMBPM is possibly a processing artifact. From the R2 maps (Fig. 2), it is clear that the ANATICOR methodology removes signal of interest from subcortical structures (Fig. 4), and could be why analyses containing ANATICOR did not give rise to group differences in the subcortical regions, whereas other methods do. As discussed previously, RVTMBPM corrects the signal based on subject-specific physiology better than simulated NR, and improves sensitivity and provides the highest specificity. However, when RVTMBPM is combined with other methodologies, it appears that too much variance is removed. This is particularly striking in the most stringent PNC methodology, where 60% of the variance is accounted for across the entire brain, and hence is likely removing a combination of signal and noise. Based on this composite view of results, we recommend the use of RVTMBPM only to extract the most replicable and potentially meaningful group differences. However, it is still possible that PN corrected signal may not be optimally tuned to interrogate all underlying brain connectivity differences.
By defining subgroups within the cohort, it was found that the connectivity profile of reproducible connections (ICC >0.65) was remarkably different between typical and struggling readers (Fig. 8), as was expected based on task-fMRI studies. In rsFC data, there is a possibility that the subject's dynamic cognitive states (Buckner et al., 2013) can interact with physiology. Future work should address these factors to more accurately detect group differences.
The question of how PNC affects resting-state fMRI metrics was also recently undertaken by another group (Golestani et al., 2017). Although both studies adapted different PNC strategies (with the exception that our RVTMBPM is similar to their CRV+RVT), and tested different networks (we chose multiple nodes in the reading network, they chose motor network and DMN), there are some overlapping conclusions that can be drawn. As Golestani et al. (2017) points out, there is variability in the impact of PNC on different brain regions, which we also observe in this study across different nodes of the reading network. Furthermore, we agree with Golestani et al. (2017) that multiple quality assessments (e.g., ICC, sensitivity, specificity) must be used to choose the appropriate PNC scheme. One major difference between these two studies was the subject cohort. Golestani et al. (2017) applied their paradigm on young healthy subjects, whereas our study examined groups of typical and struggling readers. This allowed us to investigate the effects of PNC on group differences, with evidence that choice of PNC impacts detected group differences (Fig. 7). Thus, our study adds value in terms of translation of rsFC to a real-world application: to more accurately detect PNC-sensitized group differences in a cohort of cognitive disability. Thus, we expand on Golestani et al. (2017) and recommend that future investigations of resting- state fMRI processing methodologies should also account for detectability of hypothesis-driven group differences in a neurological disease or cognitive disability model.
Conclusion
The core goal of this study was to quantitatively identify the optimized methodology to remove unwanted cardiac and respiratory fluctuations from rsFC data to improve the identification and description of the reading network. We evaluated the effect of PNC on sensitivity, specificity, and reproducibility, and further assessed if expected differences in the rsFC networks could be identified between groups of typical and struggling adult readers. We identified RVTMBPM to be the methodology that provided the highest sensitivity, greatest specificity, and reproducibility across the components of the reading network in this sample of adults. Using RVTMBPM only, we identified highly connected and highly reproducible rsFC reading network-related connectivity profiles, and found that struggling readers, as expected, had fewer intra- and interhemispheric connections. Future research will need to further validate this methodological approach to PNC so that rsFC MRI paradigms can be more reliably and validly used to predict changes in reading development and provide potential targets for treatments.
Footnotes
Acknowledgments
The authors thank Ashley Mangin for help in creating the Supplementary Tables. They also sincerely thank the anonymous reviewers for their insightful comments and feedback.
Author Disclosure Statement
The authors have no conflicts to disclose.
References
Supplementary Material
Please find the following supplemental material available below.
For Open Access articles published under a Creative Commons License, all supplemental material carries the same license as the article it is associated with.
For non-Open Access articles published, all supplemental material carries a non-exclusive license, and permission requests for re-use of supplemental material or any part of supplemental material shall be sent directly to the copyright owner as specified in the copyright notice associated with the article.