
Abstract
Current hypotheses stipulate core symptoms of schizophrenia (SZ) result from the brain's incapacity to integrate neural processes. Converging diffusion magnetic resonance imaging and graph theory studies provide evidence of macrostructural alterations in SZ. However, age-related topological changes within and between white matter (WM) networks and its relationship to gene expression with disease progression remain incompletely understood. This cross-sectional study uses network modeling to investigate changes in WM network organization with disease progression in chronic SZ as well its relationship with gene expression in healthy brains. First, we replicate prior findings demonstrating altered global WM network topology in SZ. Novel results show significantly altered age-related network degradation patterns in patients compared with controls. Specifically, controls show stereotyped, linear global network decline with age. In contrast, patients show nonlinear network decline with age. Further analysis reveals lack of significant topological decline in younger adult patients, which is subsequently followed by stereotyped linear decline in older adult patients. Node-specific analyses show significant topological differences in frontal and limbic regions of younger adult patients compared with age-matched controls, which become less pronounced with age in older adult patients compared with age-matched controls. Lastly, we show several gene expression profiles, including DISC1, are associated with age-related changes in WM disconnectivity. Together, these findings provide novel WM topological and genetic evidence supporting neurodevelopmental models of SZ, suggesting that network remodeling continues throughout the third decade of life before stabilizing.
Introduction
C
Importantly, a wide body longitudinal evidence suggests SZ is not a static neurodevelopmental disorder, but rather an alteration in cortical plasticity that occurs over the lifetime of an individual (Bassett et al., 2008; DeLisi et al., 1997; Gogtay et al., 2004; Greenstein et al., 2006). Although these studies establish alterations of gray matter in SZ, it is less clear how organization of the white matter (WM) network changes (i.e., dynamics of network organization) occurs in SZ as a joint function of disease, age, and regional gene expression.
A large number of diffusion magnetic resonance imaging (MRI) studies examining tract-level changes report findings reflective of altered WM integrity in SZ (Kubicki et al., 2002, 2011; Luck et al., 2011; Price et al., 2008; Szeszko et al., 2008). Furthermore, prior studies applying graph theory analysis to diffusion MRI data show abnormal path length, centrality, and efficiency in frontal and temporal network structure as well as impaired efficiency and clustering coefficient in medial frontal, parietal/occipital, and left temporal lobes (van den Heuvel et al., 2010; Wang et al., 2012; Zalesky et al., 2011). Although such studies elucidate macrostructural changes in disease pathophysiology, age-related changes within and between WM networks with SZ progression remain incompletely understood (Gogtay, 2008). The goal of this study is to model dynamics of structural network organization in SZ and identify genes that may underlie such dynamic processes.
Prior work provides comprehensive insight into specific genes that may be involved in the etiology of SZ (Ripke et al., 2014; Walsh et al., 2008). Fewer studies examine associations between SZ neuroimaging biomarkers and genes (Chavarria-Siles et al., 2016; Terwisscha van Scheltinga et al., 2013). Still, much of this work consists of large genome-wide association studies (GWAS) studies that do not specifically link the relationship between the brain's local gene expression and structural architecture. Earlier this year, the relationship between local gene expression and connectome disconnectivity in SZ was established, as measured by fiber tract connectivity density (Romme et al., 2017). However, a comparable discovery of multiple topological graph metrics is missing. This article is the first to empirically evaluate the relationship between local gene expression and WM network organization with age in SZ.
This study uses a cross-sectional design to test network models based on diffusion tensor imaging (DTI) and genetic expression data. We hypothesize that network topology will degrade faster in SZ than in controls, with a significant association between gene expression and topological abnormalities. To test this hypothesis, graph theory analysis is utilized to examine age-related patterns of global and local topological degradation. In addition, we model the topological relationship with gene expression as measured by microarray data from healthy human brains from the Allen Brain Institute.
Materials and Methods
Subjects
DTI data were acquired from 24 individuals with chronic, treatment-resistant SZ and 51 healthy controls. Patients were recruited from inpatient and outpatient units at the University College Hospital Galway (UCHG) and in the catchment area of HSE West of Ireland. All patients were diagnosed by experienced psychiatrists, using the Structured Clinical Interview for DSM disorders (SCID) (First and Pincus, 2002), as meeting the criteria for SZ per the DSM-IV-TR (Diagnostic and Statistical Manual of Mental Disorders, Fourth Edition).
Patients and control subjects were age and gender matched (Table 1). All patients with chronic SZ were treatment resistant at the time of scanning and being considered for treatment with clozapine, an atypical antipsychotic medication for treatment resistance. Treatment resistance was defined as failure to respond to at least two antipsychotic medications, one of which an atypical, with a prolonged period of moderate to severe positive and/or negative symptoms. At time of scanning, all patients were medicated with atypical antipsychotics, with some on two or more medications (Table 1). Mean chlorpromazine equivalent dose was 247 mg. The control group consisted of 51 participants with no current or past axis I or II disorders (DSM-IV-TR) and was screened using the SCID-Non-Patient Version (First and Pincus, 2002). Both the UCHG and the National University of Ireland Galway Ethics committees granted ethical approval, and written informed consent was obtained from each participant.
PANSS, Positive and Negative Syndrome Scale (scored on the 0–6 scale); SANS, Scale for the Assessment of Negative Symptoms; SAPS, Scale for the Assessment of Positive Symptoms; GAF, Global Assessment of Functioning.
Image acquisition
Structural MR images were acquired on a 1.5T Siemens Magnetom Symphony MRI scanner, as detailed in Holleran and associates (2014). For each individual, a two-dimensional midsagittal scan was used to position the subject so that the floor of the fourth ventricle was parallel to the y axis of the scanner coordinates system. The anterior–posterior (AP) axis was determined on the midsagittal slice using the anterior commisure–posterior commisure (AC-PC) line. Detailed high-resolution, whole head contiguous axial slices (thickness 0.9 mm, field of view 230 × 230 mm) parallel to this axis were acquired using a set of three-dimensional T1-weighted magnetization prepared rapid gradient-echo (MPRAGE) sequences (relaxation time (TR): 1140 ms; echo time (TE): 4.38 ms; inversion time (TI): 600 ms; flip angle 15°; acquisition matrix 256 × 256, pixel resolution of 0.45 × 0.45 mm).
The diffusion sequence utilized echo planar imaging-based diffusion, 64 independent diffusion gradient directions at a b-value of 1300 s/mm2, and seven undirected images, TR = 8100 ms, TE = 95 ms, in-plane voxel resolution of 2.5 × 2.5 mm, slice thickness of 2.5 mm, and signal-to-noise ratio (SNR) of b = 1000 s/mm2 images >20. After scout images, the total imaging time was 10.24 min for the diffusion MRI sequence. Diffusion parameters are further described in Holleran and associates (2014) utilizing methodologies recommended by Jones and associates (1999).
Image preprocessing: structural and diffusion MRI
Whole brain networks were constructed from 51 control and 24 schizophrenic subjects, as depicted in Figure 1, using previously described methodology (Iturria-Medina et al., 2008; Raj and Chen, 2011). In brief: T1-weighted MR images were processed using the FreeSurfer automatic volumetric pipeline to map and construct cortical volumes (Dale et al., 1999; Fischl et al., 1999, 2001, 2004a; Fischl et al., 2002, 2004b; Ségonne et al., 2004) (
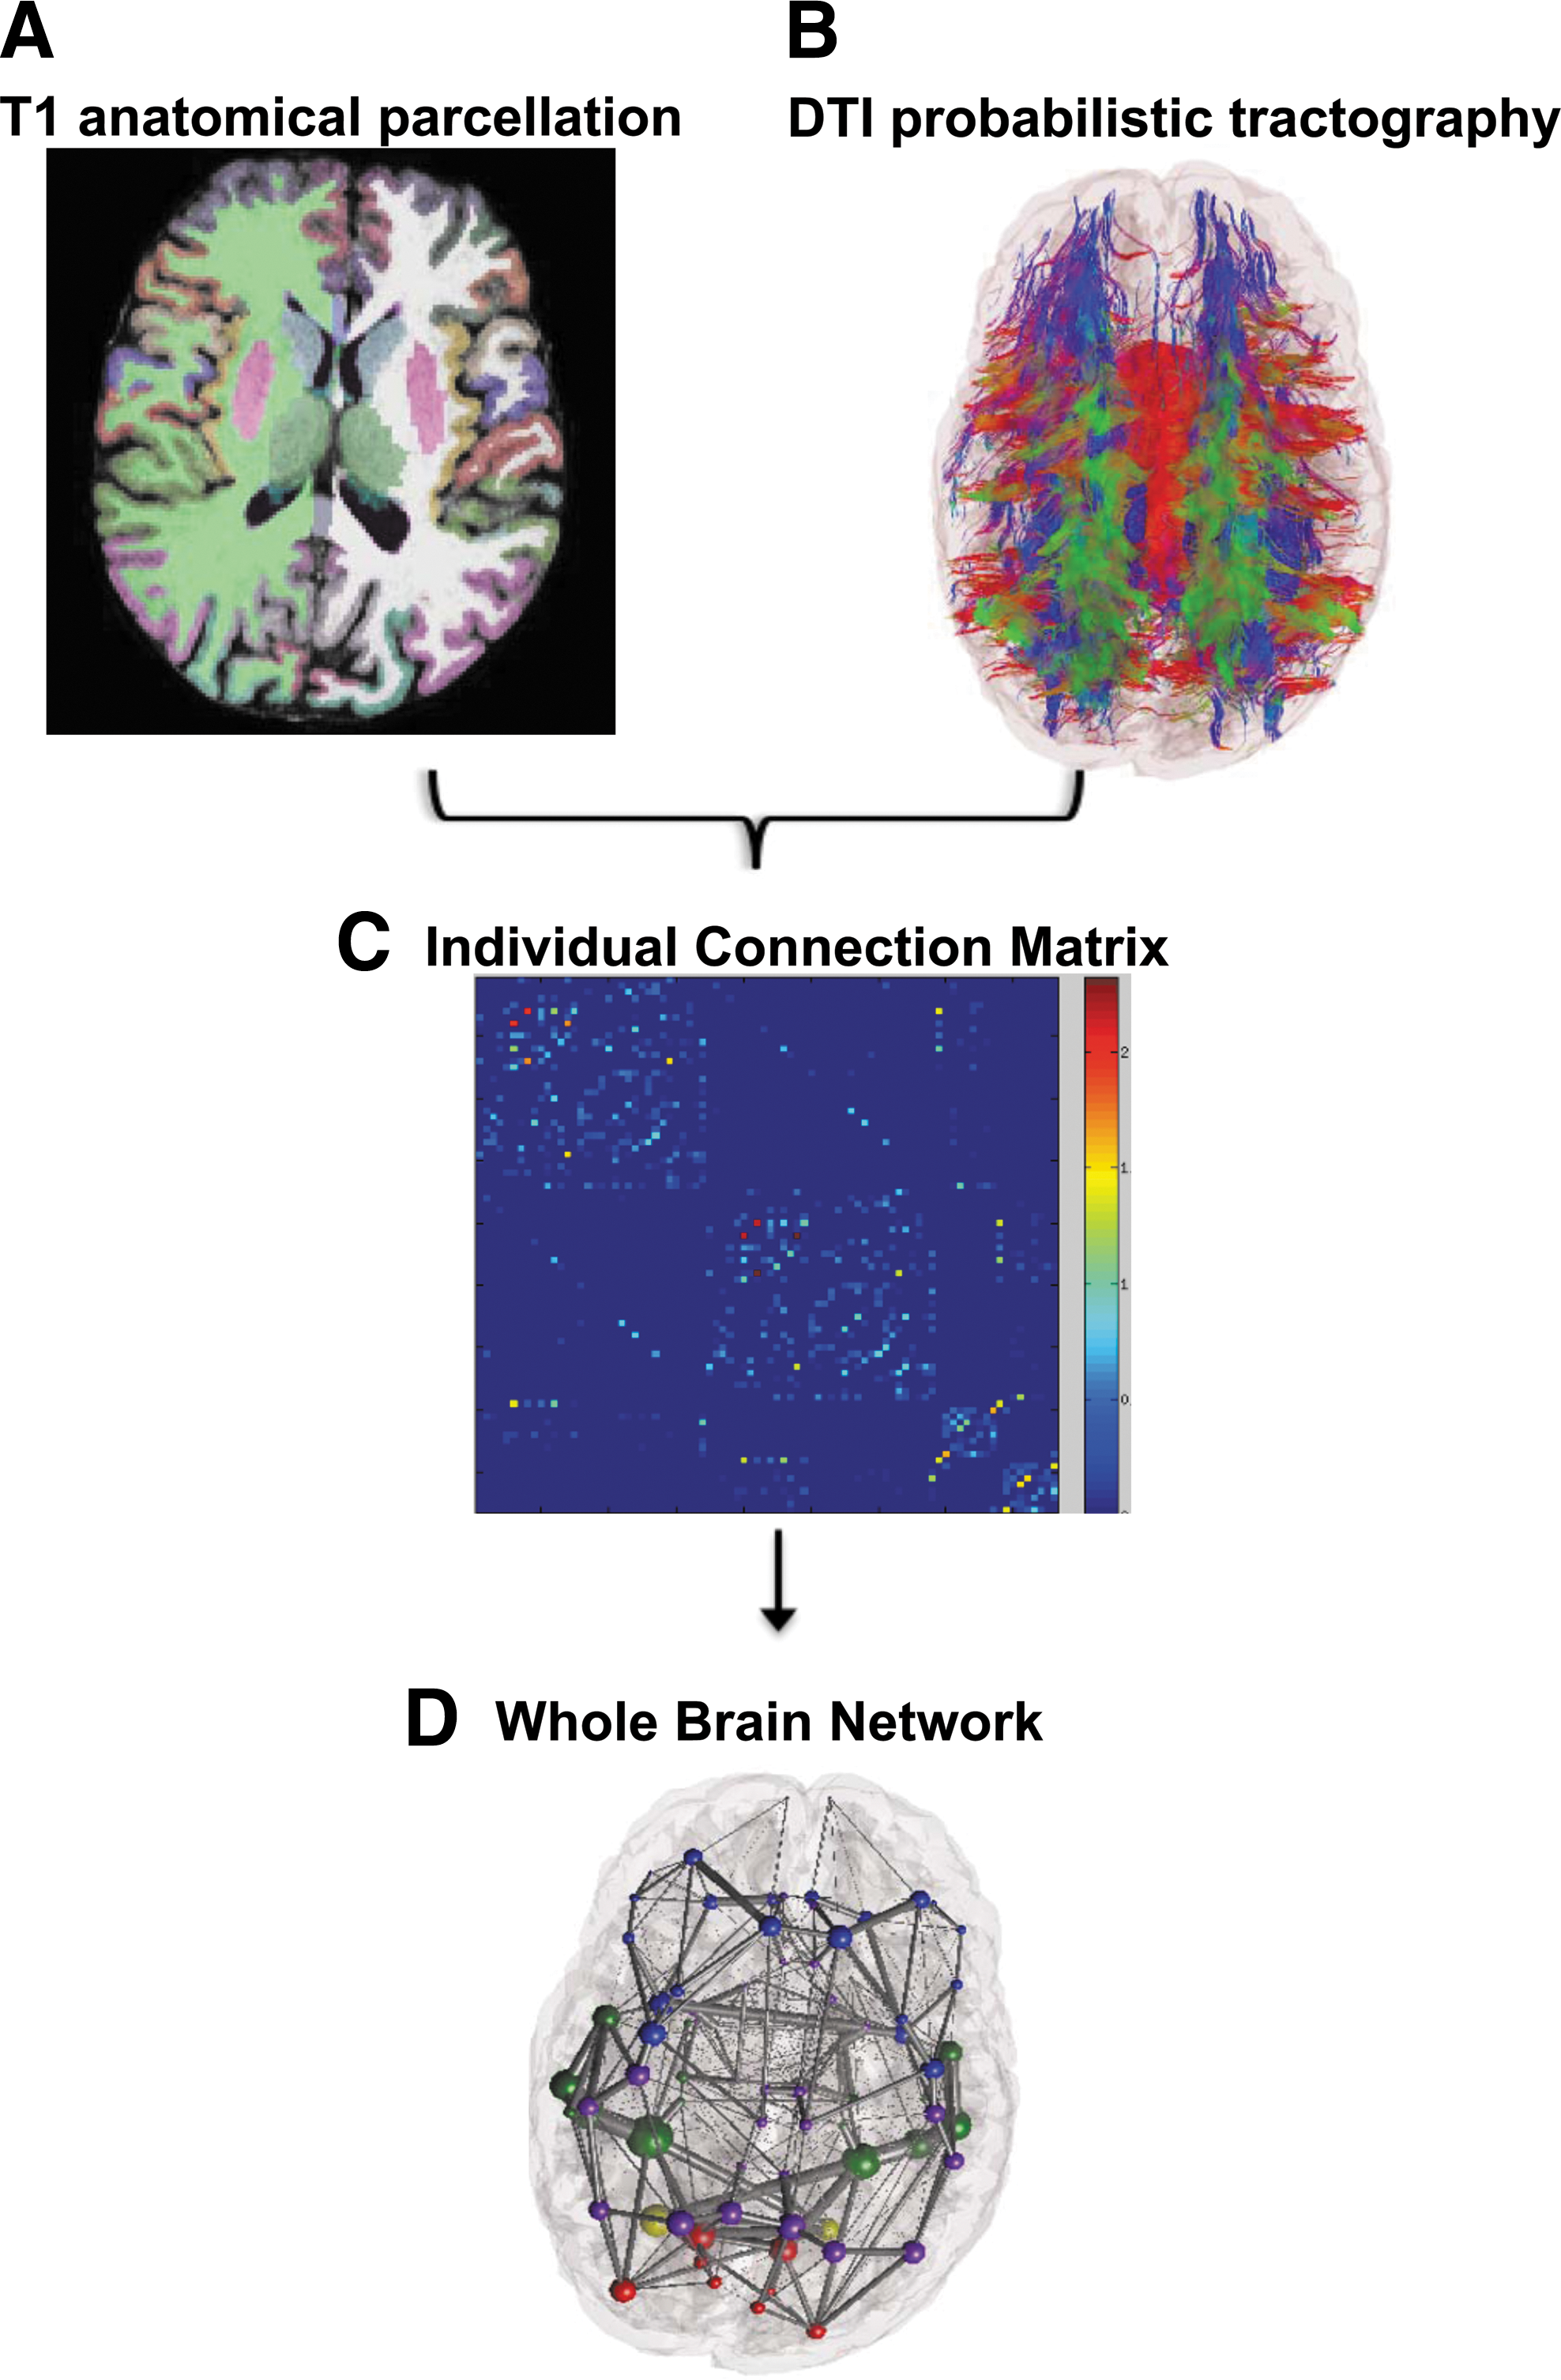
Image preprocessing construction of the structural brain network.
Primary visual inspection did not indicate presence of major artifacts in any of the diffusion MRI data. Slice-by-slice inspection showed that motion was most evident in the frontal pole, but no major artifacts were detected that would result in additional exclusion from the study. Any potential confounding motion artifact was successfully addressed by eddy current and motion distortion correction using methodology detailed in Leemans and Jones (2009).
Cortical and subcortical volume mappings from the FreeSurfer aparc+aseg parcellation atlas were used to establish 86 region-of-interest (ROI) nodes for tractography. The processed tissue segmentation defined the white–gray matter interface, which was used to seed points for probabilistic tractography with 1000 streamlines drawn per seed voxel (Behrens et al., 2007). Each streamline is assigned a probability score according to established criteria (Iturria-Medina et al., 2008). WM tracts are estimated by the connection strength of each ROI, which is obtained by summing the probabilities of the streamlines terminating between two regions.
Graph theory analysis
Characteristic graph metrics to examine differences in network topology were calculated from undirected, weighted, nonthresholded structural connectivity matrices. Network metrics including density, global efficiency, clustering coefficient, small-worldness, local connection strength, local efficiency, and local modularity were computed in MATLAB using the Brain Connectivity Toolbox (BCT) as described in Rubinov and Sporns (2010). Additional metrics including power law alpha and largest eigenvalue of adjacency matrix were not available in the BCT and calculated using the igraph tool (Csardi et al., 2006). See Supplementary Data for definitions of additional network properties (Supplementary Data are available online at
Genetic data
Microarray gene expression data from postmortem healthy human brains were downloaded from the Allen Brain Atlas Institute and obtained as described in Hawrylycz and associates (2012). The microarray data are composed of 926 regions of the brain, each one belonging to a set of 58,692 probes that correspond to 29,181 distinct genes. Unique probe IDs often represented the same gene and the average as used for analysis of the gene, as done by Freer and associates (2016). For analysis, the 926 regions in the microarray data were mapped to 86 regions of the Desikan Atlas.
We narrowed gene expression work to six genes identified as the top genes reported to be associated with SZ from a GWAS database to capture maximum power across thousands of studies and limit Type-I error. Genes of interest implicated in SZ were selected from a DisGeNET database, which generates human gene–disease associations from curated databases and text mining (Piñero et al., 2015).
Statistical analysis
Independent, two-sided t-tests were used to test for differences in characteristic graph metrics. All reported significant global p values survived false discovery rate (FDR) correction for multiple comparisons and are FDR adjusted (Benjamini and Hochberg, 1995). When noted, permutation testing, randomly mixing group assignment, was performed to obtain a null distribution of component size, independent of group status (5000 permutations). Permutation tests for group differences in global network metrics were FDR corrected for multiple comparisons. Local metrics did not survive FDR corrections and local reported p values are uncorrected. Using global metrics as dependent variables and age as independent variables, network degradation was modeled using regression analysis. The significance of regression model fits was evaluated using the F-statistic.
Correlation analyses were carried out to determine whether identified brain topological changes were associated with gene expression. Correlations between a specific gene's expression and a local graph metric were Bonferroni corrected across all three tested age ranges (p < 0.05/3). This Bonferonni correction method was applied in a manner suggested by Mayo and Cox (2006), which urges each experiment's goals be considered when applying Bonferroni correction. Specifically, this study considers each gene and its relationship with age to represent its own experiment to explore the effect of age on the relationship between gene expression and topology. Within each experiment exist three hypotheses (one hypothesis for younger subjects, one hypothesis for older subjects, and one hypothesis for all subjects).
Results
WM network topology in all subjects
First, we confirm results from our imaging pipeline reproduce numerous previously published data on altered global WM topology in SZ. We observe that patients show significantly decreased density (p = 0.02), global efficiency (p = 0.01), clustering coefficient (p = 0.01), largest eigenvalue of the adjacency matrix (p = 0.02), and power law alpha (p = 0.02) than controls. No significant difference in small-worldness is observed between patients and controls (p = 0.38; Supplementary Fig. S1). All reported global p values survived FDR correction for multiple comparisons. To mitigate concerns of small sample, p values were replicated with permutation testing (5000 permutations—FDR corrected in Supplementary Table S1).
Age-dependent network degradation
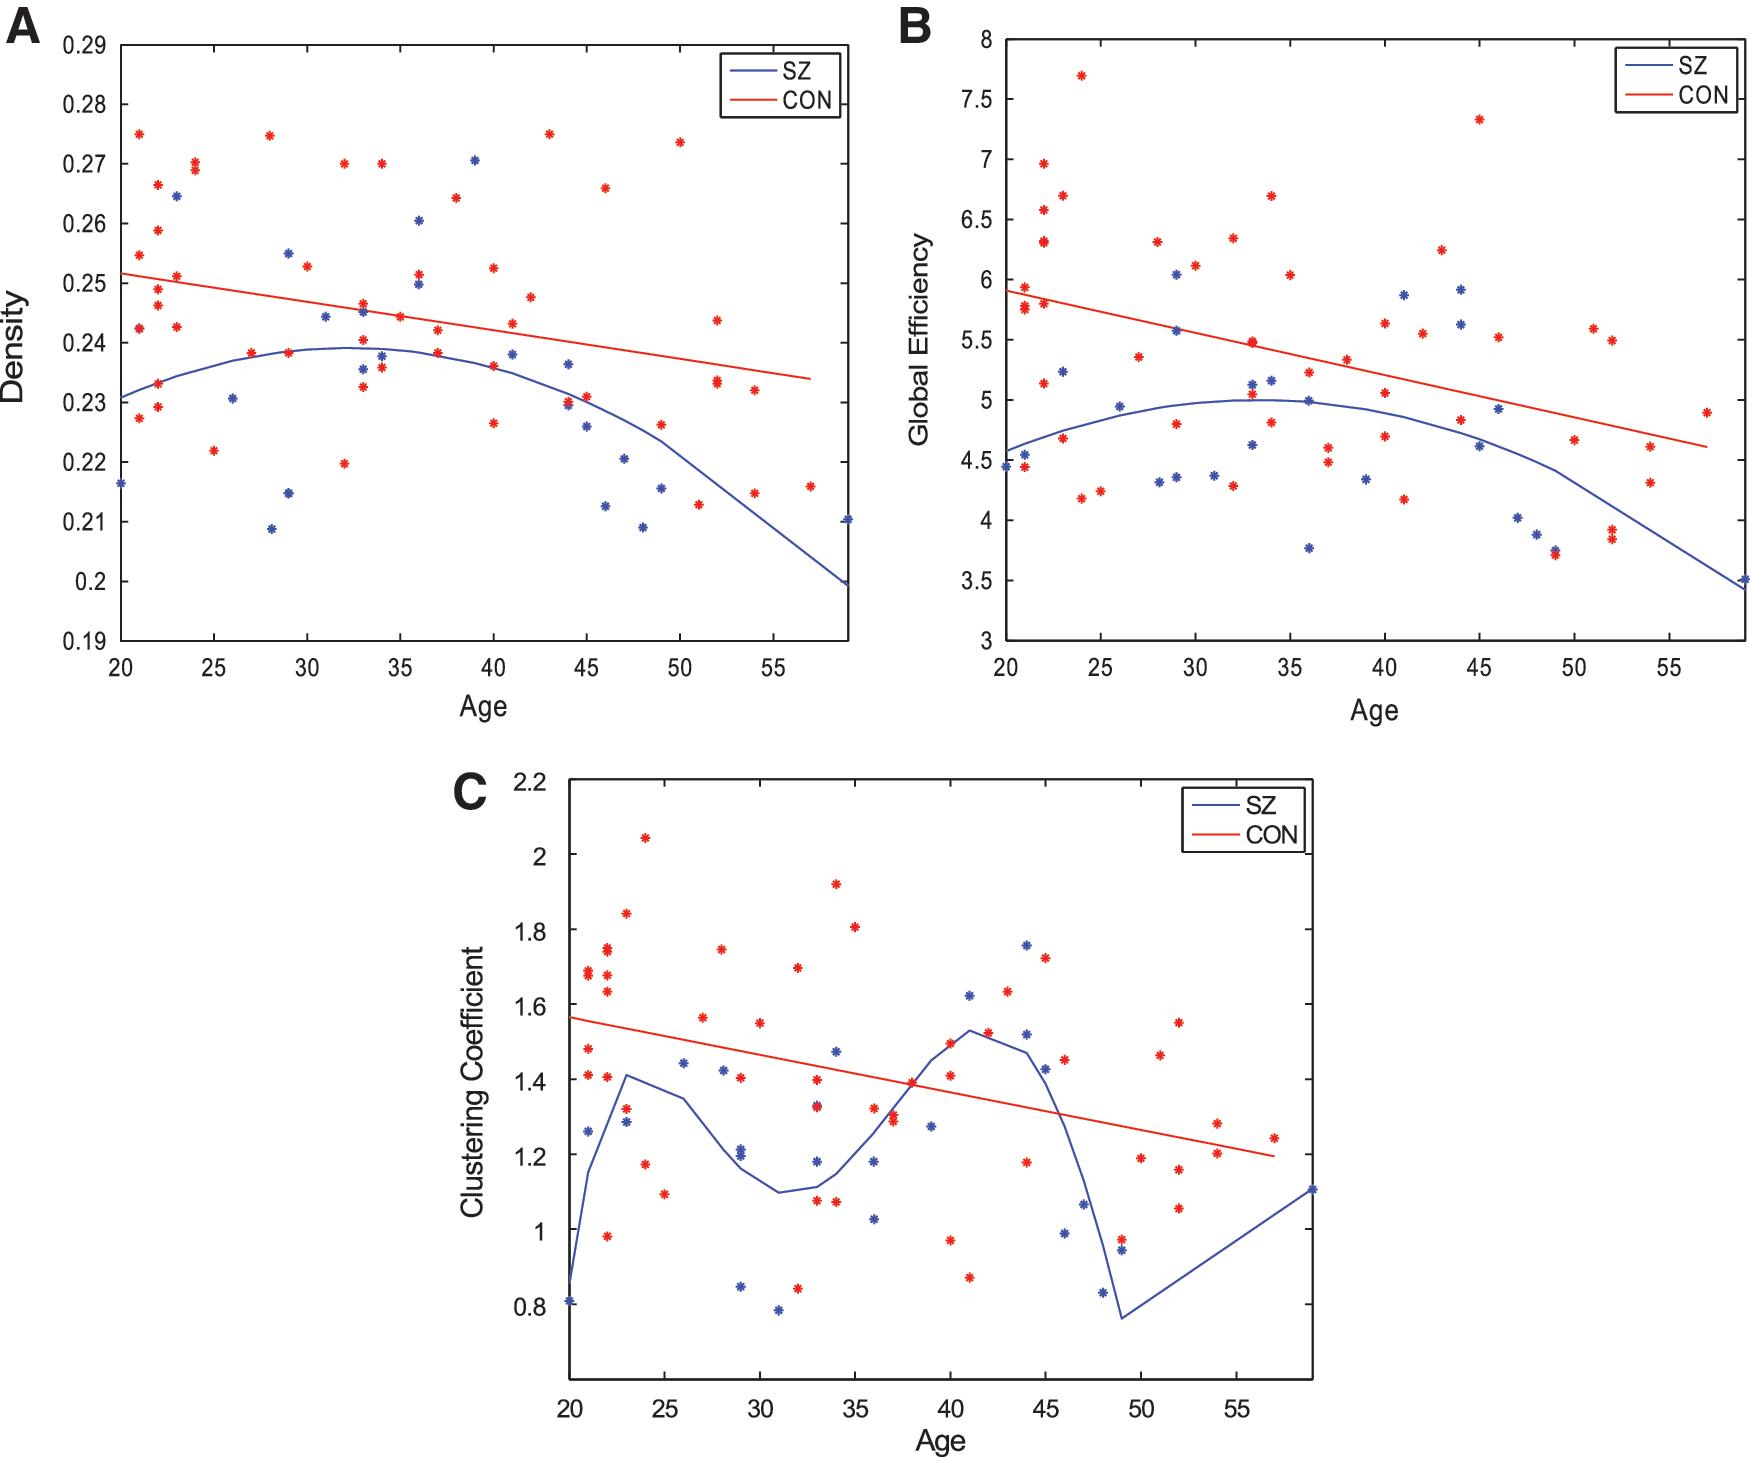
To quantify changes in network topology with age, regression models were fit to each global metric over the age range of all subjects. The graphs showing global network metrics as a function of age are hereby referred to as “age-resolved” plots and are depicted in Figure 2. Linear models were tested because prior work shows WM microstructure changes linearly with age in healthy control subjects (Hagmann et al., 2010). In addition, we hypothesized that quadratic models may also capture network degradation as this study encompasses a later, wider age range than prior work. To test these hypotheses, model fits were evaluated using significance of the F-statistic of the overall model, whether the model considered was linear, quadratic, or polynomial. The model that reports the smallest p value of the F-statistic was considered the most appropriate model for any given graph metric. We observe that in control subjects, all metrics degraded in a stereotyped manner. Density (p = 0.02), efficiency (p = 0.002), clustering coefficient (p = 0.005), and power law alpha (p = 0.05) degrade linearly with age (Fig. 2; Table 2). Interestingly, largest eigenvalue of the adjacency matrix degrades quadratically with age in controls (p = 0.007).
The best regression fits for age-resolved plots of network metrics
Indicates significant and moderate trends toward significance.
SZ, schizophrenia.
In contrast, age-related network degradation patterns in patients do not follow similar, stereotyped trends. Density (p = 0.076) and global efficiency (p = 0.075) degrade in a moderate quadratic trend toward significance with age in patients (Fig. 2A, B). However, neither linear nor quadratic fits accurately model age degradation patterns in clustering coefficient, power law alpha, and largest eigenvalue of the adjacency matrix. The best regression equations for these age-resolved graphs are over-fitted, fifth degree polynomials, which are likely not generalizable (Table 2; Fig. 2C) (power law alpha and largest eigenvalue of the adjacency matrix are not shown). Taken together, these data show that although controls show stereotyped, linear degradation of network organization with age, a stereotyped linear model for SZ is overall poor, as the best result shows merely a moderate trend toward significance (Fig. 2A, B). Given that quadratic fits are appreciable in the SZ group over age, subsequent analysis splits patients into two separate age groups with the goal of elucidating whether two linear models segregated by age can explain the abnormal degradation trajectory observed in SZ better than a single linear model over all ages.
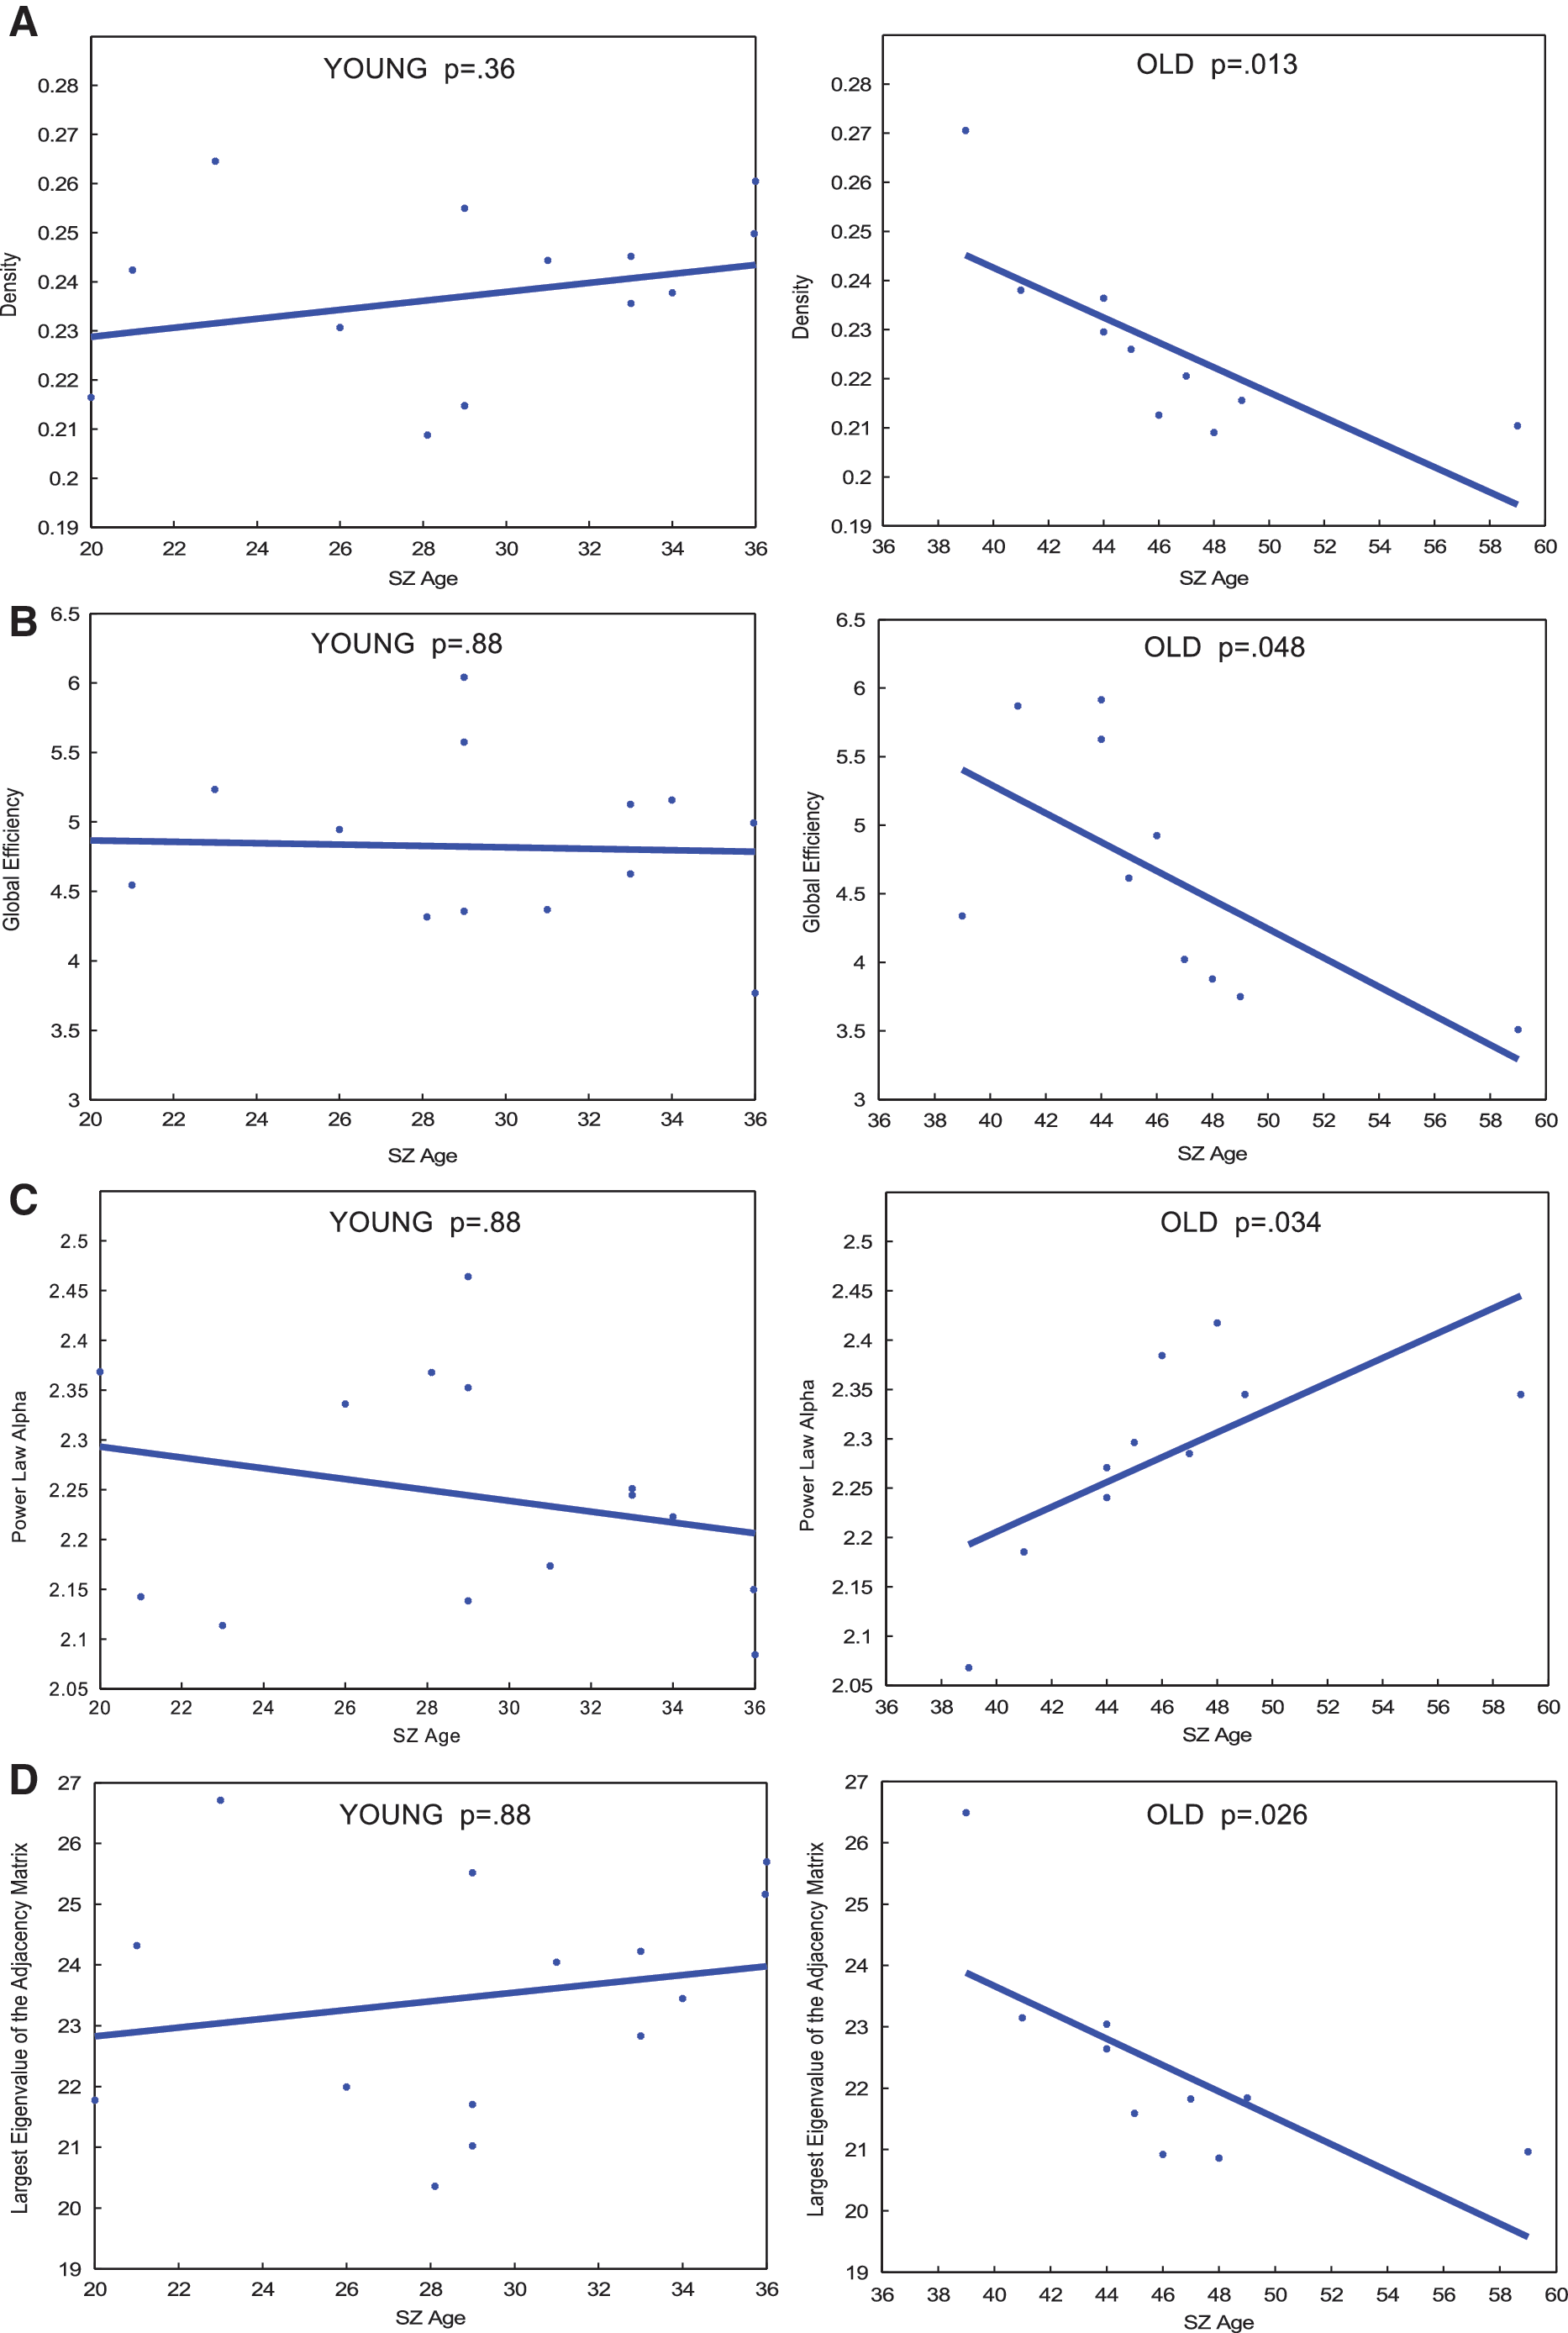
To further investigate age-related network degradation within SZ, regression was performed with patients split into a “younger adult” or “older adult” group. Age 37 was selected as the cut-off between “older” and “younger” subjects because visual inspection of SZ age-resolved graphs shows that age 37 years represents the peak of the parabolic age effect. Specifically, it is evident in Figure 2A and B that density and global efficiency continue to grow in the younger age range, before reaching a peak at age 37 then declining. This finding suggests a possible age-related topological change that warranted further analysis (Fig. 2A, B). Hence, to test this hypothesis, regression analysis was carried out separately in each age group. These individual regression fits are depicted in Figure 3. Owing to the small sample size in each age group, permutation testing consisting of 5000 iterations was carried out after the initial regression. In the younger adult group, degradation slopes of density, global efficiency, power law, and largest eigenvalue of the adjacency matrix slopes do not significantly differ from 0. This result survived permutation testing (Supplementary Table S2). In contrast, preliminary regression analysis shows all four of those metrics degrade in a significant, linear manner in older adults (Fig. 3). However, only between the age effect of global efficiency and largest eigenvalue of the adjacency matrix survived permutation testing (Supplementary Table S2). Clustering coefficient did not follow this trend and does not degrade at a slope significantly different in either age group, suggesting a more sophisticated model may be necessary (data not shown).
p Values of linear regression fits for age-resolved plots of global metrics of
Younger adult versus older adult global network analysis
Next, we examine network organization between patients and controls within the two age groups. Younger adult patients show significantly decreased global efficiency (p = 0.002) and clustering coefficient (p = 0.002) compared with age-matched controls (Fig. 4B, C). Density (p = 0.11) shows significant before multiple corrections, but does not survive FDR correction (Fig. 4A). Similarly, power law alpha (p = 0.11), largest eigenvalue of the adjacency matrix (p = 0.11), also show significance before multiple corrections, but do not survive FDR correction (data not shown). Small-worldness (p = 0.55) is preserved between younger patients and controls (Fig. 4D). No global graphic metrics are significantly different between older adult patients and age-matched controls (Fig. 4E–H).
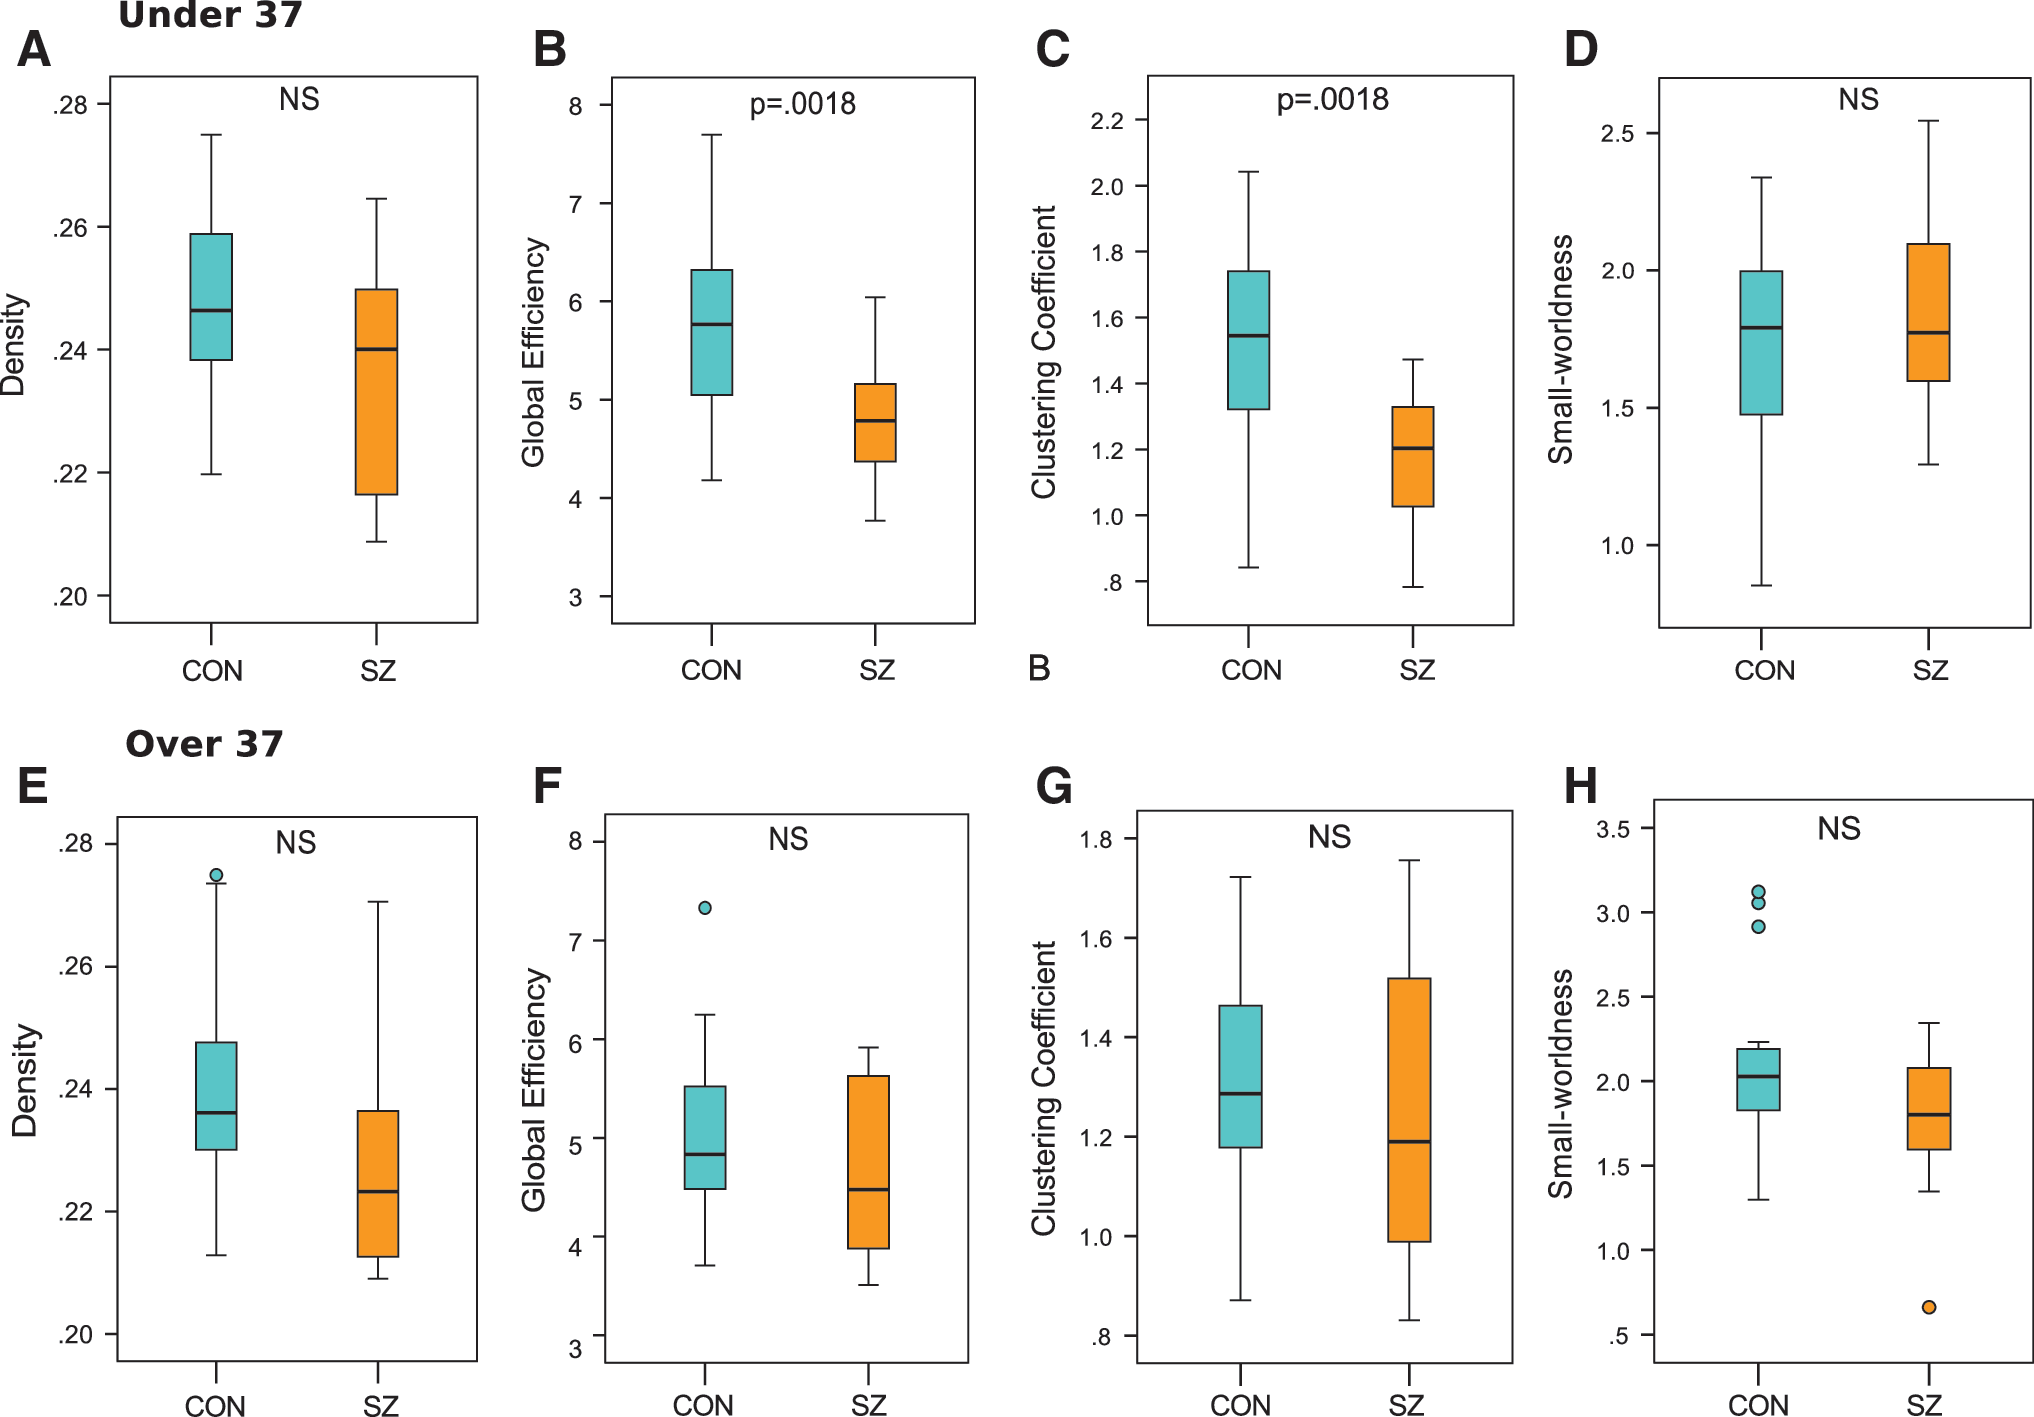
Boxplots less than age 37 of
Relationship between gene expression and local network analysis
Owing to the highly heritable nature of WM abnormalities in SZ, we investigated the relationship between changes in topological degradation and gene expression in both younger adult and older adult subjects. This study's six genes of interest include DISC1, DRD2, DTNB1, GRM3, COMT, and BDNF (see Supplementary Table S3 for full gene names). These genes were identified as the top genes reported to be associated with SZ from a GWAS database. Glass brains of healthy gene expression of DISC1 from postmortem brains are illustrated, as DISC1 in the literature reports it as most associated with SZ (Fig. 5; see Supplementary Fig. S2 for glass brains of all genes of interest).
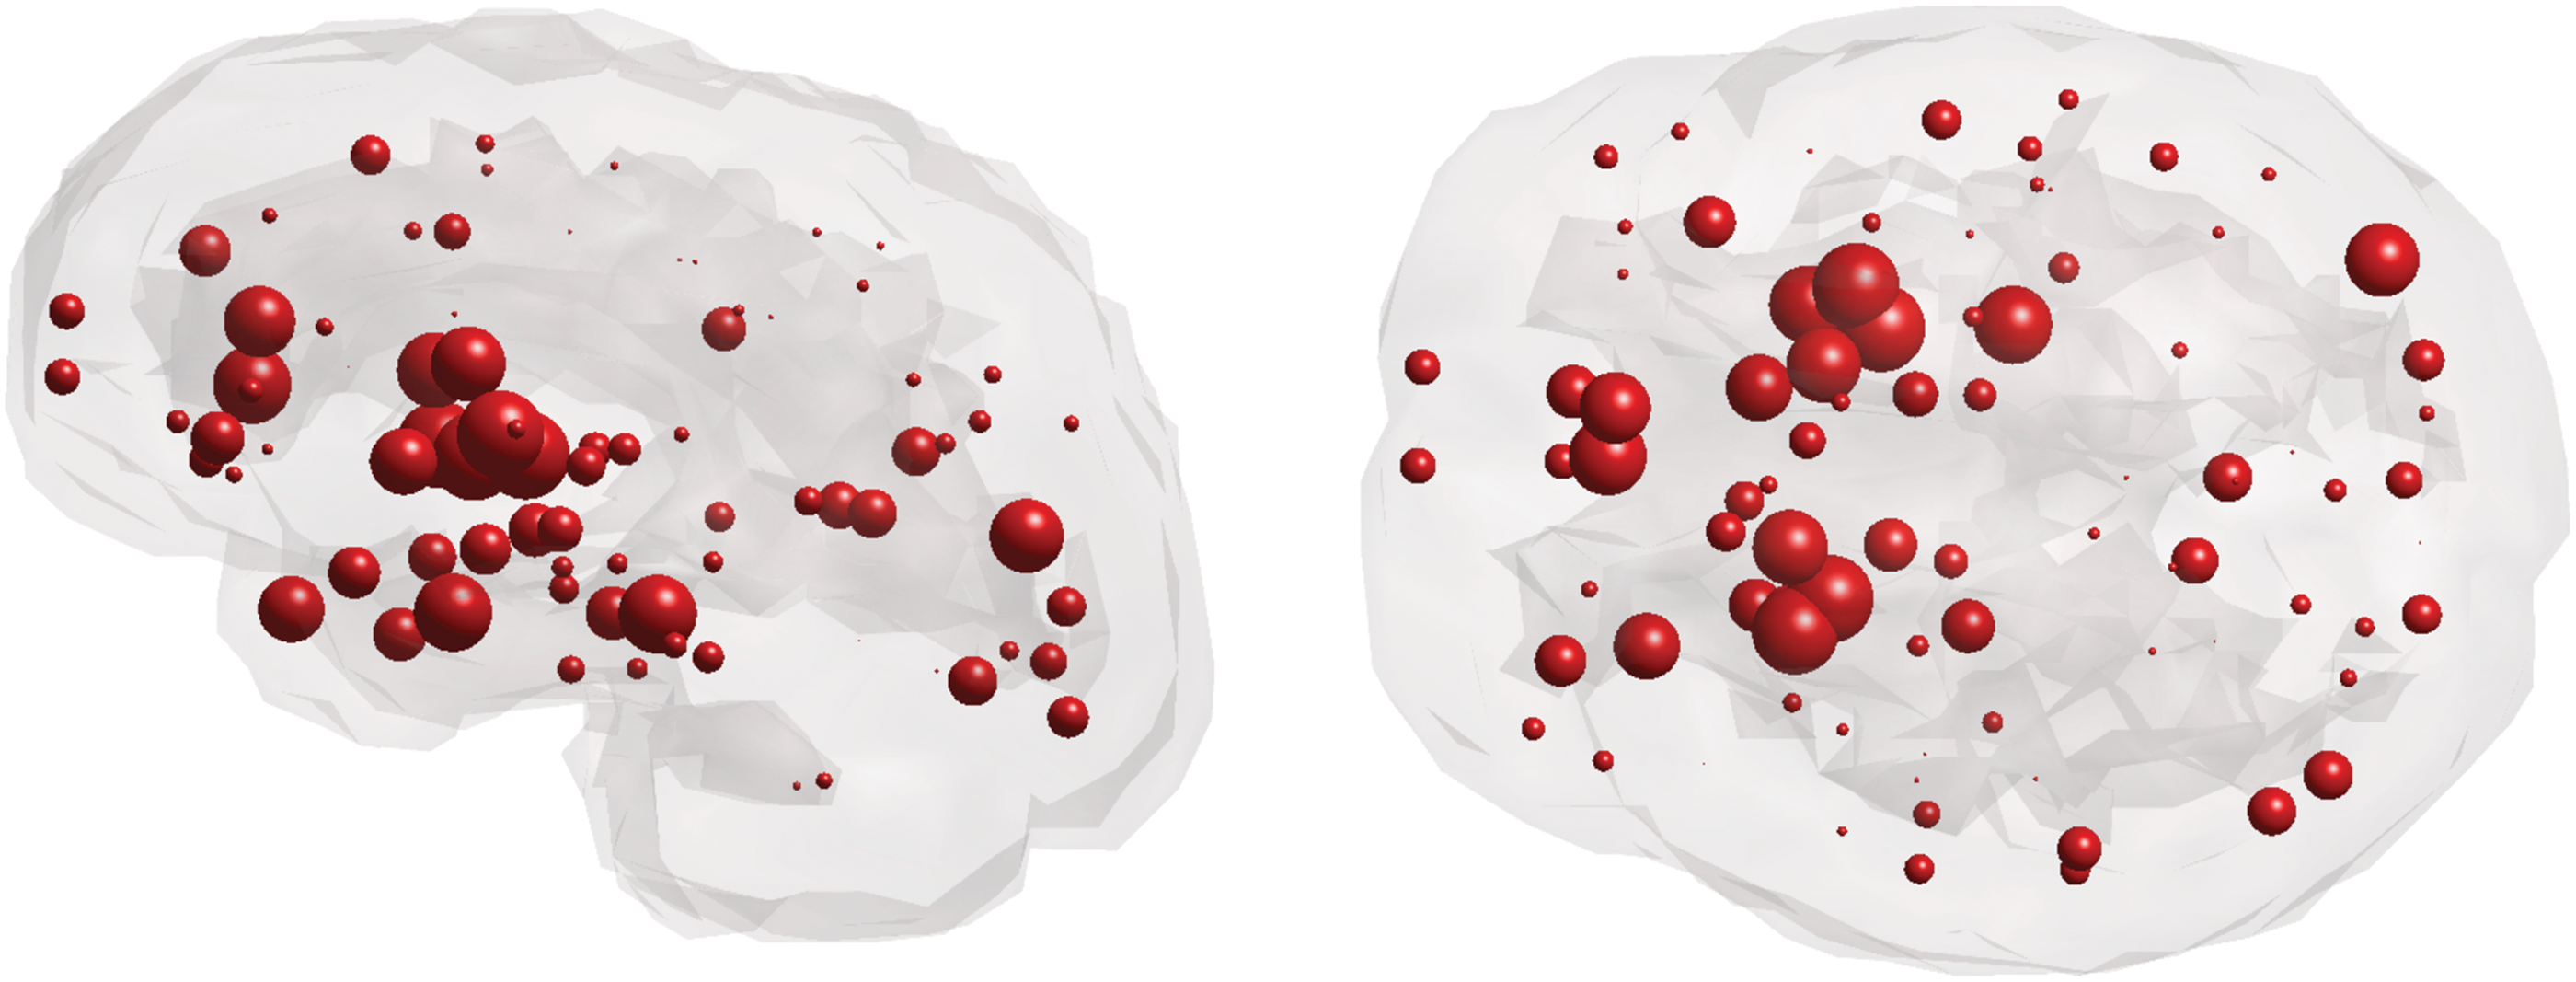
Sagittal and axial glass brains of gene expression of DISC1 from postmortem brains of healthy subjects. Color images available online at
To pinpoint regional abnormalities, local network analysis of connection strength, efficiency, and modularity was performed. Reported local effects did not survive FDR correction. Group analyses reveal reduced local connection strength between younger adult patients and age-matched controls in frontal, temporal, and cingulate regions (Fig. 6A). Specifically, the most drastic reductions in local connection strength of these regions are observed in the left caudal anterior cingulate cortex (p = 0.00005), bilaterally in the superior temporal gyrus (p = 0.0008, p = 0.04), left pars triangularis (p = 0.005), left transverse temporal gyrus (p = 0.01), and right precentral gyrus (p = 0.01; Supplementary Table S4). Older adult patients show only three nodes with altered local connection strength compared with age-matched controls, which include the right middle temporal gyrus (p = 0.004), right hippocampus (p = 0.009), and left nucleus accumbens (p = 0.02; Fig. 6B; Supplementary Table S4). Interestingly, DISC1, DRD2, DTNBP1, and GRM3 show an age-related change in association between local connection strength and gene expression (Table 3). Age-related differences in the relationship between DISC1 and local connection strength disturbances appear to be driven by a significant correlation in younger subjects, an effect absent in older subjects (Fig. 6C). Conversely, age-related differences in the relationship between DRD2 and DTNBP1 are driven by a significant correlation in older subjects and absent in younger subjects. We observe no age-related effect of connection strength disturbances and BDNF nor COMT expression.

Coronal, sagittal, and axial glass brains with decreased local connection strength in patients (blue nodes) and increased connection strength in patients (gold nodes) versus controls.
Gray highlight indicates age-related changes in the relationship between gene expression and WM fiber connection strength.
Survived Bonferroni correction significance threshold of p = 0.016.
Local efficiency is also reduced in younger adult patients compared with age-matched controls in frontal, temporal, and cingulate regions (Fig. 7A). The most significant reductions in local efficiency are observed bilaterally in the superior frontal gyrus (p = 0.0005, p = 0.003), bilateral caudal anterior cingulate (p = 0.003, p = 0.02), bilateral rostral middle frontal gyrus (p = 0.004, p = 0.02), left pars triangularis (p = 0.01), and bilateral precentral gyrus (p = 0.03, p = 0.04; Supplementary Table S5). In contrast, older adult patients reveal only two nodes with abnormal local efficiency compared with age-matched controls, which include the right pars orbitalis (p = 0.02) and left pericalcarine cortex (p = 0.05; Fig. 7B; Supplementary Table S5). Age-related differences in the relationship between DISC1 and local efficiency alterations appear to be driven by a significant correlation in younger subjects, an effect that is absent in older subjects (Fig. 7C). There is no relationship between DRD2, DTNBP1, and GRM3 (Table 4). BDNF and COMT were omitted from analysis due to lack of relationship with connection strength disturbance.
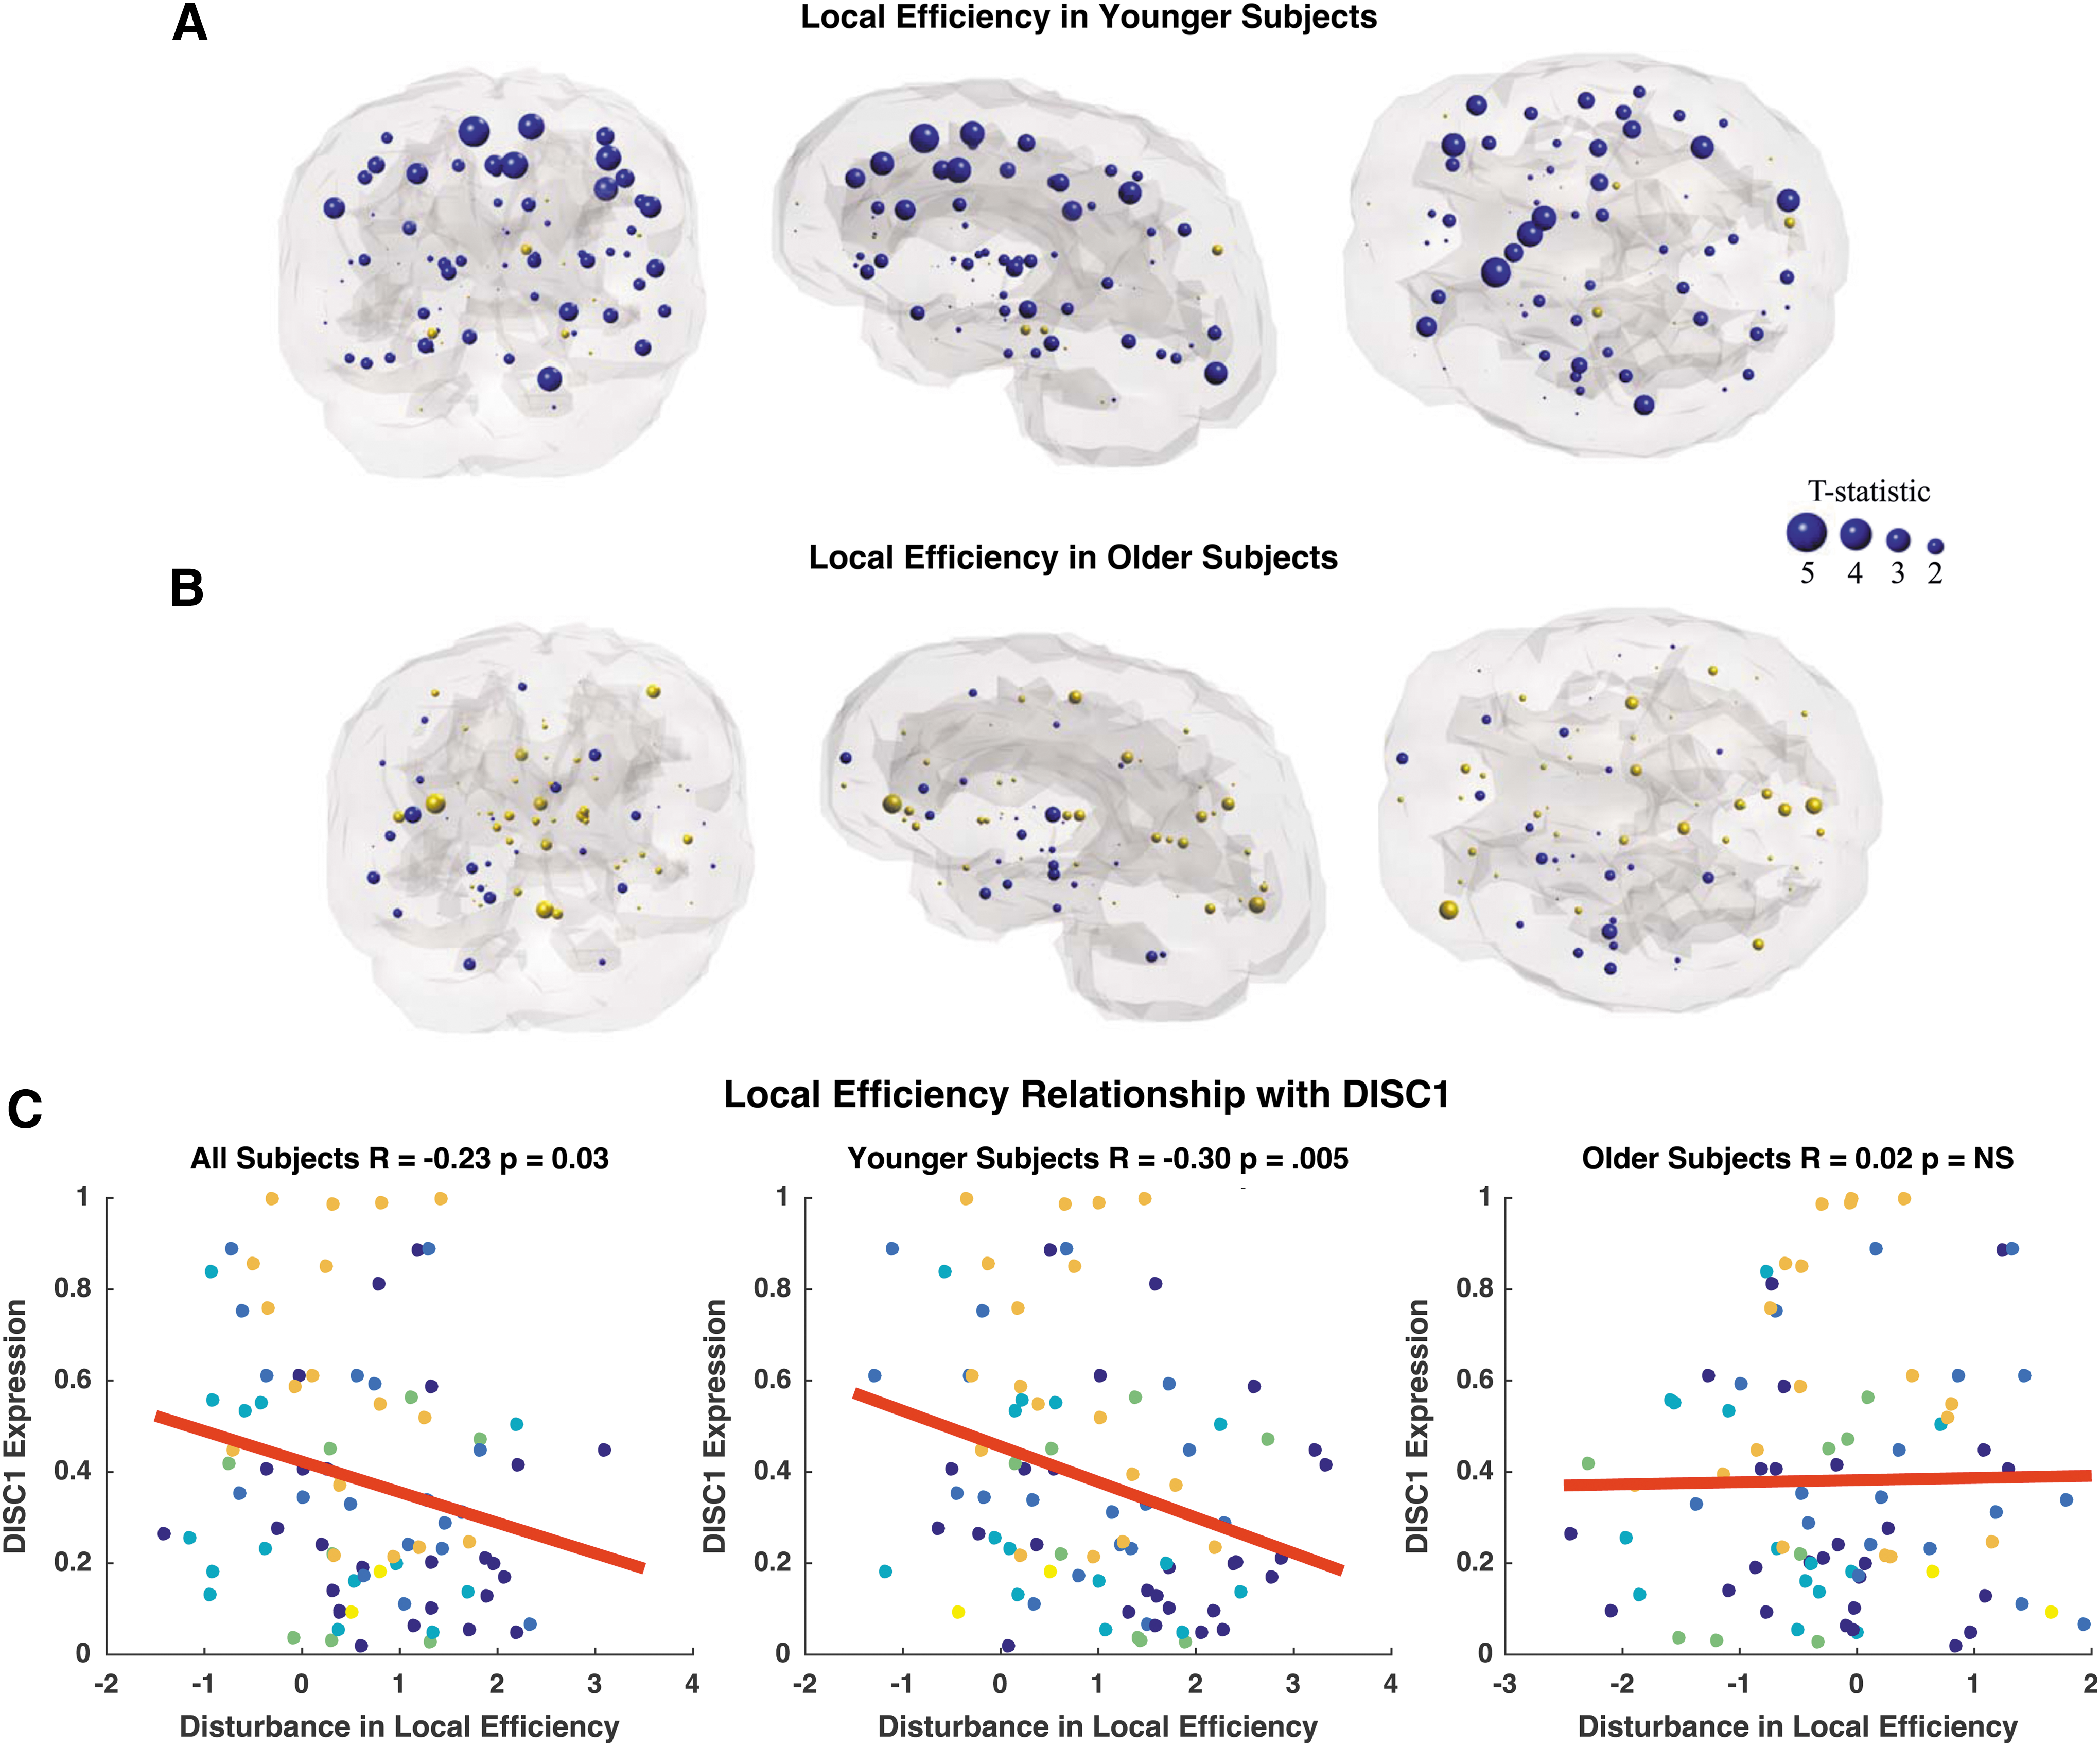
Coronal, sagittal, and axial glass brains with decreased local efficiency in patients (blue nodes) and increased efficiency in patients (gold nodes) vs. controls.
Gray highlight indicates age-related changes in the relationship between gene expression and local efficiency.
Survived Bonferroni correction significance threshold of p = 0.016.
NS, not significant.
Similarly, we observe decreased modularity in frontal, cingulate, and temporal regions between younger adult patients and age-matched controls (Fig. 8A). The most significant reductions in modularity occur bilaterally in the supramarginal gyrus (p = 0.01, p = 0.02), bilateral rostral middle frontal gyrus (p = 0.01, p = 0.03), bilateral frontal pole (p = 0.01, p = 0.03), bilateral caudal anterior cingulate (p = 0.01, p = 0.02), and bilateral transverse temporal gyrus (p = 0.02, p = 0.03; Supplementary Table S6). Older adult subjects display only three nodes with abnormal local modularity compared with age-matched controls, which include the right pars orbitalis (p = 0.04) and bilateral nucleus accumbens (p = 0.03; Fig. 8B; Supplementary Table S6). Older adult patients exhibit trends of increased modularity compared with controls. Age-related differences in the relationship between DISC1, DRD2, DTNBP1, and local modularity appear to be driven by a significant correlation in older subjects, an effect that is absent in younger subjects (Fig. 8C; Table 5). BDNF and COMT were omitted from analysis due to lack of relationship with connection strength. Interestingly, there is an age-related effect in the association between GRM3 expression and local modularity alterations. Specifically, younger subjects show a significant positive correlation between SZ disturbances in modularity and GRM3 expression, whereas older subjects show a significant negative relationship (Table 5).
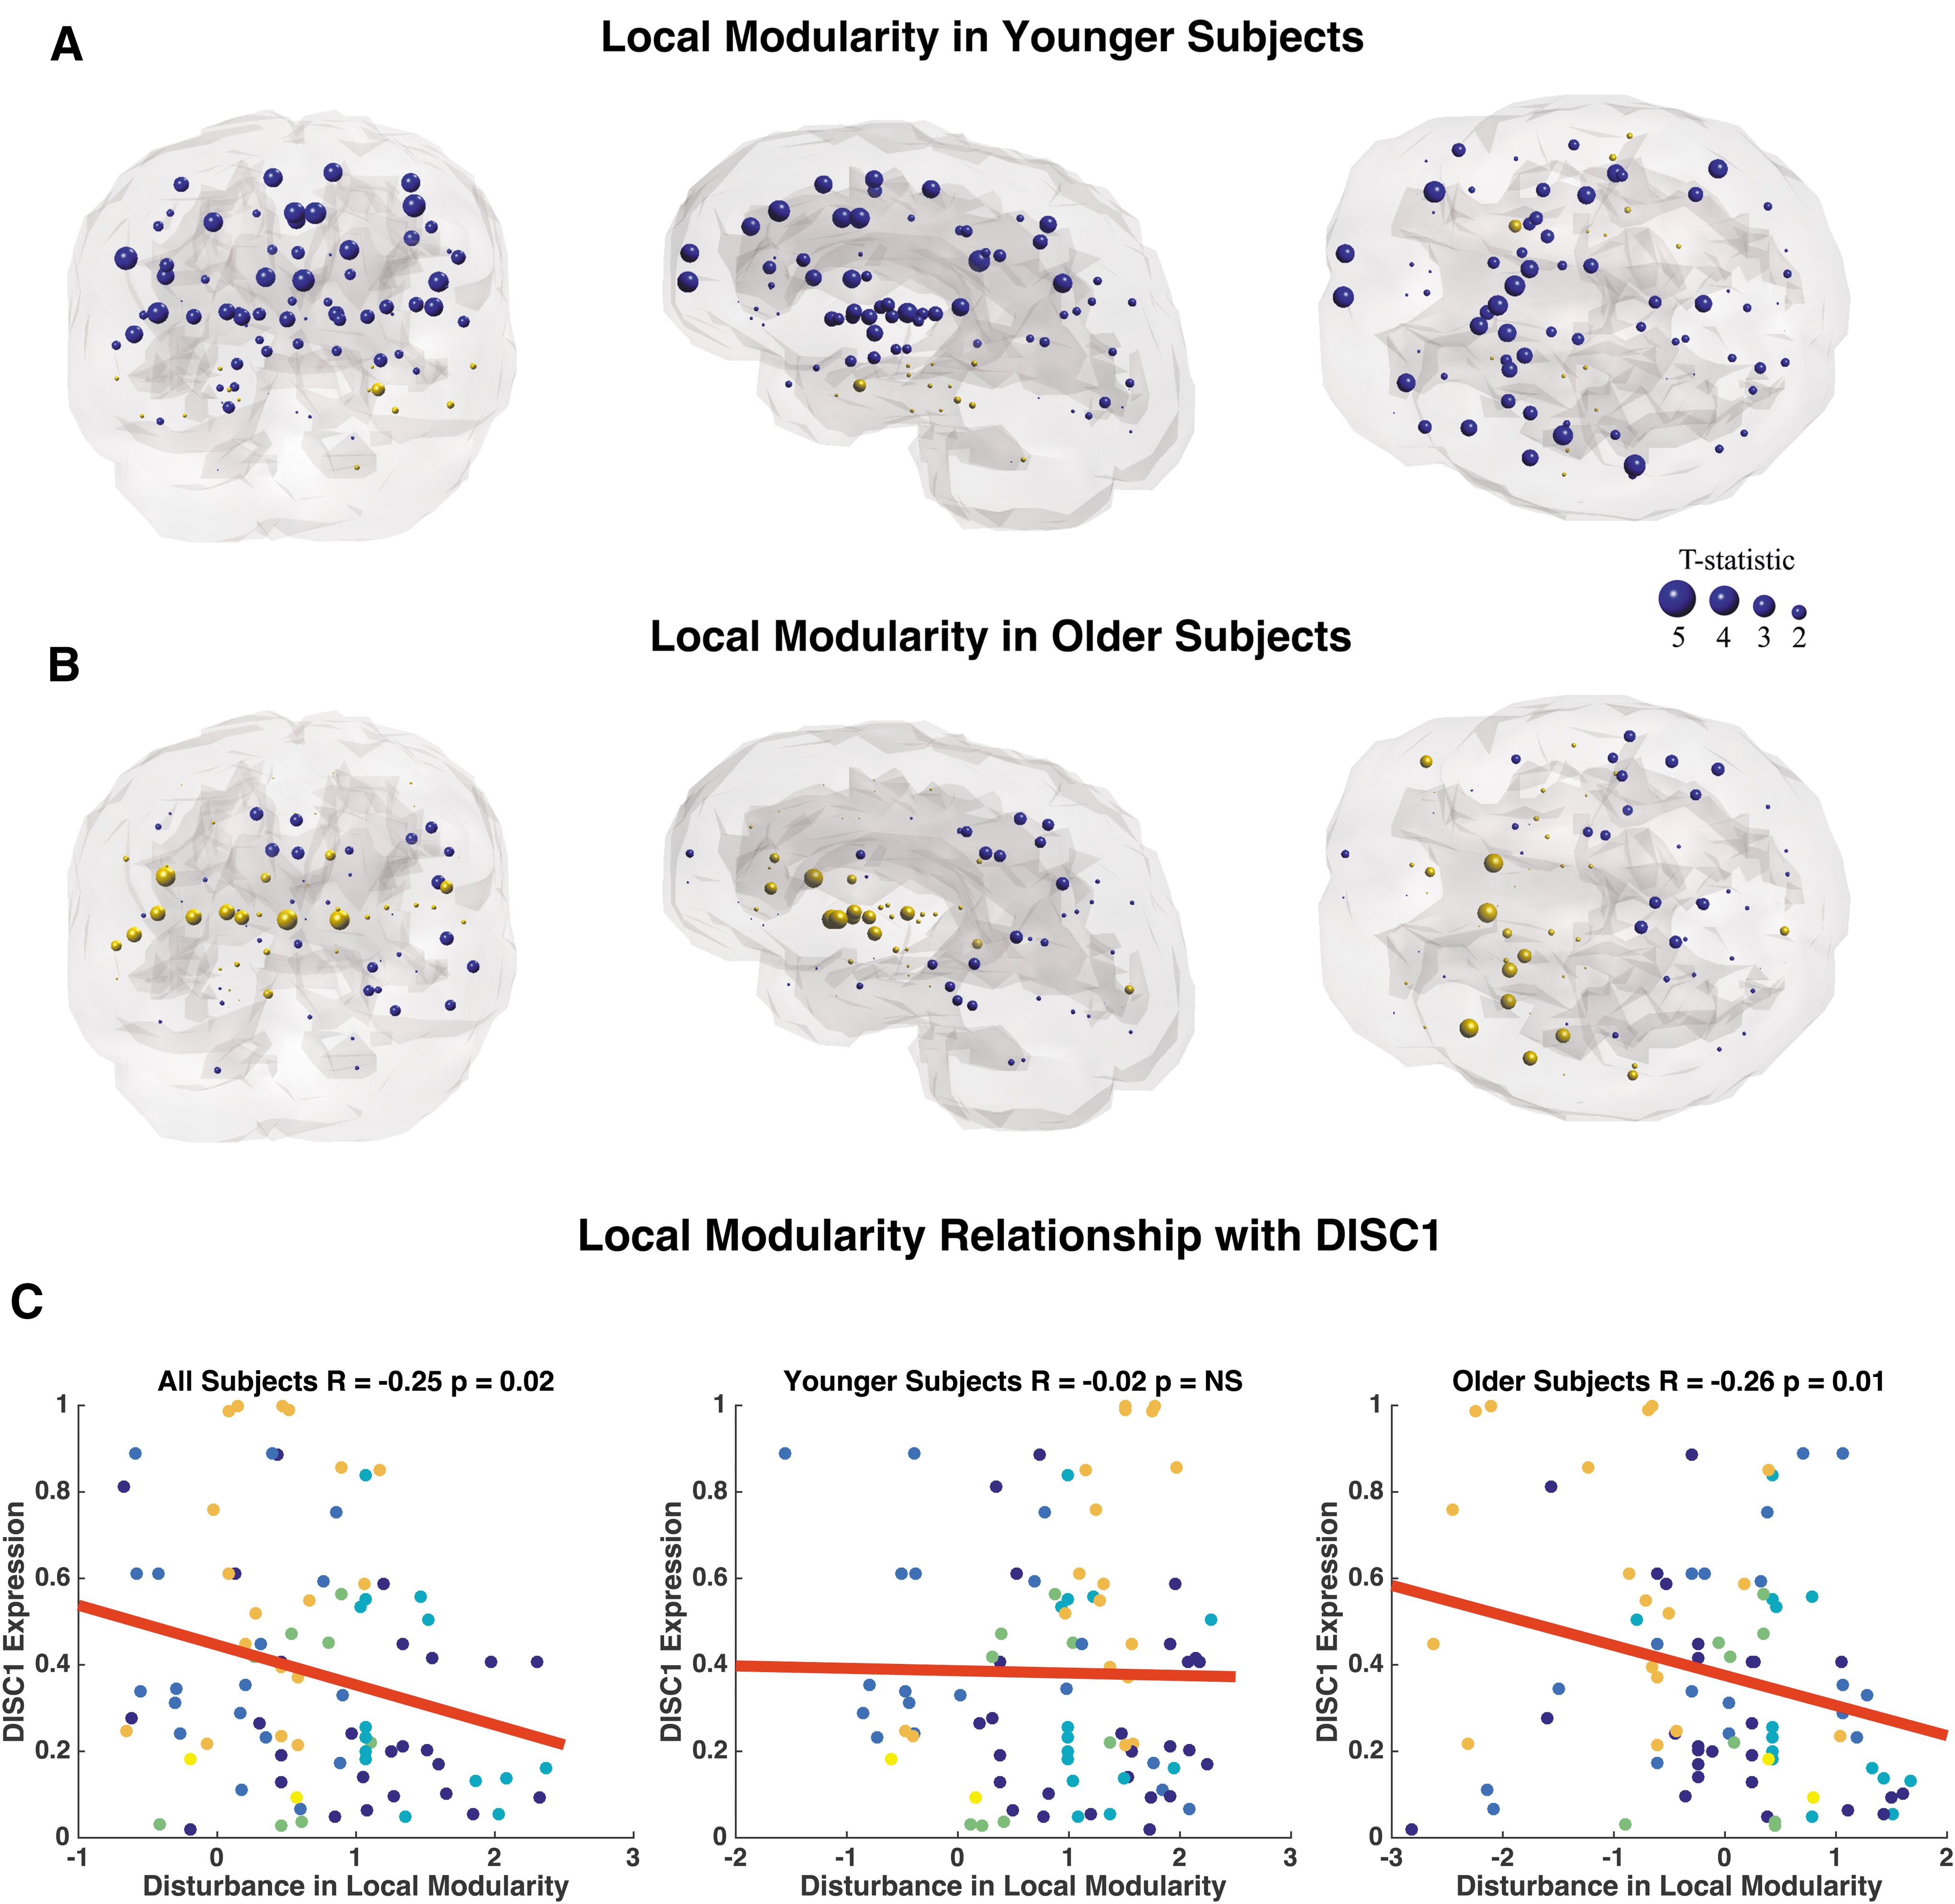
Coronal, sagittal, and axial glass brains with decreased local modularity in patients (blue nodes) and increased modularity in patients (gold nodes) versus controls.
Gray highlight indicates age-related changes in the relationship between gene expression and local modularity.
Survived Bonferroni correction significance threshold of p = 0.016.
Discussion
This study uses DTI, advanced graph theory, and postmortem microarray data in a cross-sectional design to show novel alterations in age-related topological network degradation and its relationship with gene expression in SZ. These findings support popular disconnection models suggesting that WM disruptions underlie pathophysiology in SZ, which compromise network integration throughout the lifespan.
First, we replicate prior findings of disrupted global topology in SZ and preserved small-worldness between patients and controls across all subjects (Supplementary Fig. S1). Previous diffusion MRI and graph theory studies support these findings of abnormal global topology, which, together, suggest a limited capacity of brain information integration in SZ (Bassett et al., 2008; Filippi et al., 2013; Pettersson-Yeo et al., 2011; van den Heuvel et al., 2010; Zalesky et al., 2011). It is believed that such topological differences may be due to the outcome of different growth processes and neurodevelopmental abnormalities in SZ that specifically impact large multimodal cortical organization (Bassett et al., 2008).
Because largest eigenvalue of the adjacency matrix (Supplementary Fig. S1D) and power law alpha (Supplementary Fig. S1E) are novel metrics in the context of DTI and SZ, they will be briefly discussed. Power law alpha is a derivative of degree, and follows previously published results of decreased degree in SZ compared with patients (Fornito et al., 2012). Eigenvalues are a set of characteristic roots associated with a system. Thus, reduced largest eigenvalue of the adjacency matrix (Fig. 2D) across all patients compared with controls suggests a network more vulnerable to insult with decreased information flow and robustness (Navlakha et al., 2014; Restrepo et al., 2007). Because our study is the first to examine these metrics in the present context, these results will benefit from independent replication.
Regression analysis reveals control network topology degrades in a stereotyped manner, whereas corresponding patient networks do not (Fig. 2; Table 2). Owing to the small sample size arising from splitting up the patient group, permutation testing was carried out. Significant age-related differences remained significant after permutation testing with FDR correction in metrics largest eigenvalue of the adjacency matrix and global efficiency.
Prior graph theory analysis of network topology on diffusion MRI data in healthy networks shows a significant positive stereotyped, linear effect of age on network costs (Gong et al., 2009). This suggests that the aging network experiences a linear reduction in overall cortical connectivity, causing it to become less connected. This result converges with our findings of linear degradation in global efficiency in control subjects because networks with higher costs tend to have lower efficiencies (Fig. 2A).
Additional network modeling shows absence of significant network degradation in younger adult patients. In contrast, significant linear network degradation, which more closely resembles control networks, is observed in older adult patients (Fig. 3). Interestingly, global network topology of younger adult patients is significantly compromised when compared with age-matched controls (Fig. 4A–D). This effect is not observed in older patients (Fig. 4E–H). Local analysis reveals that global network abnormalities in younger adult patients are driven by changes in frontal, temporal, and cingulate regions (Figs. 6A, 7A, and 8A). These regional differences become markedly less pronounced in older patients than in age-matched controls (Figs. 6B, 7B, and 8B). Specifically, we observe age-related differences in local connection strength, efficiency, and modularity. Because strength is a metric reflecting total wiring cost of a node, this finding suggests decreased local robustness in SZ, an effect driven by younger patients. Our local efficiency results suggest abnormal control of information flow within frontal, temporal, and cingulate regions of younger patients with SZ (Rubinov and Sporns, 2010). Finally, modularity is a metric of segregation. Hence, reduced modularity findings in younger patients suggest less tightly connected neighborhoods and increased network randomness, which may reflect breakdown of encapsulated information processing underlying abnormal cognitive processes in SZ (Fornito et al., 2012).
Observed local topology disruptions in younger patients converge with DTI studies examining WM integrity, as reflected by fractional anisotropy (FA). It is reported that patients with SZ show globally reduced FA, including in frontal, temporal, and cingulate regions compared with controls (Kochunov and Hong, 2014; Kubicki et al., 2002; Luck et al., 2011; Mori et al., 2007; Price et al., 2008; Szeszko et al., 2008). Indeed, many of these changes are observed at the earliest stages of illness (Kuswanto et al., 2012; Samartzis et al., 2014).
Model of age-related topological degradation in SZ
Our age model of disrupted topology, presented in Figure 9, supports neurodevelopmental hypotheses of SZ, which postulate that a neurodevelopment risk factor of SZ acts during adolescence, disrupting the synaptic reorganization and pruning stages later in life (Kochunov and Hong, 2014). This work shows that younger adult patients (ages 20–37 years) show compromised topology but lack of network degradation, which we believe is evidence of compensatory rewriting, reflective of the dynamic nature of brain networks. There is support for rewiring and extended development into the third decade of life (Petanjek et al., 2011). Further evidence suggests that homeostatic mechanisms can often compensate for one insult by shifting weights in parallel pathways (Marder and Goaillard, 2006; Tononi et al., 1999). Subsequently, older adult patients (ages 38–68 years) show linear degradation of global networks and less pronounced network differences between patients and controls. There is evidence for structural brain changes at different stages of the illness. In line with our results, several cross-sectional studies show that WM deficits in chronic patients are either absent or less severe than in first episode patients (Friedman et al., 2008; Kong et al., 2011).
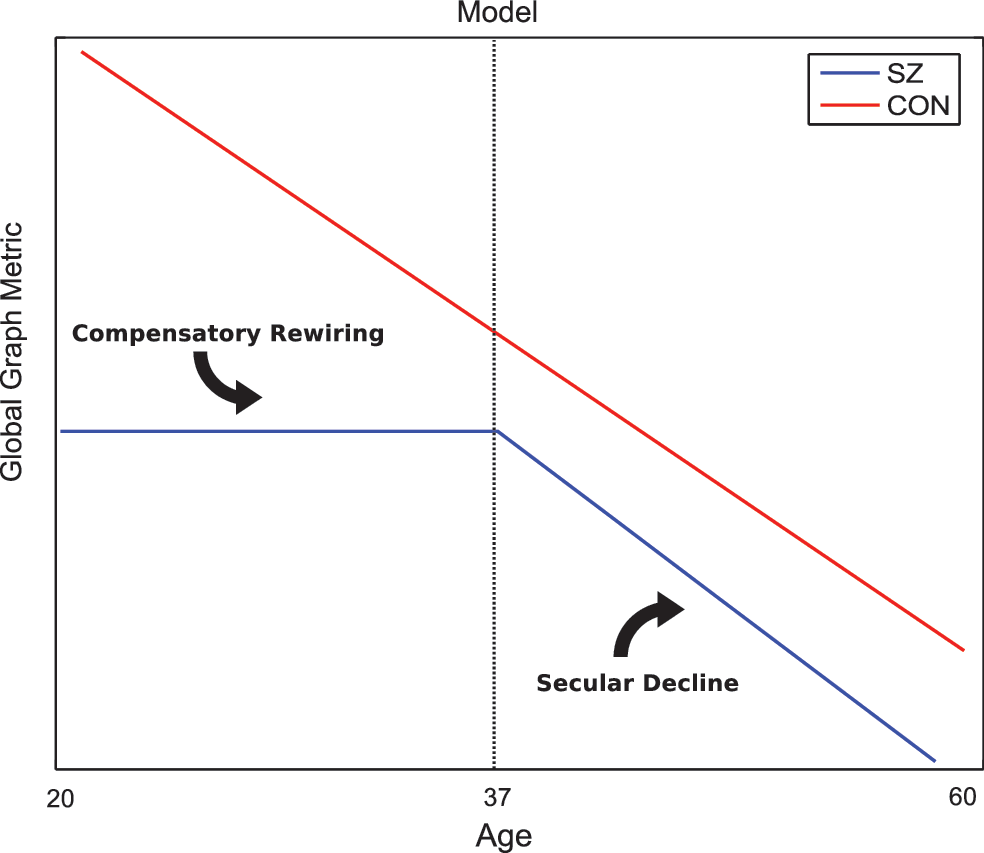
Figure illustrates our model of topographical degradation. Control networks degrade in a constant, linear manner. In schizophrenia, network metrics are stagnant at a significantly compromised level throughout younger adulthood and begin to degrade linearly in old age. Color images available online at
Prior anatomical studies in SZ also support our age model. Graph network findings of anatomical architecture suggest that topological differences between divisions of normal cortex may represent the outcome of different growth processes in SZ, which impact cortical organization (Bassett et al., 2008). Furthermore, in a 19-year longitudinal study of cortical thickness, brain developmental trajectory in patients normalizes with age in posterior regions, while remaining divergent in frontal and temporal regions (Greenstein et al., 2006). Specifically, the diminished posterior anatomical differences represent attenuation of loss with age, and as a result healthy controls appear to “catch up” with patients, as controls also have a parietal-frontal “wave of loss” that characterizes normal development (Gogtay et al., 2004).
Similarly, diffusion MRI studies examining WM integrity (FA) support our age-related WM degradation model. It is suggested that progressive brain abnormalities exist early in the disease and that ongoing brain changes occur in the initial years of diagnosis (Karlsgodt et al., 2008; Kyriakopoulos and Frangou, 2009; Pantelis et al., 2005). Patients early in the SZ disease process show decreased connectivity in structural networks compared with controls, with structural connectivity negatively correlating with illness duration (Zhang et al., 2015). Prior literature shows differences in WM integrity (FA) of the frontal cortex between SZ patients and controls. Differences are most pronounced in the youngest subjects and disappear with increasing age, suggesting age-related differences in WM maturation between groups (Jones et al., 2006). This result was recently replicated and extended in a 300-subject study examining the impact of age on WM integrity in SZ, the largest study of its kind to date. It is reported that FA differences do not appear to progress with age. Converging with our data, controls show a gradual FA decline, whereas patients show a flat relationship in FA decline. Younger patients show lower FA than controls, a difference that disappears with age (Kanaan et al., 2017).
Relationship between age-related topological changes and gene expression
Correlation analysis reveals age-related differences in the relationship between gene expression in our genes of interest and disturbances in logical topology. Although more than 108 common associated loci have been identified with SZ, we specifically tested a priori hypotheses of the six most highly published genes associated with the disease to capture maximum power across thousands of studies and limit type-I error (Ripke et al., 2014).
Our gene-related topological results converge with prior gene findings also utilizing WM networks, which suggest that WM disconnectivity in SZ is a neuron-driven (mal)developmental process (Arikkath and Mirnics, 2017; Romme et al., 2017). Although we performed analysis on six genes of interest, we show that DISC1 is the only gene to consistently illustrate age-related associations with connectivity impairments across all surveyed topological metrics (Figs. 6C, 7C, and 8C). This finding is logical and in line with our a priori hypothesis, as DISC1 is a gene discovered and named for its causative implications in SZ. Specifically, DISC1 is shown to impair neurite outgrowth in vitro and proper development of the cerebral cortex in vivo, suggesting that loss of DISC1 function may underlie neurodevelopmental dysfunction in SZ (Kamiya et al., 2005). Although DISC1 was the only gene with a significant, age-related topological association in local efficiency, we observe that DISC1, DRD2, DTNBP1, and GRM3 all show significant relationships with disturbances in modularity (Table 5). Younger patients show decreased modularity compared with controls, a segregation metric similar to clustering coefficient, and a result replicated in other studies (van den Heuvel et al., 2010). Interestingly, later in the disease, this trend changes in older patients, showing increases in modularity. The corresponding significant relationships with gene expression experience the same sign flip between younger and older subjects (Table 5). DRD2, DTNPB1, and GRM3 are, respectively, implicated in stability of the dopamine receptor, cytoskeletal binding, and metabotropic glutamate receptor 3 (Duan et al., 2003; Guo et al., 2009; Tan et al., 2007). Although strong associations with these genes have been reported in human SZ populations and endophenotypes have been shown in mouse models, mechanistic implications of these genes are less clear (Arinami et al., 1997; Egan et al., 2004; Kellendonk et al., 2009; Straub et al., 2002). Because this is the first study examining the relationship between modularity and gene expression in SZ, this result will benefit from independent replication.
Because COMT and BDNF are reported to mediate WM microstructure disconnectivity in SZ, the lack of relationship between connection strength disturbance in COMT and BDNF is surprising (Table 3) (Chen et al., 2017; Poletti et al., 2016). However, it is not wholly unexpected as FA changes in the same subjects are not reported to be identical to connection strength measurements in SZ (van den Heuvel et al., 2010).
Prior work establishes a precedent that gene networks show associations with regional structural connectivity (Forest et al., 2017). Similarly, a recently published survey of 20,000 genes shows the average transcriptional profile of 85 SZ risk genes is associated with WM connectome disconnectivity (Romme et al., 2017). Dissecting these 85 risk genes into 6 functional classes such as neurodevelopment, synaptic function, and glutamatergic neurotransmission illustrates that only one gene class (calcium signaling) shows a significant relationship between connection strength in SZ. This study did not test age effects. Upon first survey of the entire subject age range of our genes of interest, we similarly observe nonexistent or weak correlations that did not survive Bonferroni correction. However, significant associations emerge when subjects are separated into the older and younger age range. Together, these results support age-related models of WM topological degradation in SZ while also informing genetic underpinnings of age-related changes in connectivity.
Limitations
Some points should be taken into account when interpreting our results. The first is that we acknowledge the possible confounding factor of antipsychotic medications on the observed findings. This study includes a relatively homogenous group with a clinical profile of severe enduring SZ despite being medicated with atypical antipsychotics. However, it remains possible that long-term use of antipsychotic medications contributes to effects observed in older subjects. Although the effect of antipsychotic medications on gray matter volume is well documented, there is relatively little evidence to suggest that antipsychotics changes WM microstructure (Navari and Dazzan, 2009). To some extent, the effect of duration of medication is reflected in our results, since all our reported graph metrics are reported by age. Additional analysis examining the relationship between medication strength/duration and graphics metrics was not feasible in this study, but this is the subject of ongoing and future work. We do note that prior work in these subjects suggested no relationship between medication strength and WM microstructure. Specifically, previous analysis carried out in this subject cohort showed no correlation between patient FA and chlorpromazine equivalents for each patient's medication status (Holleran et al., 2014). Although these two studies are not directly comparable due to differences in cohort size and analysis metrics, the previous negative result indicates that a thorough exposition of medication response and graph metrics will require a detailed and careful analysis on a larger cohort than currently available. Such a demonstration of linkage to mechanisms of treatment response could be very valuable.
The second point to take into account is that global graph metrics are not independent. Graph theory measures depend on the network density and thresholding of weak connections. In this study, we chose not to vary the threshold to test for robustness because weak synaptic connections have been suggested to be critical for the expression of plasticity within a network (Poirazi and Mel, 2001).
Limitations of the study include the small patient sample size and that reported local effects did not survive FDR correction. The issue of small sample size was addressed by extensive permutation testing, which is applicable to very small sample sizes (Legendre et al., 2012). Owing to the multiple thousands of voxels that are tested, lack of survival of FDR correction is a frequently reported phenomenon in structural connectomics (Dennis et al., 2013; van den Heuvel et al., 2010; Verstraete et al., 2011; Zou et al., 2008). Although alternative correction methods to reduce family-wise error rate have been proposed, none have been extensively adopted (Zalesky et al., 2010). An additional limitation of this study is its cross-sectional design, which does not control for age of onset and medication history between patients. However, all subjects were relatively homogenous with SZ diagnosis. All patients were chronic and treatment resistant, being considered for a trial of clozapine. It is our hope that these findings provide a basis for future studies involving a longitudinal experimental design.
Footnotes
Acknowledgments
We gratefully acknowledge funding from the National University of Ireland Galway Millennium Project Fund (C.M.) and a fellowship award from the Ford Foundation (F.P.). A.R. and F.P. were partially supported by the NIH grant RO1 NS092802.
Author Disclosure Statement
No competing financial interests exist.
References
Supplementary Material
Please find the following supplemental material available below.
For Open Access articles published under a Creative Commons License, all supplemental material carries the same license as the article it is associated with.
For non-Open Access articles published, all supplemental material carries a non-exclusive license, and permission requests for re-use of supplemental material or any part of supplemental material shall be sent directly to the copyright owner as specified in the copyright notice associated with the article.