
Abstract
High-frequency repetitive transcranial magnetic stimulation (HF-rTMS) has gained great interest in multiple clinical and research fields and is believed to accomplish its effect by influencing neuronal networks. The dorsolateral prefrontal cortex (dlPFC) is frequently chosen as the cortical target for HF-rTMS. However, very little is known about the differential effect of HF-rTMS over the left and right dlPFC on intrinsic functional connectivity networks in patients or in healthy individuals. The current study assessed the differential effects of left or right HF-rTMS (corrected for sham) on intrinsic independent component analysis (ICA)-defined functional connectivity networks in a sample of 45 healthy individuals. All subjects had a first scanning session in which baseline functional connectivity was assessed. During the second session, individuals received one session of left, right, or sham dlPFC HF-rTMS (60 5-sec trains of 10 Hz at 110% motor threshold). The sham condition was used to correct for time and placebo effects. ICAs were performed to assess baseline differences and stimulation effects on within- and between-network functional connectivity. Stimulation of the left dlPFC resulted in decreased functional connectivity in the salience network, whereas right dlPFC stimulation resulted in increased functional connectivity within this network. No differences between left or right dlPFC stimulation were found in between-network connectivity. These results suggest that left and right HF-rTMS may have differential effects, and more research is needed on the clinical consequences.
Introduction
N
Previous studies have shown that the beneficial effects of HF-rTMS are probably accomplished by influencing entire neuronal networks instead of single brain regions (Fox et al., 2012). One way to investigate the effect of HF-rTMS on the network level is by means of resting-state functional magnetic resonance imaging (rsfMRI; Fox et al., 2012; Jansen et al., 2015). During an rsfMRI scan, participants are instructed to relax and think of nothing in particular while their level of spontaneous brain activity is measured (van den Heuvel and Hulshoff Pol, 2010). Regions showing synchronized activity during rest are thought to be functionally linked (Deco et al., 2011) and reflect the resting-state networks of the brain (Raichle et al., 2001; van den Heuvel et al., 2009).
The dorsolateral prefrontal cortex (dlPFC) is frequently chosen as cortical target for HF-rTMS, as it is part of the control network, also referred to as the frontoparietal network (FPN). The effect of HF-rTMS on resting-state functional connectivity is primarily analyzed with seed-based correlation or independent component analysis (ICA; Joel et al., 2011; Rosazza et al., 2012). When analyzing functional connectivity using seed-based connectivity, the blood oxygen-level-dependent (BOLD) time course of one a priori defined region is temporarily correlated with the BOLD time courses of all other voxels in the brain (Joel et al., 2011). Voxels that coactivate with this seed region during rest are considered to be functionally connected (Joel et al., 2011; Rosazza et al., 2012). Contrary, when using data-driven ICA method, the whole-brain BOLD response is decomposed into intrinsic networks using sophisticated algorithms (Fox and Raichle, 2007) revealing the connectivity within and between these networks (Joel et al., 2011). Both methods should in theory result in similar conclusions, but in practice, slight differences between the methods are observed (Rosazza et al., 2012). The main disadvantage of seed-based connectivity analysis compared with ICA is the arbitrary selection of a seed region (Fox and Raichle, 2007), which raises questions about replicability and whether this seed best represents the network of interest (Neha and Gandhi, 2016). Furthermore, seed-based connectivity does not take into account whether or not the significant voxels are part of an intrinsic network (Neha and Gandhi, 2016). The seed-based connectivity method may, however, be preferred over ICA if one is interested in the functional connectivity of one specific seed (brain area) in a network. On the contrary, since ICA does not require arbitrary seed selection and intrinsic functional connectivity networks of the entire brain are considered, ICA might be the preferred method.
Currently, there is only one seed-based connectivity and one ICA study assessing the effects of right dlPFC TMS on functional connectivity. The seed-based connectivity study in healthy individuals showed increased connectivity between the right dlPFC and the right caudate head (seed within the reward network [RN]; Esslinger et al., 2014). We recently investigated the effect of a single session of HF-rTMS over the right dlPFC through ICA in healthy individuals. In this study, no effect of HF-rTMS on between- and within-network connectivity was found (Jansen et al., 2015). No studies thus far have looked into the effect of left dlPFC HF-rTMS on resting-state functional connectivity of healthy individuals measured with seed-based connectivity or ICA. There are, however, some studies (Gratton et al., 2013; Hanlon et al., 2013; Paus et al., 2001) assessing the spreading effect of TMS over the dlPFC on brain activity in healthy individuals using a variety of other stimulation variants (e.g., theta burst TMS [3 bursts of 50 Hz repeated every 200 ms: Oberman et al., 2011; Rossi et al., 2009]; single pulse TMS [one single pulse at a time: Rossi et al., 2009]) and other assessment techniques (e.g., cerebral blood flow measured with positron emission tomography; stimulation during magnetic resonance scanning). Their results indicate that TMS over the left dlPFC may also increase resting-state connectivity within the left FPN (LFPN) and between the left dlPFC and areas of the default mode network (DMN) and salience network (SN). Both these networks are involved in self-referential processing, in which the SN mediates attention shifting between external (LFPN and right FPN [RFPN]) and internal (DMN) processes (Menon and Uddin, 2010). Furthermore, changes in resting-state connectivity between the left dlPFC and areas of the RN and RFPN were observed.
Due to the benefits of the data-driven ICA compared with seed-based connectivity analysis (no arbitrary seed selection and consideration of intrinsic functional connectivity networks) and the increased popularity of HF-rTMS in clinical populations, the current study will assess the differential effects of left or right dlPFC HF-rTMS (corrected with sham) on intrinsic ICA-defined functional connectivity networks in a sample of healthy individuals. More specifically, rsfMRI data from 45 healthy individuals will be collected at baseline and after sham, left or right dlPFC stimulation. Differential changes in resting-state connectivity within and between the LFPN, RFPN, DMN, SN, and RN will be analyzed using ICA. Considering the previous findings (Esslinger et al., 2014; Gratton et al., 2013; Hanlon et al., 2013; Paus et al., 2001), we hypothesize increased functional connectivity between the RFPN and RN after right dlPFC stimulation and increased functional connectivity between the LFPN and the SN, DMN, RN, and RFPN after left dlPFC stimulation.
Materials and Methods
Participants
Forty-five healthy participants aged between 18 and 65 years were recruited through Internet and social media advertisements and included in this study. Subjects were screened for eligibility based on the following exclusion criteria: any current Diagnostic and Statistical Manual of Mental Disorders-IV psychiatric disorder (anxiety disorder, major depressive disorder, and substance abuse or dependence) according to the composite international diagnostic interview (World Health Organization, 1990), MRI contraindications (such as metal implants or claustrophobia), and TMS contraindications (such as [familial] history of epilepsy or metal implants located around the skull). The study was approved by the local Medical Ethics Committee of the Academic Medical Center of the University of Amsterdam. Participants signed informed consent before participation and were reimbursed with €100 after participation.
Study design
The study was a randomized, single-blind trial with two sessions (Fig. 1). During the first session, demographic data were obtained and a baseline rsfMRI scan was performed. During the second session—which took place at least 2 weeks after the first session, subjects were randomized to sham dlPFC HF-rTMS (n = 15), left active dlPFC HF-rTMS (n = 15), and right active dlPFC HF-rTMS (n = 15) directly followed by a second rsfMRI scan. In both sessions, the rsfMRI scan was performed subsequently to an emotion regulation task lasting ∼20 min. Although carryover effects from cognitive tasks have been reported in rsfMRI research, this effect would be similar between all stimulation groups. Therefore, our between-group comparison is not affected by these carryover effects. The rTMS effects can be measured 90 min after stimulation (Klomjai et al., 2015); in another study from our group with the same design, we also found changes in resting-state connectivity after performance of the emotion regulation task (Jansen et al., 2015), implying that changes in resting-state connectivity induced by HF-rTMS are detectible after performance of the emotion regulation task.
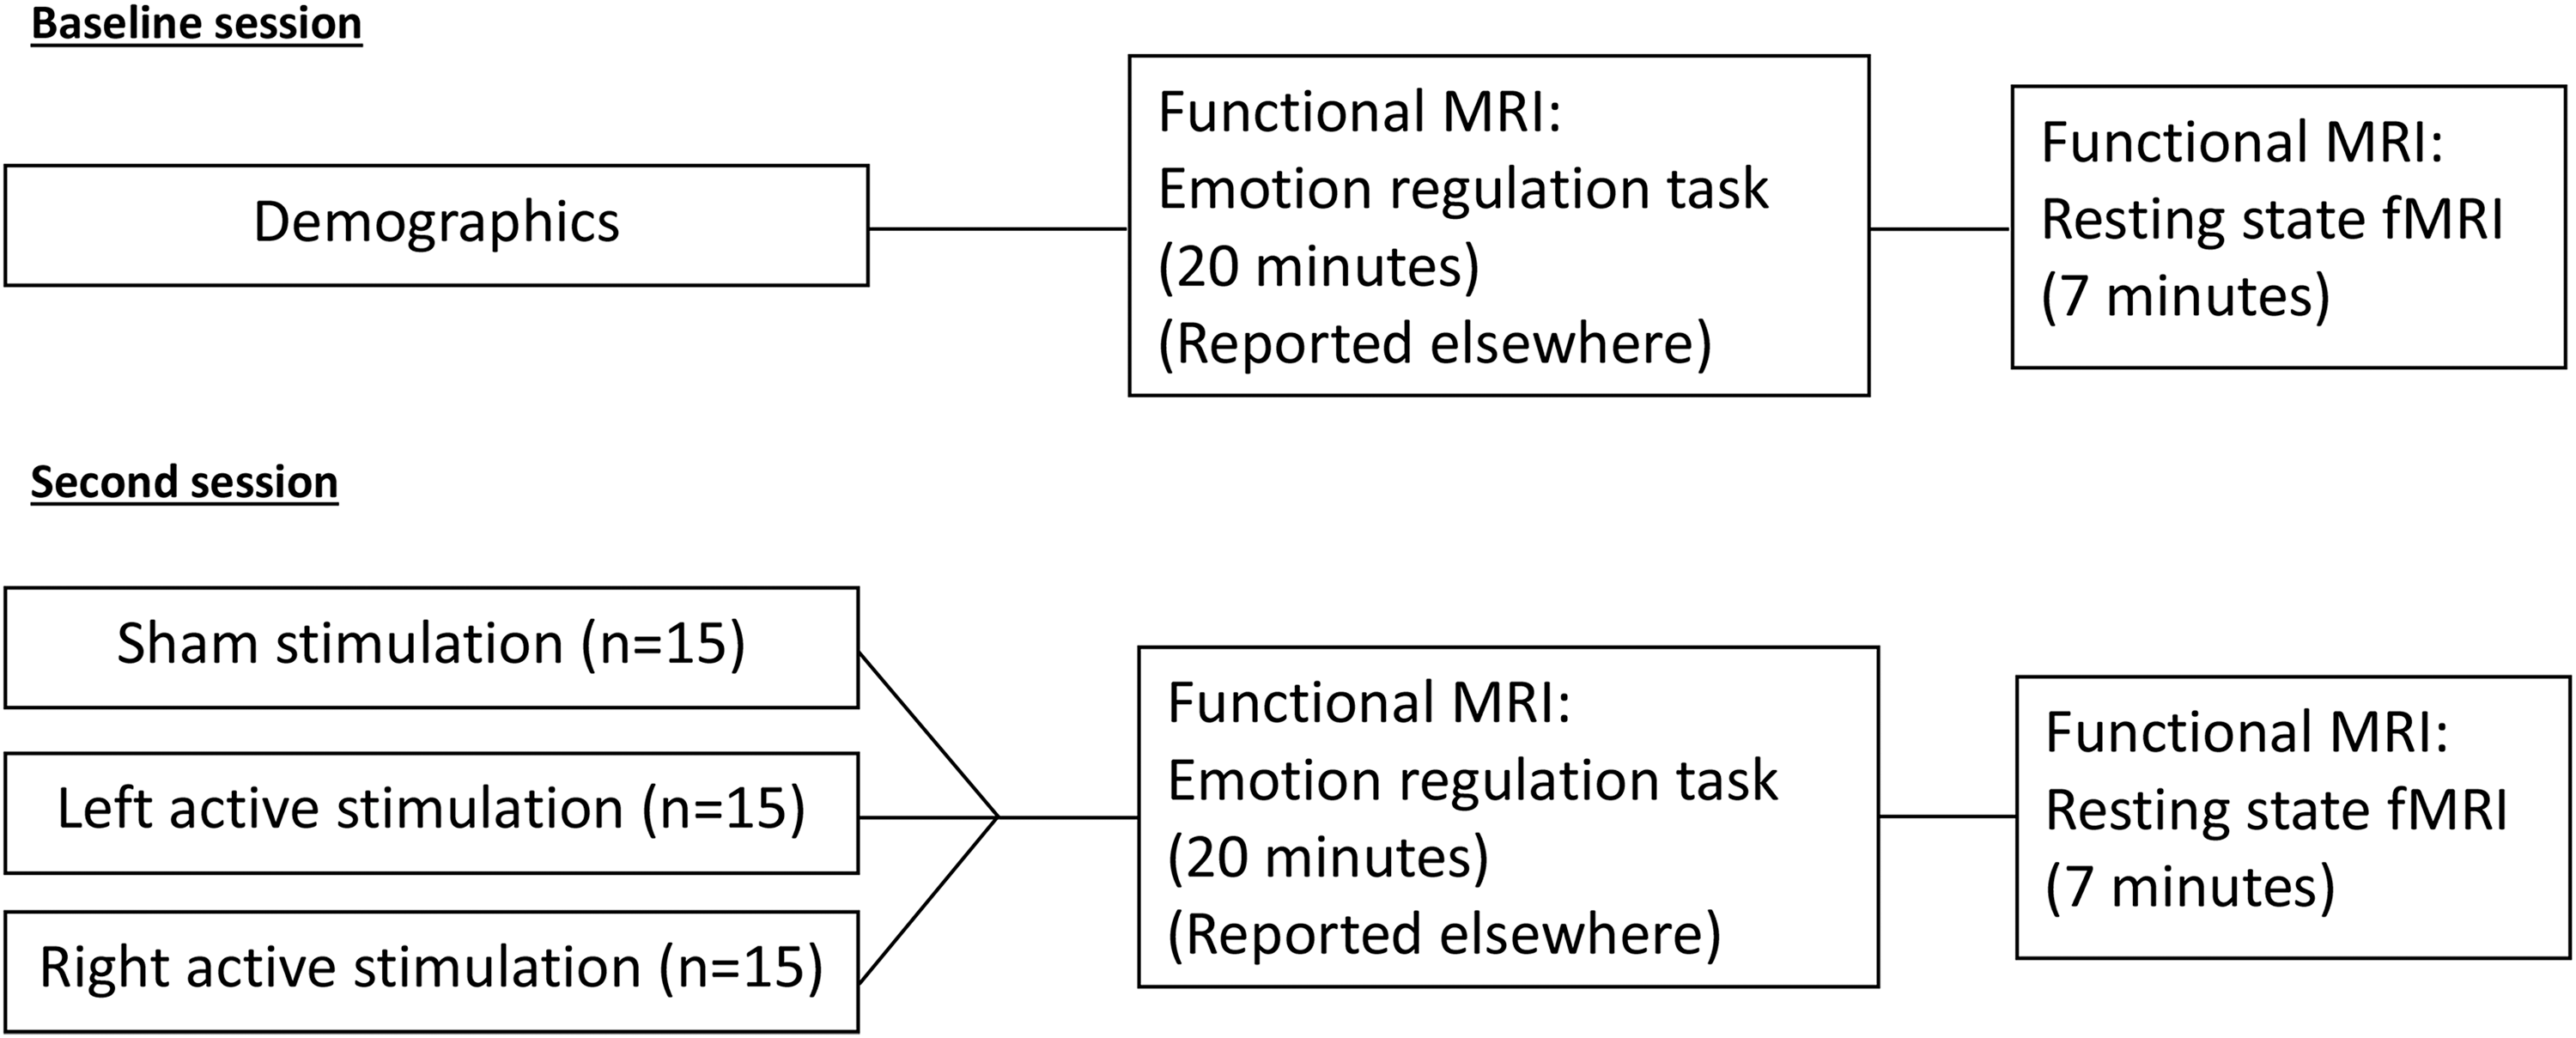
Study design. The baseline and second session were separated by at least 2 weeks. The rsfMRI was performed after an emotion regulation task was conducted. rsfMRI, resting-state functional magnetic resonance imaging.
Repetitive transcranial magnetic stimulation
The dlPFC HF-rTMS was performed by using a MagStim Rapid2 Air-film biphasic coil with a 70 mm diameter (MagStim Co., UK), applying sixty 10 Hz trains of 5 sec at 110% of the motor threshold, which is in line with the international safety limits for use of rTMS (Rossi et al., 2009). The stimulation hotspot was determined using the emotion regulation task performed during the first session. During this task, participants were shown valenced pictures and were instructed to attend or regulate the emotions associated with these images. During an “attend trial,” participants had to experience emotions in a natural manner, while during a “regulate trial,” participants were instructed to reinterpret the emotions in a more neutral/less emotional way (reappraisal; Ochsner and Gross, 2005). To determine the stimulation hotspot, the “regulate trials” were contrasted with the “attend trials.” Subsequently, the most significant voxel within the right or left dlPFC mask [as defined by the BrainMap database (Fox and Lancaster, 2002), see Supplementary Fig. S1 for the masks] was selected for (sham or active) stimulation. Coordinates of this left or right dlPFC voxel served as the functionally defined hotspot. During stimulation, neuronavigation (Visor2, ANT) was used to guarantee correct stimulation location. For the sham condition, the same procedure as active stimulation was used, but the rTMS coil was tilted at 90° relative to the skull (Berlim et al., 2013).
Analysis of sample characteristics
Possible group differences in age and education were tested with analysis of variance, whereas differences in sex distribution were tested with a Pearson's chi-squared test. Given the limited sample size and the intention to rigorously control for potential confounders, significance was set at p < 0.10 and analyses were performed with Statistical Package for the Social Sciences (SPSS; IBM SPSS Statistics for Windows, Version 22.0, Armonk, NY).
Resting-state fMRI
Data acquisition
Scanning was performed on a Phillips Achieva 3 Tesla scanner at the Spinoza Imaging Centre, Amsterdam, The Netherlands. During rsfMRI, participants were instructed to close their eyes, not think of anything in specific, and stay awake. The rsfMRI data acquisition took 7 min and was performed to acquire BOLD signals using a field-echo EPI sequence (210 dynamics, echo time [TE] = 27.63 ms; repetition time [TR] = 2000 ms; field of view [FOV] = 240 × 240 mm, 37 3 mm slices, 0.3 mm slice gap; 80 × 80 matrix; flip angle = 76.1°). These T2-weighted images were oriented axially along the anterior-commissure to the posterior-commissure line. In addition to the rsfMRI, we acquired T1-weighted 3D data sets for anatomical reference (TR = 8.196 ms, TE = 3.73 ms, FOV = 140 × 188 × 220 mm, matrix 240 × 187, flip angle = 8°, slice thickness = 1 mm, number of slices = 220).
Preprocessing of rsfMRI
Preprocessing was comparable to a previous article on the effect of rTMS on rsfMRI in alcohol-dependent patients and healthy controls (Jansen et al., 2015). In addition to these preprocessing steps, the data were analyzed with fsl motion outliers using default settings to adjust for excessive movement during scanning. The output parameters of this program include individual covariates for excessive movement, which were used in fsl feat to regress out any dynamics in which the participants moved excessively. These motion-corrected data were subsequently used to estimate 25 independent components (also referred to as spatial maps) by the MELODIC toolbox from the fMRI of the Brain Software Library (FSL; Jenkinson et al., 2012) to perform ICA. These 25 components can be interpreted as underlying brain networks. The degree to which a voxel belongs to, or is functionally connected to a brain network, is represented by the value of each voxel (Iraji et al., 2016). The 25 components obtained included the five components of interest (identified through visual inspection): LFPN, RFPN, DMN, SN, and RN (Supplementary Fig. S2–S6 for these networks).
Within network
Assessing baseline rsfMRI differences
Dual regression and FSL randomize were used to test for possible group (sham, left, right) differences in within-network connectivity at baseline. Dual regression was used to identify subject-specific temporal dynamics and associated spatial maps during each subject's first session rsfMRI (Beckmann et al., 2009; Filippini et al., 2009). For the components of interest (LFPN, RFPN, DMN, SN, and RN), nonparametric permutation testing (5000 permutations) was used to test for between-group differences in functional connectivity before stimulation. This method of analysis was in correspondence with our previous work (Jansen et al., 2015), although there are some minor differences due to our current design with three groups and the significant age difference between groups. Therefore, both age and education were demeaned and included as covariates. Given the five networks of interest, significance was set at a Bonferroni corrected p < 0.01 (p = 0.05/5).
Assessing stimulation effects
Dual regression and FSL randomize were also used to test the effect of stimulation group on changes in within-network connectivity (connectivity after stimulation minus connectivity before stimulation) in the LFPN, RFPN, DMN, SN, and RN. Significant effects were followed up by extracting the individual mean values with FSL maths and imported in SPSS. To account for time and placebo effects, the mean change in resting-state connectivity for the sham stimulation group was subtracted from the individual scores for the left and right dlPFC stimulation groups. Again, both age and education were demeaned and included as covariates. Differences between left and right dlPFC stimulation were tested with an independent sample t-test. Given the five networks of interest, significance was set at a Bonferroni corrected p < 0.01 (p = 0.05/5).
Between network
Assessing baseline rsfMRI differences
Again, dual regression and FSL randomize were used to test for possible group (sham, left, right) differences in between-network connectivity at baseline. Age and education were demeaned and included as covariates. Significance was again set at a Bonferroni corrected p < 0.01 (p = 0.05/5). Between-network correlations were obtained through MATLAB (r2014a) by correlating the individual time courses among LFPN, RFPN, DMN, SN and RN and corrected for all other ICA networks, preventing possible bias from indirect correlations between networks. The individual correlation coefficients per subject were imported into SPSS and one-sample t-tests were carried out to assess the significance of the between-network correlations at baseline. For networks with significant between-network correlations, the baseline differences between the stimulation groups (left, right, sham) were assessed with analysis of covariance (ANCOVA), including age and education as covariates. Significance was again set at a Bonferroni corrected p < 0.01 (p = 0.05/5).
Assessing stimulation effects
For networks with significant between-network correlations at baseline, we assessed the differential effects of left and right dlPFC HF-rTMS relative to sham stimulation. To account for time and placebo effects, the mean change in resting-state between-network connectivity for the sham stimulation group was subtracted from the individual scores for the left and right dlPFC stimulation groups. A repeated-measures ANCOVA, including network connection (7 combinations) and session (Baseline Session/Stimulation Session) as a within-subject factors, stimulation group (left/right dlPFC), was included as between-subjects factor, while age and education were included as covariates. Significance was again set at a Bonferroni corrected p < 0.01 (p = 0.05/5).
Results
Sample characteristics
The final sample of participants ranged from 23 to 60 years old (Table 1 for distribution per group). The three stimulation groups differed significantly in age (F(2, 42) = 5.23, p = 0.009) and years of education (F(2, 42) = 2.39, p = 0.10). The groups were not significantly different in gender ratios (χ 2(2, n = 45) = 0.54, p = 0.77; (Table 1). Given these findings, age and education were included as covariates in the rsfMRI analysis. The extracted values used for the SPSS analyses are therefore already adjusted for these group differences.
The values of gender represent the ratio of male: female, whereas the values for education and age are denoted as mean (SD) and age range (lowest–highest).
SD, standard deviation.
Within network
Differences in baseline rsfMRI
At baseline, the three stimulation groups (sham, left, right) did not differ in their within-network resting-state connectivity of the five networks of interest (RFPN, LFPN, DMN, SN, and RN).
Differences in rsfMRI after stimulation
After stimulation, a significant differential effect between left (mean [M] = −6.83, standard deviation [SD] = 16.40) and right (M = 10.3, SD = 7.10) dlPFC stimulation in within-SN connectivity was observed (t(28) = 3.71, p < 0.001; Fig. 2b). Right dlPFC stimulation led to increased functional connectivity within the SN, whereas left dlPFC stimulation led to decreased functional connectivity within the SN.
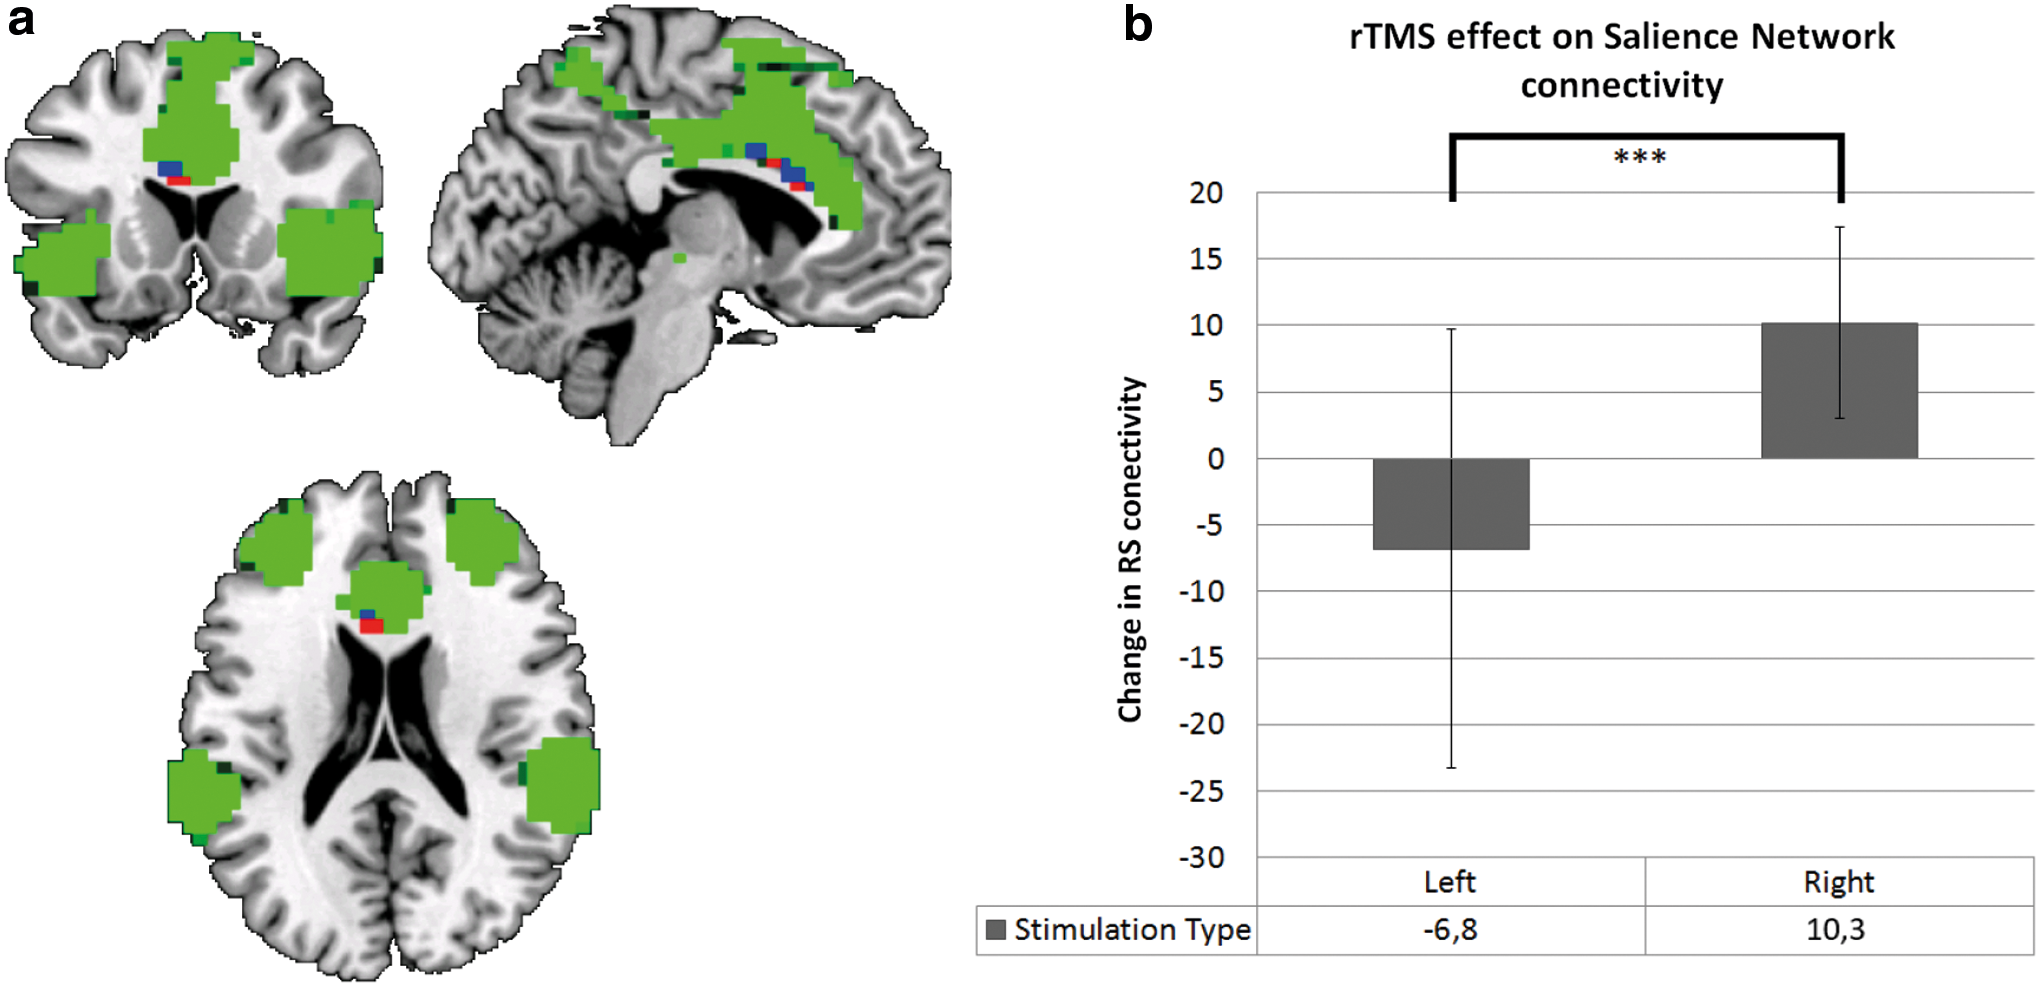
Differential rTMS effect on within-SN connectivity. The left figure
Between network
Differences in baseline rsfMRI
The one-sample t-tests showed a significant correlation between most networks (Table 2), except between the LFPN and the DMN and RN, and between the SN and RN. ANCOVA revealed that the three stimulation groups (sham, left, right) did not differ in their resting-state connectivity between the networks at baseline (Table 3).
Significant at p < 0.005, **Significant at p < 0.001.
LFPN, left frontoparietal network; RFPN, right frontoparietal network; DMN, default mode network; SN, salience network; RN, reward network.
Mean values are uncorrected for age and education, but the significance tests are corrected for age and education. Significant at p < 0.01.
Differences in rsfMRI after stimulation
The repeated-measures ANCOVA did not reveal a significant three-way interaction between network connection (between-network correlations), stimulation group (left, right), and session (F(1, 21) = 0.46, p = 0.83). Separate repeated-measures ANCOVAs per between-network connection were computed for exploratory purposes, but stimulation group (left, right) did not affect between-network connectivity (p > 0.01 for all comparisons).
Age distribution
Due to the significant age differences between our stimulation groups, a subgroup analysis was conducted with more homogeneous subgroups ranging from 30–60 years of age; right (n = 12), sham (n = 15), and left (n = 10). These groups did not differ significantly in age (F(1, 36) = 1.644, p = 0.21). The results were similar to those previously reported, and we therefore conclude that age distribution did not affect our results.
Discussion
This is the first sham-controlled study investigating the differential effects of one session of left or right dlPFC HF-rTMS on intrinsic functional connectivity networks in a sample of healthy individuals. There was a differential effect of left versus right dlPFC HF-rTMS regarding within-network resting-state connectivity with an increase in within-network connectivity in the SN after right dlPFC stimulation and a decrease in within-network connectivity in the SN after left dlPFC stimulation. No differential effect of left versus right dlPFC HF-rTMS was found on resting-state connectivity within the LFPN and RFPN, and DMN and RN. Also, no differential effect of left versus right dlPFC HF-rTMS was found regarding between-network resting-state connectivity.
Stimulation of either the left or the right dlPFC (compared to sham stimulation) thus seems to lead to opposite effects, respectively, decreasing or increasing, resting-state connectivity within the SN. The SN is involved in directing attention between internal (DMN) and external processes (LFPN and RFPN; Menon and Uddin, 2010). Previous studies investigating the effect of functional connectivity changes on cognitive functioning in aging (Onoda et al., 2012), epilepsy (Englot et al., 2016), and spatial neglect (He et al., 2007) have found that a decrease in functional connectivity is associated with worsened cognitive functioning. In the current study, decreased functional connectivity within the SN after left dlPFC stimulation may therefore indicate weakened functioning resulting in worse switching between internal and external processes, whereas right dlPFC stimulation increased functional connectivity within the SN, which may be beneficial in directing the attention between the FPNs and the DMN. Unfortunately, the current study did not incorporate any measures of cognitive functioning, and therefore, the effects of increased functional connectivity within the SN on cognitive functioning are unknown. Future studies should implement questionnaires and/or neurocognitive tasks to be able to relate changes in functional connectivity to changes in cognitive functioning.
The current study did not find an effect of left versus right dlPFC HF-rTMS on resting-state connectivity within both FPNs, DMN and RN, nor did it detect any changes in between-network connectivity after one session of left or right dlPFC HF-rTMS. The discrepancy between our hypotheses and the results might be explained by differences in stimulation protocols. The working mechanisms of single-pulse TMS, theta-burst TMS, and rTMS may differ in their neurobiological effects. For example, theta-burst TMS is believed to induce longer lasting effects reached in less stimulation time and lower frequencies compared with standard HF-rTMS (Ying-Zu Huang et al., 2007), whereas single-pulse TMS is thought to only have an effect at the time of stimulation (Pascual-Leone et al., 2002). These different effects might in turn result in different effects on intrinsic functional connectivity when compared to HF-rTMS. Therefore, results obtained with one TMS technique cannot be generalized to the effect of another TMS technique.
In contrast to previous seed-based connectivity studies, we did not find any effect of rTMS on several within- and between-network connectivity measurements. Since, ICA and seed-based connectivity analyses differ in their focus on intrinsic networks and seed-based correlations with all other voxels in the brain, it is possible that ICA-defined networks, compared with seed-based connectivity analysis, are less sensitive to changes in network connectivity at a lower (e.g., voxel) level. Previously reported significant voxel to voxel correlations found with seed-based connectivity (Esslinger et al., 2014; Gratton et al., 2013; Hanlon et al., 2013; Paus et al., 2001) might therefore be too small to be detected with ICA. Future studies should therefore take into account these methodological differences and base hypotheses on studies using similar techniques and analysis methods.
A recent study investigating the effect of one session of HF-rTMS over the right dlPFC in alcohol-dependent patients using ICA found increased functional connectivity within the LFPN in the alcohol-dependent group, but no effect was found in the healthy control group (Jansen et al., 2015). This may imply that one single session of HF-rTMS is enough to induce changes in a patient population, whereas it is not enough to induce functional connectivity changes in healthy subjects. Indeed, at the behavioral level, this is supported by a meta-analysis of Guse et al. (2010) showing that patient populations tend to benefit more from TMS than healthy individuals. This behavioral effect in clinical populations might be explained by the underlying neurobiological disruptions, including disruptions in functional connectivity. Therefore, multiple subsequent sessions could be required to induce changes in the within- and between-network functional connectivity of healthy individuals if measured with ICA. Since in clinical practice most studies address the possibility of multiple HF-rTMS sessions as add-on treatment (Gaudeau-Bosma et al., 2013), it is important to also study the effect of multiple HF-rTMS sessions in healthy individuals to provide a better insight into the working mechanisms in the healthy brain.
Conclusion
The results of the current study showed that HF-rTMS over the right dlPFC increases functional connectivity within the SN, whereas left dlPFC stimulation decreases functional connectivity within this network. HF-rTMS did not affect within- or between-network connectivity in any of the other investigated networks. These results show that left and right HF-rTMS may have opposing effects and that future (clinical) studies should take this into account.
Footnotes
Acknowledgments
This study was supported by an innovative VIDI grant to AEG (grant number: 91713354) and an ERAB grant (grant number: EA 1027).
Author Disclosure Statement
No competing financial interests exist.
References
Supplementary Material
Please find the following supplemental material available below.
For Open Access articles published under a Creative Commons License, all supplemental material carries the same license as the article it is associated with.
For non-Open Access articles published, all supplemental material carries a non-exclusive license, and permission requests for re-use of supplemental material or any part of supplemental material shall be sent directly to the copyright owner as specified in the copyright notice associated with the article.