
Abstract
The parieto-insular vestibular cortex (PIVC) and the posterior insular cortex (PIC) are key regions of the cortical vestibular network, both located in the midposterior section of the lateral sulcus. Little is known about the structural connectivity pattern of these areas. We used probabilistic fiber tracking based on diffusion-weighted magnetic resonance imaging (MRI) and compared the ipsilateral connectivity of PIVC and PIC. Seed areas for the tracking algorithm were identified in each brain by functional MRI activity during caloric and visual motion stimulation, respectively. Cortical track terminations were investigated by a surface-based approach. Both PIVC and PIC shared ipsilateral connections to the insular/lateral sulcus, superior temporal cortex, and inferior frontal gyrus. However, PIVC showed significantly more connections than PIC with the anterior insula and Heschl's gyrus in both hemispheres and with the precuneus, intraparietal sulcus, and posterior callosum of the right hemisphere. In contrast, PIC connectivity was more pronounced with the supramarginal gyrus and superior temporal sulcus. Subcortical tracks were examined by a region-of-interest-based approach, which was validated on cortico-thalamic motor tracts. Both PIVC and PIC were connected with lateral nuclei of the thalamus and the basal ganglia (primarily putamen). PIVC tracks but not PIC tracks showed a right-hemispheric lateralization in cortical and subcortical connectivity. Overall, these results suggest that human PIVC and PIC share cortical and even subcortical connections. Nevertheless, they also differ in their primary connectivity pattern: PIVC is linked with posterior parietal and inferior frontal cortex, whereas PIC is linked with superior temporal and inferior parietal cortex.
Introduction
T
To disambiguate retinal signals evoked by movements of the head from those evoked by the movement of external objects, vestibular and visual signals must be compared and integrated (Cullen, 2012). Early functional magnetic resonance imaging (fMRI) studies in humans (Beer et al., 2009; Sunaert et al., 1999) found activity related to object motion in the posterior section of the lateral sulcus, close to the location of PIVC, and referred to this region as the posterior insular cortex (PIC). When PIC was first identified in 1999, it was not clear whether PIVC and PIC constitute the same or separate brain areas. Recent studies, however, suggest that PIVC and PIC, although adjacent, play different roles for the integration of visual and vestibular signals (Frank et al., 2014, 2016a, 2016b).
If PIVC and PIC are distinct brain areas, they should have differential anatomical connectivity patterns within the visual–vestibular network. Therefore, in this study, we compared the structural connectivity of areas PIVC and PIC. As both areas are involved in vestibular processing, we expected to find some overlap in their connectivity patterns. However, based on recent findings suggesting functional differences between PIVC and PIC, we also expected differences in their structural connectivity. To test this, PIVC and PIC were identified in each individual brain of 15 participants by fMRI activity elicited during either caloric or visual object motion stimulation, respectively. Then, probabilistic fiber tracking (e.g., Beer et al., 2013; Behrens et al., 2007; Descoteaux et al., 2009; Schlaier et al., 2017; Smith et al., 2018) based on diffusion-weighted imaging (DWI) (Le Bihan, 2014) was performed for each brain. Finally, group averages of the cortical and subcortical connectivity of PIVC and PIC were estimated and compared.
Materials and Methods
Participants
Data were obtained from 15 right-handed volunteers (20–45 years, 7 women) without psychiatric, neurological, or neuro-otologic disorders as assessed by self-report. This study is a follow-up of a previous study (Frank et al., 2016b) and was approved by the Ethics Board of the University of Regensburg. Written informed consent was obtained before participation.
Data acquisition
For each participant, a high-resolution T1-weighted run, several functional runs, and a diffusion-weighted run were acquired with a 3T Allegra scanner (Siemens, Erlangen, Germany). T1-weighted images were acquired with a magnetization-prepared, rapid-acquisition gradient-echo sequence (time of repetition [TR]: 2250 msec, time of echo [TE]: 2.6 msec, flip angle [FA]: 9°, voxel size: 1 × 1 × 1 mm3, field of view [FOV]: 256 × 256 mm2, 160 sagittal slices). Functional runs were acquired with a T2*-weighted gradient-echo sequence and echo-planar readout (TR: 1000 msec, TE: 30 msec, FA: 90°, voxel size: 3 × 3 × 3 mm3, FOV: 192 × 192 mm2, 16 axial slices). DWI was acquired by a single-shot, spin-echo echo-planar sequence (TR: 7200 msec, TE: 95 msec, FA: 90°, voxel size: 2.5 × 2.5 × 2.5 mm3, FOV: 240 × 240 mm2, 54 axial slices). Diffusion was probed along 30 equally distributed orientations at a b-value of 1000 sec/mm2. Five volumes without diffusion weighting were interspersed.
Cortical reconstruction and image registration
T1-weighted images were reconstructed using FreeSurfer version 4.1 (Martinos Center for Biomedical Imaging, Charlestown, MA) as described previously (Beer et al., 2009). During the reconstruction, brain images were automatically segmented into cortical gray matter and subcortical white matter structures (Fischl et al., 2002). Moreover, a cortical surface at the boundary between white and gray matter was tessellated and automatically registered to a spherical atlas that preserves the individual folding patterns of sulci and gyri (Fischl et al., 1999).
Functional and diffusion-weighted images were linearly registered (six degrees of freedom) to the individual T1-weighted image of the reconstruction. Registrations were visually inspected and corrected if necessary.
Subdivisions of the thalamus were identified by a standard human atlas (Krauth et al., 2010). Therefore, T1-weighted images were also nonlinearly registered to the atlas space (1 mm3 resolution) using the nonlinear image registration tool of FSL (Centre of Functional Magnetic Resonance Imaging of the Brain, University of Oxford, Oxford, United Kingdom) (Smith et al., 2004).
Seed definition
Tracking was seeded in PIVC and PIC, respectively, identified by fMRI on individual cortical surfaces. PIVC was defined by activation during caloric vestibular stimulation, whereas PIC was defined by activation during visual object motion. Details of the procedures are described elsewhere (Frank et al., 2016b).
In brief, vestibular stimulation was performed in darkness using an MRI-compatible bithermal caloric stimulation device that pumps water through small closed glass pods that were fixated inside the ear canals. During caloric stimulation trials (60 sec), one ear was stimulated by hot water (45°C) and the other ear by cold water (22°C). Caloric trials were followed by baseline trials (60 sec) with warm water (36.5°C, approximately body temperature) in both ears. Participants closed their eyes and performed no explicit task. Two runs with 10 repetitions of caloric stimulation, followed by baseline, were recorded. Preprocessing included correction for head motion, coregistration to the T1-weighted image, spatial smoothing (5 mm full-width at half-maximum), and intensity normalization. Vestibular activations were estimated with a general linear model (GLM), including regressors for caloric stimulation and baseline conditions. In addition, regressors-of-no-interest, including head motion (average maximum translation <1.5 mm and rotation <1.1° across all runs and directions) and scanner drift, were added. Statistical parametric maps (p values) for the contrast “caloric stimulation >baseline” were projected onto the individual cortical surfaces. Maps were thresholded to a p value corrected for multiple comparisons across vertices by a false discovery rate (FDR) of .05. In addition, the minimum cluster size was set to 20 mm2. PIVC was defined by suprathreshold activation in the midposterior fundus of the lateral sulcus.
The PIC localizer contained stimulation blocks (12 sec) with visual motion that alternated with baseline blocks (12 sec) of static dots. During stimulation blocks, 200 white dots were moving coherently in different translational directions (12 motion directions, 1 sec each). One run with 24 alternations was recorded. Preprocessing was done as described above. The GLM included two regressors for visual motion and baseline conditions and regressors-of-no-interest for head motion (average maximum translation <1.0 mm and rotation <0.7° across all runs and directions) and scanner drift. PIC was defined by stronger activation (thresholded to FDR = 0.05, minimum cluster size = 20 mm2) during motion than static blocks in the posterior lateral sulcus. As reported previously (Frank et al., 2016b), some hemispheres showed two separate (anterior and posterior) patches of activation and in rare cases the anterior part of PIC partially overlapped (<10%) with PIVC. In these cases, the posterior patch was defined as PIC and overlapping vertices were removed from both seed areas.
Definition of subcortical regions-of-interest
Previous studies suggested that the basal ganglia, cerebellum, hippocampus, and subdivisions of the thalamus are part of the visual–vestibular network (Hitier et al., 2014). Therefore, we computed the connectivity of PIVC and PIC with these subcortical regions-of-interest (ROIs). The caudate nucleus, putamen, pallidum, cerebellum, and hippocampus were automatically segmented in each brain by FreeSurfer. Only the surface voxels of the subcortical ROIs served as track targets. This was done to avoid tracking through gray matter, which has low anisotropy and, hence, produces unreliable solutions (including false positives). Moreover, the cerebellum ROI only contained white matter voxels bordering the brainstem based on the assumption that all fibers connecting the cerebellum pass through the peduncles. Tracking was terminated at voxels inside each ROI.
The thalamus and its subdivisions were defined with a standard atlas of the human thalamus (Krauth et al., 2010), which was nonlinearly transformed into the individual structural space. Only surface voxels of the thalamus were considered. To assure a minimum size (10 voxels) for each ROI, tiny subdivisions of the thalamic nuclei were combined (e.g., suprageniculate nucleus, limitans nucleus, and posterior nucleus were merged to the posterior nuclear group). Overall, 17 thalamic ROIs met these criteria: anterior nucleus (ANT), central lateral nucleus (CL), central medial nucleus (CM), lateral geniculate nucleus (LGN), medial geniculate nucleus (MGN), mediodorsal nucleus (MD), midline nucleus (MID), posterolateral nucleus (LP), posterior nuclear group (POST), lateral pulvinar (PuL), anterior pulvinar (PuA), medial pulvinar (PuM), inferior pulvinar (PuI), ventral posterior lateral nucleus (VPL), ventral anterior nucleus (VA), ventral lateral nucleus (VL), and ventral posterior medial nucleus (VPM). Again, only the surface voxels of each ROI served as track targets, and tracking was terminated at voxels inside each ROI.
Diffusion-weighted imaging preprocessing
The preprocessing of DWI was performed by the FMRIB's Diffusion Toolbox (FDT, version 2.0) (Behrens et al., 2007). This included correction for head motion and eddy current distortions. Diffusion vectors were corrected for head motion (Leemans and Jones, 2009). For each voxel, a distribution of diffusion parameters was estimated by means of Markov Chain Monte Carlo sampling with two anisotropic compartments unless prevented by automatic relevance detection.
Tractography
Probabilistic tractography was performed by the FDT. The tracking algorithm was seeded in PIVC and PIC as individually defined on the cortical surface (see section: Seed definition). Tracking was performed in individual diffusion space. Hence, seed regions were transformed into diffusion space, and tracking results were transformed into reconstruction space by linear registrations (see section: Cortical reconstruction and image registration). To avoid ambiguities arising from converging fibers in the corpus callosum (Johansen-Berg and Rushworth, 2009), tractography was limited to the ipsilateral hemisphere. For each seed vertex, 20,000 streamlines (maximum steps: 2000, step length: 0.5 mm, curvature threshold: 0.2) each based on separate samples of the voxelwise diffusion distribution were calculated. A loop-check (preventing circular pathways) and a distance correction were applied. Tracks were terminated when leaving the hemisphere or when reaching subcortical target ROIs. No other anatomical constraints (e.g., waypoint masks) were applied.
As in previous work (Smith et al., 2018), voxelwise track frequencies (accumulated number of streamlines) were transformed into track probabilities (Ptrack) by dividing the log-scaled track frequency by the maximum log-scaled track frequency. Log-scaling mitigates biases arising from size differences of seeds.
Group analysis
For the cortical analysis, track probabilities at voxels 1 mm below the white/gray matter boundary (“track terminations”) were projected onto the cortical surface and spherically registered to the FreeSurfer standard brain (Beer et al., 2013). Surface maps of track termination probabilities were smoothed (∼2 mm2) and averaged across all 15 brains separately for PIVC and PIC tracks. For visualization, a track probability threshold of Ptrack = 0.25 was adopted. Although previous studies aiming to demonstrate well-established fiber bundles applied a more conservative threshold of Ptrack = 0.5 (Behrens et al., 2003), such a conservative threshold may have obscured white matter connections that are common to both seed regions (PIVC and PIC). To protect against false positives, differences in track termination probabilities between seed regions were compared by t-tests. Type I error inflation was controlled by a clusterwise approach based on the Monte Carlo simulated distribution of cluster size for a voxelwise threshold criterion of p < 0.001.
For the subcortical analysis, the mean track probabilities across all ROI voxels were extracted for each brain and seed region. Differences in track probabilities for PIVC and PIC tracks were tested by an analysis of variance (ANOVA) and t-tests (two tailed). Moreover, track probabilities for each target ROI and seed were tested against chance. Here, a caveat of probabilistic tractography is that the track probability expected by chance is unknown a priori. Neither a track probability of zero nor the mean track probabilities across the whole brain are adequate references. For instance, track probabilities in a noise sample are low but not zero. Moreover, false positive track probabilities depend on the existence of “true” connections. Tractography on data with “true” connections produces high track probabilities for “true” tracks and very low track probabilities for “false” tracks. By contrast, tractography on noise samples results in intermediate track probabilities even for false connections. Therefore, track probabilities should be evaluated against a chance (reference) level that takes the overall connectivity into account.
Therefore, we adopted the following rationale. Every ROI that showed no track probability significantly higher than zero as examined by one-sample t-tests, likely showed only tracks expected by chance. Type I error inflation was corrected by an FDR procedure. The mean track probability of these excluded ROIs served as reference level. Brain regions with track probabilities significantly greater than this reference (one-tailed t-tests) are likely not due to chance. As this approach is novel, it was validated by a control analysis that examined relatively well-established cortico-thalamic connections of primary motor cortex (Supplementary Material S1 with Supplementary Fig. S1; Supplementary Data are available online at
As some studies suggested a right-hemispheric dominance of the vestibular system (Dieterich et al., 2003), mean track probabilities of PIVC and PIC were analyzed separately for the left and right hemispheres. Moreover, a lateralization index (LI) was computed that controls for individual differences in mean track probabilities. This LI divided the difference of Ptrack for the left minus the right hemisphere by the mean of both hemispheres. This was performed for all subcortical ROIs. To apply the same approach for cortical connectivity, the cortical surface was parcellated into 34 ROIs based on major gyri (Desikan et al., 2006).
Results
Seed definition
PIVC was successfully identified by fMRI in each hemisphere of all but one participant. A cluster of functional activity was observed in the midposterior section of the lateral sulcus of individual hemispheres (Fig. 1A). It was clearly separable from other clusters in the anterior insula, frontal or parietal cortex. For the one participant without an fMRI-based definition, PIVC was estimated based on the average group coordinates across the other participants. The mean MNI coordinates across all brains were X = −43, Y = −14, Z = 17 (left) and X = 40, Y = −14, Z = 18 (right) (Frank et al., 2016b). The mean size along the white matter surface was 182 mm2 (±18 mm2). To further evaluate its cortical location, PIVC was compared with a surface-based atlas based on multimodal brain imaging (Glasser et al., 2016) (Supplementary Fig. S2). This comparison showed that PIVC primarily overlapped with the subdivision OP2-3 of the parietal operculum.
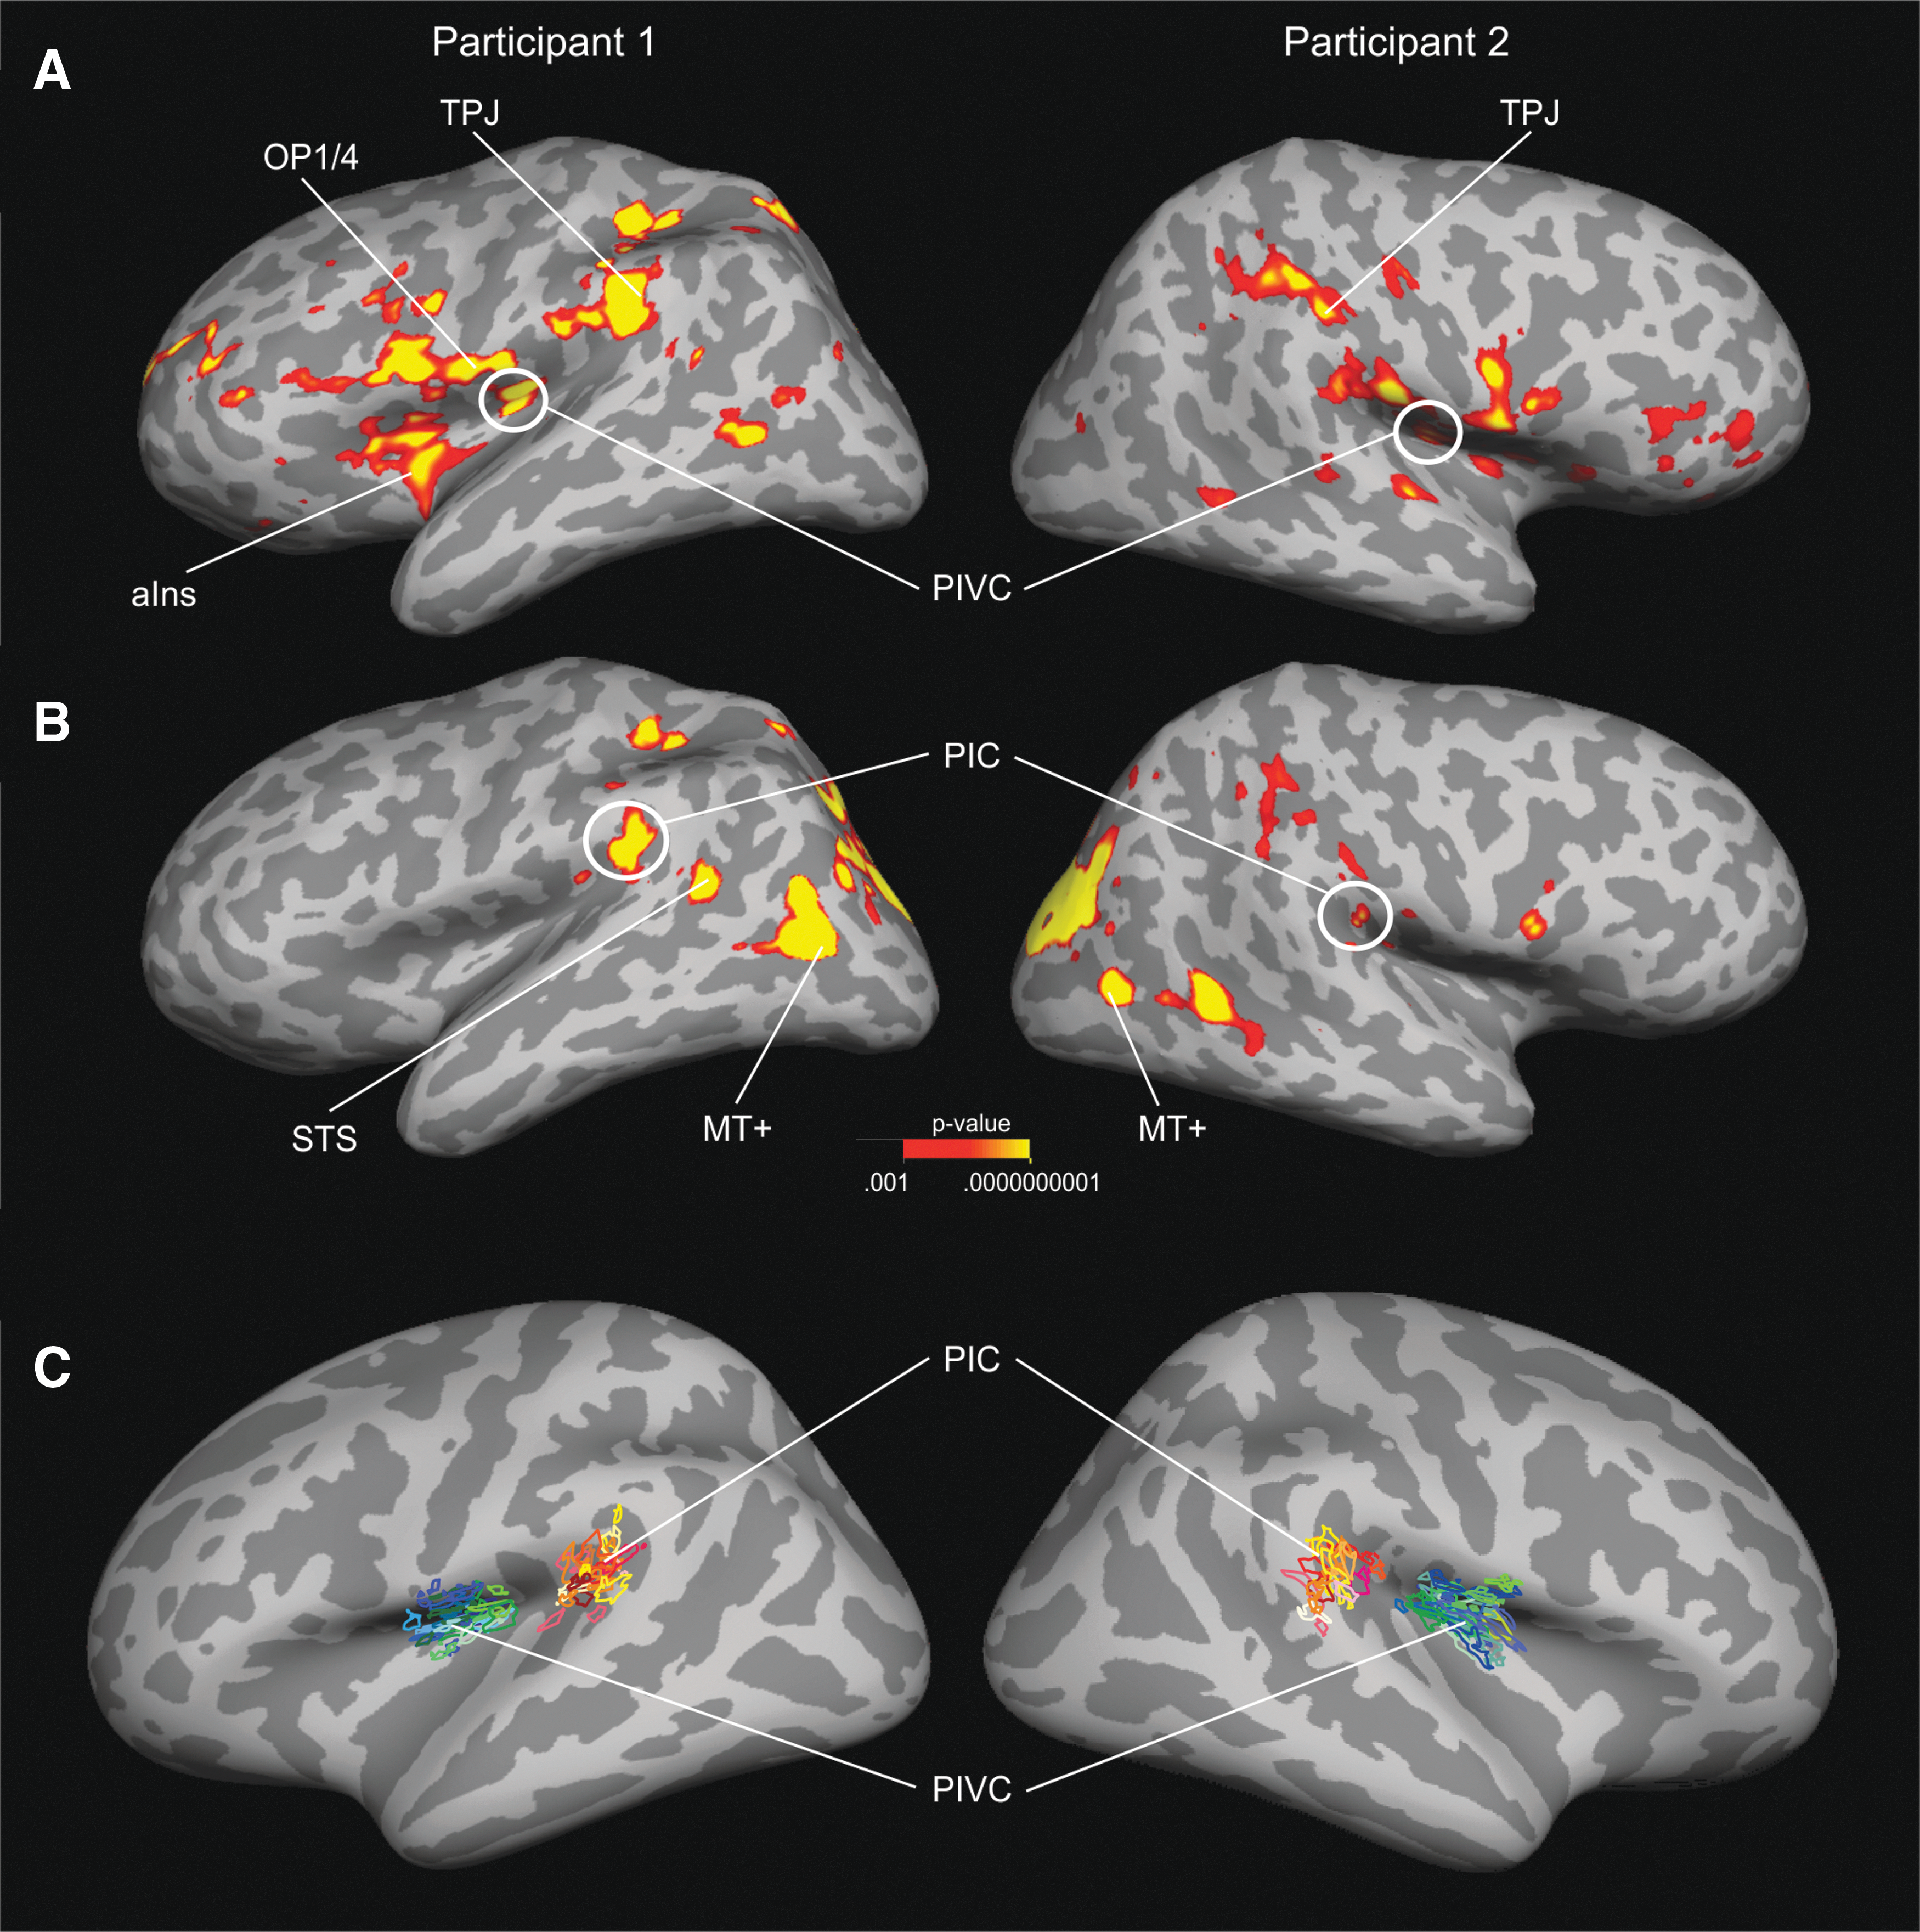
Seed areas PIVC and PIC defined by fMRI in individual brains.
PIC was successfully identified in all but one individual hemisphere and otherwise estimated based on the group average location. A cluster of functional activity was observed in the posterior part of the lateral sulcus (Fig 1B). The mean MNI coordinates were X = −42, Y = −36, Z = 23 (left) and X = 58, Y = −34, Z = 17 (right) (see also Frank et al., 2016b). The mean size along the white matter surface was 121 mm2 (±17 mm2). When compared with a surface-based atlas (Glasser et al., 2016), PIC partially overlapped with posterior sections of the retroinsular and anterior/ventral sections of the inferior parietal lobe (PFcm, PF) (Supplementary Fig. S2). Although the size and location of PIVC and PIC varied slightly, both seed regions were located in homologue regions across the 15 brains (Fig. 1C).
Cortical connectivity
PIVC
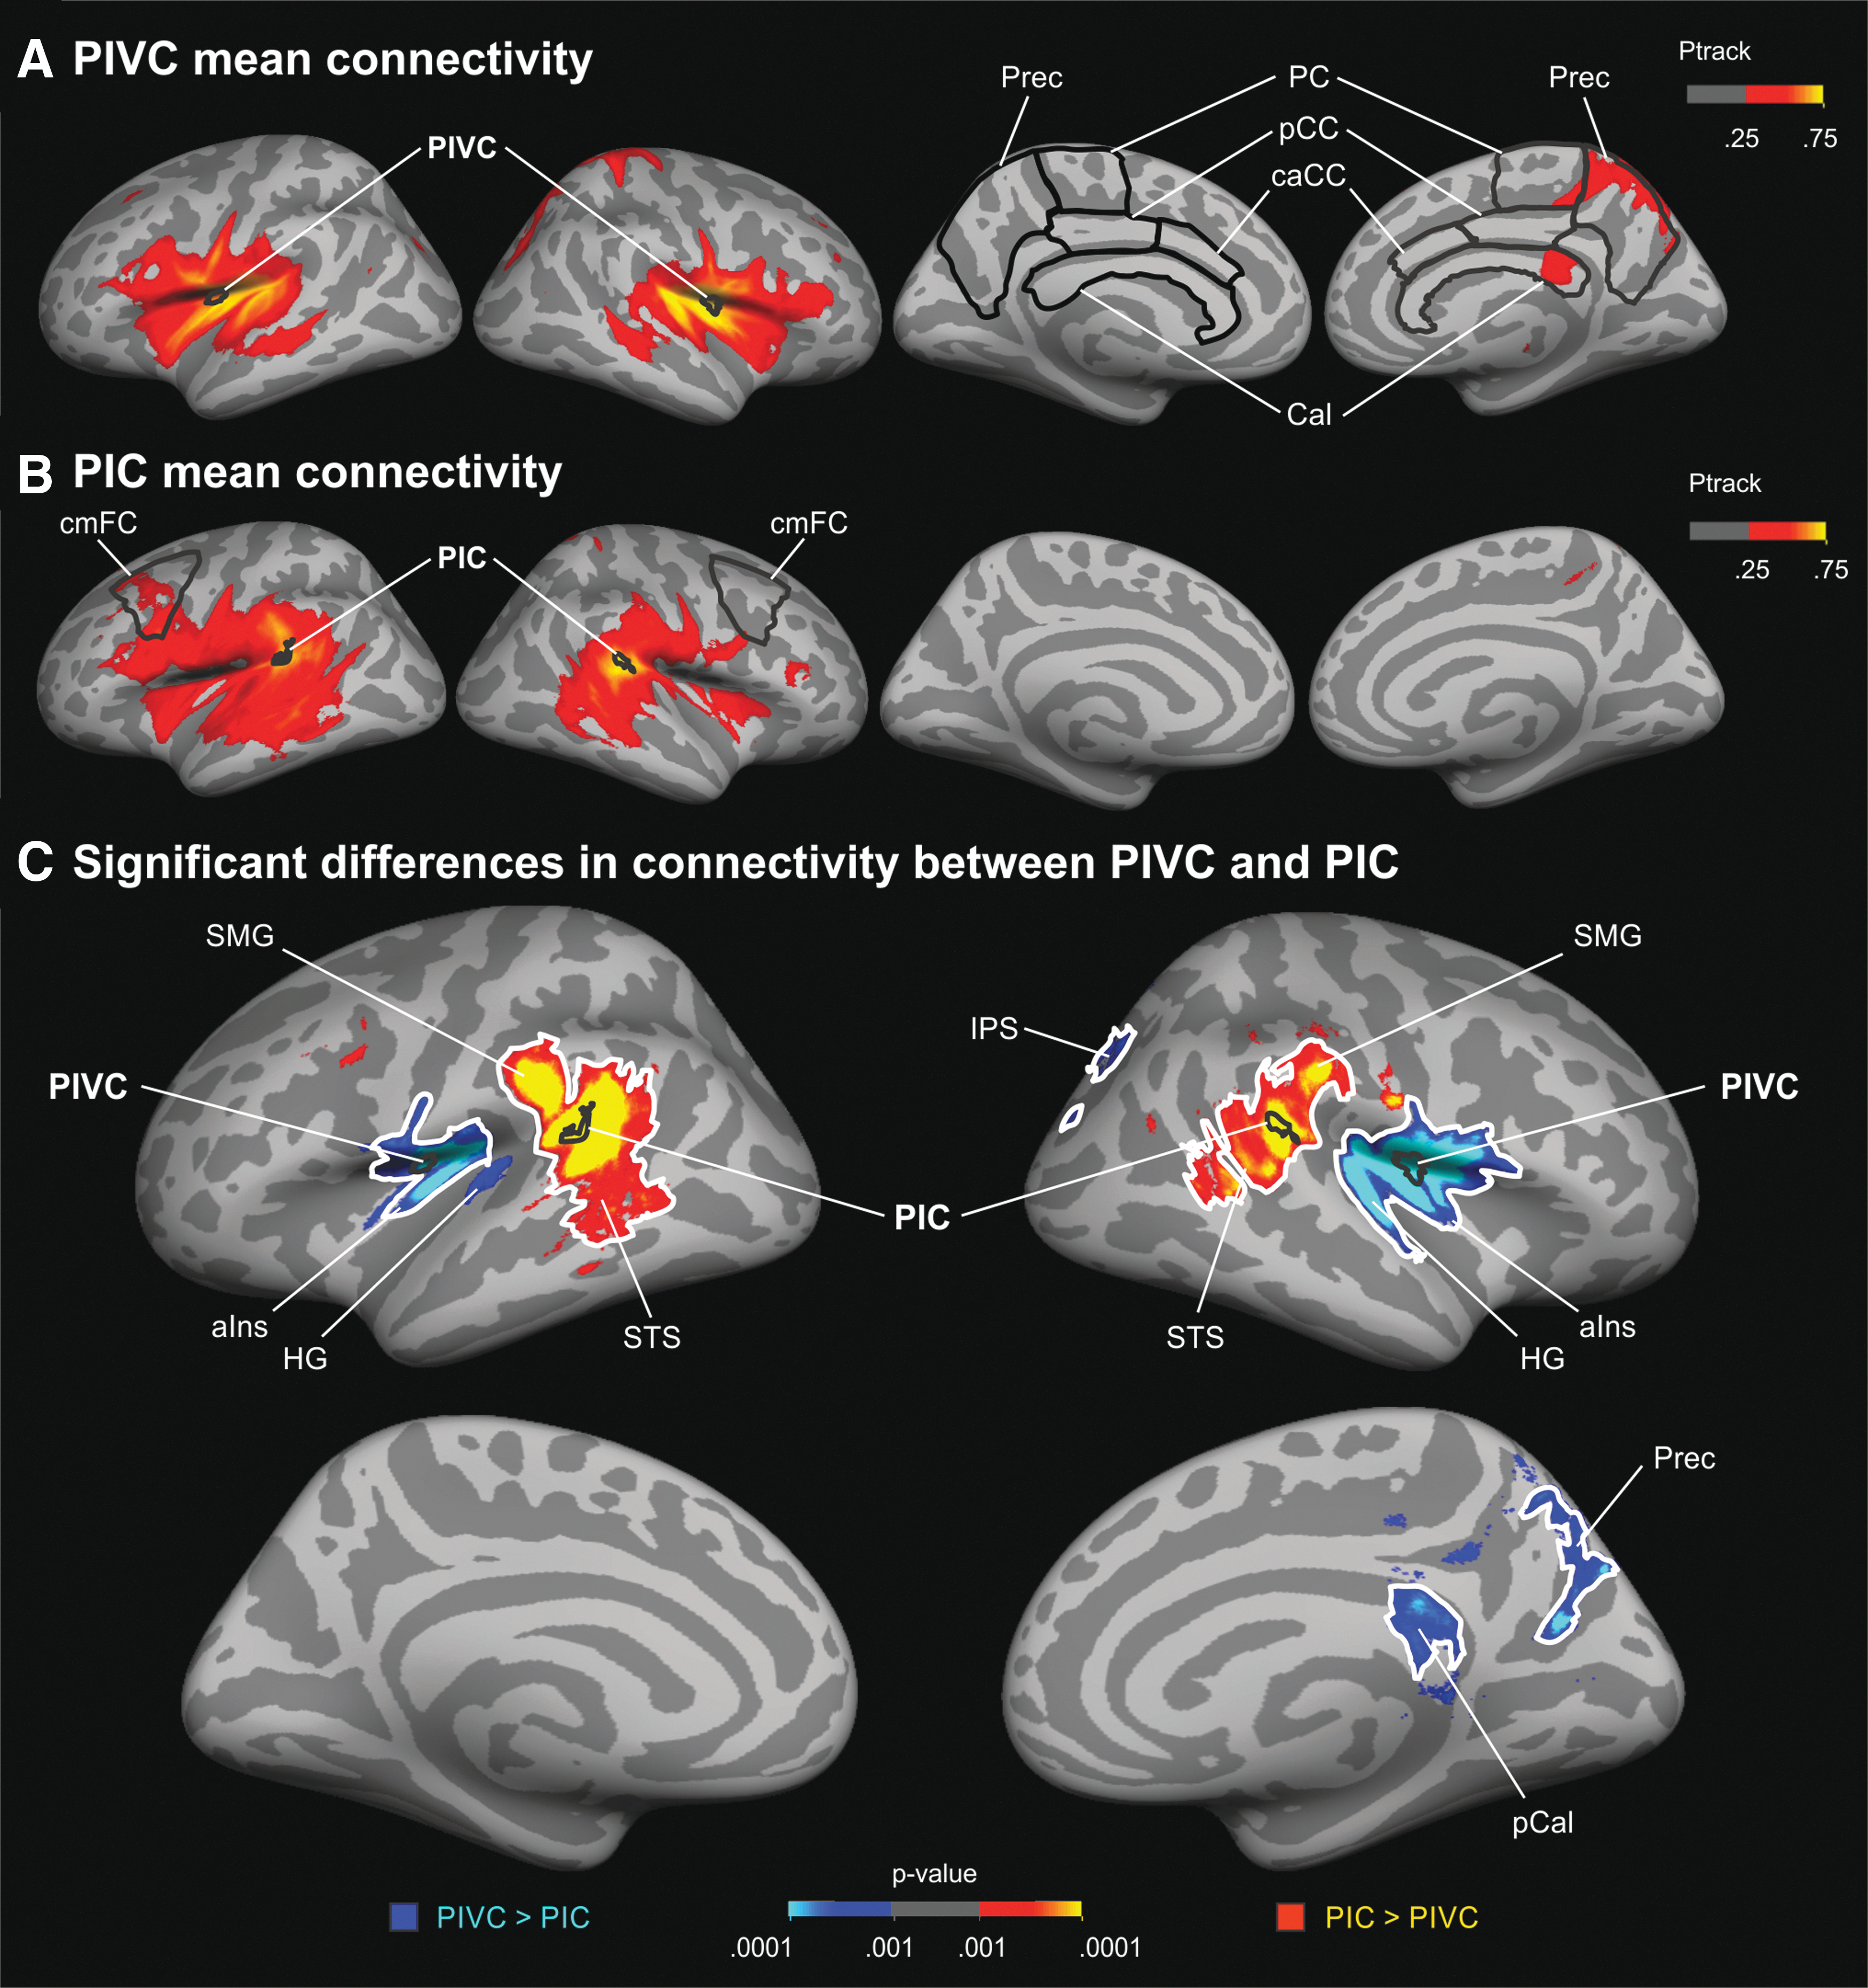
Figure 2A shows the cortical terminations of tracks seeded in PIVC averaged across all participants and projected onto the surface of the standard brain. Both hemispheres showed a large cluster of connectivity (high track probabilities) in the vicinity of PIVC. This cluster included the anterior insula extending to the inferior frontal gyrus (IFG, pars triangularis, pars opercularis), inferior parts of the central sulcus and pre-/postcentral gyrus, the supramarginal gyrus (SMG), PIC, and the superior temporal sulcus (STS). Moreover, PIVC connections were observed in the intraparietal sulcus (IPS) in both hemispheres. High track termination probabilities were also observed in the precuneus and the posterior callosum of the right hemisphere.
Results of cortical tractography seeded in PIVC and PIC.
Hemispheric lateralization was compared across 34 cortical parcellations (Desikan et al., 2006). A significant (FDR corrected) right-hemispheric lateralization (negative LI) reflecting more pronounced track probabilities in the right compared with the left hemisphere was observed in the posterior and caudal anterior cingulate cortex (p < 0.01), the corpus callosum (p < 0.05), the paracentral cortex (p < 0.001), and the precuneus (p < 0.05) as marked in Figure 2A. No other parcellation showed a significant hemispheric difference.
PIC
Tractography seeded in PIC (Fig. 2B) yielded track terminations in a large cluster in the vicinity of PIC in both hemispheres. This cluster included the insula with PIVC, the IFG and sulcus, inferior parts of the central sulcus and pre-/postcentral gyrus, the SMG, the STS, and the superior temporal gyrus (STG). Moreover, PIC exhibited connections with the superior frontal sulcus. Lateralization of cortical track probabilities for PIC (as examined by LI) was limited. Only the caudal middle frontal cortex (p < 0.05, FDR corrected) as outlined in Figure 2B showed more pronounced track probabilities in the left compared with the right hemisphere.
PIVC versus PIC
There were also substantial differences in cortical connectivity between PIVC and PIC (Fig 2C). PIVC showed significantly higher track termination probabilities than PIC in the anterior insula and the Heschl's gyrus of both hemispheres. Moreover, PIVC connectivity was significantly enhanced compared with PIC in the precuneus, the IPS, and the posterior callosum of the right hemisphere. By contrast, connectivity to the SMG and posterior parts of the STS was significantly more pronounced in both hemispheres for PIC compared with PIVC. Note that most of the clusters showing differences between PIVC and PIC tracks remained significant when clusterwise corrections for multiple comparisons were applied.
Subcortical connectivity
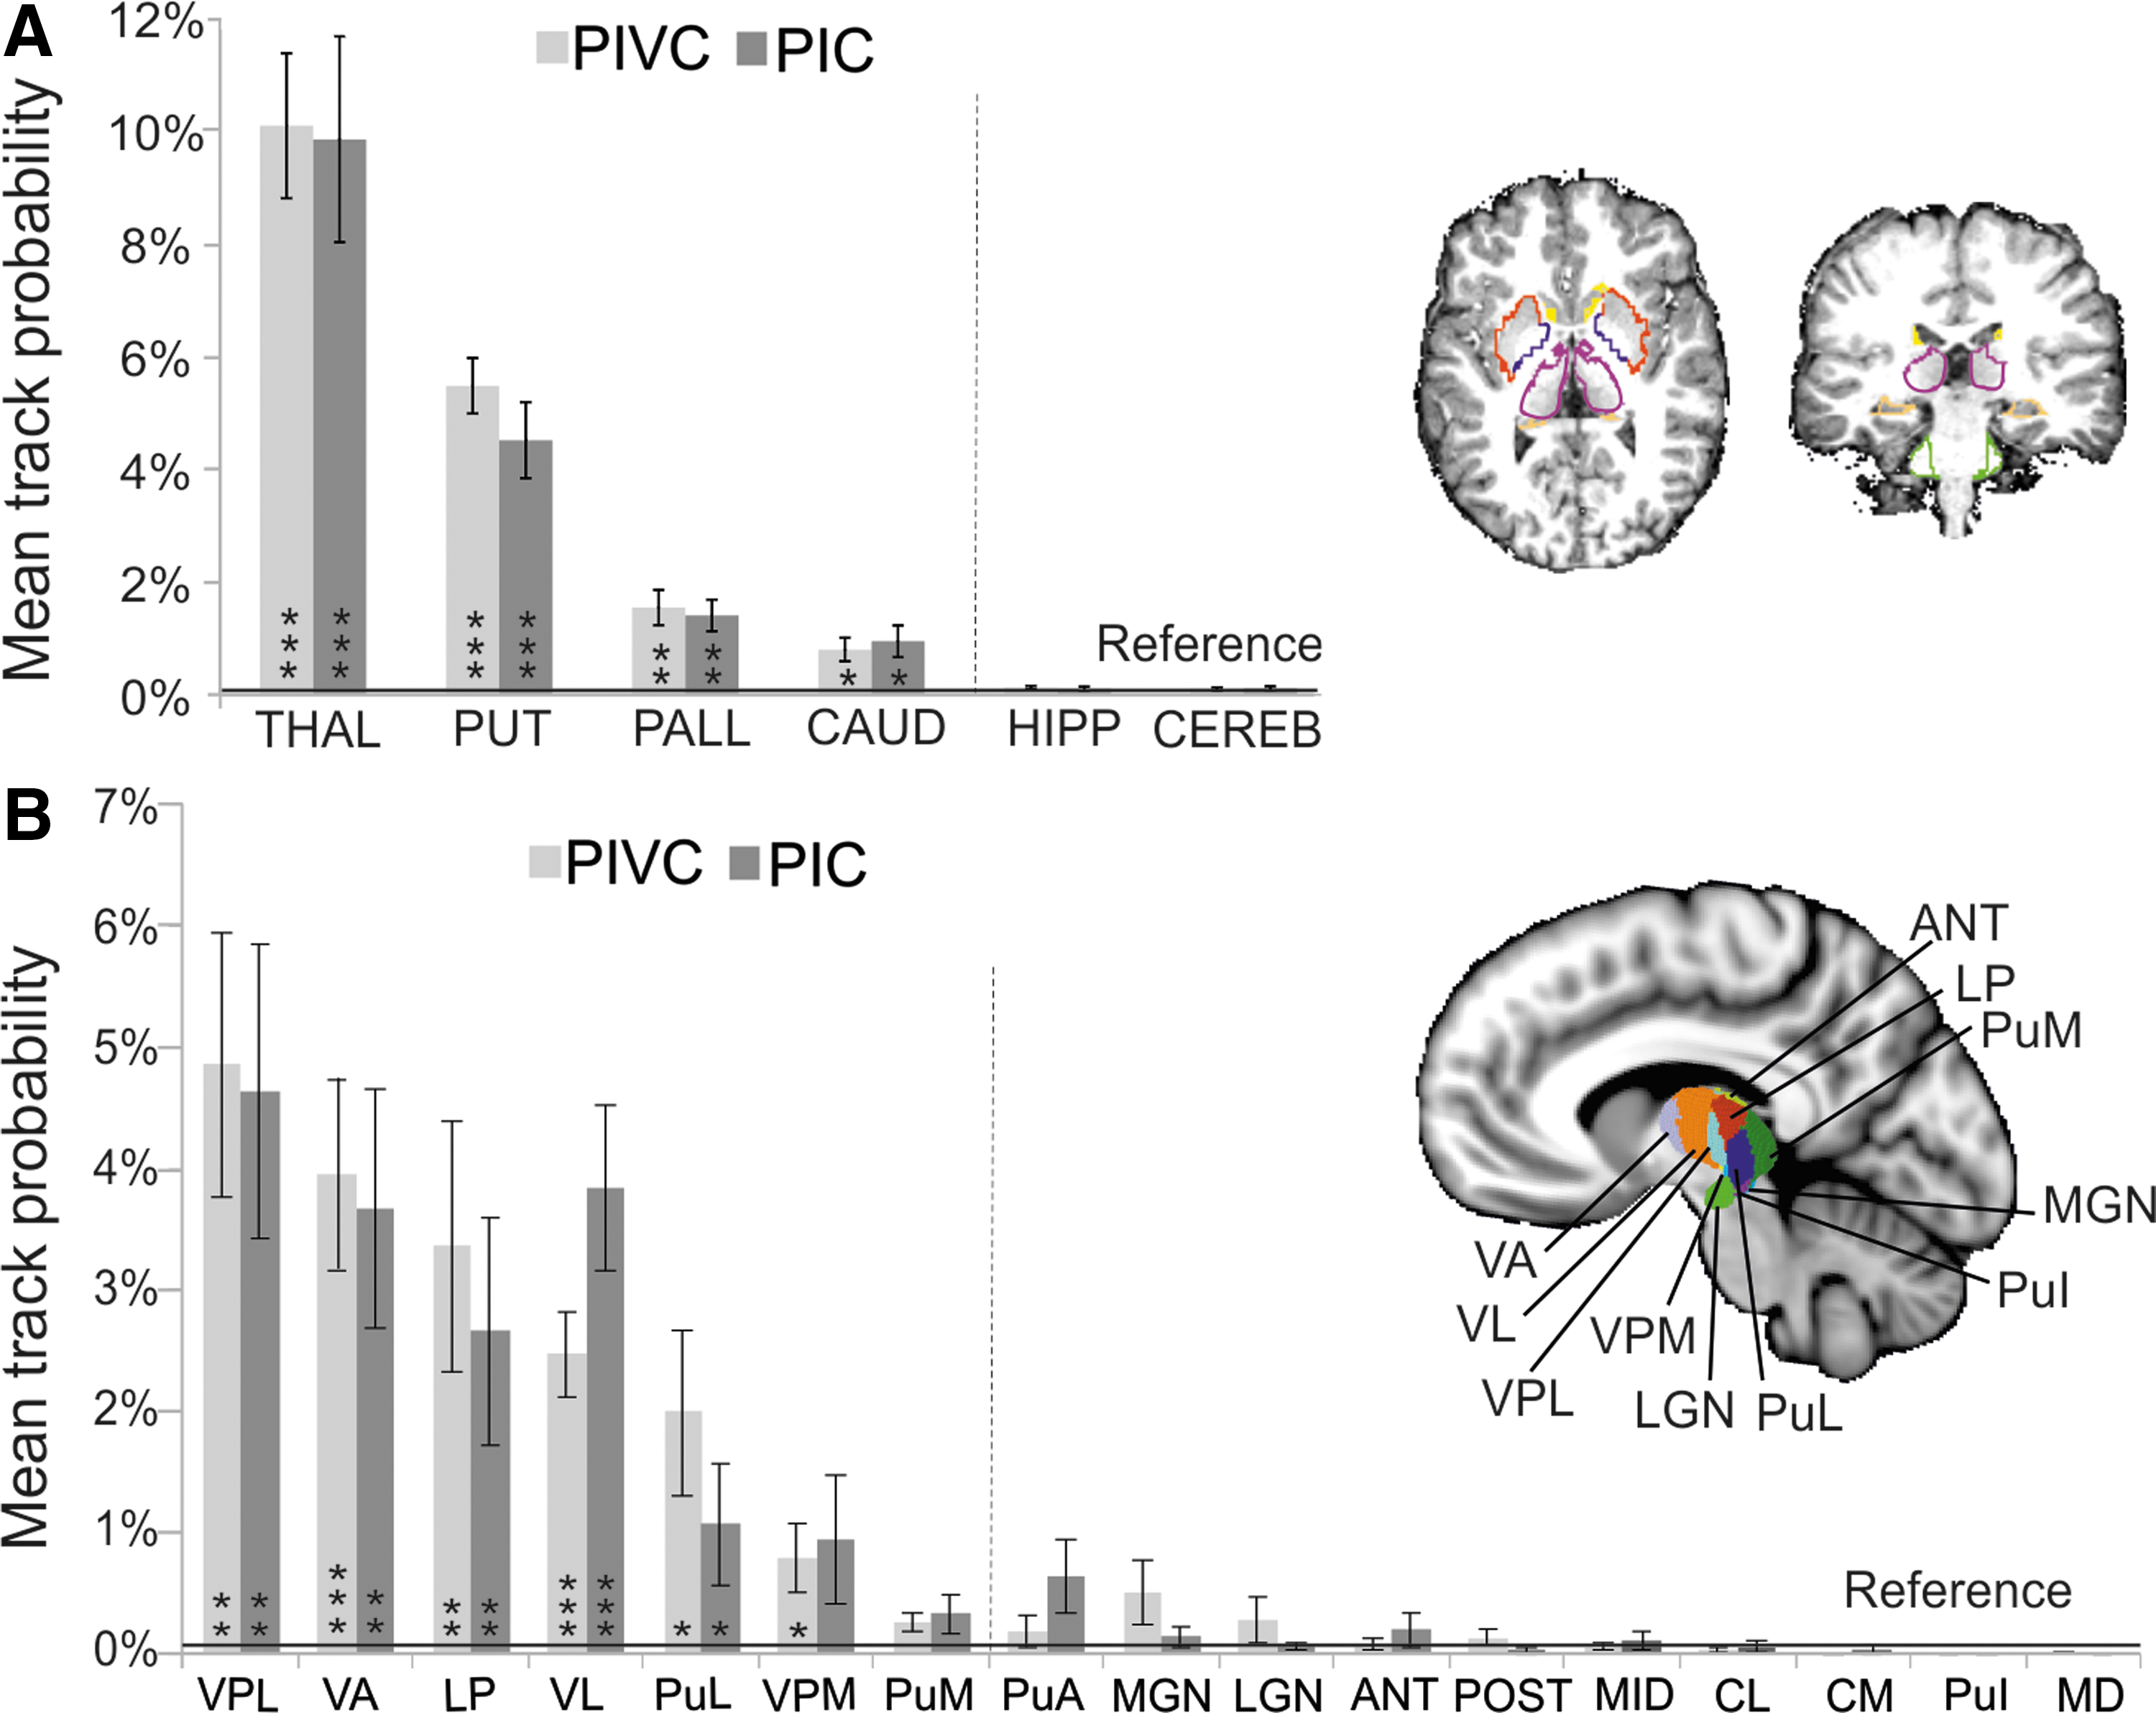
Figure 3A shows track probabilities between PIVC and PIC and relevant subcortical structures (putamen, pallidum, caudate nucleus, cerebellum, hippocampus, and thalamus). Both seed regions exhibited most pronounced connections with the basal ganglia (primarily putamen) and the thalamus. Low track probabilities were observed for the hippocampus and the cerebellum. A repeated-measures ANOVA with factors seed region (PIVC or PIC), hemisphere (left or right), and target ROI showed a significant main effect of target ROI [F(5, 70) = 45.5, p < 0.001], but no significant main effects or interactions with hemisphere or seed region. One-tailed t-tests showed that track probabilities did not differ significantly from zero (p > 0.05, FDR corrected) in the hippocampus and the cerebellum. Therefore, these ROIs served as a reference for track probabilities expected by chance (see the Materials and Methods section). Both PIVC and PIC track probabilities in the putamen, pallidum, caudate nucleus, and thalamus were significantly higher than this reference (Fig. 3A).
Subcortical connectivity of PIVC and PIC.
PIVC track probabilities showed a significant negative hemispheric lateralization (as tested by the LI) for the pallidum [t(14) = 3.41, p = 0.004, p < 0.05 with FDR correction] and the thalamus [t(14) = 2.47, p = 0.027, uncorrected] reflecting more pronounced tracks in the right than the left hemisphere. No significant lateralization of PIVC tracks was observed with other subcortical structures or for PIC tracks.
For a more detailed characterization of the cortico-thalamic connections, PIVC and PIC track probabilities were examined for 17 subnuclei of the thalamus (Fig. 3B). Highest track probabilities were observed for both PIVC and PIC tracks in lateral nuclei of the thalamus, including VPL, VA, LP, VL, and PuL. A repeated-measures ANOVA with factors seed (PIVC or PIC), hemisphere (left or right), and target ROI (17 thalamic nuclei) showed a significant main effect of target ROI [F(16, 224] = 12.3, p < 0.001), but no significant main effects or interactions with hemisphere or seed region. One-tailed t-tests showed that track probabilities did not differ from zero (p > 0.05, FDR corrected) in PuA, MGN, LGN, ANT, POST, MID, CL, CM, PuI, and MD. These ROIs served as a reference for track probabilities expected by chance. PIVC and PIC track probabilities in VPL, VA, LP, VL, and PuL were significantly higher than this reference. Track probabilities of the VPM significantly exceeded the reference for PIVC but not for PIC. The analysis of hemispheric lateralization (LI) showed only a marginally significant right-hemispheric dominance of PIVC tracks in LP [t(14) = −1.8, p = 0.088, uncorrected]. No hemispheric dominance was observed for PIC tracks or other thalamic ROIs.
To evaluate the sensitivity of our thalamic tracking approach, it was also tested on cortico-thalamic motor tracts. This control analysis showed that the approach successfully detected the known cortico-thalamic motor connections (Supplementary Material S1).
Discussion
This study investigated the structural connectivity of two key regions in the cortical vestibular network: PIVC and PIC. Both areas were identified in individual brains by fMRI activity elicited by caloric vestibular and visual motion stimulation (Frank et al., 2016b). Probabilistic tractography based on DWI revealed that PIVC and PIC shared structural connections to the insula, STS, IFG, putamen, and lateral thalamus in each hemisphere. This finding supports the notion that both PIVC and PIC are part of the vestibular network.
However, a direct comparison of the connectivity patterns revealed remarkable differences between PIVC and PIC. In both hemispheres, PIC showed more pronounced connections than PIVC with the SMG and STS, whereas PIVC showed more pronounced connections than PIC with the anterior insula and the Heschl's gyrus. Moreover, PIVC showed higher track probabilities than PIC in the precuneus and the posterior callosum of the right hemisphere. PIVC also showed a right-hemispheric dominance in connectivity primarily with medial parts of the cortex and the pallidum. A left-hemispheric dominance of PIC connectivity was only observed in the caudal middle frontal cortex. These connectivity patterns further support the notion that PIVC and PIC, although adjacent to each other, are separate areas of the vestibular network (Frank et al., 2014, 2016a; Frank et al., 2016b).
Shared connectivity
The shared connections of PIVC and PIC with the insula are consistent with observations showing MRI-based functional connectivity between the posterior insula and anterior parts of the insula, adjacent opercula, precentral, and postcentral gyri (Deen et al., 2011). Similarly, connections with the superior temporal cortex are consistent with related studies showing functional (Cauda et al., 2011) and structural (Cloutman et al., 2012) connectivity between the posterior insula and the STG. Structural connections with the IFG might mediate vestibular activity observed in the inferior frontal cortex (Fasold et al., 2002; Klingner et al., 2013).
Our results further showed that PIVC and PIC are connected with the basal ganglia (primarily the putamen), which are activated during vestibular stimulation (Dieterich et al., 2003). Moreover, functional connectivity between the putamen and the middle posterior insula was observed (Cauda et al., 2011). The results support the notion that the putamen is the major input station within the basal ganglia for vestibular information (Stiles and Smith, 2015). We observed no structural connections with the cerebellum and the hippocampus. This could mean that these connections were too subtle to be detected by our tractography approach. Alternatively, vestibular responses observed in the hippocampus (O'Mara et al. 1994) may originate from parietal, entorhinal, and perirhinal cortices (Hitier et al., 2014) rather than PIVC or PIC. Similarly, vestibular centers in the cerebellum may be connected with subcortical vestibular nuclei (Barmack, 2003) rather than with PIVC or PIC.
Cortico-thalamic connections of PIVC and PIC were limited to lateral thalamic nuclei (VPL, VA, LP, VL, PuL, and PuM). Previous studies found vestibular responses in the lateral and posterolateral thalamus (e.g., Shinder and Taube, 2010; Wijesinghe et al., 2015). A recent tractography study reported that the vestibular nuclei are connected with PIVC via posterolateral thalamic regions (Kirsch et al., 2016). Tracer studies in squirrel monkeys revealed major axonal connections between PIVC and the ventroposterior complex and the pulvinar of the thalamus (Akbarian et al., 1992). Hence, the observed thalamic PIVC tracks in this study correspond fairly well with those in nonhuman primates. Our findings further suggest that lateral thalamic nuclei are not only connected with PIVC but also with PIC.
Distinct connectivity
PIVC showed more pronounced connectivity than PIC with the anterior insula and the Heschl's gyrus and, in the right hemisphere, with the precuneus, IPS, and posterior callosum. This cortical connectivity profile of PIVC is fairly consistent with tracer research showing axonal connections of PIVC with frontal and parietal cortical areas (Guldin et al., 1992). The connections with the precuneus and the IPS might correspond to sections of the recently described stratum proprium of the interparietal sulcus, a fiber bundle connecting dorsomedial and ventrolateral parietal areas (Uesaki et al., 2018). One may speculate that these connections provide the anatomical substrate for the reciprocal inhibition between the visual and vestibular sensory systems, observed in functional imaging studies (Brandt et al., 1998; Frank et al., 2016a).
The cortical (precuneus, IPS) and subcortical (pallidum, thalamus) connectivity of PIVC showed a right-hemispheric lateralization. In right-handed participants, functional activity elicited by caloric stimulation was found to be stronger in the right than the left hemisphere (Dieterich et al., 2003). A recent tractography study also observed a right-hemispheric dominance for tracks between the vestibular nuclei and the thalamus (Dieterich et al., 2017).
Enhanced track probabilities of PIVC were observed in the posterior corpus callosum (isthmus/splenium). This observation replicates recent tractography findings, suggesting interhemispheric connections of PIVC in the posterior callosum (Kirsch et al., 2016). Connections between PIVC and Heschl's gyrus are consistent with functional imaging studies reporting vestibular responses in the transverse gyrus (Lopez et al., 2012). They might mediate vestibular contributions to the spatial localization of auditory stimuli (Genzel et al., 2016).
PIC showed more pronounced connections than PIVC with the SMG, and the posterior STS. Both SMG and STS respond to vestibular cues (Fasold et al., 2002; Lopez et al., 2012). The SMG is part of the temporoparietal junction (TPJ), which seems to link motion perception and vestibular-guided navigation. Patients with TPJ lesions are impaired in judging the duration of motion and travelled distance (Kaski et al., 2016).
There is not yet a consensus on the nonhuman primate homologue of PIC. A possible candidate is the visual posterior Sylvian (VPS) area, which seems to overlap with temporal area T3. VPS processes visual and vestibular signals related to self-motion (Chen et al., 2011). The observed cortical connectivity profile of PIC is fairly consistent with tracer studies showing axonal connections between T3 and parietotemporal regions and the STS (Guldin et al., 1992). Although PIC and T3 show similar subcortical connections with several thalamic nuclei, PIC was primarily connected to the lateral thalamic nuclei and weakly to the putamen, whereas T3 was primarily connected with the putamen and weakly with the ventroposterior nuclei (Akbarian et al., 1992).
Methodological considerations
Although diffusion-based tractography often produces results corresponding with tracer-based (Donahue et al., 2016) or functional connectivity measures (Kirsch et al., 2016; Smith et al., 2018), several limitations need to be considered. DWI-based tractography does not directly trace axons, but estimates white matter fibers by modeling the path of lowest diffusion hindrance. These modeled connections are nondirectional.
Image resolution (voxel size and angular resolution) of the diffusion data is another limiting factor. Due to partial volume effects, crossing or converging fibers pose relevant challenges (Johansen-Berg and Rushworth, 2009). The crossing fiber problem is best addressed by modeling multiple angular compartments such as by the ball-and-stick model (Behrens et al., 2007). The angular resolution in our study was limited to 30 gradient directions. Hence, it may be argued that the sensitivity for detecting crossing fibers was limited and that the observed tracking solutions were conservative (e.g., inability to detect subtle tracks). Although previous research showed that a minimum sampling of 30 directions effectively resolves ambiguities arising from crossing fibers in the ball-and-stick model (Behrens et al., 2007), we cannot fully dismiss this possibility with respect to subtle connections. Converging fibers are primarily observed in the corpus callosum. Hence, interhemispheric tracking through the callosum is usually less reliable than ipsilateral tracking. The current study avoided this problem by focusing on ipsilateral connections.
A major problem in DWI-based tractography is the trade-off between detecting true tracks (sensitivity) and rejecting false positives (selectivity). We adopted probabilistic rather than deterministic tractography (Descoteaux et al., 2009) as it provides the best balance between sensitivity and selectivity for cortical (Thomas et al., 2014) and subcortical (Schlaier et al., 2017) connectivity. This approach requires thresholding of track probabilities. We adopted a relatively liberal threshold as we intended to reveal most of the visual–vestibular network. However, several procedures for reducing false positives were applied. Conclusions were based on group statistics rather than individual tractographies. A surface-based approach mitigated intersubject normalization problems. Inferential statistics was applied to compare PIVC and PIC networks. This comparison contains an intrinsic null hypothesis, which is otherwise a major challenge in tractography.
Subcortical tracking was further tested against an empirically defined reference. A similar procedure was recently applied (Smith et al., 2018), but not for investigating cortico-thalamic connectivity. Therefore, we evaluated this approach by examining cortico-thalamic motor tracts (Supplementary Material S1), whose connections are relatively well established. The tracking algorithm was seeded with an ROI in the precentral gyrus (primary motor cortex) that was comparable in size to the PIVC or PIC region. This analysis successfully revealed cortico-thalamic motor tracts with the VL-VPL complex as expected from the literature (Darian-Smith et al., 1990; Rouiller et al., 1999). Moreover, nonexisting connections (VA or MD) were successfully rejected.
It has been argued that long-range tracking with cortical seeds is obstructed by superficial white matter fiber systems (Reveley et al., 2015). This may result in tracks that spread parallel to the cortical surface. Hence, the relatively high track probabilities in the vicinity of seed regions may (at least partially) reflect local association fibers rather than long-range connections. Nevertheless, distinct long-range connections for both seed regions were observed. Moreover, assuming that local fibers equally biased tracking for PIVC and PIC, the difference maps were likely not contaminated.
Conclusion
Our results indicate that PIVC and PIC in humans share a cortical and subcortical network. However, they also exhibit unique connectivity patterns. Hence, PIVC and PIC not only differ in their functional responses (Frank et al., 2014, 2016a, 2016b) but also by their structural connections. PIVC is predominantly connected with anterior brain regions and the posterior parietal cortex, whereas PIC showed more pronounced connections with parietotemporal brain areas and the superior temporal cortex.
Footnotes
Acknowledgments
We thank C. Renner and P. Fuchs for technical support. A. Wirth was partially supported by the Elite Network of Bavaria (ENB).
Author Disclosure Statement
No competing financial interests exist.
References
Supplementary Material
Please find the following supplemental material available below.
For Open Access articles published under a Creative Commons License, all supplemental material carries the same license as the article it is associated with.
For non-Open Access articles published, all supplemental material carries a non-exclusive license, and permission requests for re-use of supplemental material or any part of supplemental material shall be sent directly to the copyright owner as specified in the copyright notice associated with the article.