
Abstract
Generating movement rhythms is known to involve a network of distributed brain regions associated with motor planning, control, execution, and perception of timing for the repertoire of motor actions. What brain areas are bound in the network and how the network activity is modulated by rhythmic complexity have not been completely explored. To contribute to answering these questions, we designed a study in which nine healthy participants performed simple to complex rhythmic finger movement tasks while undergoing simultaneous functional magnetic resonance imaging and electroencephalography (fMRI-EEG) recordings of their brain activity during the tasks and rest. From fMRI blood oxygenation-level-dependent (BOLD) measurements, we found that the complexity of rhythms was associated with brain activations in the primary motor cortex (PMC), supplementary motor area (SMA), and cerebellum (Cb), and with network interactions from these cortical regions to the cerebellum. The spectral analysis of single-trial EEG source waveforms at the cortical regions further showed that there were bidirectional interactions between PMC and SMA, and the complexity of rhythms was associated with power spectra and Granger causality spectra in the beta (13–30 Hz) frequency band, not in the alpha (8–12 Hz) and gamma (30–58 Hz) bands. These results provide us new insights into the mechanisms for movement rhythm complexity.
Introduction
R
Recent advances in neuroimaging techniques have enabled us to acquire simultaneous recordings with multiple modalities. Noninvasive neuroimaging techniques can be divided into two groups based on their measurement principles: electrophysiological measurement, such as electroencephalography (EEG) and magnetoencephalography (MEG), and hemodynamic measurement, such as functional magnetic resonance imaging (fMRI) and near-infrared spectroscopy (NIRS). EEG/MEG record millisecond changes in brain electrical but have poor spatial resolution, while fMRI/NIRS can provide spatial localization of activity within millimeters but are suffered from the slow vascular response limiting their temporal resolution (Fazli et al., 2012).
The multimodal approach can overcome these limits by complementing each signal (Biessmann et al., 2011; Friston, 2009; Shibasaki, 2008). Simultaneous fMRI-EEG data recording solve the problem to get high spatial and temporal resolution to study the brain dynamics in an efficient manner and give us information about the brain activity and networks (de Souza et al., 2013; Meyer et al., 2011; Novitskiy et al., 2011; Ostwald et al., 2011). Even in well-established cognitive experiments, the behavior of the same participant in the same task can differ substantially between EEG and fMRI recording sessions (Ullsperger and von Cramon, 2001), as EEG recordings are carried out in a sound-attenuated chamber and upright position, whereas fMRI blood oxygenation-level-dependent (BOLD) signals are recorded in a bit noisy MRI environment and a supine position. The advantage of simultaneous fMRI-EEG recordings lies clearly in otherwise inevitable differences of subject preparation, data acquisition, and variable behavioral outcomes between separate recording sessions (Ullsperger, 2010). Simultaneous protocols not only guarantee identical sensory stimulation, perception, behavior, and avoid order or repetition effects (Debener et al., 2006) but also provide a unique way to study how these intrinsic brain states interact with event-related, extrinsic processing. More recent developments in amplifier design, and artifact-correction procedures now make it much easier to obtain reasonable EEG data quality (Debener et al., 2007; Iannetti et al., 2005; Niazy et al., 2005; Sammer et al., 2005).
The brain signals from fMRI and/or EEG measurements can be used to extract large-scale brain connectivity patterns. The information of functional interaction obtained by a symmetric measure such as cross-correlation has been referred to as functional connectivity (Friston et al., 1993). Granger causality (GC) (Granger, 1969, 1980) can be used to estimate directed functional connectivity. This technique is based on the notion of linear prediction of one signal by incorporating the past information of another signal. This approach does not require any assumption of prior connectivity structures as required in structural equation modeling (Buchel and Friston, 1997; McIntosh and Gonzalez-Lima, 1994), nonlinear system identification techniques (Friston and Buchel, 2000), and Bayesian estimation of deterministic state-space models (Friston et al., 2003). GC methods have been successfully applied to electrophysiological animal data (Baccala and Sameshima, 2001; Bernasconi and König, 1999; Bernasconi et al., 2000; Brovelli et al., 2004; Liang et al., 2000, 2017), human EEG data (Hesse et al., 2003; Kaminski et al., 2001), and human fMRI data (Goebel et al., 2003, 2004; Harrison et al., 2003; Sato et al., 2006). Recently, a model-free, copula-based GC method has been applied to both simulations and neural data (Hu and Liang, 2014).
Here we designed a rhythmic finger-tapping (RFT) task with different beat complexities and collected high-quality simultaneous fMRI-EEG signals. The present study aimed at applying GC to BOLD signals to investigate the pattern of directed interactions within the regions involved in the generation of motor rhythms and examine the interaction patterns using the EEG source signals from the cortical brain activation regions of the sensorimotor network. We also compared the oscillatory activity of these nodes at rest and RFT task. We applied GC methods to extract complementary information from fMRI-EEG simultaneous recordings about the brain activity flow patterns among motor regions during RFT task.
Materials and Methods
Participants
There were nine participants (eight males, one female; mean age ± standard deviation = 26.6 ± 4.1 years), who completed all the three simultaneous fMRI-EEG recording sessions. All participants had normal or corrected to normal vision and reported normal neurological history. Participants provided signed informed consent forms and were compensated for their participation in the experiment. The Institutional Review Board of Georgia State University approved the study.
Data acquisition and analysis
Before setting up for simultaneous fMRI-EEG acquisition, participants were informed about the details of the task and took part in a practice session to familiarize them with the task. Following the EEG setup, participants were briefly explained on the basic principles of EEG and how to minimize introducing contaminants into the ongoing EEG signals. The experiment consisted of three functional runs, each run had the durations for rest and RFT tasks. Each run was 8-min long, during which the subject was asked to rest (equivalently, 0 beat rhythm) for a minute and perform RFT on a response box with different beat rhythms (1, 2, and 3), a minute each. The visual cues were 0 for motor-resting condition or for 0-beat rhythm (B0), 1 for 1-beat rhythm (B1), 2 for 2-beat rhythm (B2), and 3 for 3-beat rhythm (B3). During the presentation of 0, subjects were asked to keep their right index finger in contact with the button maintaining a slight pressure but without any movement. Each visual cue (0, 1, 2, or 3) appeared twice, a minute each in randomized sequence within a run. The task trial sequence was displayed and randomized using stimulus software presentation (
EEG was recorded using an MRI-compatible EEG system with a 68-channel electrode cap, AgCl sintered electrodes, and SynAmps2 amplifiers at a sampling rate of 10 kHz/channel (Neuroscan Systems, Charlotte, NC). Analog-to-digital conversion was performed at a resolution of 24 bits. The electrode cap was aligned to standard cranial fiducials and exploring electrodes were referenced against the right mastoid. Electrode impedances were kept below 10 kΩ. An fMRI pulse was used as a trigger to simultaneously start the stimulus presentation for displaying visual cues and EEG recordings.
The EEG data, contaminated by gradient artifacts due to magnetic field gradients, and ballistocardiogram (BCG) artifacts due to cardiac pulsations, were processed in BrainVision Analyzer 2 (Brain Products, Germany), which detected and corrected the EEG artifacts. During the preprocessing step, the average of the recorded EEG data was used as a new reference (average reference). MR-induced artifacts in the EEG signal were subtracted from the raw data using standard inbuilt algorithms (Allen et al., 1998, 2000). The MR-gradient artifact (obtained by utilizing the repetitiveness of the artifact shape to form an average artifact template) was removed and the data were downsampled to 200 Hz, with a low-pass filter, 58 Hz, with 48 as the slope for finite impulse response filter before pulse artifact correction. The cardioballistic artifact caused by movement due to heartbeat was subtracted from the EEG data. QRS complexes of the heartbeat were semiautomatically identified in the BCG channel, which showed a clearly detectable R-peak. Since the cardioballistic artifact is highly variable across time, subtraction templates were continuously recalculated using a sliding average. After the corrections for gradient and cardioballistic artifacts, the data were low-pass filtered at 58 Hz to attenuate high-frequency noise and then an independent component analysis was performed to eliminate artifacts of eye movements, eye blinks, muscle activity, and residual MR artifacts.
Besides these corrections, data from each recording session from each individual subject were thoroughly inspected visually and data from bad electrodes were discarded and replaced, when appropriate, by spatial interpolation of the recordings from the neighboring working electrodes. The preprocessed data were then imported using MATLAB-interface in Analyzer and read in EEGLAB format, and later separated into data segments for B0, B1, B2, and B3 based on behavioral trial sequences. These trial segments were used to reconstruct the EEG source waveforms using the minimum norm estimate (MNE) technique, one of the inverse solution approaches (Hamalainen and Ilmoniemi, 1994; Wang et al., 1992). The MNE estimates the source activity without a priori assumption about the sources' location and activity. In this study, we selected the cortical brain activation loci derived from fMRI images.
fMRI data
The whole-brain MRI was done on a 3-Tesla Siemens scanner in the Biomedical Imaging Technology Center at Emory University, Atlanta, GA. The functional scans were acquired with T2*-weighted gradient echo-planar imaging protocol with the following parameters: echo time (TE) = 32 ms, repetition time (TR) = 2000 ms, flip angle = 90°, voxel size = 3 × 3 × 4 mm3, field of view = 256 × 256 mm, matrix size = 64 × 64, and 33 axial slices each of 5 mm thickness. High-resolution anatomical images were acquired using a magnetization-prepared rapid gradient-echo sequence with the parameters: TR = 2300 ms, TE = 2.91 ms, flip angle = 9°, and voxel size = 1 × 1 × 1 mm3. Statistical Parametric Mapping 8 (SPM8) (
A random-effect, model-based, univariate statistical analysis was performed in a two-level procedure. At the first level, a separate general linear model (GLM) was specified as per the task sequences. In GLM analysis, the conditions: B0, B1, B2, B3, and six motion parameters were included. The six motion parameters, entered as nuisance covariates, were regressed out of the data. Individual contrast images from the first-level analysis were then entered and a second-level analysis for a separate one-sample t-test. The summary statistical maps thus obtained were then thresholded [(p < 0.001, uncorrected; a cluster size (k > 10)] and overlaid on high-resolution structural image in MNI orientation. We then performed multiple comparison correction on all activation t-maps using Monte Carlo simulation implemented in AFNI (Cox, 1996) (AFNI 3dClusterSim
Connectivity analysis-fMRI
The regions of interest (ROIs) were based on brain activation t-maps from task versus rest contrast. We defined three ROIs, by generating a sphere of 6 mm radius. The center coordinates were (−45, −16, 52) for the left primary motor cortex (LPMC), (0, −1, 61) for the supplementary motor area (SMA), and (21, −49, −26) for the right cerebellum (RCb). The time courses from all the voxels within each ROI and all subjects were extracted for each experimental task and rest blocks. We performed GC analysis to characterize the directional influences between these ROIs.
For each ROI data, we constructed hidden neural signals by hemodynamic deconvolution as done in previous studies (David et al., 2008; Handwerker et al., 2004; Roebroeck et al., 2011; Valdes-Sosa et al., 2011; Wu et al., 2013). The reason behind this is fMRI-BOLD signals are believed to be originated from smoothing of neuronal activity by the hemodynamic response function (Aguirre et al., 1998; Handwerker et al., 2004). The segmented deconvolved BOLD time series after removing the ensemble-mean separately from each voxel and subject were treated as trials for reliable estimates of the network measures. We calculated the GC spectra by the parametric approach (Dhamala et al., 2008). To find significance level of GC, we constructed surrogate data sets by randomly permuting trial or segment order from each participant and task condition, computed GC from each data set, built a distribution of maximum GC values, and estimated the threshold for significant GC as in previous studies (Blair and Karniski, 1993; Brovelli et al., 2004). The threshold was thus based on the null hypothesis that there was no statistical interdependence between nodes when trials were randomized. We computed GC spectra from all possible pairs of ROIs with a minimum of 1000 random permutations per task condition and picked maximum GC on each permutation. The threshold value for GC spectra at significance p < 10−6 was obtained by fitting the distribution with a gamma-distribution function and this threshold value was used to identify significantly active directed network activity among ROIs calculated in pairwise GC analysis. We applied conditional GC analysis to differentiate direct and indirect connections between three nodes to address the drawbacks of GC analyses as stated in previous fMRI and EEG connectivity studies (Hesse et al., 2003; Roelstraete and Rosseel, 2012). We ruled out the mediated interactions and retained only the direct network interactions. We also computed the time-domain GC values for significantly active network directions from each participant and performed paired t-tests to find the significant network modulation during the task conditions in comparison to rest.
Connectivity analysis-EEG
We computed task-related activations from fMRI data. We used the information of the brain activations into the source modeling analysis of EEG data. As the activation foci derived from fMRI images can be used to guide the placement of dipole locations (Liu et al., 2006), we selected the cortical activation loci primary motor cortex (PMC) and SMA as reliable EEG sources. We did not consider Cb activation as a source in the EEG source modeling since Cb is a deeper brain source. We fitted the dipoles at fMRI peak activation locations [Talairach coordinates: (−45, −16, 48) for PMC and (0, 2, 56) for SMA with dipole orientations (0.2, −1.0, 0.2) and (0.1, 1.0, 0.1), respectively]. Using the minimum norm estimate approach, one of the inverse solution techniques, in Brain Electrical Source Analysis Research software version 6.0 (
We calculated wavelet-based spectral power and parametric spectral measures: coherence and GC. The same procedures, as performed in fMRI time series, were followed for the EEG source waveforms to determine the model order that better described the data and used for spectral calculation. The thresholds for statistical significance p < 10−3 were computed from surrogate data using permutation tests and a gamma-function fit.
Results
Brain activations
Figure 1 shows the fMRI activation maps for the duration when participants performed the RFT tasks: B1, B2, and B3, and during rest (B0). The tapping task versus rest contrast showed activations in LPMC, SMA, and RCb (Fig. 1A). B1 versus B0 contrast showed the activation in SMA, LPMC, and RCb (Fig. 1B), whereas B2 versus B0 showed activations in left putamen in addition to RCb and the LPMC (Fig. 1C). Similarly, B3 versus B0 showed activation in the left putamen, RCb, LPMC, and SMA (Fig. 1D). These activations were initially subjected to a cluster-forming threshold p < 0.001 and cluster size, k > 10. We performed multiple comparison correction on all activation t-maps using Monte Carlo simulation implemented in AFNI (Cox, 1996) (AFNI 3dClusterSim
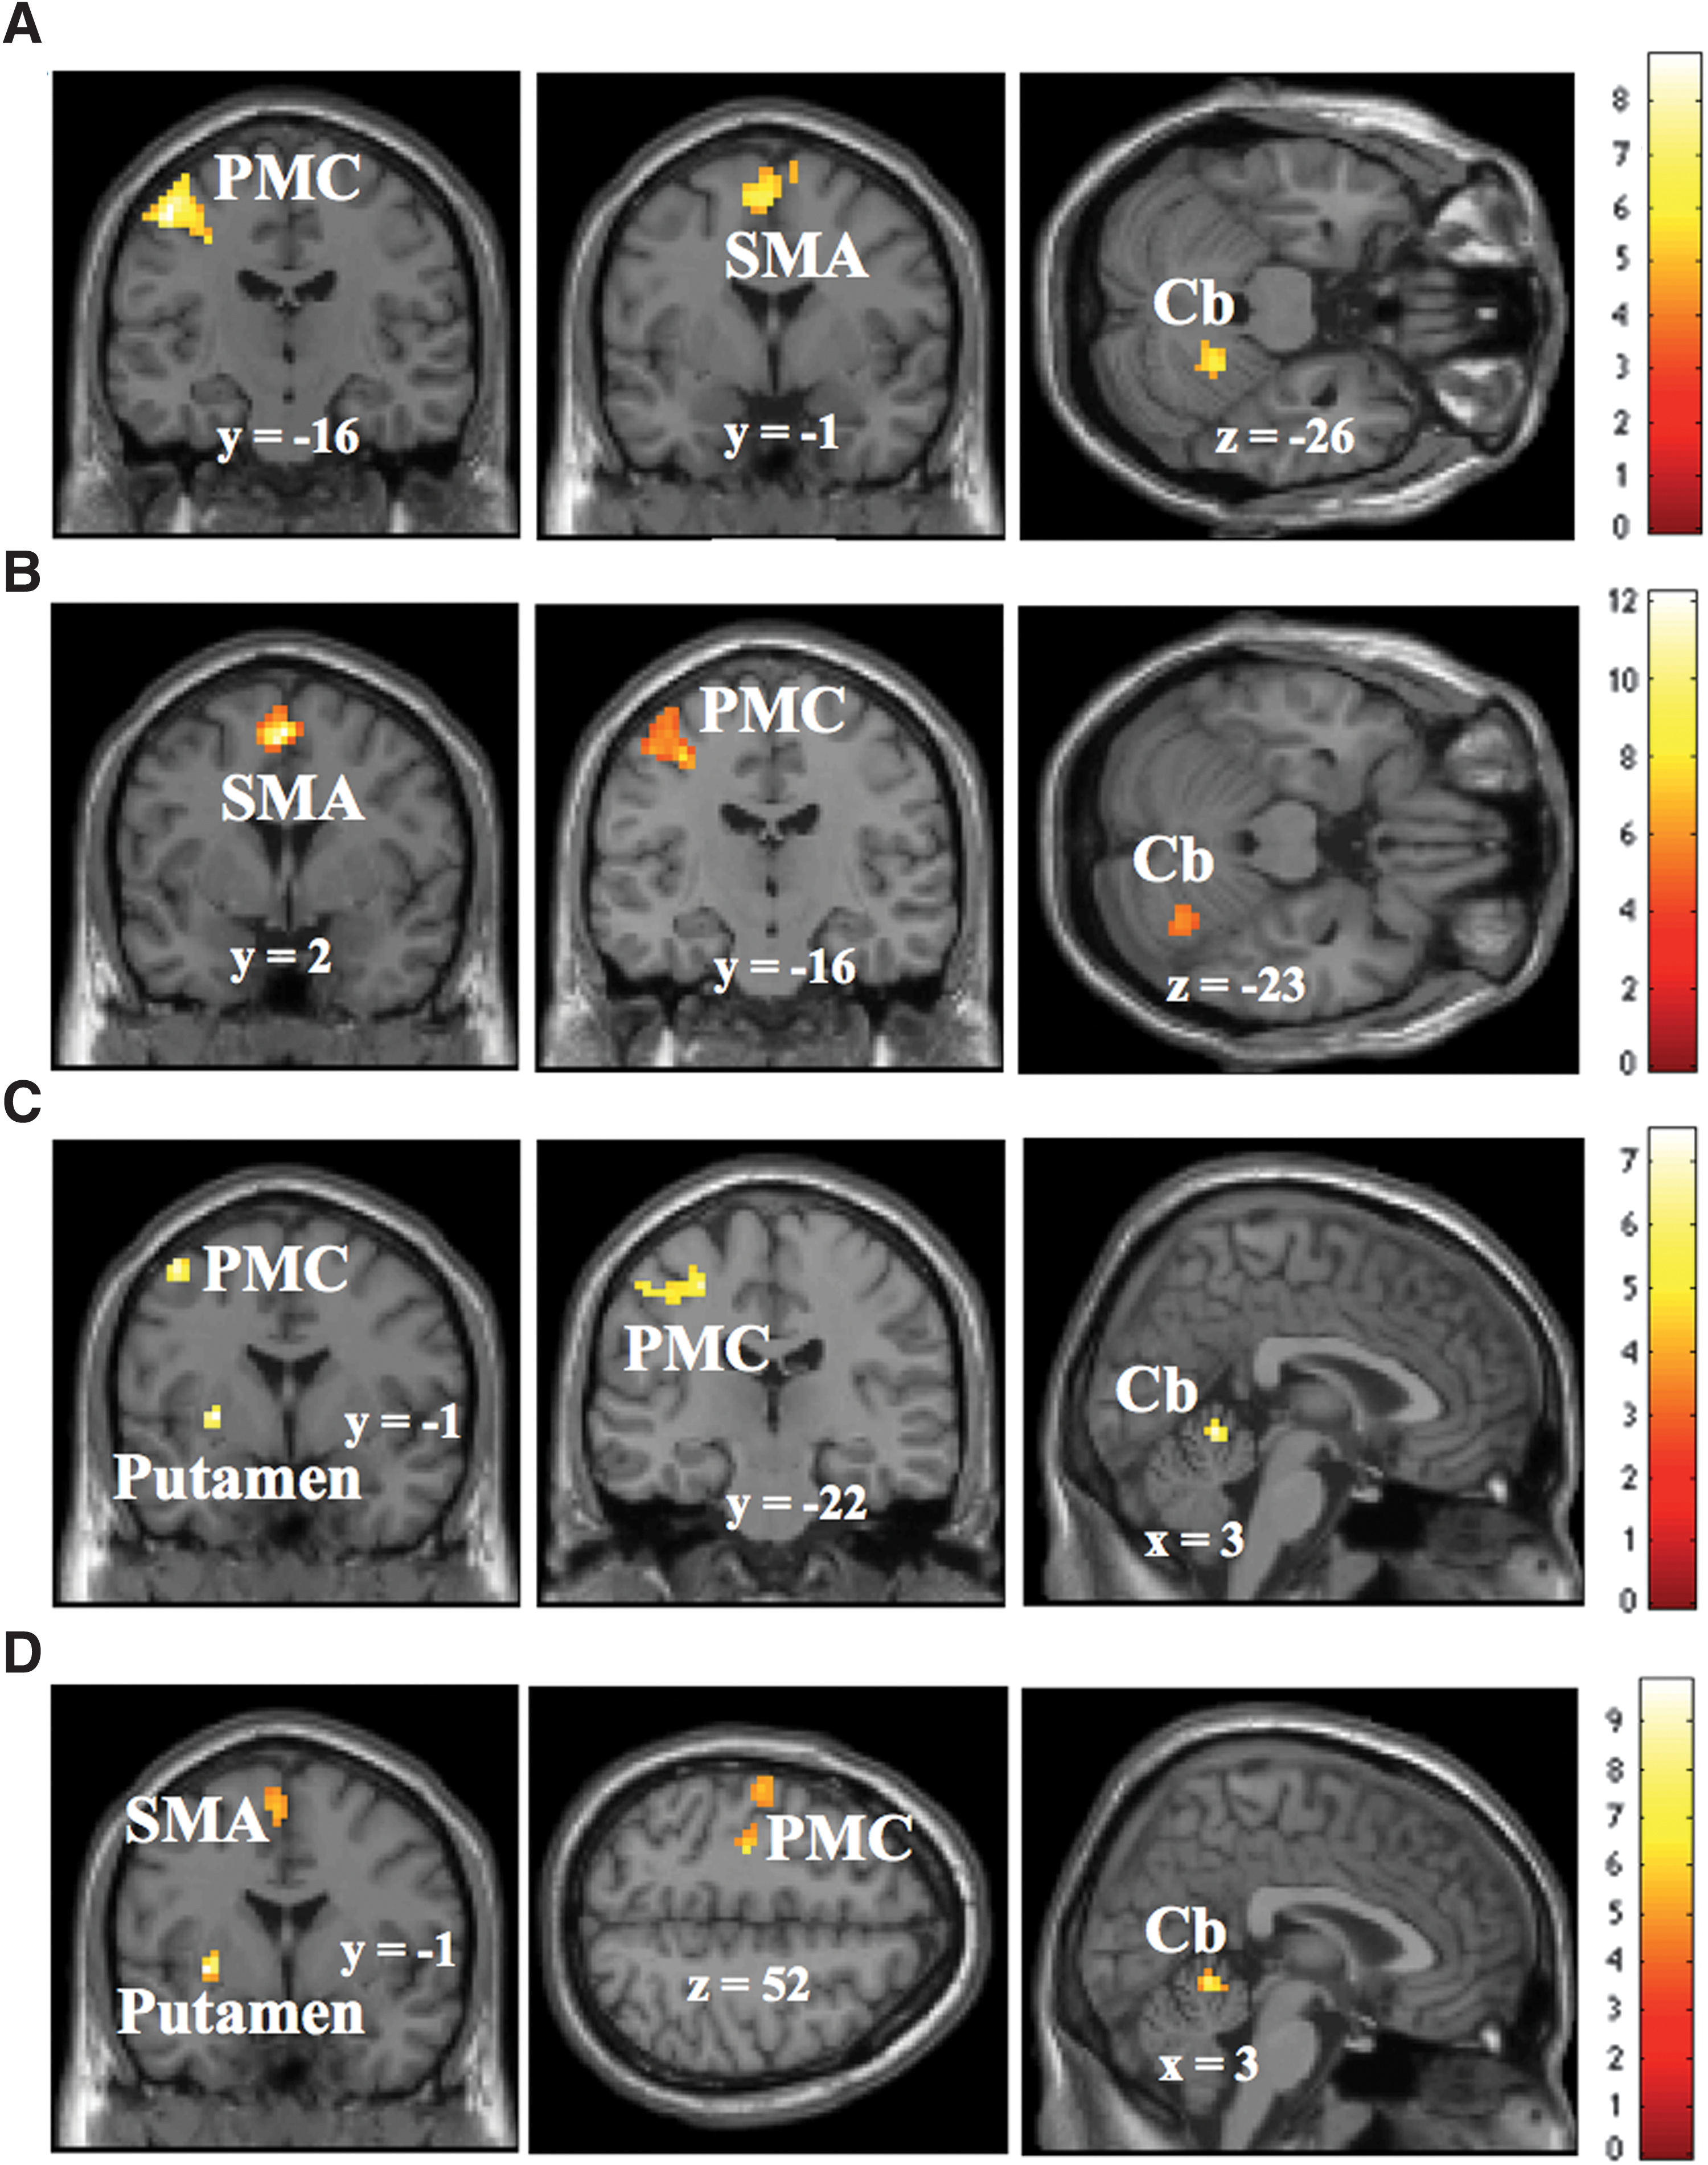
Brain activations: The brain activations shown are for RFT tasks versus rest (0-beat rhythm)
It includes information about anatomical locations, cluster sizes, t-value (z-score), and MNI coordinates for the activations under statistical significance p < 0.001 and cluster extent k > 10. The t-map of each contrast is corrected for multiple comparisons using Monte Carlo simulation implemented in AFNI (Cox, 1996) (AFNI 3dClusterSim
p < 0.05; ** p < 0.01; *** p < 0.001.
B0, 0-beat rhythm (rest); B1, 1-beat rhythm; B2, 2-beat rhythm; B3, 3-beat rhythm; Cb, cerebellum; L, left; MNI, Montreal Neurological Institute; n.s., not significant; PMC, primary motor cortex (pre/postcentral gyrus); R, right; SMA, supplementary motor area.
BOLD response
Analysis was carried out to examine how node activity changes during finger tapping versus rest contrast, B1-B0, B2-B0, and B3-B0. We calculated the average region-specific beta (β) values for LPMC, RCb, and SMA during these conditions in the tapping tasks. The node activities, as indicated by β-values, were significantly higher (p < 0.05) for B3-B0 compared with B2-B0 and B1-B0 for all nodes as shown in Figure 2. There were no significant differences in node activities when β-values for B2-B0 were compared with β-values for B1-B0. The details of the statistical test results are given in Table 2a.
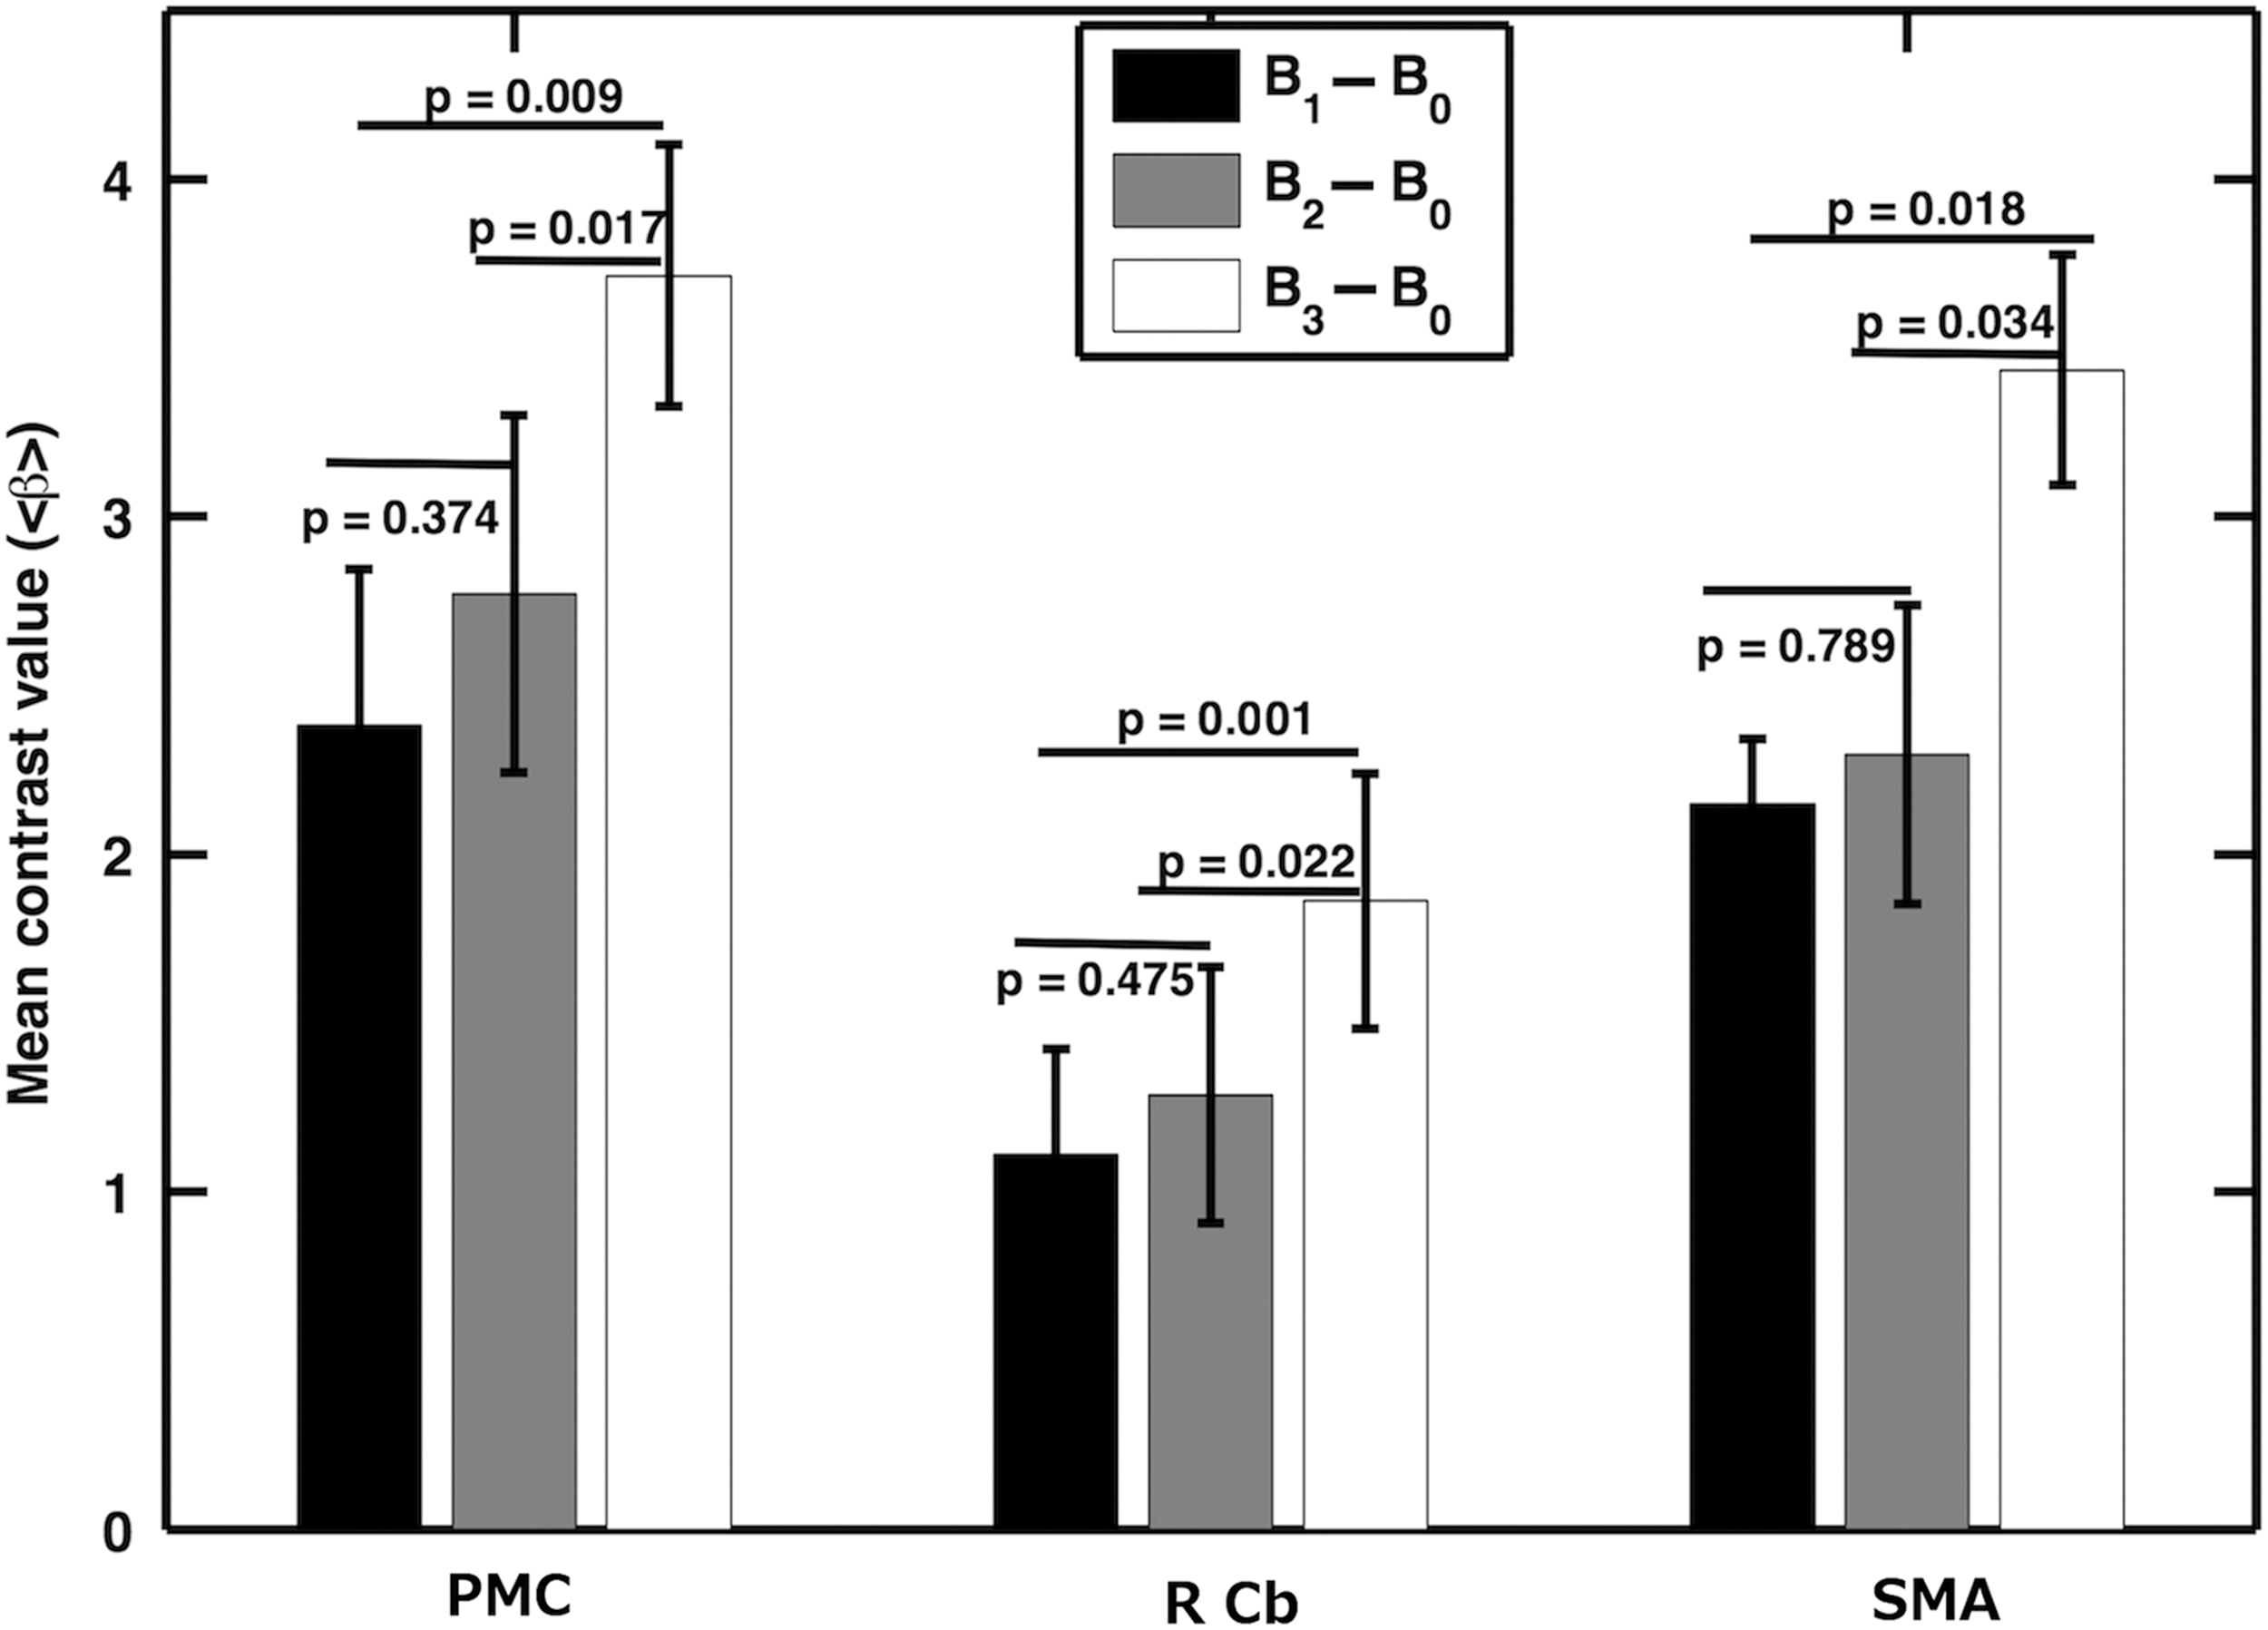
Comparison between contrast values: contrast values (<β>) were calculated for (B1
Bold values represent that statistical significance level, p < 0.05.
Network activity
We computed the pairwise-GC spectra to assess network interactions among the three nodes: LPMC, RCb, and SMA (nodes were selected based on task versus rest contrast) for button presses that included the time series for B1, B2, and B3. The permutation threshold criteria were followed to find the significant causal interaction directions (for details, see the Materials and Methods section). The significant causal connections among these nodes (represented schematically) are shown in Figure 3A. The interaction directions between two nodes are direct and are not mediated by the remaining third node. The numerical values are the peak GC values from the GC spectra and represent the strength of the causal interactions. During RFT tasks, we found the bidirectional causal interactions between PMC and SMA, unidirectional causal influences from PMC and SMA to Cb.
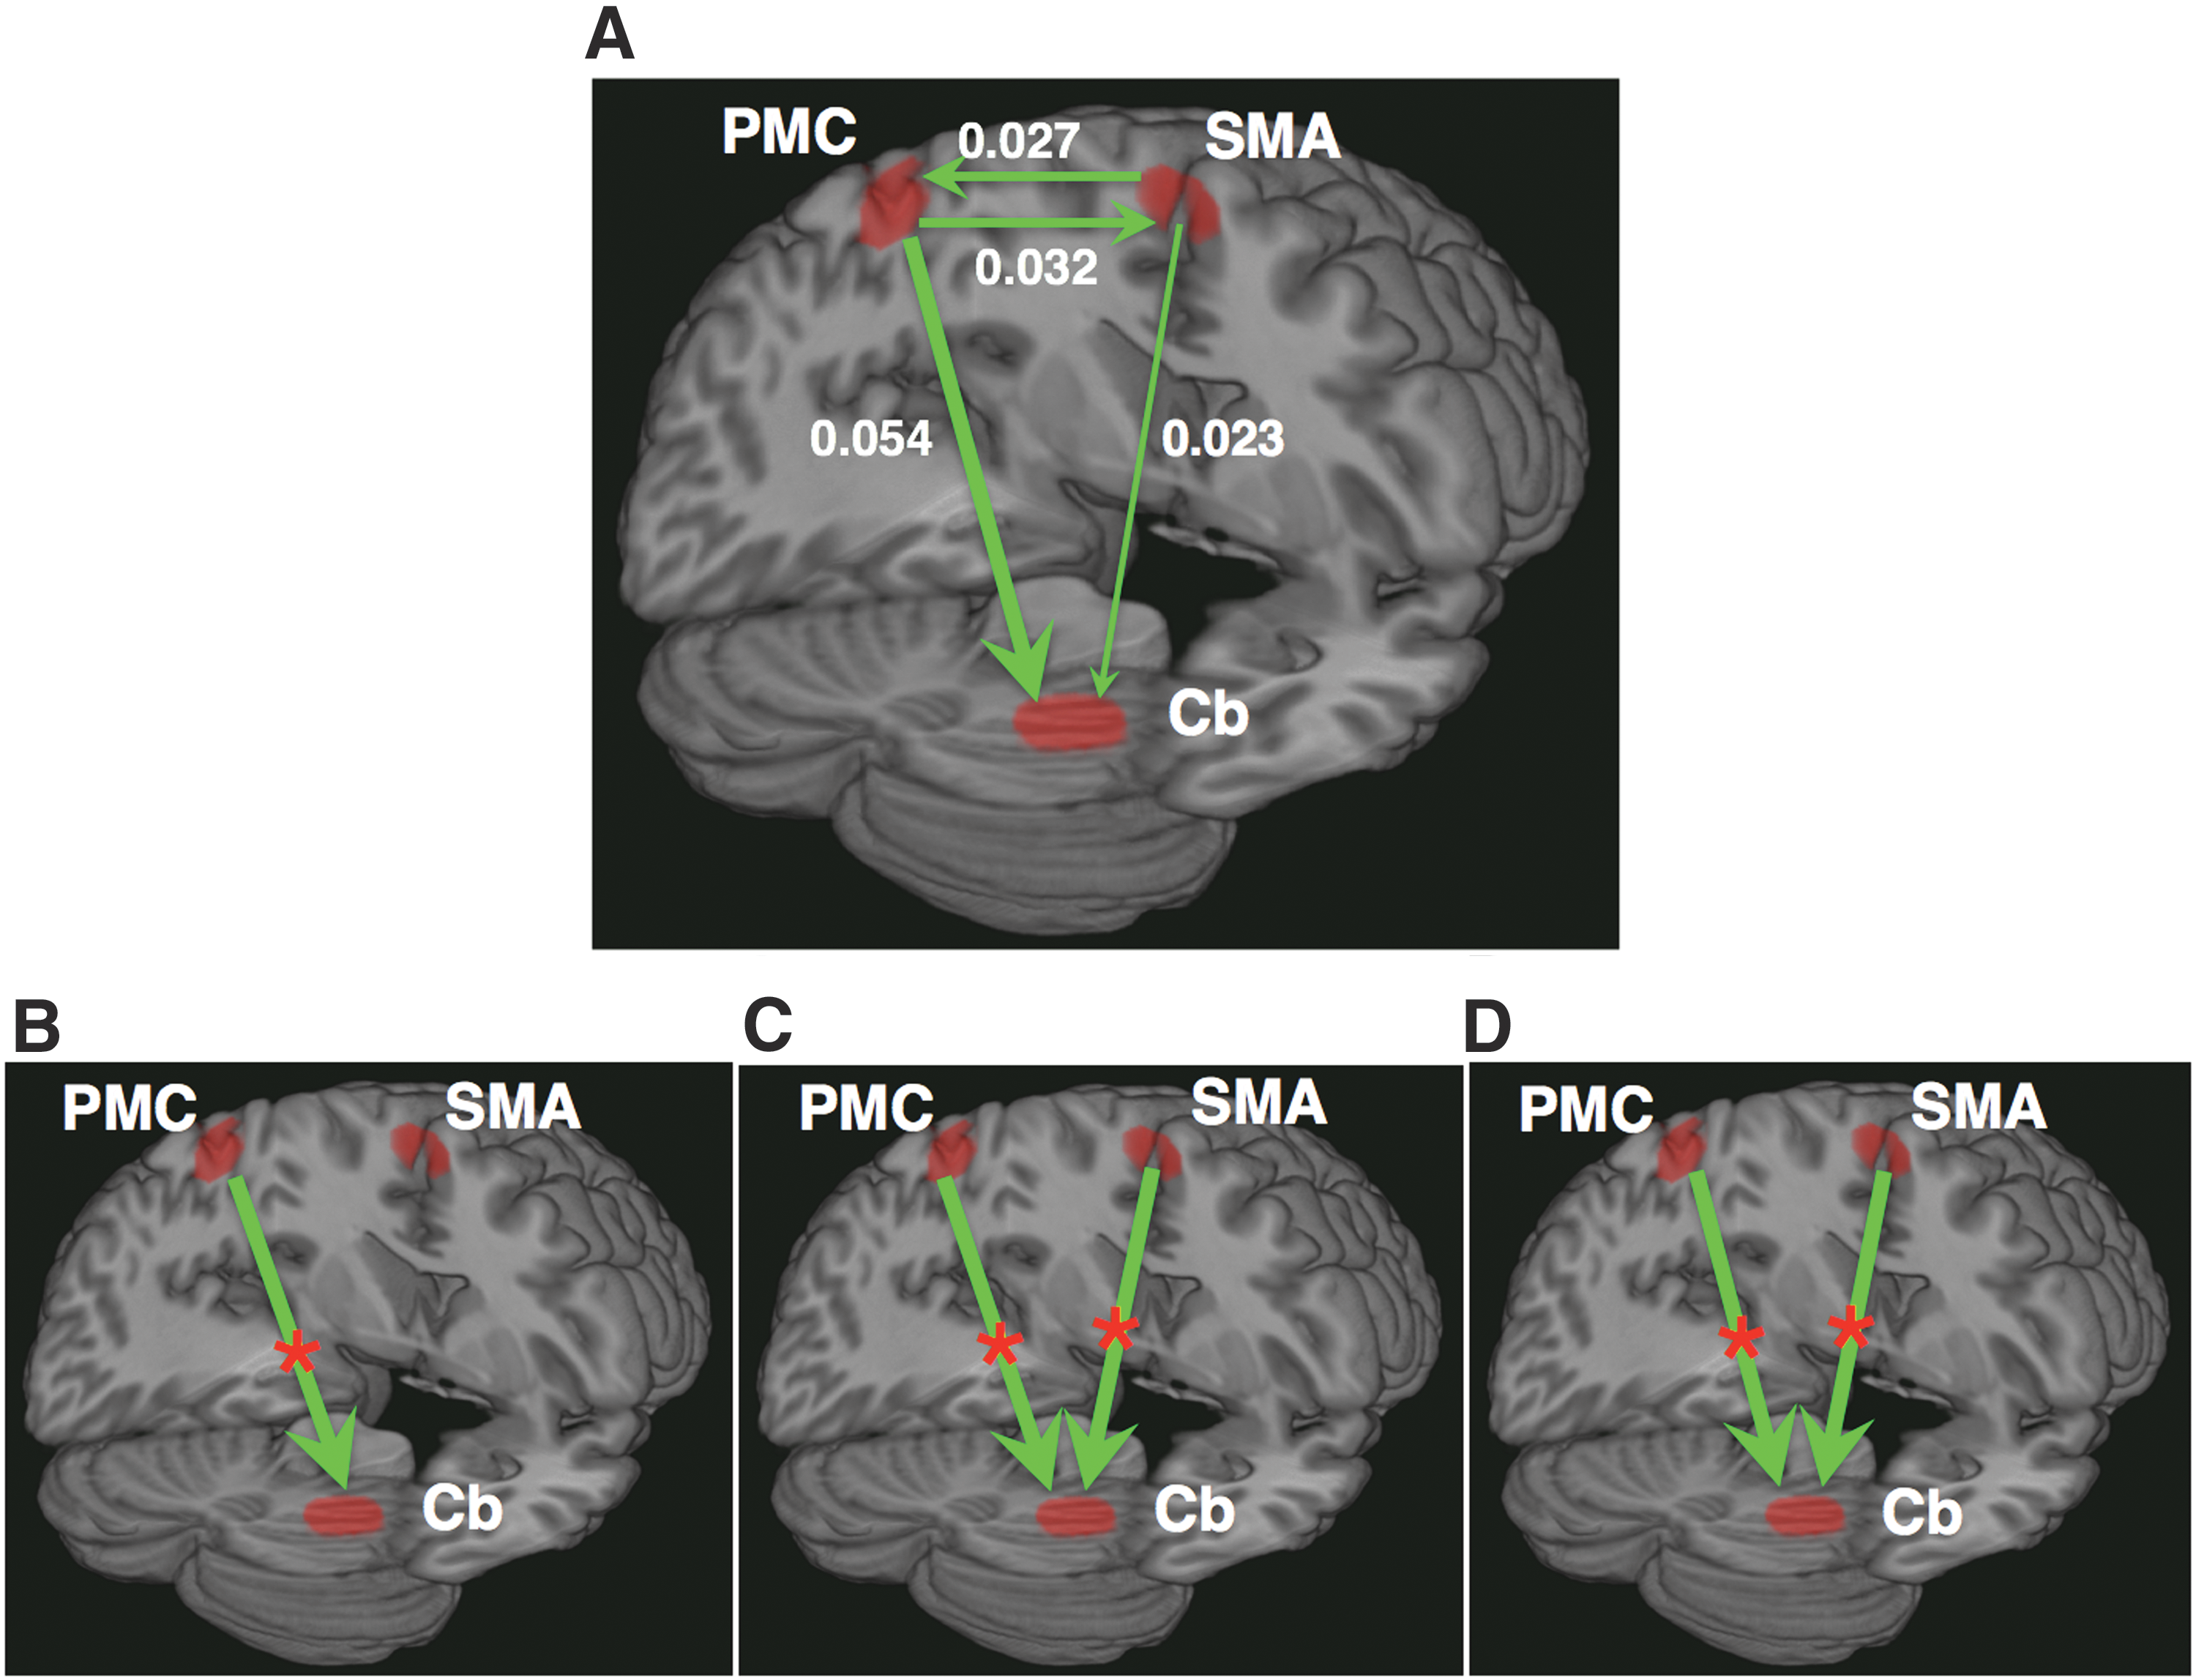
Network interactions: Schematic representation of significant causal interaction directions among three nodes: LPMC, SMA, and RCb. The significant causal connections for RFT tasks (all beats), as determined by using permutation threshold criteria (p < 10−6), are shown in
From the GC-spectra for B0, B1, B2, and B3 of each participant, we calculated the time-domain GC values, integrating the entire frequency range (0.0185–0.25 Hz). When we compared the causal influences between B1 and B0, we found that there was a significant increase (p < 0.05) in causal influence from PMC to Cb (Fig. 3B). The causal influences increased significantly (p < 0.05) from PMC to Cb and from SMA to Cb during B2 and B3 compared with B0 (Fig. 3C, D). Here a significant increase in causal influence is marked with a star (*).
EEG artifact preprocessing
This study consisted of a total of 27 runs, 3 data recording sessions per subject. Each recording session consisted of two 1-min segments for each rhythm (B0, B1, B2, and B3) and hence it is of an 8-min length. During artifact preprocessing, we excluded the two data segments from two subjects, a segment each for B0 and B3 for a subject and a segment for each B1 and B2 for the next subject. The number of interpolated electrodes varied from 1 to 12 in these 27 recording sessions, with the mean (±standard deviation) 7 (±2).
fMRI-constrained EEG analysis
The single-trial source waveforms for fMRI-constrained cortical sources, PMC and SMA, were used to compute the spectral power. Considering all source waveforms from all participants, we found spectral peaks at ∼10 Hz (α-range), ∼16 Hz, and ∼26 Hz (β-range), the peak at ∼26 Hz had a higher magnitude for both nodes (Fig. 4A, B) in all conditions. No changes in α-band (8–12 Hz) node activities were found for both nodes during task conditions compared to rest (Fig. 4C). However, we found a significant decrease (p < 0.05) in β-band (13–30 Hz) node activities during B2 and B3 compared with B0 (Fig. 4D). The statistical details are given in Table 2b.
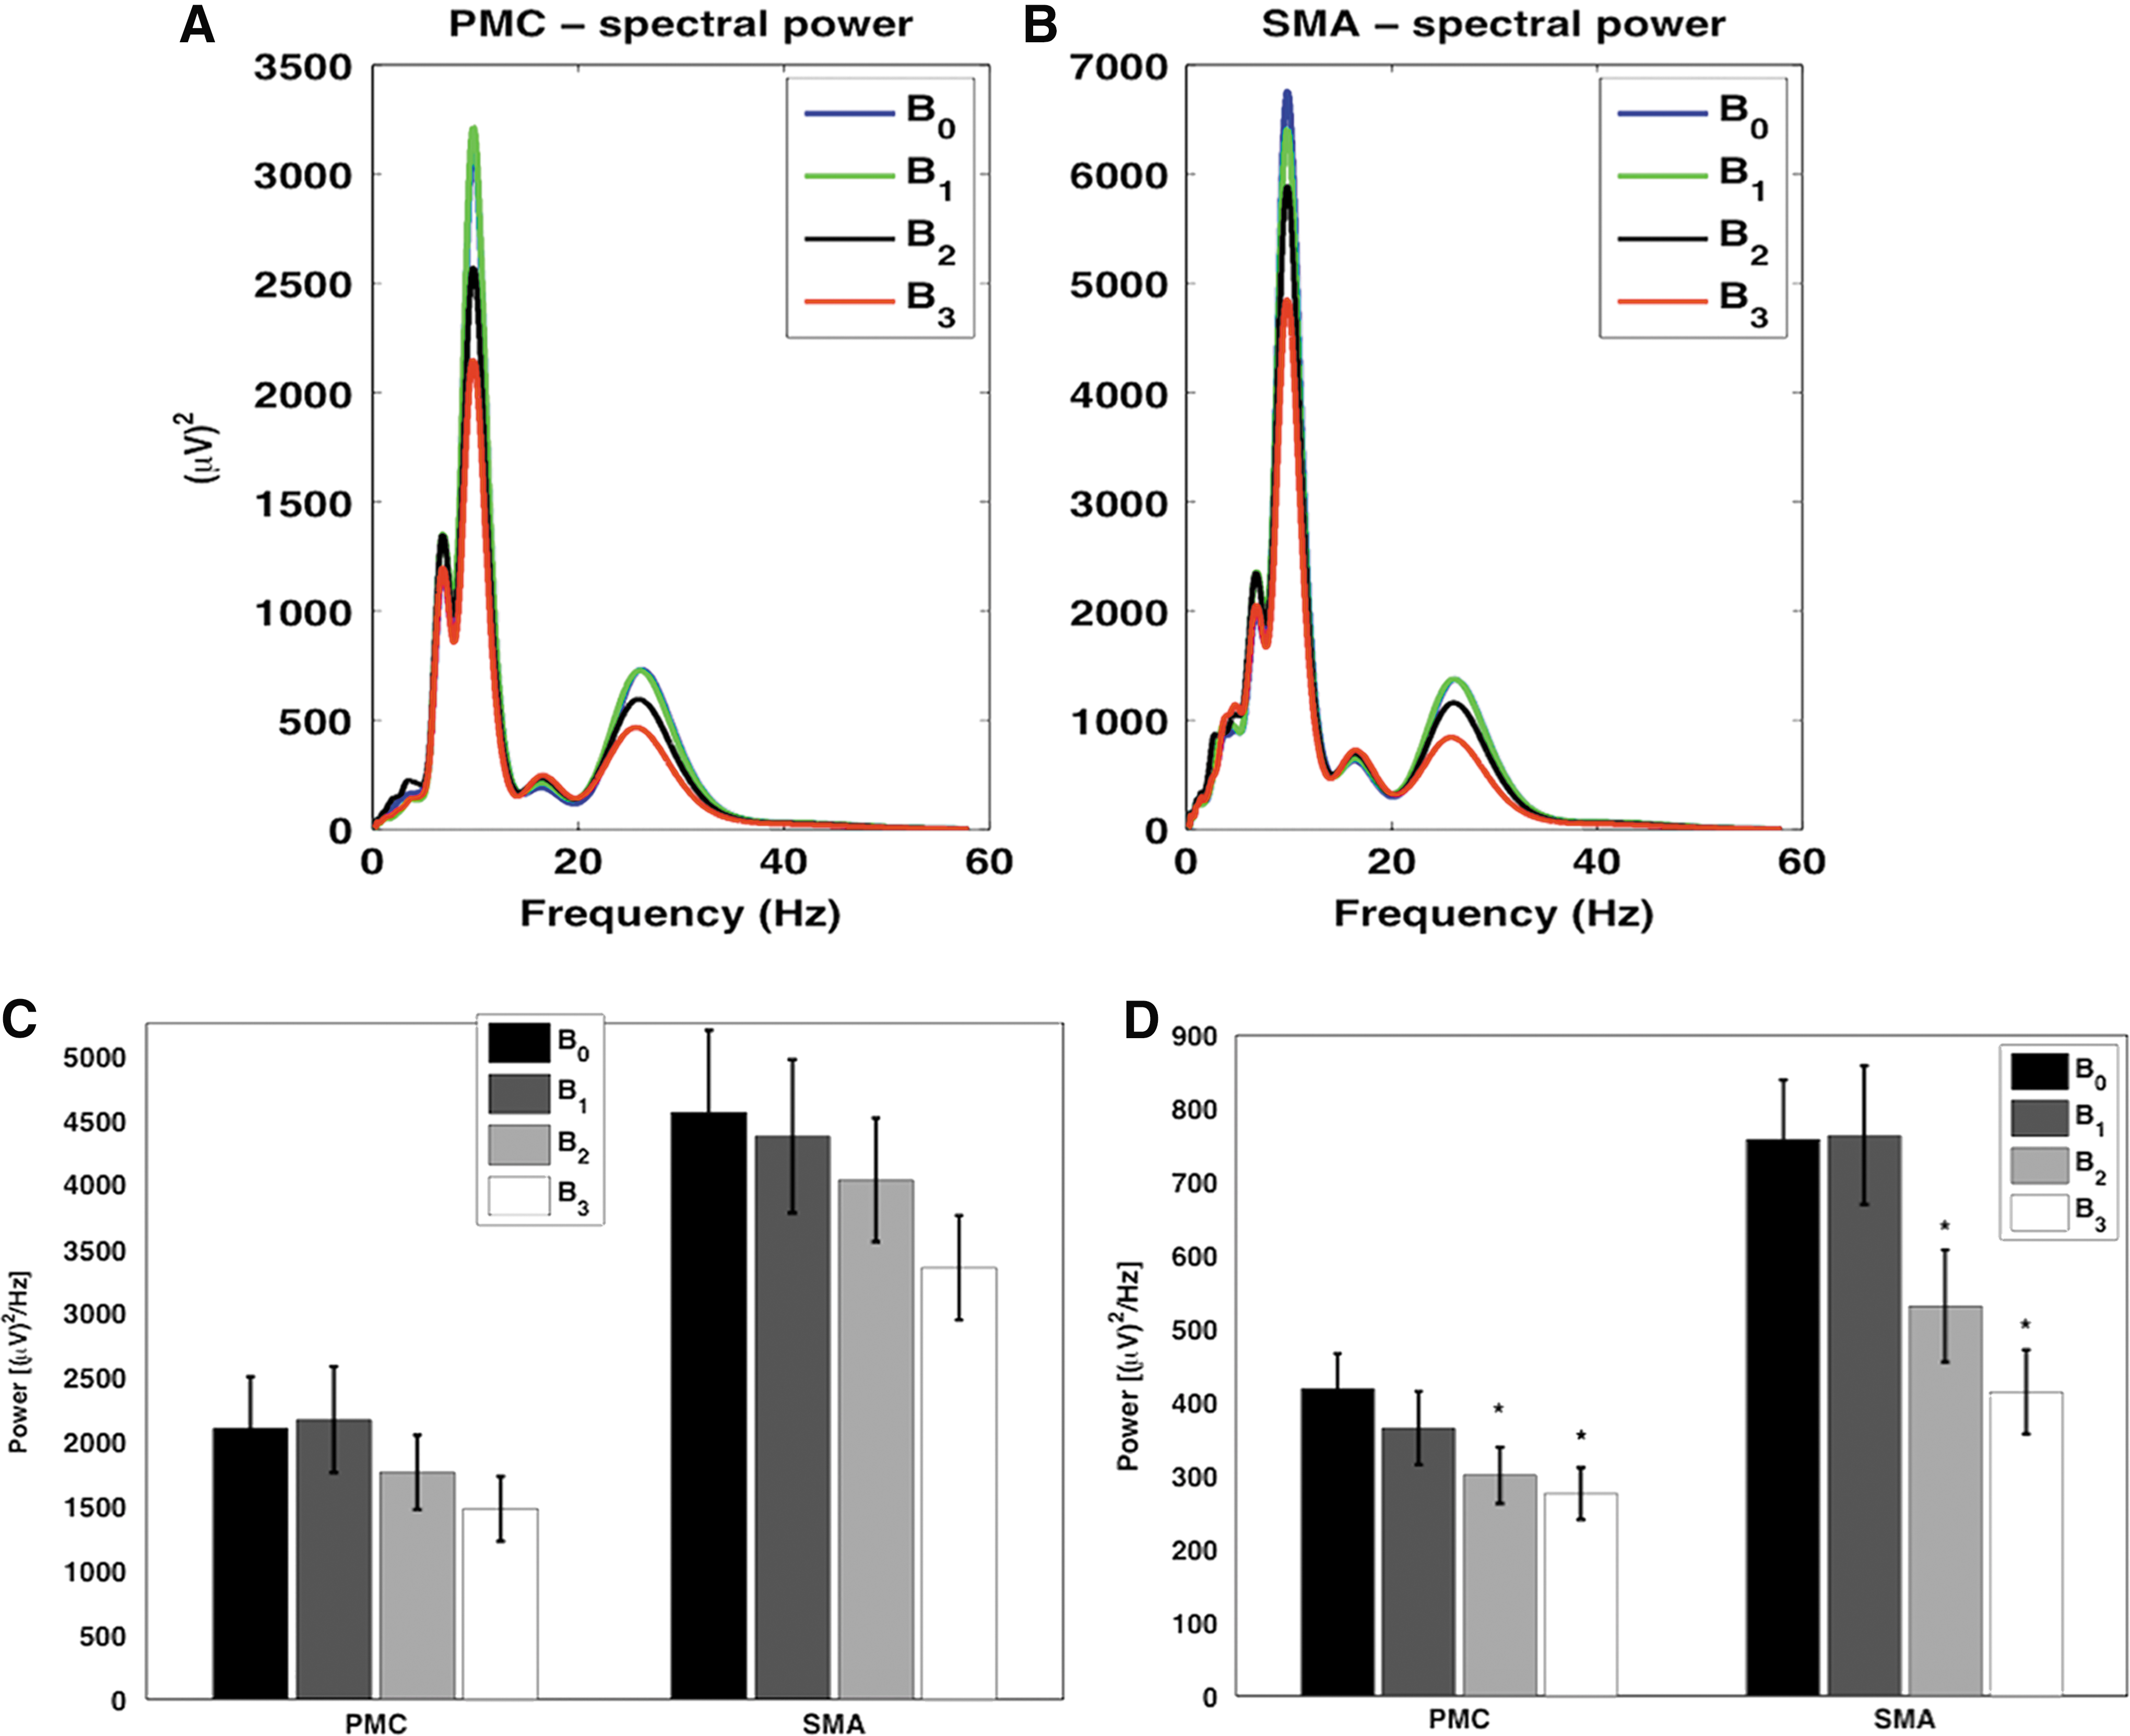
EEG spectral power and power differences: Upper panel shows spectral power for rest (0-beat rhythm, B0), and finger tapping tasks (B1: 1-beat rhythm, B2: 2-beat rhythm, and B3: 3-beat rhythm) from PMC
From the pairwise-GC spectral calculation using single-trial source waveforms for button presses and the permutation threshold criteria as described in the Materials and Methods section, we found bidirectional causal interactions, from PMC to SMA and from SMA to PMC, significant. We calculated time-domain GC values for the entire frequency range for our calculation here (0.12–58 Hz), α-band, β-band, and γ-band (30–58 Hz) for button presses (BP) and rest (B0). For the entire frequency range, the causal interactions from SMA to PMC and from PMC to SMA differed significantly (p < 0.05). There was a greater causal influence during BP than B0 (Fig. 5A). These causal influences during BP were significantly higher (p < 0.05) than B0 for β-band (Fig. 5C), but not for α-band and γ-band (Fig. 5B, D). Furthermore, to investigate whether the reconstructed EEG source signals were affected by any residual volume conduction in EEG inverse source estimation, we used the procedure of time-shifting-driven signals that were used in previous studies (Adhikari et al., 2014; Faes et al., 2013; Lindner et al., 2011) to evaluate potential effects of residual volume conduction in the reconstructed source signals, to rule out the possibility that GC patterns had anything to do with volume conduction. The comparison between the maximum GC values of the original time series (for the reconstructed source waveforms) and the distribution of values obtained for a set of 50 time-shifted surrogates showed that the causal influences were not strengthened by time shifting the driven signals during B0 and BP (Fig. 6). The directed causal influences were not the result of volume conduction during B0 and BP. Figure 6 shows the causal interactions between SMA and PMC for beta-frequency (13–30 Hz) and the entire frequency range (0.12–58 Hz), and these interactions were not affected by any residual volume conduction in reconstructed source signals.
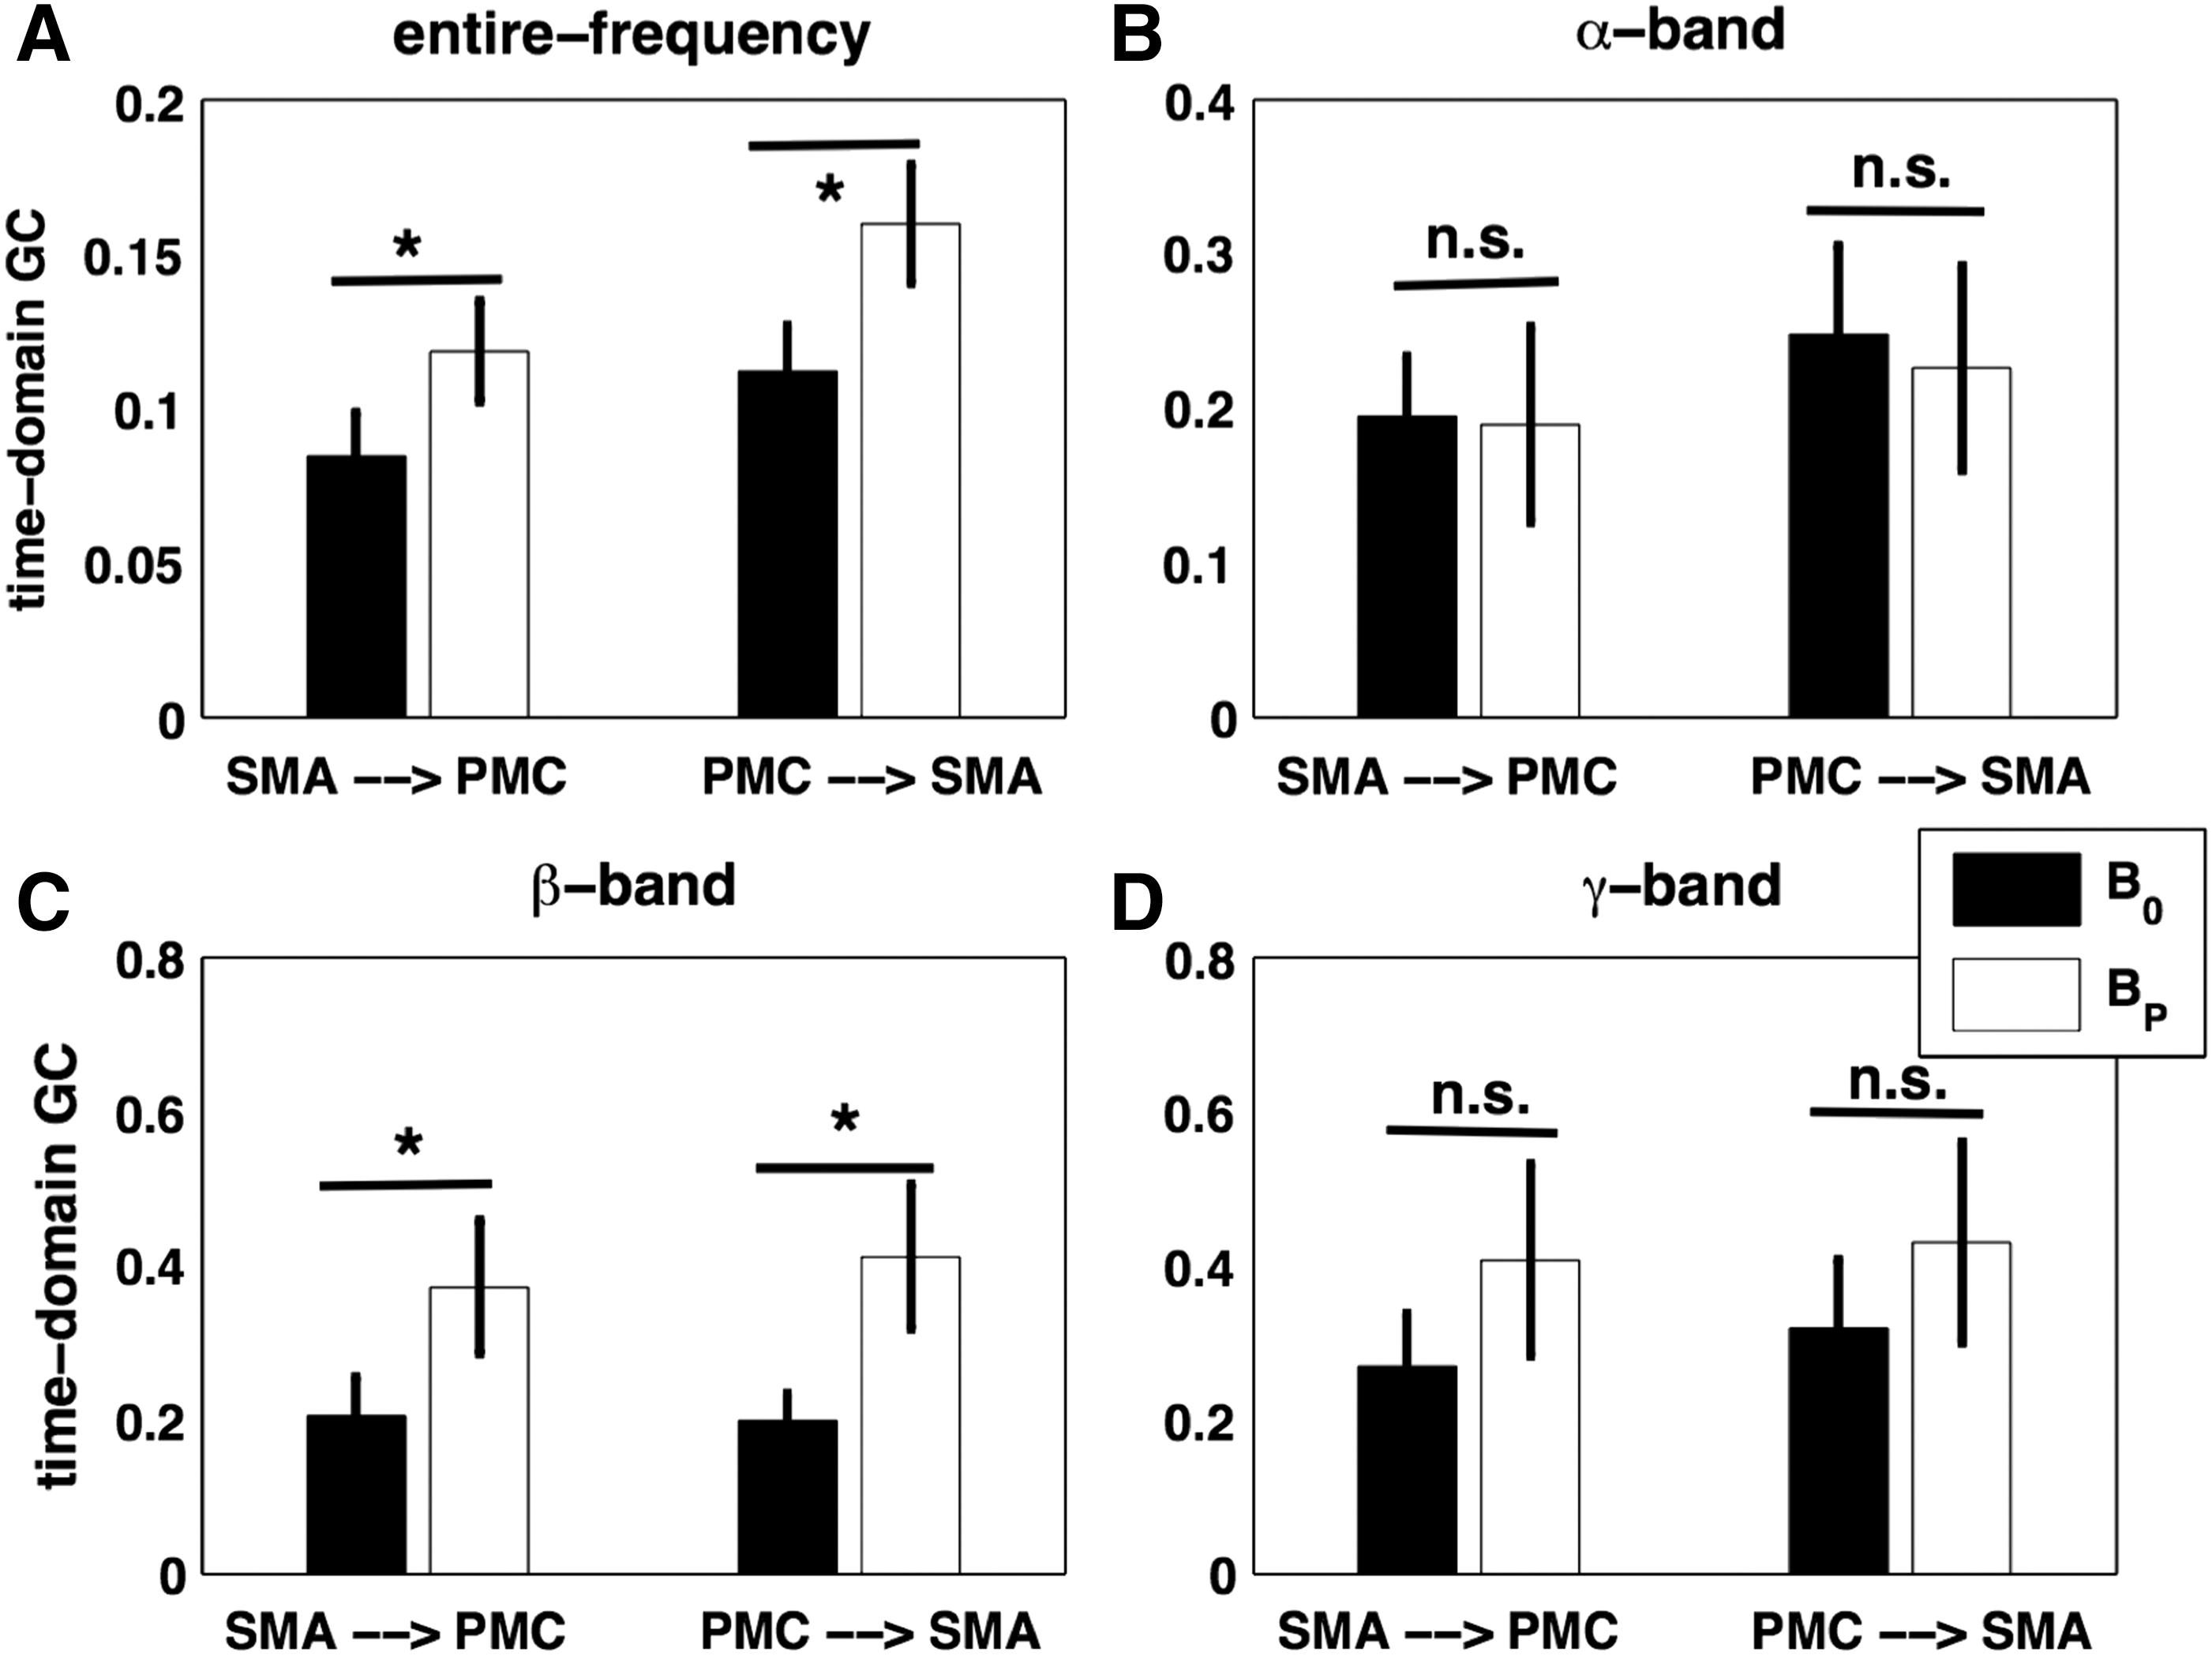
Network activity between cortical EEG sources: The comparison between time-domain GC values for no button press (B0) and button presses (BP) obtained from
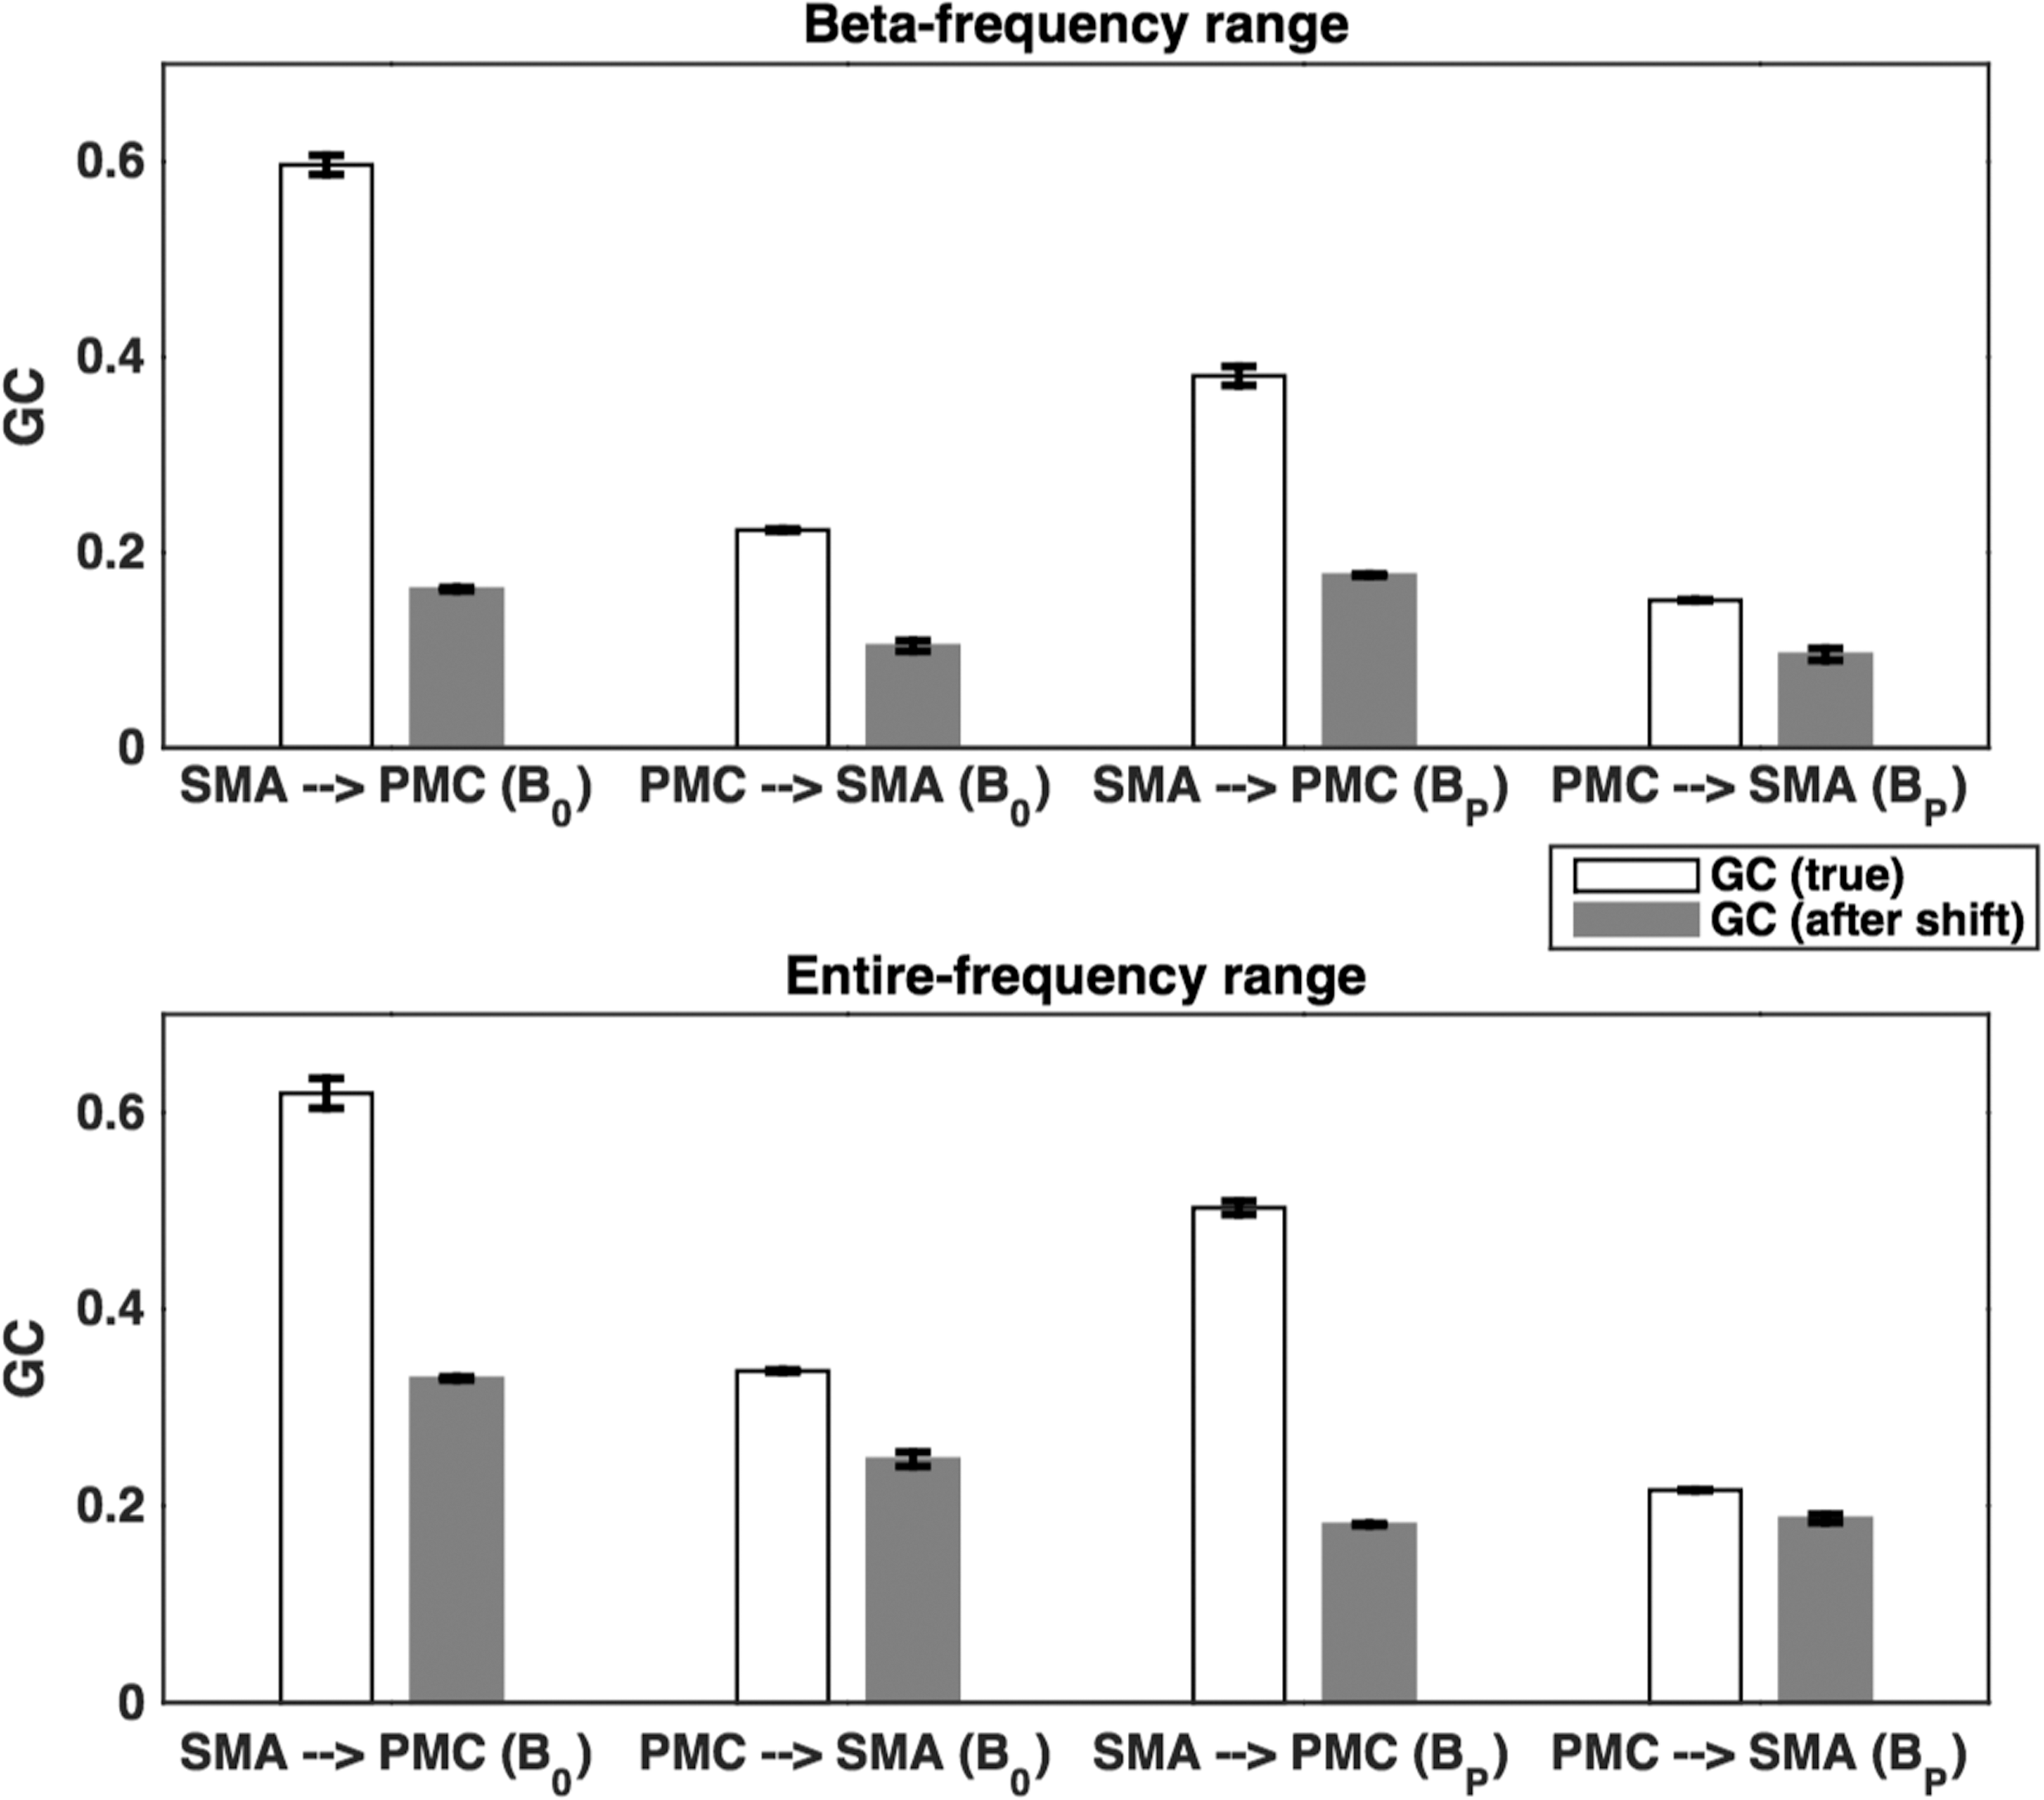
Effect of any residual volume conduction in the source signals: true GC (white) and that obtained after shifting the time points (gray). All true GC values were found to be significantly greater (p < 10−6) than the corresponding GC value obtained by shifting time points. Here time points were shifted by t = 1, 2, 3, 4, 5 points to generate surrogate time series and to test the hypothesis that GC would strengthen by time shifting the driven signals if volume conduction effects were present in the data.
Discussion
A flow of temporal sequence of events, motor preparation, and actual execution of rhythmic tapping with precise timing mechanism are required for the generation of rhythmic movements. Previous studies on movement coordination and rhythms have shown that a complex movement involves a higher degree of central internal effort (Kelso et al., 1990; Mayville et al., 1999; Rao et al., 1993; Sakai et al., 1999). The cortical and subcortical areas involved may depend on the specific timing relationship required between motor and perceptual or imagery processes. Our fMRI results showed the areas, PMC, SMA, and Cb, involved in rhythmic motor movements and found significant unidirectional causal interactions from SMA and PMC to Cb in addition to significant bidirectional interactions between PMC and SMA during RFT tasks. Reconstructed source signals using single-trial EEG data from the cortical sources PMC and SMA showed a decrease in node activity during finger tapping compared to rest. There were significant bidirectional interactions between these nodes during RFT tasks.
Brain activations during tapping tasks
Patterns of time intervals demarcated by sensory and/or motor events called rhythms require an element of timing. We can create, maintain, and change an incredible number of slow, fast, simple, or intricate movement rhythms. The sensorimotor synchronization involved a distributed network of brain regions for the integration of sensory stimuli to motor planning and execution (Hardwick et al., 2013; Rao et al., 1997; Thaut, 2006; Thaut et al., 2008). The tap versus rest contrast showed brain activations in the left PMC, SMA, and right Cb. Different beat rhythms (B1, B2, B3) versus rest (B0) were correlated with activations in the PMC, SMA, the left basal ganglia (putamen), and the right Cb. These activation regions are consistent with previous studies (Adhikari et al., 2013; Dhamala et al., 2003; Witt et al., 2008). The SMA and motor regions are responsible for planning, higher order organization, and preparation of motor movements, whereas the primary motor area is responsible for the execution of the task (Cunnington et al., 2003; Hardwick et al., 2013; Rao et al., 1993; Roland, 1985; Samuel et al., 1998; Shibasaki and Hallett, 2006). The contralateral pre/postcentral gyrus activations are concerned with the initial cortical processing of tactile and proprioceptive information, believed to contribute to the temporal organization of motor behavior (Halsband et al., 1993; Truelle et al., 1995), and found to show pronounced activity with complexity of movement rhythms. Similar results were obtained in several other studies (Gerloff et al., 1998; Lang et al., 1990) and indicated that the premotor and supplementary motor activity is related directly to the degree to which a movement pattern must be planned. Rhythm not only activates motor areas but also helps in creating rapid motor synchronization to an external rhythmic cue in persons with and without neurological disability (Thaut et al., 1999a).
The basal ganglia, Cb, and various parts of the cortex have been shown to be involved in perceiving and generating simple to complex movement rhythms. The basal ganglia have been proposed to act as an internal clock of the brain that generates internal timing representations (Chauvigne et al., 2014) and related to sequencing aspects of rhythmic motor movements (Jueptner and Weiller, 1998; Thaut et al., 2008), whereas the Cb performs more complex timing processing, such as encoding polyrhythmic stimuli (Thaut et al., 2008), establishing the duration of discrete stimuli (Ivry and Spencer, 2004; Teki et al., 2011), or performing a correction of timing errors led by basic processing in basal ganglia (Kung et al., 2013; Teki et al., 2011). Aged subjects required more brain network activity to perform movement automatically at the same level as young subjects; age subjects not only showed greater activity in the bilateral anterior Cb, premotor area, parietal cortex, left prefrontal cortex, anterior cingulate, caudate nucleus, and thalamus but also recruited more areas, including the pre-SMA and bilateral posterior Cb compared to young subjects (Wu et al., 2005).
The cortical sensorimotor areas have been related to temporal complexity or the fine tuning of rhythms (Dhamala et al., 2003) and the sensorimotor integration for optimizing movements (Ivry, 1996; Jueptner and Weiller, 1998; Thaut et al., 2008). Putamen activations found for B2 and B3 (Fig. 1C, D) corresponding to the regular signal increased with increasing movement complexity (Lehericy et al., 2006). Previous studies on functional connectivity indicated that the putamen preferentially receives inputs from motor, sensory, and premotor cortices (Brooks, 1995; Graybiel et al., 1994) and is the projection site of the cortical inputs into the basal ganglia and its activity is mainly movement related instead of cognition related (Kraft et al., 2007). The cortico-basal ganglia and cortico-cerebellar circuits are involved not only in rhythmic movement generation but also in various aspects of rhythmic perception and learning (Ramnani and Passingham, 2001). Damage to these circuits impairs timing abilities (Artieda et al., 1992; Halsband et al., 1993; Mangels et al., 1998; Molinari et al., 2003), further supporting their role in rhythm perception and production (Chauvigne et al., 2014). These impairments are associated with a wide variety of neurological disorders (Allman and Meck, 2012; Hardy and Lagasse, 2013; Turgeon et al., 2012) and in abnormal sensorimotor integration in various movement disorders (Patel et al., 2014).
We found the increase in BOLD signals and decrease in alpha and beta power when subjects performed RFT tasks in comparison to rest condition. Task-induced increases of BOLD signal were observed at PMC, SMA, and Cb (Fig. 2) and decreases of EEG amplitude in alpha and beta bands (Fig. 4) were found at both PMC and SMA. These results are in good agreement with previous findings that showed an inverse functional coupling between task-induced changes of BOLD and low-frequency EEG signals (Yuan et al., 2010). The decrease in alpha/beta activity with the complexity of the movement rhythms may be due to a decrease in the synchrony of the underlying neural population. The degree of desynchronization may be quantitatively related with an increase in neuronal activity, as reflected in the increased BOLD signal. The higher the alpha and beta desynchronization (Fig. 4), the higher is the local cortical activation (Fig. 2) found during higher beat rhythms.
Network activity
The brain activation observed in our study: PMC, SMA, Cb, premotor cortex, and putamen were consistently found in both motor imagery and motor execution tasks (Bajaj et al., 2015; Grefkes et al., 2008; Kasess et al., 2008). The core motor areas: PMC, SMA, premotor cortex are known to be connected anatomically (Pool et al., 2103; Walsh et al., 2008) and involved in planning, initiation, and execution of motor commands. Significant bidirectional causal interactions that we found between PMC and SMA during RFT tasks [from BOLD signal (Fig. 3) and from constructed EEG source signals using single-trial EEG (Fig. 5)] in our study have also been reported in several studies within these areas as well as with other areas such as basal ganglia, putamen, cerebellum, inferior and superior parietal lobule, and other somatosensory areas (Gao et al., 2011; Grefkes et al., 2008; Rehme et al., 2011; Walsh et al., 2008). We found that the RFT task is characterized by network interactions among PMC, SMA, and Cb. The Cb received significant unidirectional causal influences from cortical regions during RFT task and causal influences were found modulated with the complexity of rhythms, which may reflect the role of Cb in rhythm-information processing (D'Angelo and De Zeeuw, 2009; Salmi et al., 2010; Ziemus et al., 2007) or for the tasks involving temporal representations, situations that involved event timing (Ivry et al., 2002).
Subcortical brain areas such as putamen, globus pallidus, substantia nigra, and subthalamic nuclei and cortical motor areas such as the premotor cortex, PMC, the postparietal cortex, S1, and SMA participate in the control of motor function (Saunders et al., 2015). Impairment of motor function may lead to clinically heterogeneous signs and symptoms, observable in several clinically distinct neurological diseases and mental disorders such as schizophrenia (Hirjak et al., 2015). Abnormal neural activity in pre- and postcentral, inferior frontal, parietal, thalamic, striatal, and cerebellar structures is the indication of neurological soft signs in schizophrenia (Hirjak et al., 2015). Also, there are reports of abnormal functional activation in the cerebellum, thalamus, and cortex in patients with schizophrenia (Andreasen et al., 1996).
Our results, bidirectional interactions between SMA and PMC for the fMRI BOLD signal and reconstructed single-trial source, are consistent with the results presented in a simultaneous fNIRS, fMRI, and EEG study (Anwar et al., 2016). They have estimated the effective connectivity within cortico-cortical sensorimotor network ROIs; sensorimotor cortex (SMC), PMC, and dorsolateral prefrontal cortex (DLPFC) during finger movement tasks using fMRI (BOLD), fNIRS (oxygenated and deoxygenated hemoglobin), and EEG (scalp and source) signals. All motor tasks showed a significant bidirectional information flow among the SMC, PMC, and DLPFC, only the source level EEG GC values were significantly greater forward than the backward information flow among these ROIs. A study using MEG together with the analysis tool Dynamic Imaging of Coherent Sources (Gross et al., 2001) investigated the oscillatory network associated with simple auditory paced finger-taps (Pollok et al., 2005) and showed that the task execution was associated with a cerebello-thalamo-cortical network comprising cerebellum, thalamus, PMC, SMA, and superior temporal sulcus corresponding to the auditory cortex (Pollok et al., 2006). Significant increase in bidirectional beta-band interactions between PMC and SMA during button presses may provide information about the sensorimotor integration, including movement initiation, execution (Kuo et al., 2014), and serve as a functional link between different motor regions: PMC (Reimer and Hatsopoulos, 2010), SMA (Hosaka et al., 2016), and somatosensory cortex (Lebedev and Nelson, 1995). No significant changes in the alpha and the gamma network oscillations were found in going from simple to complex rhythms, although attenuation of the alpha power can be observed during preparation and/or execution of voluntary movements and an elevation of the gamma power over motor regions during movements of finger or other body parts (Xiao and Ding, 2015).
In summary, this simultaneous fMRI-EEG study shows that the complexity of motor rhythms is associated with network activity increases and changes in beta (13–30 Hz) band network oscillations. The analysis of the fMRI BOLD signals found brain activations in PMC, SMA, and Cb during finger movements and the network interactions were bidirectional between PMC and SMA and unidirectional to Cb from PMC and SMA. The causal interactions from PMC and SMA to Cb were modulated by the complexity of rhythm. The reconstructed single-trial EEG source signals from PMC and SMA showed the decrease in beta-power during 2-beat and 3-beat rhythms in comparison with 0-beat rhythm, but an increase in bidirectional network interactions (beta-band) between them during finger-tapping tasks in comparison to the rest. There were no significant changes in the alpha (8–12 Hz) and gamma (30–58 Hz) network oscillations in going from simple to complex rhythms. The current knowledge on motor system circuits and network interactions among motor areas during RFT task could be beneficial for mapping certain clinical symptom expressions onto distinct motor pathways.
Footnotes
Acknowledgments
This work was supported by the Brains and Behavior seed grant to M.D. The author M.D. acknowledges the National Science Foundation grant support (CAREER AWARD BCS 0955037).
Author Disclosure Statement
No competing financial interests exist.