
Abstract
The chronic fatigue syndrome (CFS)/myalgic encephalomyelitis is a debilitating disease with unknown pathophysiology and no diagnostic test. This study investigated the default mode network (DMN) to understand the pathophysiology of CFS and to identify potential biomarkers. Using functional MRI (fMRI) collected from 72 subjects (45 CFS and 27 controls) with a temporal resolution of 0.798 sec, we evaluated the DMN using static functional connectivity (FC), dynamic functional connectivity (DFC) and DFC complexity, blood oxygenation level dependent (BOLD) activation maps, and complexity of activity. General linear model univariate analysis was used for intergroup comparison to account for age and gender differences. Hierarchical regression analysis was used to test whether fMRI measures could be used to explain variances of health scores. BOLD signals in the posterior cingulate cortex (PCC), the driving hub in the DMN, were more complex in CFS in both resting state and task (p < 0.05). The FCs between medial prefrontal cortex (mPFC) and both inferior parietal lobules (IPLs) were weaker (p < 0.05) during resting state, whereas during task mPFC–left IPL and mPFC–PCC were weaker (p < 0.05). The DFCs between the DMN hubs were more complex in CFS (p < 0.05) during task. Each of these differences accounted for 7–11% variability of health scores. This study showed that DMN activity is more complex and less coordinated in CFS, suggesting brain network analysis could be potentially used as a diagnostic biomarker for CFS.
Introduction
C
The main symptoms of fatigue and postexertional malaise suggest dysfunction of energy metabolism in CFS. Metabolomics results show that CFS appears to represent a hypometabolic survival state (decreased metabolites) that is triggered by environment stress (Naviaux et al., 2016). Furthermore, metabolic profiling analysis suggests that functional impairment of oxidative metabolism is associated with CFS (Fluge et al., 2016). A recent study on metabolomic analysis of plasma samples showed dysfunction of tricarboxylic acid and urea cycles in CFS patients (Yamano et al., 2016). The brain is one of the most metabolically active organs in the body and is responsible for about 20% of total energy expenditure (Sokoloff, 1960). The default mode network (DMN) tends to be among the most metabolically active regions in healthy resting subjects (Raichle et al., 2001). Therefore, we hypothesize that the DMN will be abnormal in CFS, either contributing to or being affected by the hypometabolic state in CFS.
The DMN is a network of interacting brain regions that show spontaneous and ongoing brain activity (Raichle et al., 2001). The study of DMN is important for understanding individual brain function since the DMN represents one of the primary functional networks of the brain and its function constitutes baseline brain function (Whitfield-Gabrieli and Nieto-Castanon, 2012). The DMN mediates processing of one's thoughts and feelings (Buckner et al., 2008; Raichle and Snyder, 2007) and its functional connectivity (FC) correlates with cognitive performance (Mak et al., 2017; Persson et al., 2014). These aspects of brain function are both affected in CFS (Holgate et al., 2011). This study used both task functional MRI (tfMRI) and resting state fMRI (rsfMRI) to evaluate DMN in CFS in terms of activation, signal complexity, static FC, and dynamic functional connectivity (DFC) to provide insights into CFS pathophysiology and assess the DMN connectivity as a biomarker for CFS.
Materials and Methods
Subjects
This study was approved by the Human Research Ethics Committees of our institution and the hospital where scanning was performed. Patients and controls were recruited for a 1-year period. Patients who were undergoing any treatment or taking central nervous system (CNS) medication were excluded. Signed informed consent was obtained from all participants. All the CFS patients met the Fukuda (Fukuda et al., 1994) diagnostic criteria. The total number of subjects analyzed in this study was 72, comprising 45 CFS patients and 27 normal controls (NCs) (Table 1). All participants completed the 36-item Short Form Health Survey (SF-36) questionnaire (Ware et al., 1995), in which higher scores suggest better health.
ACC, accuracy; BMI, body mass index; Con, congruent task; Inc, incongruent task; Neu, neutral task; ns, not significant; RT, response time; SD, standard deviation; SF-36 MCS, mental component summary from SF-36; SF-36 PCS, physical component summary from 36-Item Short Form Health Survey (SF-36).
MRI acquisition
The MRI data were acquired on a 3T MRI scanner (Skyra, Siemens) while the subject viewed a video screen through goggles. Three dimensional T1-weighted anatomical images were acquired using a T1-weighted magnetization prepared rapid gradient-echo sequence (208 slices, repetition time [TR] = 2400 ms, echo time [TE] = 1.81 ms, flip angle = 8°, acquisition matrix = 224 × 224, voxel size 1 × 1 × 1 mm). The fMRI data were acquired using a multiband echo-planar imaging (EPI) pulse sequence developed at the University of Minnesota (Auerbach et al., 2013) (72 slices, multiband factor = 8, TR = 798 ms, TE = 30 ms, flip angle = 40°, acquisition matrix = 106 × 106, voxel size 2 × 2 × 2 mm). Before each fMRI data acquisition, a single band reference EPI volume and two spin echo EPI volumes encoded with opposite phase directions were acquired. A total of 1100 rsfMRI volumes were acquired in 15 min while the subject was awake and viewing a fixed stationary cross. A total of 1100 tfMRI volumes were acquired in 15 min while the subject was performing a sequence of Stroop tasks. The rsfMRI was acquired before tfMRI for all individuals.
Stroop task experimental paradigm
The subjects performed a random event-related design color word variant of the Stroop task during tfMRI acquisition (Leung et al., 2000). The Stroop task was selected because attention and concentration difficulties are frequent complaints of CFS patients (Ray et al., 1993). The participant was instructed to decide whether the color of the upper word agreed with the meaning of the lower word and press one of two buttons on a handpiece accordingly. The upper word, consisting of either RED, BLUE, YELLOW, or XXXX, was presented in colors of red, blue, or yellow on a black background. The lower word was either RED, BLUE, or YELLOW colored white on a black background (Supplementary Fig. S1; Supplementary Data are available online at
MRI preprocessing
Both rsfMRI and tfMRI data were preprocessed as follows. (1) The first 5 of 1100 fMRI EPI volumes were discarded to ensure that tissue magnetization had reached steady state. (2) Motion correction was applied by registering 1095 EPI volumes to the single band reference image acquired immediately before them using MCFLIRT (Jenkinson et al., 2002) implemented in FSL (FMRIB's Software Library,
Neural correlates of Stroop task
The tfMRI data were analyzed using the two-level general linear model (GLM) approach implemented in SPM12. At the subject level, a canonical hemodynamic response function (HRF) with time and dispersion derivatives was used as the basis function. The activation map associated with each type of trial and the difference between task and rest periods were determined using the convolution of the HRF with the neural event as defined by the stimulus-on and subject RTs. The congruent, incongruent, neutral, “Stroop” (incongruent–congruent), task minus rest (positive), and rest minus task (negative) t-contrast maps were entered into a group-level analysis. At the group level, we performed random-effect one-sample t-tests to identify neural correlates of tasks in each group and two-sample t-tests to identify group differences between CFS and NC (α <0.05 with family wise error adjustment for multiple comparisons).
Extraction of fMRI time series
Four DMN hubs, medial prefrontal cortex (mPFC), posterior cingulate cortex (PCC), left inferior parietal lobule (L-IPL), and right-IPL (R-IPL), were first defined from a brain atlas that incorporated cytoarchitectonic, FC, and structural connectivity information (Fan et al., 2016) (Supplementary Fig. S2). An iterative exclusion at the voxel level based on self-coherence was performed for each DMN hub in each subject as follows: (1) the fMRI time series for each DMN hub was extracted by averaging the signal intensity in the voxels within the region at each time point. (2) For each voxel within a hub, the correlation between the voxel time series and the hub time series was calculated. (3) The voxels that were not significantly correlated (p > 0.05) with the hub average were excluded, then the hub time series was calculated again. (4) Steps (1) to (3) were repeated until no more voxels were excluded. The fMRI time series for each DMN hub was then extracted and smoothed with a high pass filter of 128 sec to remove baseline drifting.
Temporal complexity (sample entropy)
The sample entropy (SampEn), a modification of approximate entropy (Pincus, 2006), was used for measurement of system irregularity for time series (Richman and Moorman, 2000). Given a full time series of data with length N, SampEn was calculated as the negative natural logarithm of the probability that segments of data points with length m,
where Cm
is the count of data segments with length m having the Chebyshev distance d smaller than tolerance r. For a segment
In this study, length m was set to 2 and tolerance r was set to 0.2 times of standard deviation of the full time series.
Static FC and DFC
The FC between any pair of DMN hubs was calculated as the Pearson correlation coefficient between the extracted time series of the DMN pair.
The DFC between each pair of DMN hubs was calculated using a tapered sliding window approach. Tapering reduces spurious physiological noise and sensitivity to outliers (Pozzi et al., 2012; Zalesky et al., 2014). In this approach, for a sliding window with length of N, the weighted correlation
The weighted mean
In this study, the window length N and exponent θ were set to 60 and 20 sec, respectively. The DFCs for each DMN hub from 60 to 900 sec were characterized by the SampEn, the peak amplitude of the fast Fourier transformed (FFT) connectivity spectrum, and the frequency of the peak amplitude in the FFT spectrum.
Statistical analysis
Statistical analysis of the clinical variables and connectivities was performed using SPSS22 (IBM, New York). The Fisher Z-transformation was applied to the FCs (correlation coefficients) before statistical analyses. The significance of difference (p < 0.05) between groups was determined using GLM univariate analysis to account for age and gender differences. The Pearson correlation was used to determine correlation (two-tailed p < 0.05) between MRI measures (DMN blood oxygenation level dependent [BOLD] signal SampEns, FCs, and DFC SampEns) and disease severities across all subjects. The MRI measures that were significantly correlated with disease severities were further analyzed using a hierarchical regression analysis to determine whether MRI measure contributes to variances in health scores across all subjects. In each hierarchical regression, the physical component summary (PCS) and mental component summary (MCS) were entered as dependent variables; the age and gender were entered as first block independent variables with the forced entry method; each category of the MRI measure (BOLD SampEn, FC, or DFC SampEn) was entered as second block independent variable with the stepwise entry method.
Results
Demographics and behavior findings
The demographic profile of the 72 subjects is summarized in Table 1. The 45 CFS subjects met the Fukuda CFS criteria (Fukuda et al., 1994). We did not discriminate on the basis of gender during subject recruitment. Therefore, there are more females than males due to the gender difference in CFS incidence (Reyes et al., 2003). The NCs were recruited to match the age and female-to-male ratio in the CFS group. The PCS and MCS from the SF-36 survey (Ware et al., 1995) in CFS were significantly lower than those in NCs. In the Stroop task, the CFS patients scored a slightly lower accuracy and showed less Stroop effect than NCs, but the difference was not significant. However, the CFS patients required significantly longer time than NCs to perform the task (Table 1).
Increased BOLD activation and decreased inhibition in CFS during the Stroop task
The group-level positive and negative BOLD responses associated with the Stroop task were mapped in MNI space (Fig. 1). The separate group level one-sample t-tests showed that CFS patients have larger regions with increased blood flow and smaller regions with decreased blood flow when engaging in the Stroop task than NCs. However, the two-sample t-test comparing CFS patients and NCs was not significant.
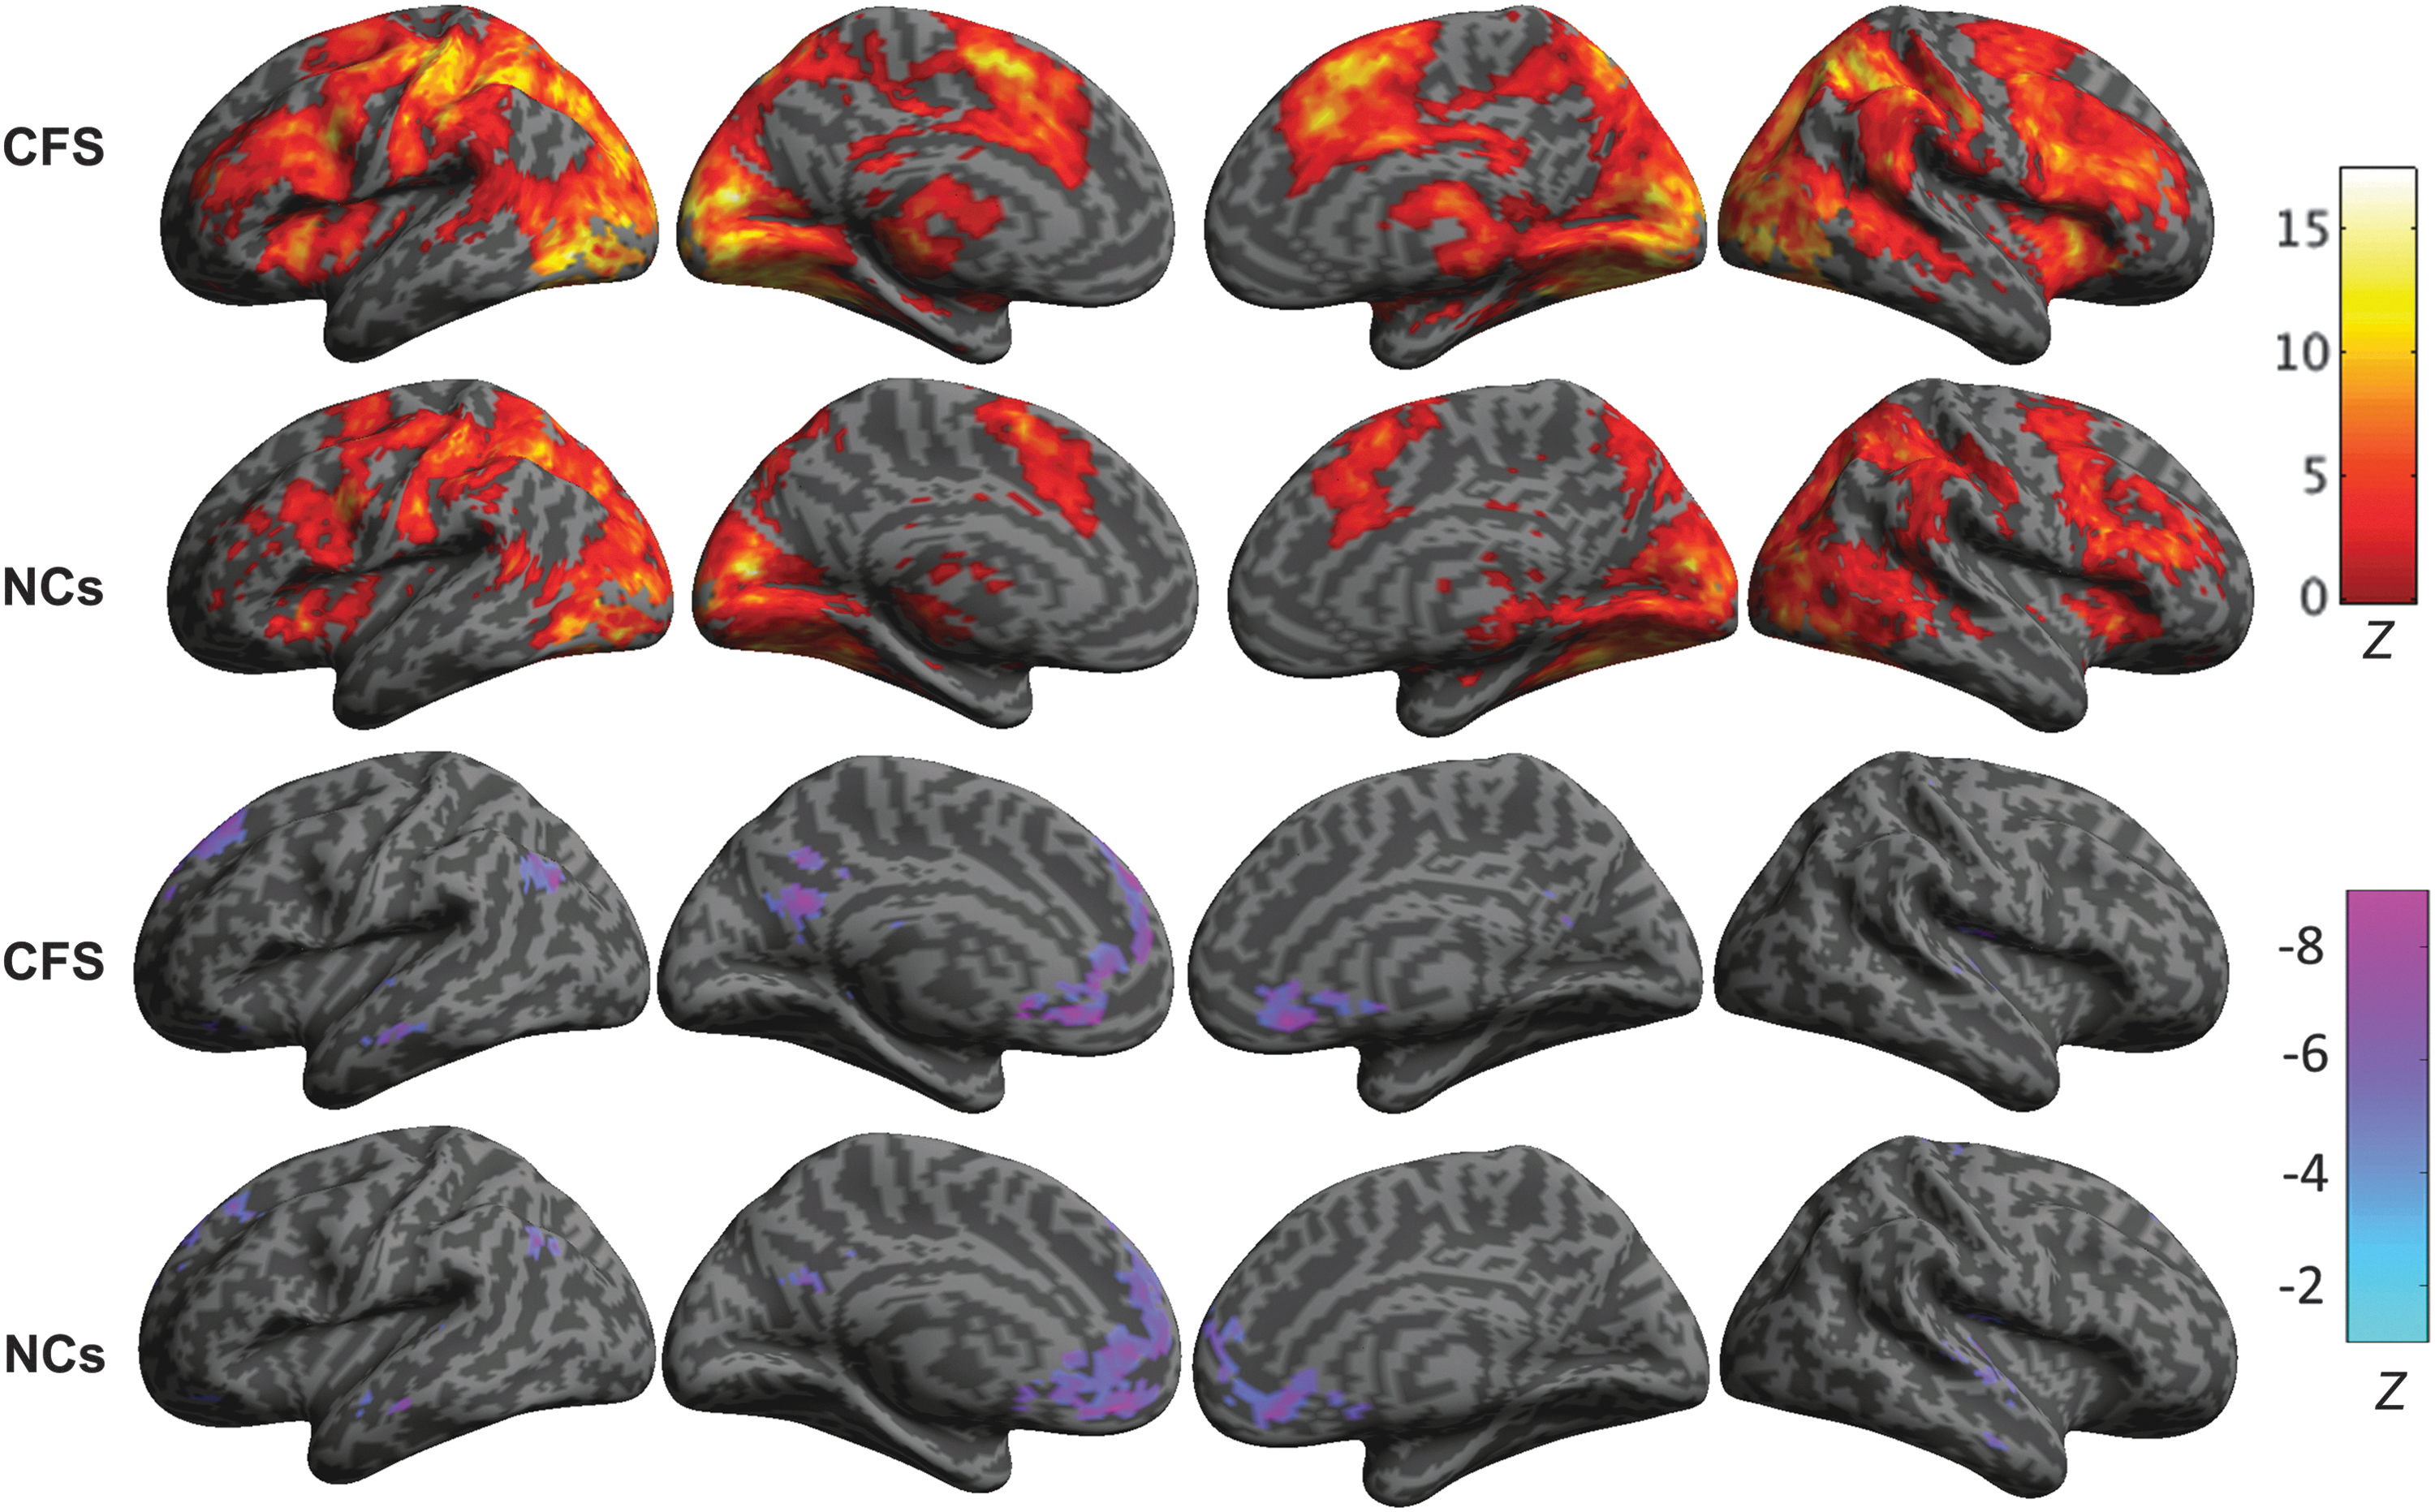
Group level positive and negative BOLD signal changes associated with the Stroop task. From left to right are shown the left lateral and medial views of the left hemisphere and the medial and right lateral views of the right hemisphere. The group level activation maps show that the CFS patients showed stronger and more extended positive BOLD responses (top two rows) and weaker negative BOLD responses (lower two rows) than the NCs. BOLD, blood oxygenation level dependent; CFS, chronic fatigue syndrome; NCs, normal controls.
PCC BOLD signal fluctuations are more complex in CFS
The SampEn of the BOLD signal variation in the PCC was significantly higher in both tfMRI and rsfMRI in CFS patients (1.8 and 1.75) than those in NCs (1.7 and 1.65) (Table 2). The SampEns in the other DMN hubs were not significantly different, so the difference in PCC SampEn could not be attributed to global cerebral blood flow differences. SampEn measures the complexity and disorder of physiological dynamics (Richman and Moorman, 2000). Therefore, this result showed that BOLD signal fluctuations in the PCC are more complex and disordered in CFS patients than in NCs. Furthermore, the complexity of rsfMRI BOLD signal in the PCC was negatively correlated (r = −0.26) with SF-36 PCS scores (Supplementary Table S1), that is, poorer physical well-being is associated with increased PCC BOLD complexity.
Bold indicates significant values.
CFS, chronic fatigue syndrome; CI, confidence interval; L-IPL, left inferior parietal lobule; mPFC, medial prefrontal cortex; NC, normal control; ns, not significant; p, significance level of two-sample t-test; PCC, posterior cingulate cortex; R-IPL, right inferior parietal lobule; rsfMRI, resting state functional MRI; tfMRI, task functional MRI.
Weaker FC among DMN hubs in CFS
In the resting state, FCs were significantly weaker in CFS patients for mPFC–L-IPL (p = 0.007) and mPFC–R-IPL (p = 0.04) (Fig. 2). During the task, the FC for mPFC–PCC was significantly reduced (p = 0.04) relative to resting state in CFS patients, whereas NCs maintained a similar connection strength. Thus, during the task, mPFC–PCC connectivity in CFS was weaker than in NCs (p = 0.03) (Fig. 2). Under task conditions, the mPFC–R-IPL connectivity in CFS was no longer significantly different to NCs primarily due to a decreased connectivity in the NCs in task relative to rest. The connectivities between mPFC and other DMN hubs (PCC, L- and R-IPL) were significantly correlated with age (r = −0.25 to −0.3), with PCS health score (r = 0.21–0.31), and with MCS health score (r = 0.21–0.29) across all subjects (Supplementary Table S2). The hierarchical regression analysis showed that resting mPFC–PCC connectivity accounted for 7% and 8% variability in the SF-36 PCS and MCS scores (Supplementary Tables S3 and S4). However, the hierarchical regression analysis of tfMRI FCs to account for SF-36 PCS or MCS scores retained no explanatory variable.
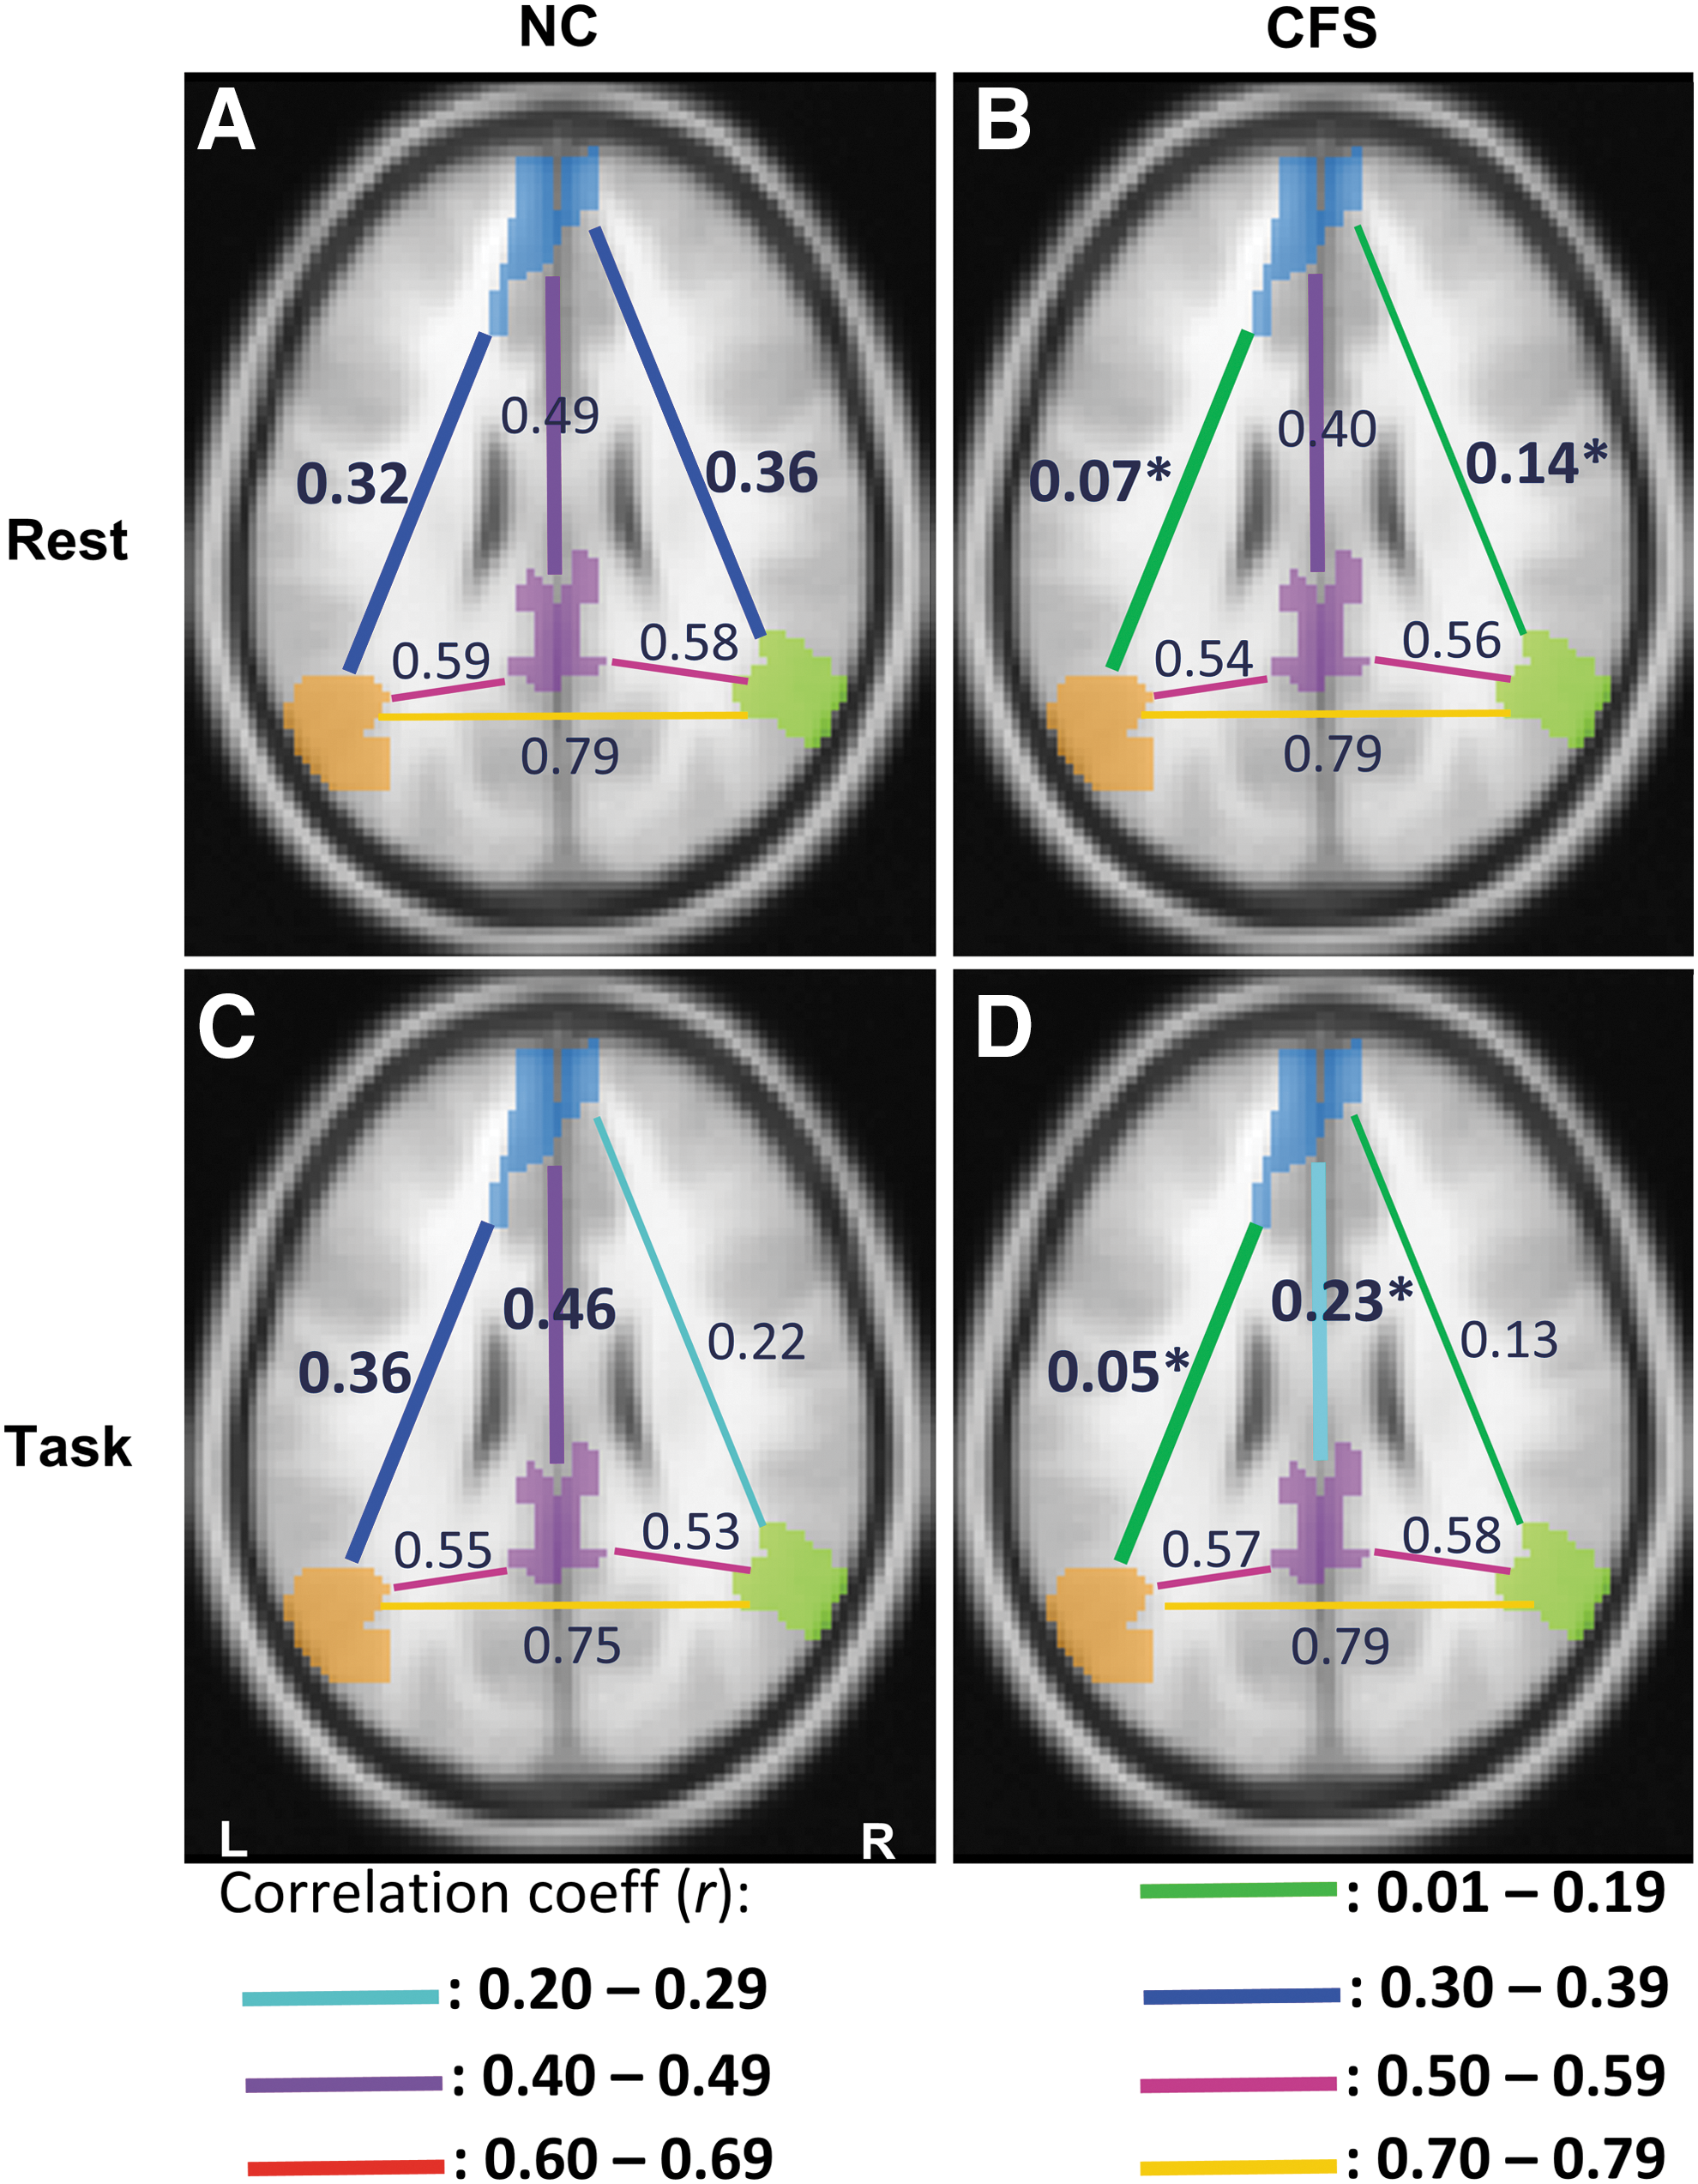
The time-averaged connectivity between the DMN hubs in NCs
More complex DFC among DMN hubs in CFS
We investigated the connectivity in 60-sec periods for 15 min between the four DMN hubs (Supplementary Figs. S3 and S4). Overall, the CFS group showed more irregular DMN connectivity dynamics than NCs (Table 3) in both resting and task states. During the resting period, only the L-IPL–R-IPL connectivity dynamics in CFS patients were significantly more complex than in NCs. When engaging in the cognitive task, however, the mPFC–L-IPL, mPFC–PCC, L-IPL–PCC, and R-IPL–PCC connectivity dynamics were all significantly more complex in CFS patients than in NCs. The complexity of resting state time-resolved connectivity for L-IPL–R-IPL and L-IPL–PCC was significantly correlated with PCS (r = −0.32) and MCS (r = −0.3) SF-36 health scores across all subjects, respectively (Supplementary Table S5). During task, the complexity of connectivity dynamics of mPFC–PCC was significantly correlated with both PCS (r = −0.32) and MCS (r = −0.32) and the L-IPL–PCC connectivity complexity was significantly correlated with the PCS (r = −0.28) SF-36 health score across all subjects. The hierarchical regression analysis showed that the complexity of time-resolved resting L-IPL–R-IPL connectivity accounts for 8% variability of SF-36 PCS health scores (Supplementary Table S6). The complexity of time-resolved task mPFC–PCC connectivity accounts for 7% and 11% variability of SF-36 PCS and MCS health scores (Supplementary Tables S7 and S8).
The mean values and 95% CIs for CFS and NC groups are listed. The significance of difference (p value) between groups was calculated using univariate analysis controlled for age and gender. The significance of difference (p value) between rsfMRI and tfMRI in each group was calculated using a paired t-test. The p values in the table are significance of difference between the CFS and NC groups (bolded when significant). Differences within the CFS group between resting and task states are denoted by a(paired t-test p < 0.05) and b(paired t-test p < 0.01).
There was no significant difference between CFS and NC groups in maximum amplitude or frequency of maximum amplitude in the power spectrum of time-resolved connectivity for any pair of hubs either during task or resting state.
Discussion
The purpose of this study was to investigate DMN function in CFS. This is the first study to report complexity measurements of BOLD activity and time-resolved connectivity in CFS. We found that (1) the BOLD activity time series in the PCC was more complex in CFS than in NCs in both resting and task states; (2) in the resting state, the time averaged mPFC–L-IPL and mPFC–R-IPL connectivities were weaker in CFS patients than in NCs, and the time-resolved L-IPL–R-IPL connectivity was more complex in CFS patients than in NCs; (3) when engaging in the task, the mPFC–PCC connectivity in CFS patients was weaker than in NCs and the time-resolved connectivity dynamics in the DMN were extensively (mPFC–L-IPL, mPFC–PCC, L-IPL–PCC, and R-IPL–PCC) more complex.
The DMN is known for its spontaneous and ongoing activity in the resting state without involvement in a task. It constitutes a neurological basis for the self, thinking about others, and remembering the past and thinking about the future (Andrews-Hanna, 2012) and mind wandering (Mason et al., 2007). Therefore, the DMN plays a key role in brain function. Not surprisingly, decreased DMN connectivity has been reported in Alzheimer's disease (Buckner et al., 2008) and sleep deprivation (Basner et al., 2013), both of which demonstrate overlapping clinical features with CFS/ME (attention and memory difficulties). More specifically, our finding of decreased mPFC–IPL connectivity in CFS parallels observations in Alzheimer's disease and sleep deprivation (Basner et al., 2013; Buckner et al., 2008). However, we did not detect a significant difference in mPFC–PCC connectivity during resting state. The higher complexity in L-IPL–R-IPL connectivity dynamics in CFS may explain the clinical presentation of difficulty in spatial sensing and coordination in CFS.
A case can be made that the PCC is the primary and driving hub for spontaneous activity in the DMN. First, in patients in minimally conscious and vegetative states, their level of consciousness depends on the excitation and connectivity of the PCC (Crone et al., 2015). This suggested that neuronal oscillations in the PCC drive DMN function. Second, in the primitive and incomplete DMN in infants aged 2 weeks, the PCC is the only consistently observed DMN component (Gao et al., 2009). Our novel finding of higher BOLD signal irregularity in the PCC in CFS provides a possible origin for the weaker DMN connectivity observed in this study in CFS. The high irregularity of PCC BOLD activity (Table 2) could also result in the weaker connectivity between mPFC and PCC in task (Fig. 2). Disrupted PCC activity rhythms may also result in the more complex DFC in the DMN in CFS patients during the task, which in this study accounted for 7–11% of the disease severity. The higher PCC BOLD SampEns and the associated weaker DMN FC are consistent with the reported lower global efficiency (average inverse shortest path length in the network and a measure of information exchange efficiency) in CFS patients (Kim et al., 2015). In healthy subjects, PCC is involved in the neural substrates related to self-evaluation of physical fatigue (Ishii et al., 2014). Our novel finding of higher BOLD SampEns in PCC warrants further investigation of neural processing in the PCC in CFS.
In the resting state, the CFS patients had a similar temporal variation in DMN connectivity to NCs (Table 3). However, the complexities of connectivity dynamics in CFS were significantly increased during the task, whereas NCs maintained the same temporal variation for both resting state and task. Thus, DMN synchronization in CFS was weaker than in NC during the task, which more generally may be expected to increase the energy consumption required to perform tasks. Our observation of increased BOLD activation in CFS not balanced by increased BOLD inhibition elsewhere in the brain, together with similar observations in previous reports (Lange et al., 2005; Mizuno et al., 2015), provides support for this notion. It appears that CFS patients demand more BOLD activation to compensate for the more complex and unsynchronized brain activity/connectivity in and between different components of their CNS. Increased energy consumption for both baseline functions and tasks would exacerbate, if not cause, fatigue in CFS. These factors may also contribute to the differences in systemic autonomic control reported for the PCC in CFS (Barnden et al., 2016).
This study had two limitations. First, there were fewer NCs than CFS patients due to the difficulty of recruiting age-matched normal subjects. Recently several fMRI databases have become publically available. However, this study investigated the DMN both during the resting state and during a Stroop task, and Stroop task fMRI data are not yet available. Second, this CFS study only investigated the DMN. Whole brain connectivity was not investigated. Although we established that the DMN in CFS is compromised, altered DMN connectivity has also been observed in other diseases. Therefore, evaluation of the potential of the brain connectome as a specific biomarker for CFS, including its sensitivity, robustness, and reproducibility, must await connectivity studies of its other networks. Future studies will address these two limitations.
In conclusion, the DMN in CFS/ME is abnormal with more irregular activity, weaker connectivity, and more complex connectivity dynamics. In particular, the PCC activity in CFS/ME is more irregular and complex. Furthermore, weaker connectivity among DMN hubs was observed and connection dynamics were more complex especially during the cognitive task. We argue that deficits in DMN could be energy expensive and may contribute to or cause the fatigue, cognitive symptoms, and postexertional malaise of CFS.
Footnotes
Acknowledgments
We thank the patients and healthy controls who donated their time and effort to participate in this study. This study was supported by the Stafford Fox Medical Research Foundation, the Judith Jane Mason Foundation, Mr Douglas Stutt, and Blake-Beckett Foundation. The financial support does not affect any aspect of the study.
Author Disclosure Statement
No competing financial interests exist.
References
Supplementary Material
Please find the following supplemental material available below.
For Open Access articles published under a Creative Commons License, all supplemental material carries the same license as the article it is associated with.
For non-Open Access articles published, all supplemental material carries a non-exclusive license, and permission requests for re-use of supplemental material or any part of supplemental material shall be sent directly to the copyright owner as specified in the copyright notice associated with the article.