
Abstract
In this work, we will test the hypothesis that the connectivity of language areas in normal children is asymmetric between the hemispheres. Intrahemispheric region of interest (ROI)-to-ROI connectivity was assessed in 40 normal right-handed children. Asymmetries were assessed (1) between the hemispheres (global language connectivity); (2) between Brodmann areas (BAs) pairs (pairwise connectivity); and (3) between two homotopic BA (Global BA connectivity). Sixteen BAs were selected: 6, 7, 9, 19, 21, 22, 37, 38, 39, 40, 41, 42, 44, 45, 46, and 47. T scores for connectivity of each BA pair were ascertained using the MATLAB toolbox CONN. Lateralization index (LI) scores based on T-values were obtained. Only LIs with 2SD above the mean were considered as significant. Comparisons between T-value groups (per side and per BA) were performed utilizing double-sided T-tests. Null hypothesis was rejected for p < 0.05. There was not a statistical difference between global left and right connectivity strength (p = 0.40). There was significant pairwise connectivity asymmetry for the following pairs: BA7-BA44 (LI = 0.662); BA21-BA42 (LI = −0.616); BA21-BA40 (LI = −0.595); BA38-BA44 (LI = 0.470); BA39-BA44 (LI = −0.903); and BA42-BA47 (LI = −0.445). Language-related brain connectivity asymmetries have been demonstrated in a group of children and young adolescents. Two pairs related to Broca's area were left dominant (BA44-BA38 and BA44-BA7) and four pairs right dominant (BA42-BA47, BA39-BA44, BA21-BA40, and BA21-BA42).
Introduction
Clinical determination of language lateralization is of critical importance in the work-up of patients with pharmacologically refractory epilepsy who are candidates for epilepsy surgery, in which protocols differ for resections performed in the dominant or nondominant hemisphere.
Currently available techniques include intracarotid amobarbital test, electrocortical mapping, functional magnetic resonance imaging (fMRI), and magneto-encephalography. All of these methods, however, require cooperative patients who should perform cognitive tasks while holding still.
Resting-state-based functional connectivity (rsfc)-fMRI is a task-free procedure that provides an insight into the spontaneous brain oscillations. This technique may be utilized in noncooperative patients since spontaneous neural network oscillations are preserved, up to a significant extent, in patients under natural sleep (Manning et al., 2013) and light sedated patients (Greicius et al., 2008; Shimony et al., 2009). region of interest (ROI)-based rsfc-fMRI can quantify temporal correlations between specific brain regions, allowing the ascertainment of the asymmetry between local connectivity strength and that of contralateral homotopic areas.
A set of meta-analyses of fMRI coactivations on language tasks have recently revealed many ancillary language areas (Ardila et al., 2015, 2016a,b,c; Bernal et al., 2015; Rosselli et al., 2015). Functional connectivity of the canonical and ancillary language areas relative to their homotopic regions has not been deeply studied, and thus is not yet well understood. Therefore, investigation may provide a new tool for greater understanding of language networks.
In this investigation, we sought to demonstrate asymmetries in brain connectivity between language areas in a group of strongly right-handed normal subjects. Based on prior well-established knowledge (Benson and Ardilla, 1996; Whitaker, 2010), our hypotheses included expectations of (1) asymmetric global language connectivity between the hemispheres; (2) asymmetric pairwise connectivity among language-related areas; and (3) this pairwise connectivity should be stronger for left Brodmann areas (BAs) 44, 45, 21, and 22 (i.e., the canonical Broca and Wernicke language areas) than for homotopic regions in the right hemisphere.
Methods
Subjects
Data were selected from a publicly released rs-fMRI dataset known as the “ADHD-200,” which includes normative data. This dataset is part of the “1000 Functional Connectomes Project” available at
Demographic Characteristics of the Sample
Edinburgh Handedness Inventory.
Wechsler Abbreviated Scale.
SD, standard deviation.
MRI technique
Magnetic resonance imaging (MRI) data consisted of anatomical volumes and blood oxygenation level dependent (BOLD)-sensitive echo-planar images obtained with a 3.0-Tesla Siemens Magnetom Allegra Syngo (Erlangen, Germany). Anatomical T1-weighted MRI 3D-volumes were obtained in the sagittal plane with a field of view (FOV) of 256 × 256 mm, 128 slices per slab, and slice thickness of 1.33 mm. Acquisition settings: TR: 2530 ms, TE: 3.25 ms, and flip angle of 7°. The echo-planar sequence sensitive to the BOLD effect was obtained with the following parameters: 180 timepoints (scan time 6:00 min), voxel size 3.0 × 3.0 × 4.0 mm, 33 axial interleaved slices with no gap, FOV 240 mm, slice thickness 4.0 mm, TR: 2000 ms, TE: 15 ms, 1 average, flip angle: 90°, standard shim mode.
Preprocessing
For each subject, the 180 timepoints of the rs-fMRI data were visually inspected in a dynamic presentation. Those with overt motion were discarded, since motion correction algorithms have demonstrated poor correction of gross movement. Preprocessing was performed utilizing SMP12 (
Processing
First level
Intrahemispheric ROI-to-ROI connectivity between specific functional areas was assessed. (Note: Interhemispheric connectivities were not considered in this study.) Seeding sources (ROIs) were derived from the atlas of BAs provided by SPM12. Based on prior published meta-analyses of coactivations present in language tasks (Ardila et al., 2015, 2016a,b,c; Bernal et al., 2015; Rosselli et al., 2015), 32 BAs were selected—16 per hemisphere. These included the following: BA6, premotor; BA7, dorso-parietal; BA9, prefrontal; BA19, secondary visual; BA21 and BA22, Wernicke's area; BA37, fusiform gyrus; BA38, temporal pole; BA39, angular gyrus; BA40, supramarginal gyrus; BA41 and BA42, primary auditory area; BA44 and BA45, Broca's area; BA46, prefrontal; and BA47, pars orbitalis of the inferior frontal gyrus (IFG). With these areas, 120 possible intrahemispheric pairs may be considered. Functional connectivity was performed utilizing the MATLAB toolbox “CONN” (Whitfield-Gabrieli and Nieto-Castanon, 2012) version 15.g available at
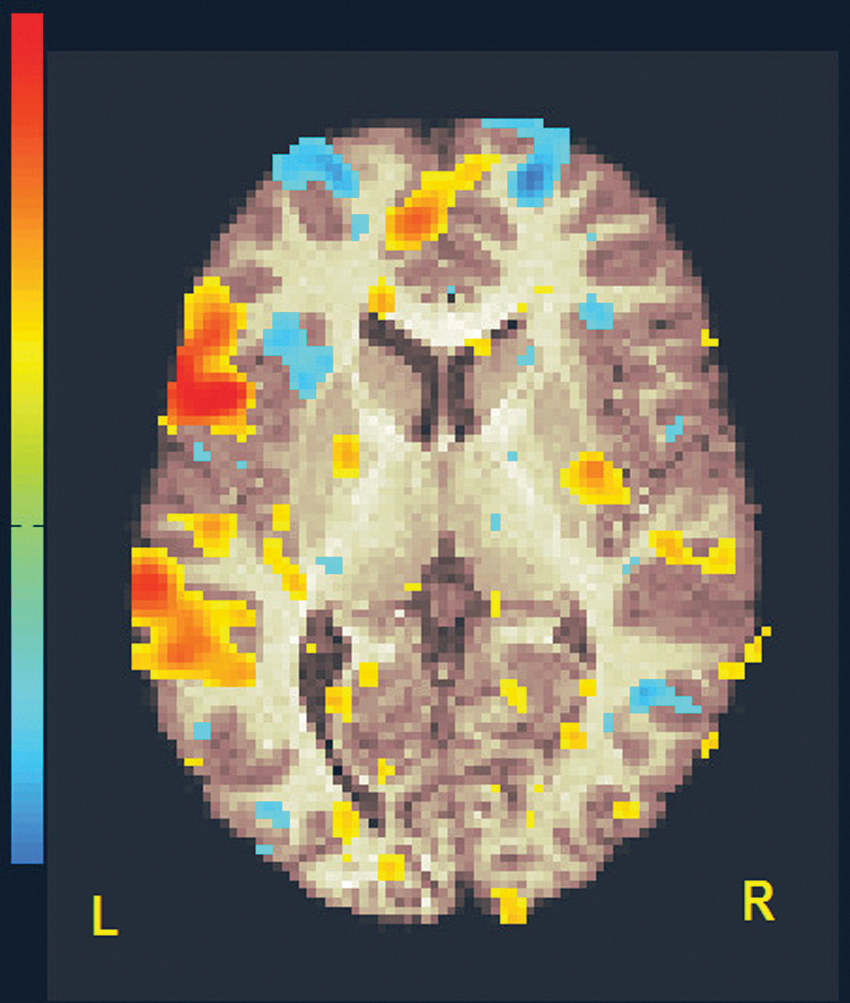
First-level analysis (subject level). Exemplary image of left BA44 connectivity map in a subject. Clusters are color coded (from low to high) in warm (yellow to red) for positive correlations and cold colors (cyan to blue) for negative correlations. The background is a T1-weighted brain axial slice, oriented in neurological convention. Threshold has been set at R = 0.30. BA, Brodmann area.
Second level
For the second-level analysis, ROI-to-ROI connectivity maps for all subjects were pooled with the following settings: Between-subject contrast, 1 (Effect of All subjects, one group); between-conditions contrast, 1 (Effect of Rest); Between-sources contrast, 1 (Effect of each BA against all brain BA).
Within-subject effects of the between-sources contrasts correspond to multivariate/repeated-measures analyses of the selected effects modeled using a general linear model. The output is a within-subject linear combination of effects specified by the “between-conditions” and “between-sources” contrasts, applied to the first-level connectivity-measure matrix (the ROI-to-ROI analyses).
ROI-to-ROI connectivity was thresholded at p < 0.05 (two-sided) and corrected for multiple comparisons with the False Discovery Rate (FDR) technique. From the report provided by CONN, independent tables of intrahemispheric connectivity were obtained, selecting the language-related BAs previously referred to as targets. The following parameters were computed for each ROI pair: T-value, as well as uncorrected and corrected (FDR) p-values. Only pairs with p < 0.05 FDR corrected were accepted, which resulted in a minimum T-value of 2.03. Pairs were sorted by the T-values obtained from the left hemisphere. For each of these pairs, values for the right-hemisphere homotopic pairs were found and annotated. Post hoc analysis was performed in those cases in which the counterpart did not reach the threshold value.
Representations of ROI-to-full intrahemispheric connectivity were graphically produced as radial plots. In these graphs, the source ROI appears at one point of a ring, with target ROIs distributed around the rest of the circle. Lines are color coded to represent connectivity strength and correlation type (positive vs. negative), so that correlation (warm colors) versus anticorrelation (cold colors) may be readily identified.
Comparisons
BA pairwise connectivity strength values were obtained in T scores per each BA pair (PWCS) and per each hemisphere as shown in Table 2 (T-score columns). All T-values belonging to pairs related to a given BA were considered as a group and statistically compared with the values in the opposite hemisphere. This provides a global interhemispheric BA asymmetry score (GIBA). Likewise, all T-pairs belonging to a hemisphere were summed, averaged, and statistically compared with the opposite hemisphere to find an interhemispheric global connectivity asymmetry (IGCA). These comparisons are shown in Tables 3 and 4. GBA and IGC asymmetries were assessed as differences between left and right hemisphere, and tested for statistical significance utilizing two-tailed T-test, thresholded at p < 0.05. PWCS, lateralization index (PWCS-LI) based on connectivity T-statistics was computed using the following formula:
where positive values indicate left lateralization, whereas negative values mean rightward lateralization. Usually, values <−0.2 are considered rightward, values >0.2 leftward; values in-between are not considered to be significantly lateralized. For this study, we accepted as lateralized those values exceeding 2SD from the LI distribution of the sample. For the LI calculations, we utilized absolute values of T to focus on strength of connection. The anticorrelations indicated by these negative T values are related to negative BOLD and will be addressed in the discussion.
PWCS-Lateralization Index Values with Their Statistical Significance and Mean Comparison
Table rows are organized by BA and T-values. p-Values <1E-4 have been considered as 0. Numbers in bold are considered statistically significant (above mean + 2SD).
p-Values are below the cutting threshold.
BA, Brodmann area; FDR, False Discovery Rate; LI, lateralization index.
Mean Comparisons for Global Interhemispheric Brodmann Area Scores (T-Test Results)
Interhemispheric Global Connectivity Asymmetry
CI, confidence interval.
Statistical methods
At the subject level, pairwise connectivity statistics were provided by CONN, as previously explained. These were generated from contrasts between the source ROI, and each of the target ROIs represented by the areas of Brodmann. The lateralization indices (LIs) obtained from all comparisons were averaged, and the group standard deviation (SD) was found. Those PWCS-LIs exceeding 2SD above the mean, each side considered apart, were accepted as statistically significant. No directionality in the connectivity was considered, thus pair BA6-BA9 is the same as BA9-BA6. All group comparisons were performed utilizing GNU-PSPP 0.7.9, 2012 (available at
Results
From the 120 possible BA pairs, 103 had at least one side with T-values above the threshold. The summary of results is displayed in tabulated values of PWCS which include connectivity strength in terms of T-values, their respective corrected p-values (FDR) and their LIs (Table 2). T-test comparisons for GIBA and IGCA are presented in Tables 3 and 4, respectively.
There was not a statistical difference between left and right IGCA means (mean left = 7.85; mean right = 7.31; p = 0.40; 95% CI: −0.784 < −0.5837 < 1.9516). Neither did IGCA-LI show significant asymmetry (LI = 0.004) (Table 4).
No statistical significant asymmetry was found in any of the GIBA group comparisons. T means differences in p-values ranged from 0.252 for BA9 to 0.944 for BA46 (Table 3).
The greatest statistical significant findings were noted on pairwise comparisons. The following pairs showed connectivity strength exceeding 2SD above the mean (left: mean + 2SD = 18.276; right: mean + 2SD = 16.80): left and right BA21-BA39 (left: T = 19.74; right: T = 16.88); left and right BA22-BA41 (left: T = 25.76; right: T = 16.98), left and right BA22-BA42 (left: T = 18.57; right: T = 17.47), left and right BA41-BA42 (left: T = 20.73; right: T = 18.19); and right BA6-BA9 (T = 19.1). We noted that higher connectivity values do not guarantee significant asymmetry, as both sides may have similar values. Pairwise LI values ranged from −0.90 (BA39-BA44) to 0.662 (BA44-BA7). The mean pairwise LI was 0.0048 with SD = 0.21 (mean +2SD = ± 0.428). Six BA pairs had LIs beyond 2SD from the mean: BA7-BA44 (0.662), BA21-BA40 (−0.595), BA21-BA42 (−0.616), BA39-BA44 (−0.903), BA42-BA47 (−0.445), and BA44-BA38 (0.47). Notice that only three BAs suffice to explain all the asymmetries: BA44, BA21, and BA42, as there is no directionality differentiation (Fig. 2). The following pairs had negative T-values (i.e., anticorrelation): left BA21-BA40, left and right BA39-BA44, and right BA21-BA44. Although no significant asymmetries were found for BA45 and BA22, BA45-BA39 was near the cutoff (LI = 0.409). The maximum LI for area BA22 was just slightly right lateralized (LI = −0.239).
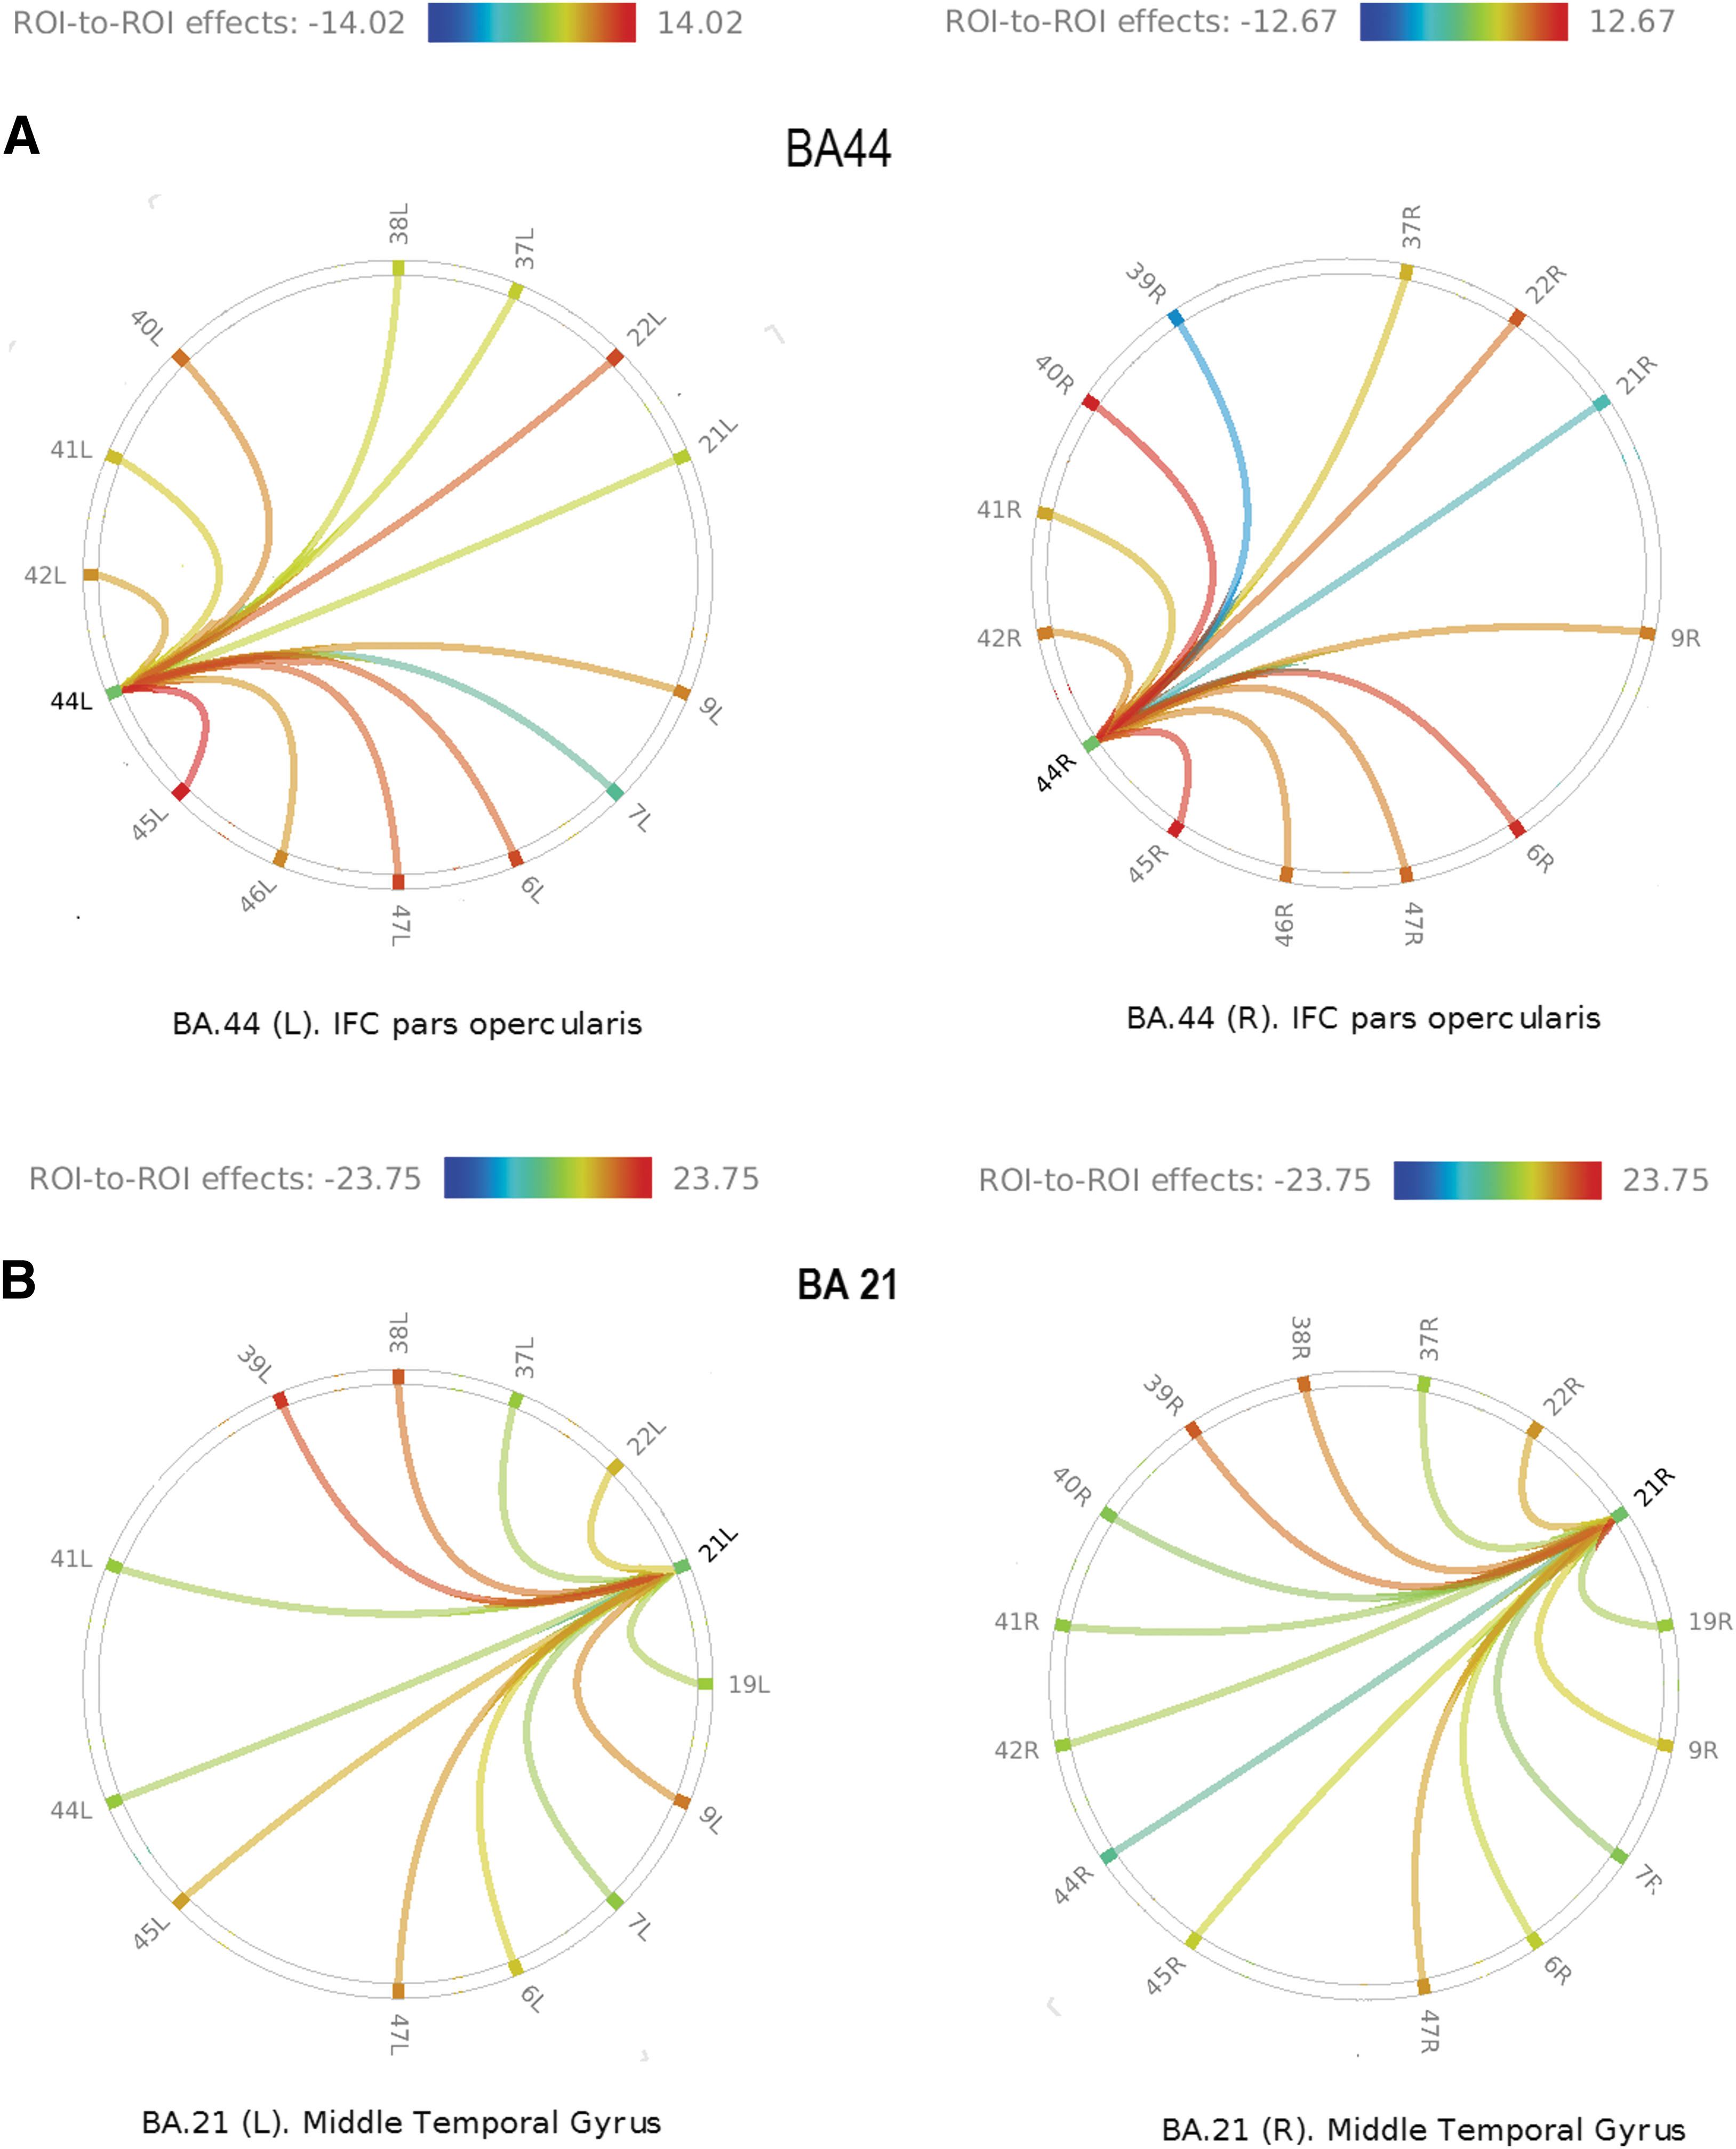
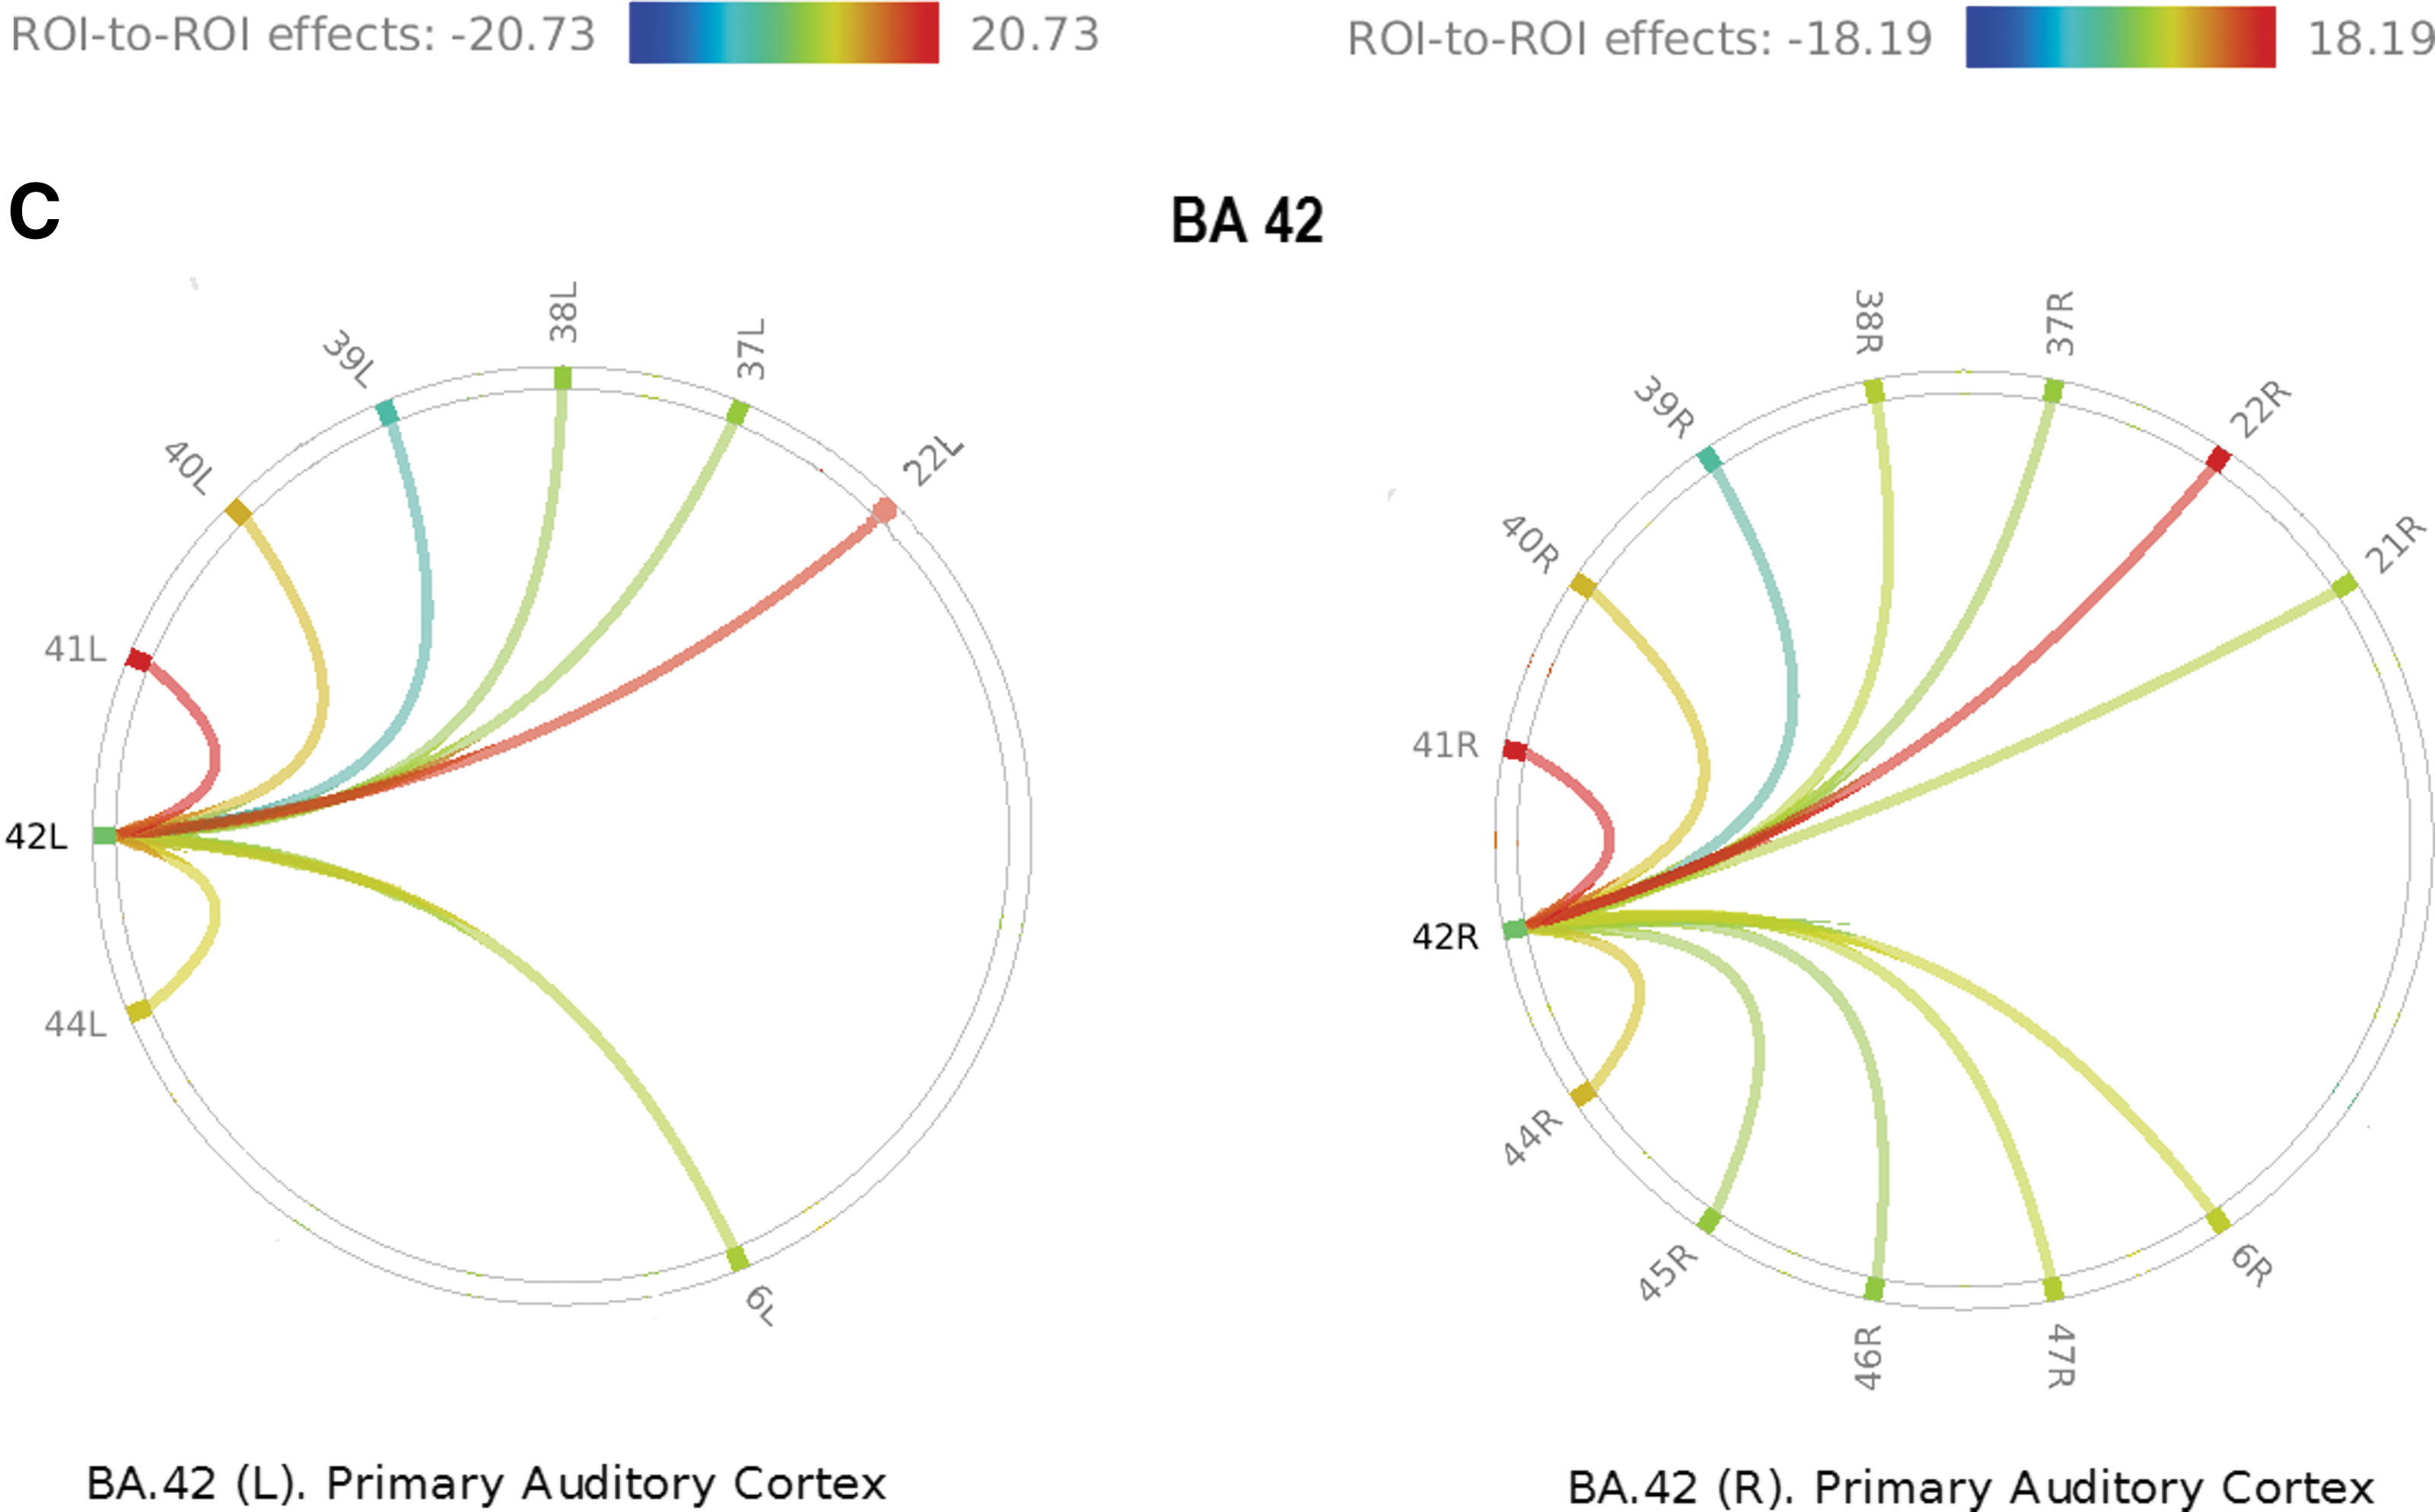
Figure 3 illustrates the PWCS pairs with significant LI.
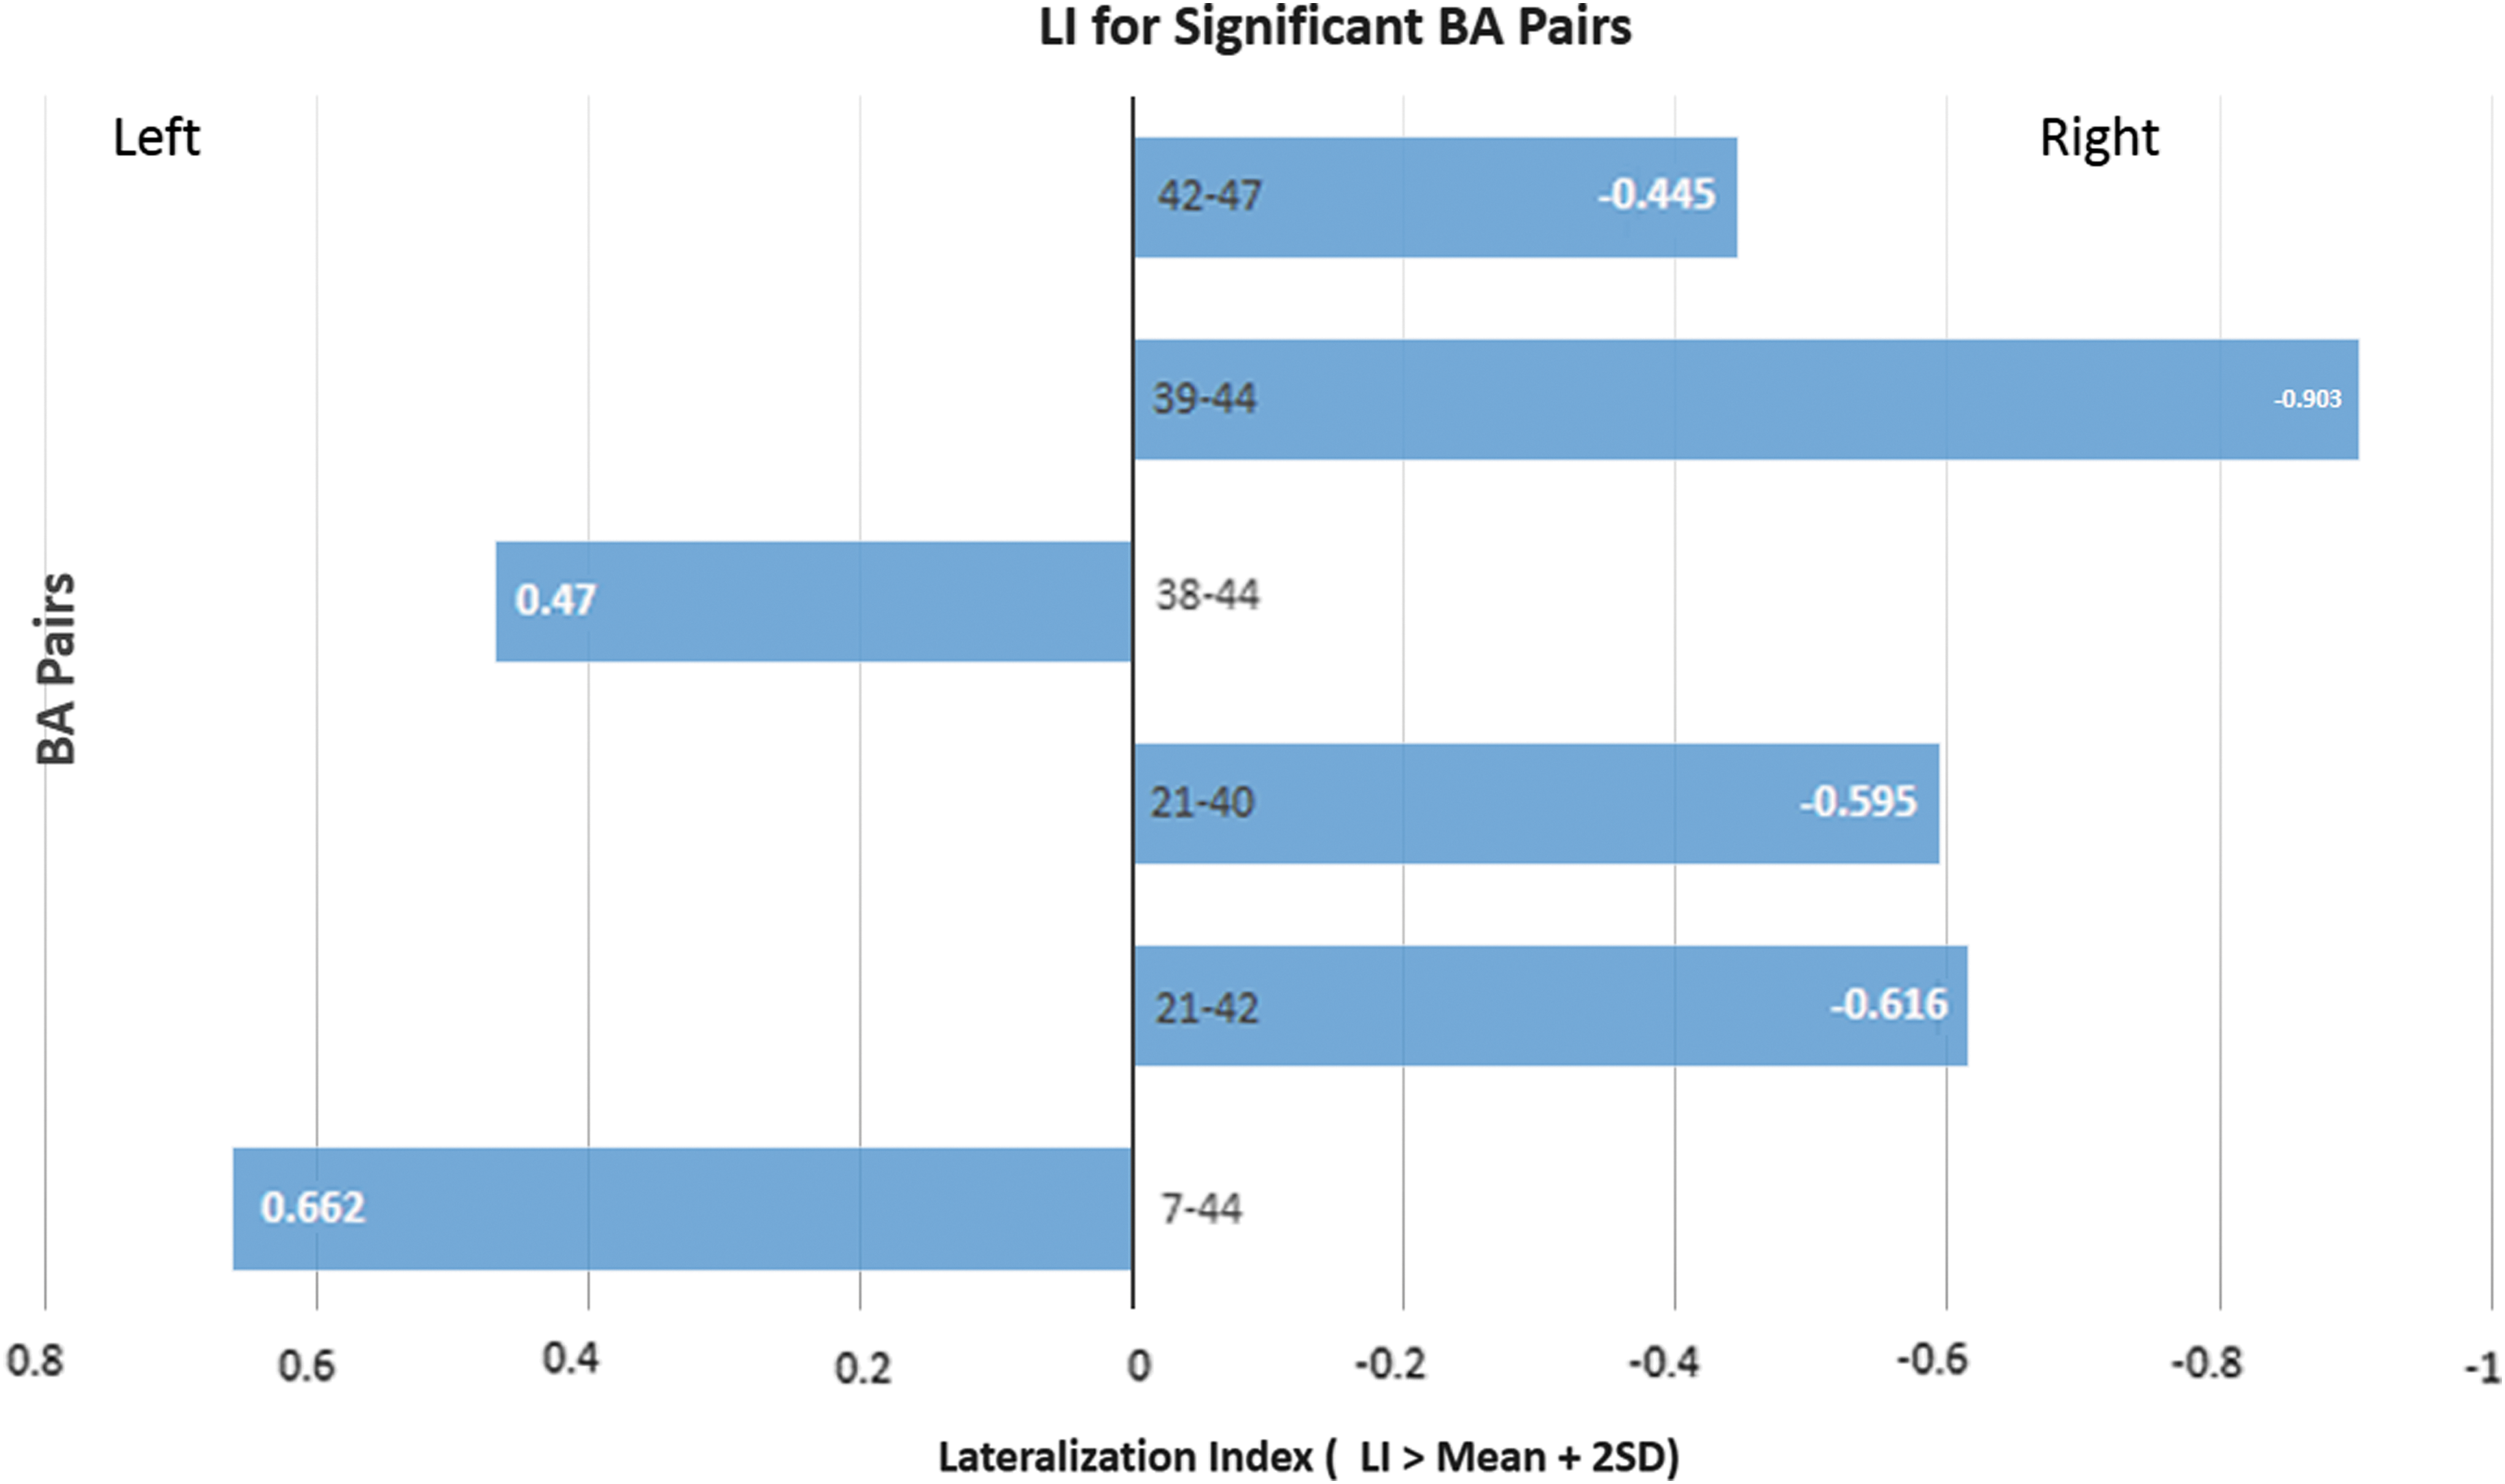
Graphic representation of most significant lateralization indices from PWCS analysis. Of note is that not only pairs BA44-BA39 and BA21-BA40 had negative LI values (right-sided dominance) but also the T-values were negative. LI, lateralization index.
Discussion
In summarizing the main results, our first hypothesis was rejected because global intrahemispheric connectivity unexpectedly appears to be quite symmetric. Our second hypothesis was accepted as true, with findings of significant connectivity asymmetry for BA44: (pairs 44-7 [left dominant], 44-38 [left dominant], and 44-39 [right dominant]); BA21: (pairs 21-42 [right dominant] and 21-42 [right dominant]); and pairs 42-47 (right dominant). Several BA pairs show strong negative correlation: left BA21-BA40, left BA39-BA44, right BA21-BA44, and right BA39-BA44; and no significant asymmetries were found for BA45 and BA22.
Some of our results are unexpected, as they have not been previously reported as far as we could find. It is difficult to understand (1) the lack of connectivity asymmetry of all pairs related to BA22 and BA45; (2) the striking right dominance of the BA44-BA39 connectivity; and (3) the negative correlation of BA39 and BA21 with other canonical language areas (suggesting inhibitory input).
Some pioneering studies have utilized rs-fMRI to assess the connectivity between language areas. Interhemispheric differences between the connectivity of the IFG, the left frontal middle gyrus, and the anterior cingulate gyrus (pre-SMA) have been investigated (Lou et al., 2017; Waites et al., 2006). The first group only contrasted normal controls versus adult patients with temporal lobe epilepsy (TLE); while the second sought to demonstrate connectivity differences between left and right pre-SMA to the ipsilateral frontal operculum in a group of 30 normal adult subjects. Language networks have also been obtained from independent component analysis (ICA), another resting-state postprocessing connectivity method, in a group of 23 epilepsy patients (age range 10–59 years) (DeSalvo et al., 2016). It is worthy of note, however, that language network appears in only 57.5% of cases in a normal pediatric population, utilizing ICA (see:
Closer to our approach, Doucet and colleagues (2015) studied 55 TLE patients and 23 healthy controls who underwent rs-fMRI. In this work, connectivity was sought to correlate LI values previously obtained from an expressive language task (verb generation) to functional connectivity T-values between the pars orbitalis and opercularis, and different areas of the brain. Interestingly, within the group of normal controls a positive correlation with the LI was found involving connectivity with the right superior frontal cortex and the left SMA. Our methodology differs primarily by correlating the signal time course from function-related ROIs rather than anatomical regions, as well as inclusion of analyses of ancillary language areas. Despite differences in methodology and scope, our findings confirm the asymmetries of BA44 (pars opercularis) and BA47 (pars orbitalis) previously found by Doucet's group.
The present findings are also concordant with a similar study recently published by Joliot et al. (2016) that utilized rs-fMRI to create complex correlation matrices for each hemisphere based on the Atlas of Intrinsic Connectivity of 192 Homotopic Areas, as described previously by the same group (Joliot et al., 2015). Their approach also utilized pairwise connectivity, while evaluating intrahemispheric intrinsic connectivity asymmetry. However, our methods differ substantially. Instead of ascertaining LIs or contrasting left and right mean scalars, Joliet's group assessed hemispheric asymmetries by categorizing a matrix of the differences “between the left and right intra-hemispheric matrices of intrinsic correlation computed for each pair” as either typical or atypical, and correlating them with language LIs obtained from standard fMRI.
Although we found greater asymmetry in canonical language areas, this was not universally true across all of them. The leftmost asymmetry was found for pairs BA44-BA7 (LI = 0.662) and BA44-BA38 (LI = 0.47). Results emphasize the importance of left BA44 (Broca's putative area). It is striking that the most significant BA44 pairs have been formed with language ancillary areas and not with the canonical pairs of the receptive areas (BA21 and BA22). The involvement of left BA7 in language has been previously established: It has been found activating in attention to phonological relations (McDermott et al., 2003), imageability in word comprehension tasks (Bedny and Thompson-Schill, 2006), literal sentence comprehension (Shibata et al., 2007), and phonology and semantic processing (Seghier et al., 2004). Left BA7 is more frequently reported as having involvement in verbal working memory tasks (Shivde and Thompson-Schill, 2004; Tsukiura et al., 2001); hence, the high connectivity noted across all mentioned studies may be explained by verbal working memory demands. Moreover, a recent study published by Bernal et al. (2015), utilizing meta-analytic connectivity model, found BA7 as the third main cluster connecting to the left BA44 (the seeding ROI). The two other clusters were BA6, 13, 9, 46, 47 (first cluster) and areas of the pre-SMA (second cluster).
One unreported finding is the asymmetry of the pair BA44-BA38, although the role of left temporal pole (BA38) in language has been reported in numerous studies (Bottini et al., 1994; Giraud et al., 2004; Vandenberghe et al., 2002). Despite this, significant language impairment is seldom seen after anterior temporal lobe resection in epilepsy patients. We speculate that this could be the result of a faulty neuropsychological battery with insufficient sensitivity, as a number of recent publications have shown the importance of the left temporal pole in retrieving category-specific names (Belfi and Tranel, 2014; Mehta et al., 2016; Tranel, 2009).
The right side lateralization of BA21-related pairs was another unexpected finding. Left BA21 is the core of the receptive language area, along with BA22. Numerous studies have shown left BA21 activation in semantic processing (Chou et al., 2006; Duzel et al., 2001; McDermott et al., 2003), as well as word and sentence production (Brown et al., 2006; Friedman et al., 1998). However, language usually (at least oral declarative language) conveys prosody, and right BA21 has been implicated in prosody analysis (Ethofer et al., 2006; Hesling et al., 2005). Current understanding of how the cortex processes prosody is far less sophisticated than for declarative language; while the latter is more clinically and functionally important, results of this study suggest that stronger connectivity of BA21 with areas of auditory input and analysis (BA42 and BA40) likely involved with prosodic aspects of language on the right side. The same appears to happen with pair BA42-BA47, also with right side dominance. To our knowledge, no studies have focused on BA42 because this area is always included with BA41 as a primary auditory area. An ad hoc PubMed search (March 2, 2017) using key words “Prosody Brodmann area 42” yielded zero results.
It remains unclear why significant asymmetry of any BA45 pairs was not demonstrated. The absence of significant asymmetrical connectivity of BA45 with the remainder of each hemisphere or with other BA pairs may merely represent a consequence of the high statistical threshold. In fact, BA45-BA39 shows a LI of 0.409, which is left lateralized. However, this number is below our cutoff value, and was therefore discarded. We want to emphasize the effect of the stringent values we chose, and it should be noted that in the neurofunctional radiology literature a LI greater than 0.2 is an acceptable score to define any activation as left lateralized (Guillen et al., 2009; Ruff et al., 2008). The involvement of BA45 in language processing has long been established, producing activation across a wide range of fMRI language tasks (i.e., word generation, phonological and semantic processes, metaphoric and grammatical processing, lexical search, semantic memory retrieval, etc.; see
Another completely unexpected finding was the lack of asymmetry between BA22 pairs, particularly since this is the core part of Wernicke's area. It has been demonstrated that a consistent structural connectivity asymmetry exists between receptive language areas (which includes BA22) and frontal expressive areas through the arcuate fasciculus (Matsumoto et al., 2008; Nucifora et al., 2005). Our unanticipated finding seems to be indicative of equally strong involvement of the right hemisphere beyond that of verbal-linguistic functions. Areas for melodic and prosodic processing of verbal communication within the right hemisphere have been previously suggested (Lindell, 2006), as well as for comprehension of reading and language with higher complexity (Xu et al., 2005). Within the present data, the most salient finding with regard to BA22 was strong bilateral connectivity with the ipsilateral BA42 (primary auditory area). While this strengthens support for the role of the posterior most superior temporal gyrus in receptive language processing, because of clearly asymmetrical propositional vs. prosodic language functions within the cortex, it remains curious why these associations are so comparable across hemispheres.
The rightward asymmetry between BA44 and BA39 deserves special attention. Although the LIs are based on strength of activation given by positive T-values, they may have a negative value also, which is expressed mathematically as an anticorrelation between the pair. Anticorrelation, in this context, refers to negative BOLD, occurring relative to the signal in the seed ROI. Experimental findings have found sustained negative BOLD associated with decreased neural response due to inhibitory input (Shmuel et al., 2002). We favor this explanation to blood steal as an alternative explanation since the anticorrelated pairs are located in remote brain areas.
In this study, BA44 was negatively correlated with BA39 in both hemispheres but at quite different strengths (Tleft = −0.36; Tright = −7.06) suggesting an inhibitory input from one area to the other in both hemispheres. We acknowledge that the technique used does not allow discrimination of directionality in the connectivity. However, it does seem reasonable that this BA pair follows the principles of general brain organization proposed by Luria (1972), in which information derived from afferent input is being relayed from posterior receptive areas to anterior regions responsible for execution of behavior. If this were the case, the right BA44 would be more strongly inhibited by BA39 (the higher negative correlation) than its left counterpart, leaving the left BA44 with some advantage as it has less inhibitory input. The inhibitory effect of BA39 seems to make sense as it has been established that BA39 (the angular gyrus/inferior parietal lobule) is part of the default mode network, which is known to have a negative correlation with task-related (i.e., salience and executive) networks. However, the interplay between these two areas is not well understood as other studies have found positive input from BA39 to BA44. For instance, Hampson and colleagues (2006) found a positive correlation between left Broca's area and the ipsilateral angular gyrus in reading skills. It is important to note that both BA44 and BA39 on the right side have been less studied and therefore less understood than their left homotopic counterparts. In sum, the significance of the functional relationship between BA44 and BA39 and its role in cognition warrants further investigation.
Limitations and Future Directions
The main limitation of this study is the lack of a gold standard for language lateralization in the sample group. However, this limitation is likely to have a limited impact upon interpretation of the results since language lateralization in strongly right-handed normal subjects has been found in 96% of cases (Knecht et al., 2000). We feel that our effort to select only strong right-handed subjects should add confidence that, as a group, our sample has a strong left hemisphere language lateralization.
The age range of this sample could be considered either a limitation or strength depending on the perspective. On one hand, these findings may not fully apply to adults, as the relationships reported may represent an incomplete maturational stage. On the other, imaging data for children are far less common; therefore, this study has a greater potential upside to understanding pediatric brain networks. The natural developmental trajectory of cortical connectivity was represented in the work of Xiao and colleagues (2016), who tracked longitudinal changes in resting-state connectivity from 5 to 6 years old. Despite looking at only a narrow developmental snapshot, progressive changes in connectivity across the whole brain were correlated with increasing age and language improvements. Higher level cognitive and reasoning skills are also associated with maturation of functional networks, particularly between the left rostrolateral prefrontal cortex (BA10) and angular (BA39) and supramarginal gyri (BA40) (Uddin et al., 2011; Wendelken et al., 2016).
The use of absolute values for the LI to maintain the scalar as a ratio between −1 and 1 may obscure more significant differences. For instance, a BA pair having T-values −7.0 on the left and 7.0 on the right will have the same LI than other BA pair having T-values 7.0 left and 7.0 right. Although the connectivity strength is the same, the functional effect may be completely different, as negative values suggest inhibitory input. Ad hoc analysis of plain T differences subtracting right T-value from left T-value in the PWCS analysis showed five values 2SD over the mean. Four of them with leftward advantage: BA9-BA39: 6.02; BA21-BA44: 7.19; BA22-BA41: 8.18; and BA39-BA44: 6.7. BA7-BA37 had a rightward advantage: −7.66. Of note is the relevance of the canonical language areas obtained with this simple approach. Among these pairs, only BA39-BA44 showed up in our analysis based on connectivity strength.
The current findings are presented at an aggregated group level; although all participants were neurologically normal, individual variability may lead to conclusions that are not applicable at the individual level. Therefore, these results should be interpreted with caution, as they require replication and additional studies before it could be utilized in the clinical arena where normative patterns may not apply. For example, atypical resting-state connectivity has been demonstrated in epilepsy, with longer disease duration correlating with greater functional changes (Wang et al., 2011). In left TLE, resting-state connectivity is altered relative to controls, whereby dominant hemisphere language modules demonstrate diminished connectivity (Waites et al., 2006).
Forthcoming research should also include comparison of normal controls against patients with neurological conditions known to have atypical connectivity patterns, such as those with epilepsy. Further development of our technique and findings might have a very practical usage allowing language mapping in patients on natural sleep or under light sedation not only in very young children but also for those otherwise unable to stay still during an awake scanning process. While knowing which areas are connected is important, only through an understanding of how they interact physiologically will this science take on true clinical relevance and ability to inform medical decision making.
In conclusion, we have shown connectivity asymmetries that appear to be related to language lateralization. The main asymmetries were related to Brodmann pairs BA42-BA47, BA39-BA44, BA21-BA40, and BA21-BA42 with right-side dominance, and BA44-BA38 and BA44-BA7 with left-side dominance. While further technical refinement is needed, task-free rs-fMRI procedures could become an alternative method of probing language lateralization in noncooperative patients requiring resective brain surgery.
Footnotes
Author Disclosure Statement
Dr. Byron Bernal is president and owner of fMRI Consulting. All other authors have no competing financial interests.