
Abstract
Transcranial alternating current stimulation (tACS) has been proposed as a tool to draw causal inferences on the role of oscillatory activity in cognitive functioning and has the potential to induce long-term changes in cerebral networks. However, effectiveness of tACS underlies high variability and dependencies, which, as previous modeling works have suggested, may be mediated by local and network-level brain states. We used magnetoencephalography to record brain activity from 17 healthy participants at rest as they kept their eyes open (EO) or eyes closed (EC) while being stimulated with sham, weak, or strong alpha-tACS using a montage commonly assumed to target occipital areas. We reconstructed the activity of sources in all stimulation conditions by means of beamforming. The analysis of resting-state brain activity revealed an interaction of the external stimulation with the endogenous alpha power increase from EO to EC. This interaction was localized to the posterior cingulate, a region remote from occipital cortex. This suggests state-dependent (EO vs. EC) long-range effects of tACS. In a follow-up analysis of this online-tACS effect, we find evidence that this state-dependency effect is mediated by functional network changes: connection strength from the precuneus was significantly correlated with the state-dependency effect in the posterior cingulate during tACS. No analogous correlation could be found for alpha power modulations in occipital cortex. Altogether, this is the first strong evidence to illustrate how functional network architectures can shape tACS effects.
Introduction
L
State dependency of neurostimulation has been previously established (Alagapan et al., 2016; Neuling et al., 2013). This means that the cortex is more or less susceptible to the externally applied stimulation, depending on its fluctuating patterns of neural activity at local scales, as well as on a network level (for a review see Bikson and Rahman, 2013). State dependency has broad implications: as the configuration of resting brain networks changes in many circumstances—most notably when damaged—not only treatment of neuropsychiatric disorders (Brittain et al., 2013) but also nonclinical applications would benefit considerably from a clearer view of the nature of brain stimulation and its nonlinear dependencies. Only a few studies have elucidated the online state dependency of tACS. For example, a recent study by Alagapan and colleagues (2016) using modeling, invasive stimulation, and electrocorticography in humans showed that different behavioral states (such as task engagement or resting eyes open [EO]/eyes closed [EC]) profoundly impact how the same electrical stimulus perturbs ongoing activity. Noninvasively, alpha phase locking with the stimulation signal was shown to change as a function of EO/EC state and current strength (Ruhnau et al., 2016b). No study so far has pursued the issue empirically as to what extent altered network states could mediate tACS effects.
Effects of tACS are seen in brain regions distant from the stimulated cortex, but anatomically and functionally connected (Cabral-Calderin et al., 2016). In a framework for explaining prestimulus predispositions on conscious near-threshold perception (Ruhnau et al., 2014), we argue that network-level integration of a neural ensemble determines its propensity to impact downstream regions. In practice, network integration has been operationalized using graph theoretical metrics (Frey et al., 2016), providing support for the framework. In this study, we expect that an analogous mechanism could determine how tACS could exert long-range effects. Interhemispheric phase synchronization has been shown to be the mechanism behind tACS interference, with functional coupling related to visual perception (Helfrich et al., 2014a). While the latter study shows how tACS affects brain connectivity, we ask the inverted question: how changes in functional network architectures determine the effect of tACS.
In the present study, we analyzed EO and EC resting-state MEG data from Neuling and colleagues (2015). We expected to see online increases of power at the stimulation frequency that is dependent on brain state and tACS. In testing the notion that altered functional network architecture could have an influence on tACS effects, we took the most consistent interindividual state-dependent modulation of network integration (in EO vs. EC, in the precuneus) in the nonstimulated brain and investigated how this relates to the state-dependent alpha power change during tACS. This analysis revealed a significant association, whereas an analogous analysis using power changes during EO and EC in the sham condition was not significant. Overall, our results yield empirical evidence that functional network modulation mediated even by an apparently simple behavioral manipulation can profoundly shape tACS effects.
Materials and Methods
Subjects
Seventeen healthy participants (9 males, 28 ± 4 years old; all right handed) without psychiatric or neurological disorders volunteered for the study. The experiment was approved by the Local Ethics Committee of the University of Trento and carried out in accordance with the Declaration of Helsinki. All participants gave written informed consent prior to its beginning.
Stimuli and procedure
After applying the MEG coils and tACS electrodes to the head and determining the stimulation intensity (see tACS parameters), subjects were seated in an upright position in the MEG shielded room. After a brief resting-state measurement block and the estimation of the individual stimulation frequency (see ISF determination section below), participants were asked to keep their EO for 2 min until a tone and a visual instruction presented on a screen asked them to close their eyes (EC) for another 2 min. This was repeated thrice while no, weak, or strong tACS was applied. The strong stimulation condition was always the last block, to avoid possible aftereffects. For more details on the complete experimental session, see Neuling and colleagues (2015).
tACS parameters
A battery-operated stimulator system (DC-Stimulator Plus; NeuroConn GmbH, Ilmenau, Germany) was placed outside the magnetically shielded room. It was connected to the stimulation electrodes through the MRI module (NeuroConn GmbH). The stimulator delivered an alternating sinusoidal current through two conductive-rubber electrodes (NeuroConn GmbH) of 7 by 5 cm applied with a conductive paste (Ten20; D.O. Weaver, Aurora, CO) on the scalp at Cz and Oz of the international 10–20 system, chosen for maximal stimulation intensity in the parieto-occipital cortex (Neuling et al., 2012b). The electrode cables were located on the right side of the participant's head. In order to keep participants naive regarding the stimulation condition, the intensity was kept below the individual sensation and phosphene threshold (for each subject's parameters, cf. Supplementary Table S1 in Neuling et al., 2015). To obtain the threshold, the subject was first familiarized with the skin sensation. Then the subject was stimulated with an intensity of 400 μA (peak-to-peak) at 10 Hz for 5 sec. The intensity was increased by steps of 100 μA until the subject indicated skin sensation or phosphene perception or 1500 μA were reached. In the two cases in which the subject already reported an adverse effect at 400 μA, the intensity was reduced to a start level of 100 μA and increased by steps of 100 μA. The individual estimated threshold minus 100 μA was used as stimulation intensity in the strong tACS block. During the sham block, the experimental setup was the same as in the other blocks, but no electrical stimulation was applied. A stimulation intensity of 50 μA was delivered during the weak stimulation.
MEG data recording
Electrophysiological brain activity was recorded at 1000 Hz (on-line band-pass hardware filters: 0.1–330 Hz) using whole head Elekta Neuromag MEG (Elekta Oy, Helsinki, Finland), housed in a magnetically shielded room (AK3b; Vacuumschmelze, Germany). Magnetic brain signal was spatially sampled at 102 positions, each consisting of a channel triplet of one magnetometer and two orthogonal planar gradiometers, yielding 306 sensors overall. Prior to the experiment, fiducials (nasion and left/right periauricular points), the location of five head position indicator coils, and more than 200 head shape samples were acquired for each participant with a Polhemus FASTRAK digitizer (Polhemus, VT). The coils tracked the position of the participants' head during the experiment, and the head shape served later for head modeling.
ISF determination
Subjects' alpha frequency, then used as the tACS frequency, was determined by analyzing the initial resting-state block immediately after the measurement (and before the stimulation blocks). The recording was divided into 2-sec segments, and for each we estimated the power spectra for frequencies ranging from 1 to 25 Hz in 0.25 Hz steps, after multiplication with a Hanning window and zero padding of 4 sec. Clear alpha peaks were identified in the averaged spectral power of the segments and of a chosen group of parieto-occipital gradiometers. In two participants, the peak was not evident from the data, so the frequency analysis was repeated for the EC portion of the first block (no-stimulation condition). The identified alpha peak was then used as the individual stimulation frequency (ISF, referred to as IAF in Neuling et al., 2015) for the tACS.
Offline MEG data analysis
Preprocessing
Continuous data were off-line high-pass filtered above 1 Hz and then downsampled to 512 Hz. Then EO and EC resting-state data were segmented into nonoverlapping epochs of 2 sec aligned to the phase of the stimulation. Epochs in the stimulation-free block were visually inspected to identify noisy, jumpy, and dead sensors (then excluded from the whole data).
Source projection of raw data
Sensor space epochs were projected into source space using linearly constrained minimum variance beamformer filters (van Veen et al., 1997), following the procedure for single virtual sensors (
Beamforming is an adaptive procedure that optimizes spatial filters to restrict covariant signal from surface recordings to a source, localizing and spatially separating activity in the brain. As such, beamformer filters silence sources of noise correlated across sensors and suppress external artifacts in every location (Brookes et al., 2007). In addition to localizing activity in the brain, the aforementioned features seem tailored to reduce the tACS artifact, which is highly correlated noise. No regularization was used to avoid leakage of the tACS artifact to virtual sensors (Neuling et al., 2017). Of the 889 reconstructed sources, only the ones positioned strictly inside the MNI brain were used for subsequent statistical analysis, resulting in 576 virtual sensors. This was done to ensure that no peripheral source capturing the tACS stimulation was included in the statistics (Neuling et al., 2017). An MNI template brain was used for visualization purposes.
Resting-state power spectrum and phase locking value
Fourier coefficients were estimated for each epoch of the resting-state data in MEG sensors and in reconstructed activity in brain sources. We used a multitaper spectral estimation (Mitra and Pesaran, 1999) with a fixed smoothing window of ±2 Hz, with a 1 Hz resolution for the frequencies between 1 and 40 Hz and 2 Hz for those between 42 and 84 Hz. The same smoothing parameters for low and high frequency bands were chosen in order to make comparisons across the entire spectrum.
Mean power densities were determined by averaging the squared absolute value (complex magnitude) of Fourier spectra across epochs and tapers for every sensor and brain source. As a measure of entrainment, we used the intertrial phase locking value (PLV; Lachaux et al., 1999), calculated as the absolute value of the mean of complex Fourier coefficients. As trials from sensor data were aligned to the phase of the tACS, this gave us an intertrial coherence to the stimulation at the sources. These averages were computed separately for all stimulation conditions (sham, weak, and strong tACS) and for the whole recording with both EO and EC states collapsed together or individually.
Statistical analysis and state dependency
Power from different conditions was compared using nonparametric cluster-based permutation-dependent samples T-statistics (Maris and Oostenveld, 2007). Cluster randomization was repeated over 5000 permutations. We contrasted relevant conditions at frequencies of interest, alpha and its first two harmonics, the first subharmonic and two control frequencies in between, corresponding to 5, 10, 15, 20, 25, and 30 Hz. Only cluster-corrected p values lower than
The same contrast was repeated for PLV and for the weak tACS condition. Because separate beamforming filters were used, it is not possible to draw a clear interpretation from a direct comparison between different levels of tACS on reconstructed brain sources, but this normalized contrast overcomes this limitation. For illustrative purposes, we also contrasted sham EC versus EO and strong versus sham conditions (both EC and EO).
Graph analysis
We calculated the source-by-source coherence from the Fourier spectra. The absolute value of the imaginary part of coherency was used as the functional connectivity metric to obtain the adjacency matrix. Imaginary coherency guards against spurious correlations due to volume conduction (Nolte et al., 2004). To find the best threshold to binarize the adjacency matrix, we started with the minimum value that ensured, for each frequency, the highest imaginary coherency without disconnected nodes in the graph. This threshold, in which every node in the graph has at least one edge, avoided underestimation of connections. A range of thresholds around this value (±0.1 in steps of 0.02) was then tested to ensure the stability of the effects across choices of threshold. The threshold used was the one that had the highest and most stable effect for nearby values.
Local connectivity for each node was assessed with the following measures: node degree, efficiency, clustering, and betweenness (Rubinov and Sporns, 2010). We then applied the same nonparametric cluster-based permutation tests to these measures as we did for power (also the same frequencies, see Statistical Analysis and State Dependency section above), contrasting however only EC against EO for sham condition. Through this analysis, we assess the individual propensity of network modulation due to this subtle behavioral change, yielding a stronger argument that potential long-range effects during tACS are mediated by network-level changes. Local efficiency was the only measure that showed a cluster at a p value lower than
Regression and partial correlation
We wanted to explore whether the magnitude of the state dependency effect correlated with connectivity. First, we assessed whether the different tACS intensities, with which individual participants were stimulated, would explain some of the variance of the effect (Ruhnau et al., 2016b). Therefore, we extracted for each participant the percent change of the strong tACS normalized EC/EO contrast (see Statistical Analysis and State Dependency section) from the source with maximum group-level t value. We regressed the individual tACS intensity with these values. The linear model fit provided the adjusted R-squared and the F statistics.
As we ascertained the relation of stimulation intensity with state dependency, we had to partial out the variance explained by intensity from subsequent correlations. We were interested in the area with differential network integration profile in EC and EO and its connection with the state-dependency region. We therefore took for each participant the EC/EO percent change of imaginary coherency from the source with maximal significant difference in local efficiency (see Graph Analysis section above) to the state-dependency source. We then calculated the Spearman rank partial correlation coefficients between these individual percent changes of seeded imaginary coherency and state dependency, controlling for tACS intensity. We repeated the partial correlation with percent change of EC/EO power in the occipital cortex instead of seeded coherency, also to control for spurious correlation due to the most variance explained by tACS intensity. Correlation coefficients were t-tested against the two-sided alternative hypothesis of no partial correlation.
Results
Power modulations during tACS
The cluster-based statistic on 10 Hz contrasting the strong tACS against sham (calculated with separate lead field filters) portrayed a strong increase for the stimulation condition distributed in the whole brain, maximally localized in the border between the cuneus and the precuneus (Fig. 1A). The difference was highly significant (p cluster < 0.001), but its interpretation is unclear (see Discussion section) and it is shown in this study only for illustrative purposes.
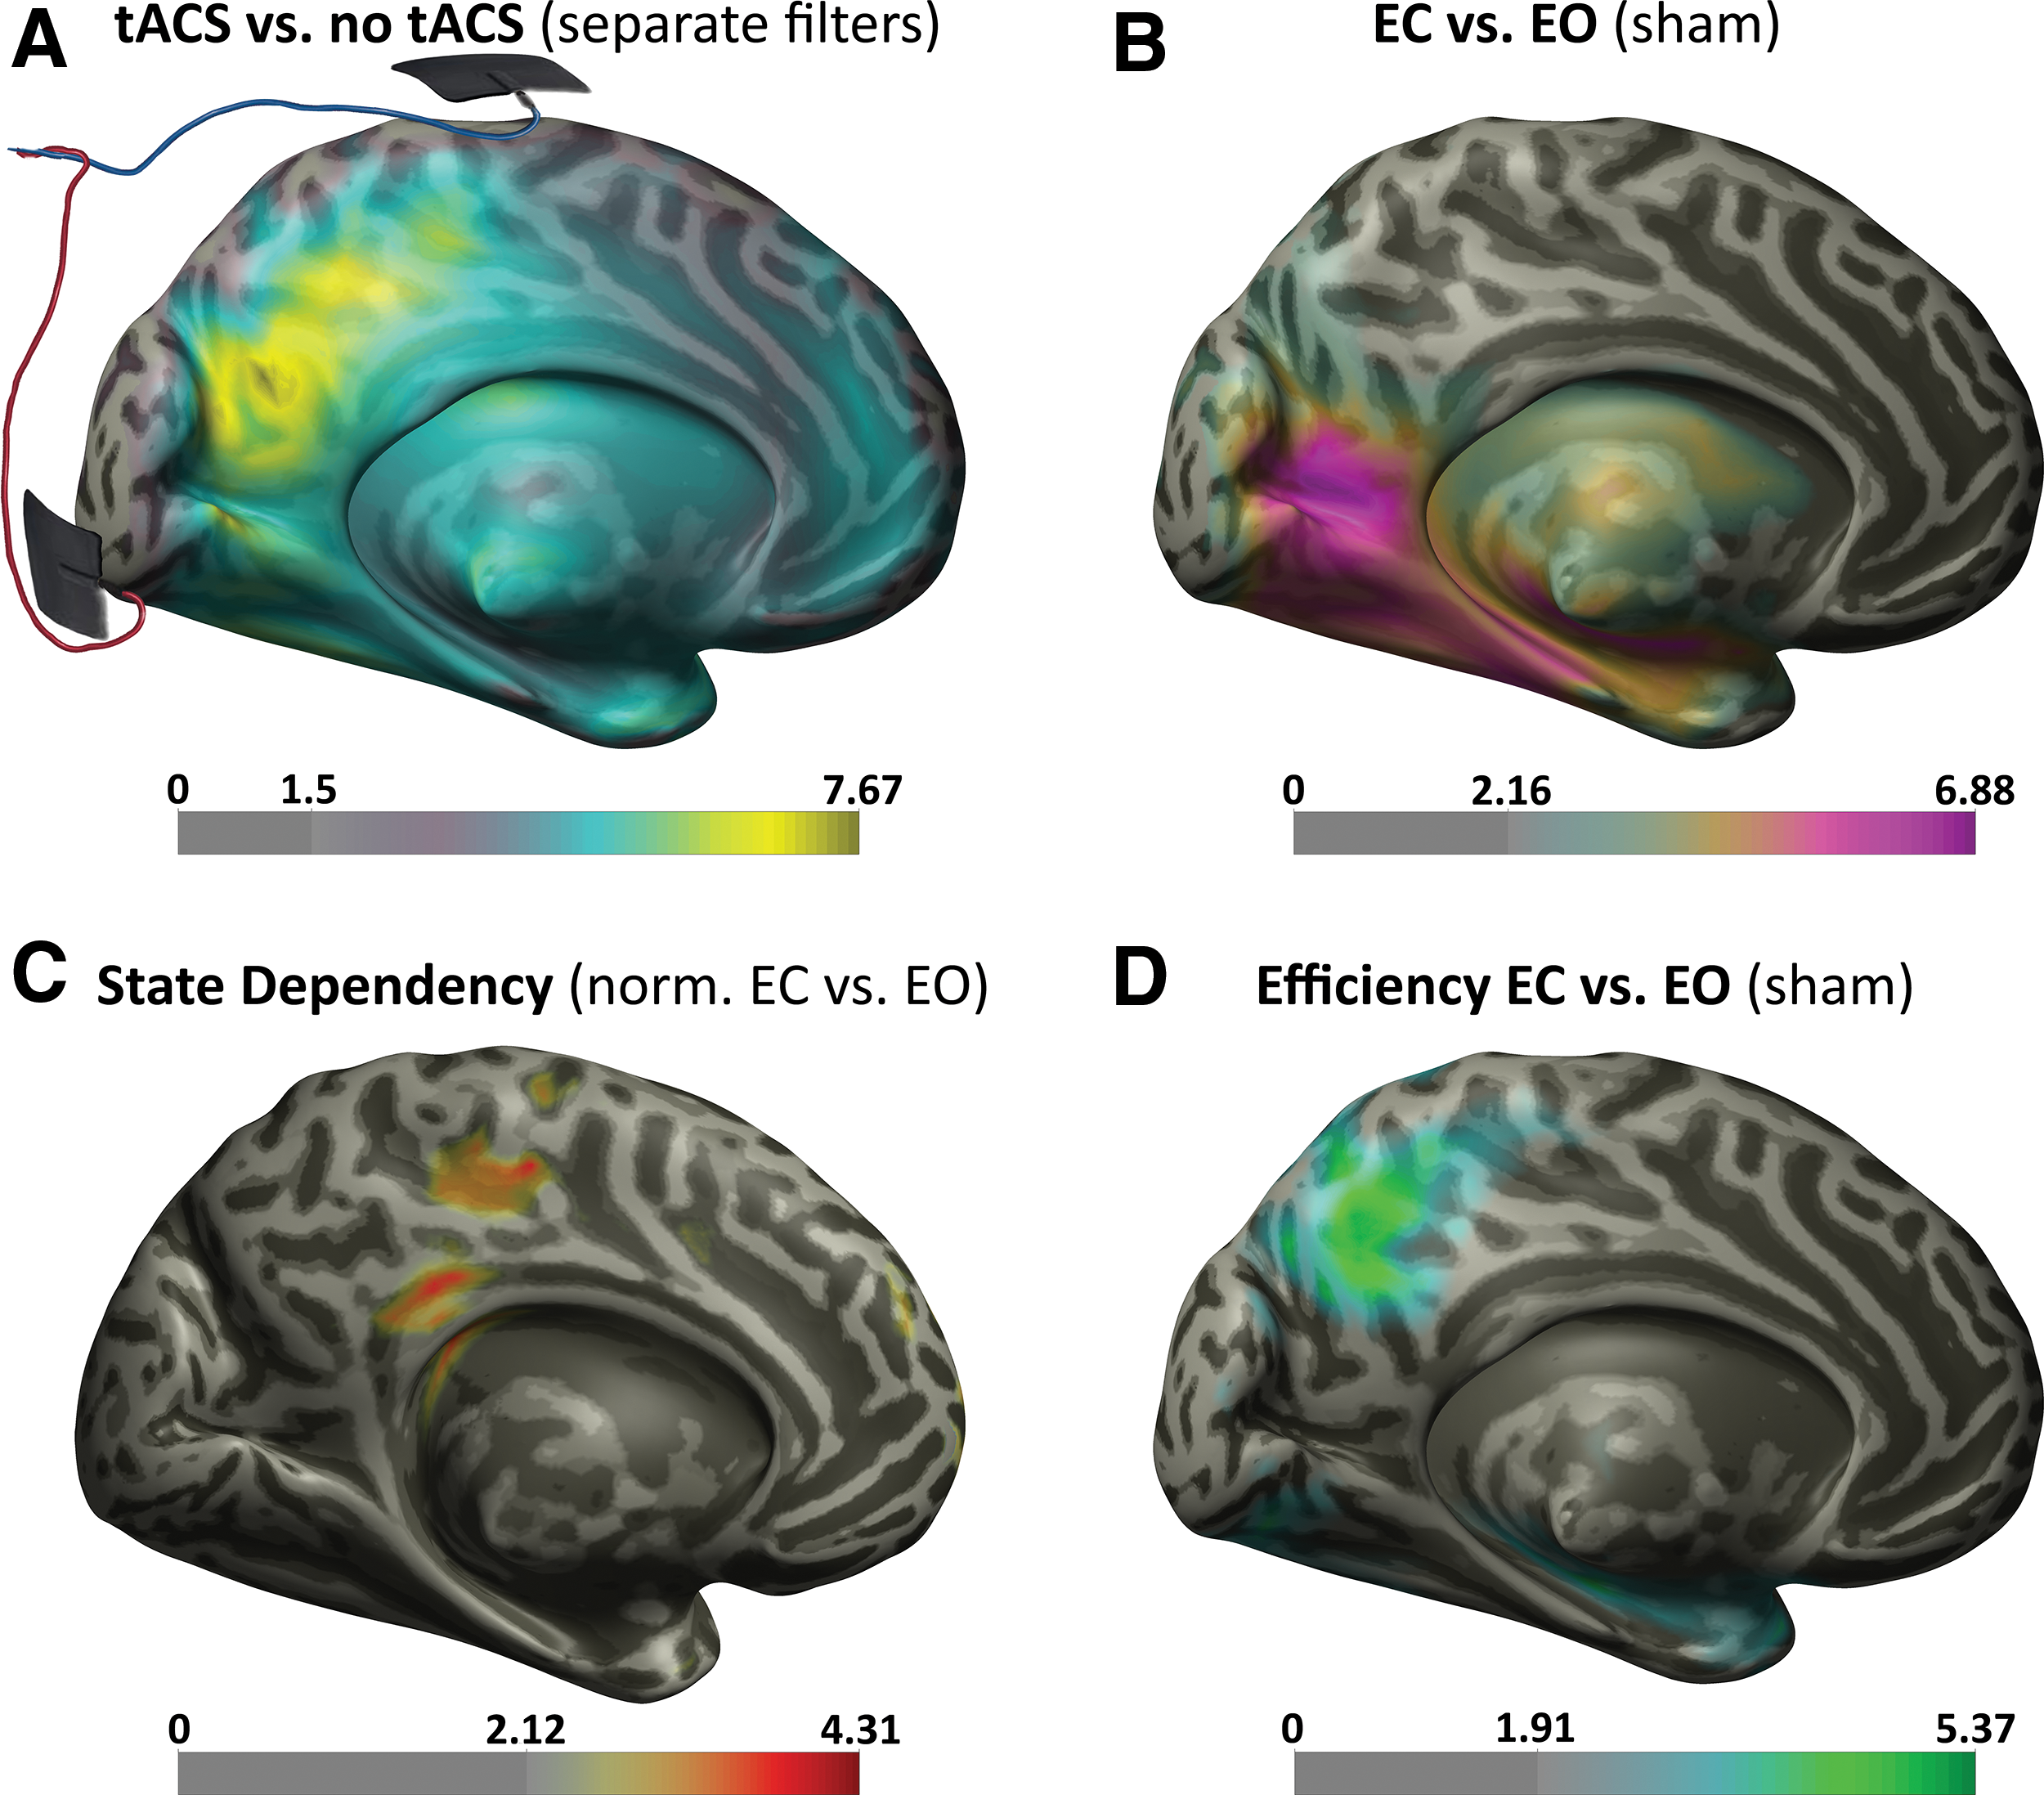
Posterior t value topographies. Significant t value brain maps of the principal effects at 10 Hz during EC or EO and sham or strong alpha tACS. On the bottom of every MNI hemisphere, the color bars with the t values masked for cluster-corrected p < 0.05 significance. Between 0 and the max is the lowest significant t value.
As expected, power at 10 Hz increased in contrasts between EC and EO for all tested frequencies in all stimulation conditions (p
cluster < 0.002 for sham, Fig. 1B), but there was no PLV change across all conditions (Supplementary Fig. S1C; Supplementary Data are available online at
Ongoing brain oscillatory activity interactions of stimulation and brain state were assessed with a stimulation-normalized contrast between EC and EO. No state-dependent power activity was found for this contrast for weak tACS. For strong stimulation, the cluster-based permutation test revealed a significant difference (p cluster < 0.006) at 10 Hz, and the effect was maximally expressed in the posterior cingulate (Fig. 1C). The largest state-dependent tACS effects in the alpha range were in this region; that is, power increases caused by a state change (EC vs. EO) were additionally enhanced by tACS. The effect was only observed for power, and no significant interaction or change in PLV was found (Supplementary Fig. S2B, C).
At 30 Hz, the state-dependency contrast revealed a difference in power (p cluster < 0.002), most pronounced in the right superior frontal gyrus (Supplementary Fig. S2D). This online cross-frequency modulation related to EO/EC brain state was again driven by power resonance (Supplementary Fig. S2E), but not by intertrial PLV (Supplementary Fig. S2F). As in the case of alpha, we cannot assert anything about the sharp increase in frontal 30 Hz power and PLV in strong tACS relative to sham stimulation, because we cannot compare tACS conditions. No other tested frequency showed state-dependent effects.
As these previous analyses established a state-dependent modulation remote to regions showing the primary power change between EC and EO (i.e., posterior cingulate vs. occipital cortex), this implied differences in neural states between these two conditions to mediate this long-range effect. This is the issue pursued in the next sections.
Network-level changes between EC and EO
To expose differences in brain network states between EC and EO, which could potentially influence this novel state-dependent effect, we used graph theoretical analysis of the resting sham data. The whole-brain nonparametric statistic on local efficiency uncovered a cluster in the precuneus for the 10 Hz band, which showed a significant increase in EC relative to EO (p cluster < 0.004, Fig. 1D). Unlike the other frequency bands and the other graph measures, the effect was stable across a range of values for adjacency matrix thresholding, between 0.12 and 0.26 of absolute imaginary coherency, with a maximum effect at 0.18.
Effects mediating state dependency
As participants received different tACS strength, we examined the correlation between stimulation intensity and the normalized difference in power denoting state dependency. We found a correlation between individual intensity and the state-dependent effect (adjusted R 2 = 0.24, p = 0.027; Supplementary Fig. S3).
To characterize the relationship of the underlying pattern of connectivity with the state dependency, the source with maximum statistical value in the efficiency contrast (precuneus, Fig. 1D) was used as a seed to extract imaginary coherency to the region of the cortex with the state-dependent effect, the posterior cingulate (Fig. 1C). The partial correlation controlling for tACS intensity revealed that the connection strength between precuneus and posterior cingulate was a predictor of state dependency (Spearman rho = 0.53, p = 0.036; Fig. 2A). Still controlling for intensity but using EC/EO alpha power difference as the predicting variable (extracted from the source in the occipital cortex with the strongest contrast; Fig. 1B) showed no correlation with state dependency (Spearman rho = −0.25, p = 0.35; Fig. 2B).
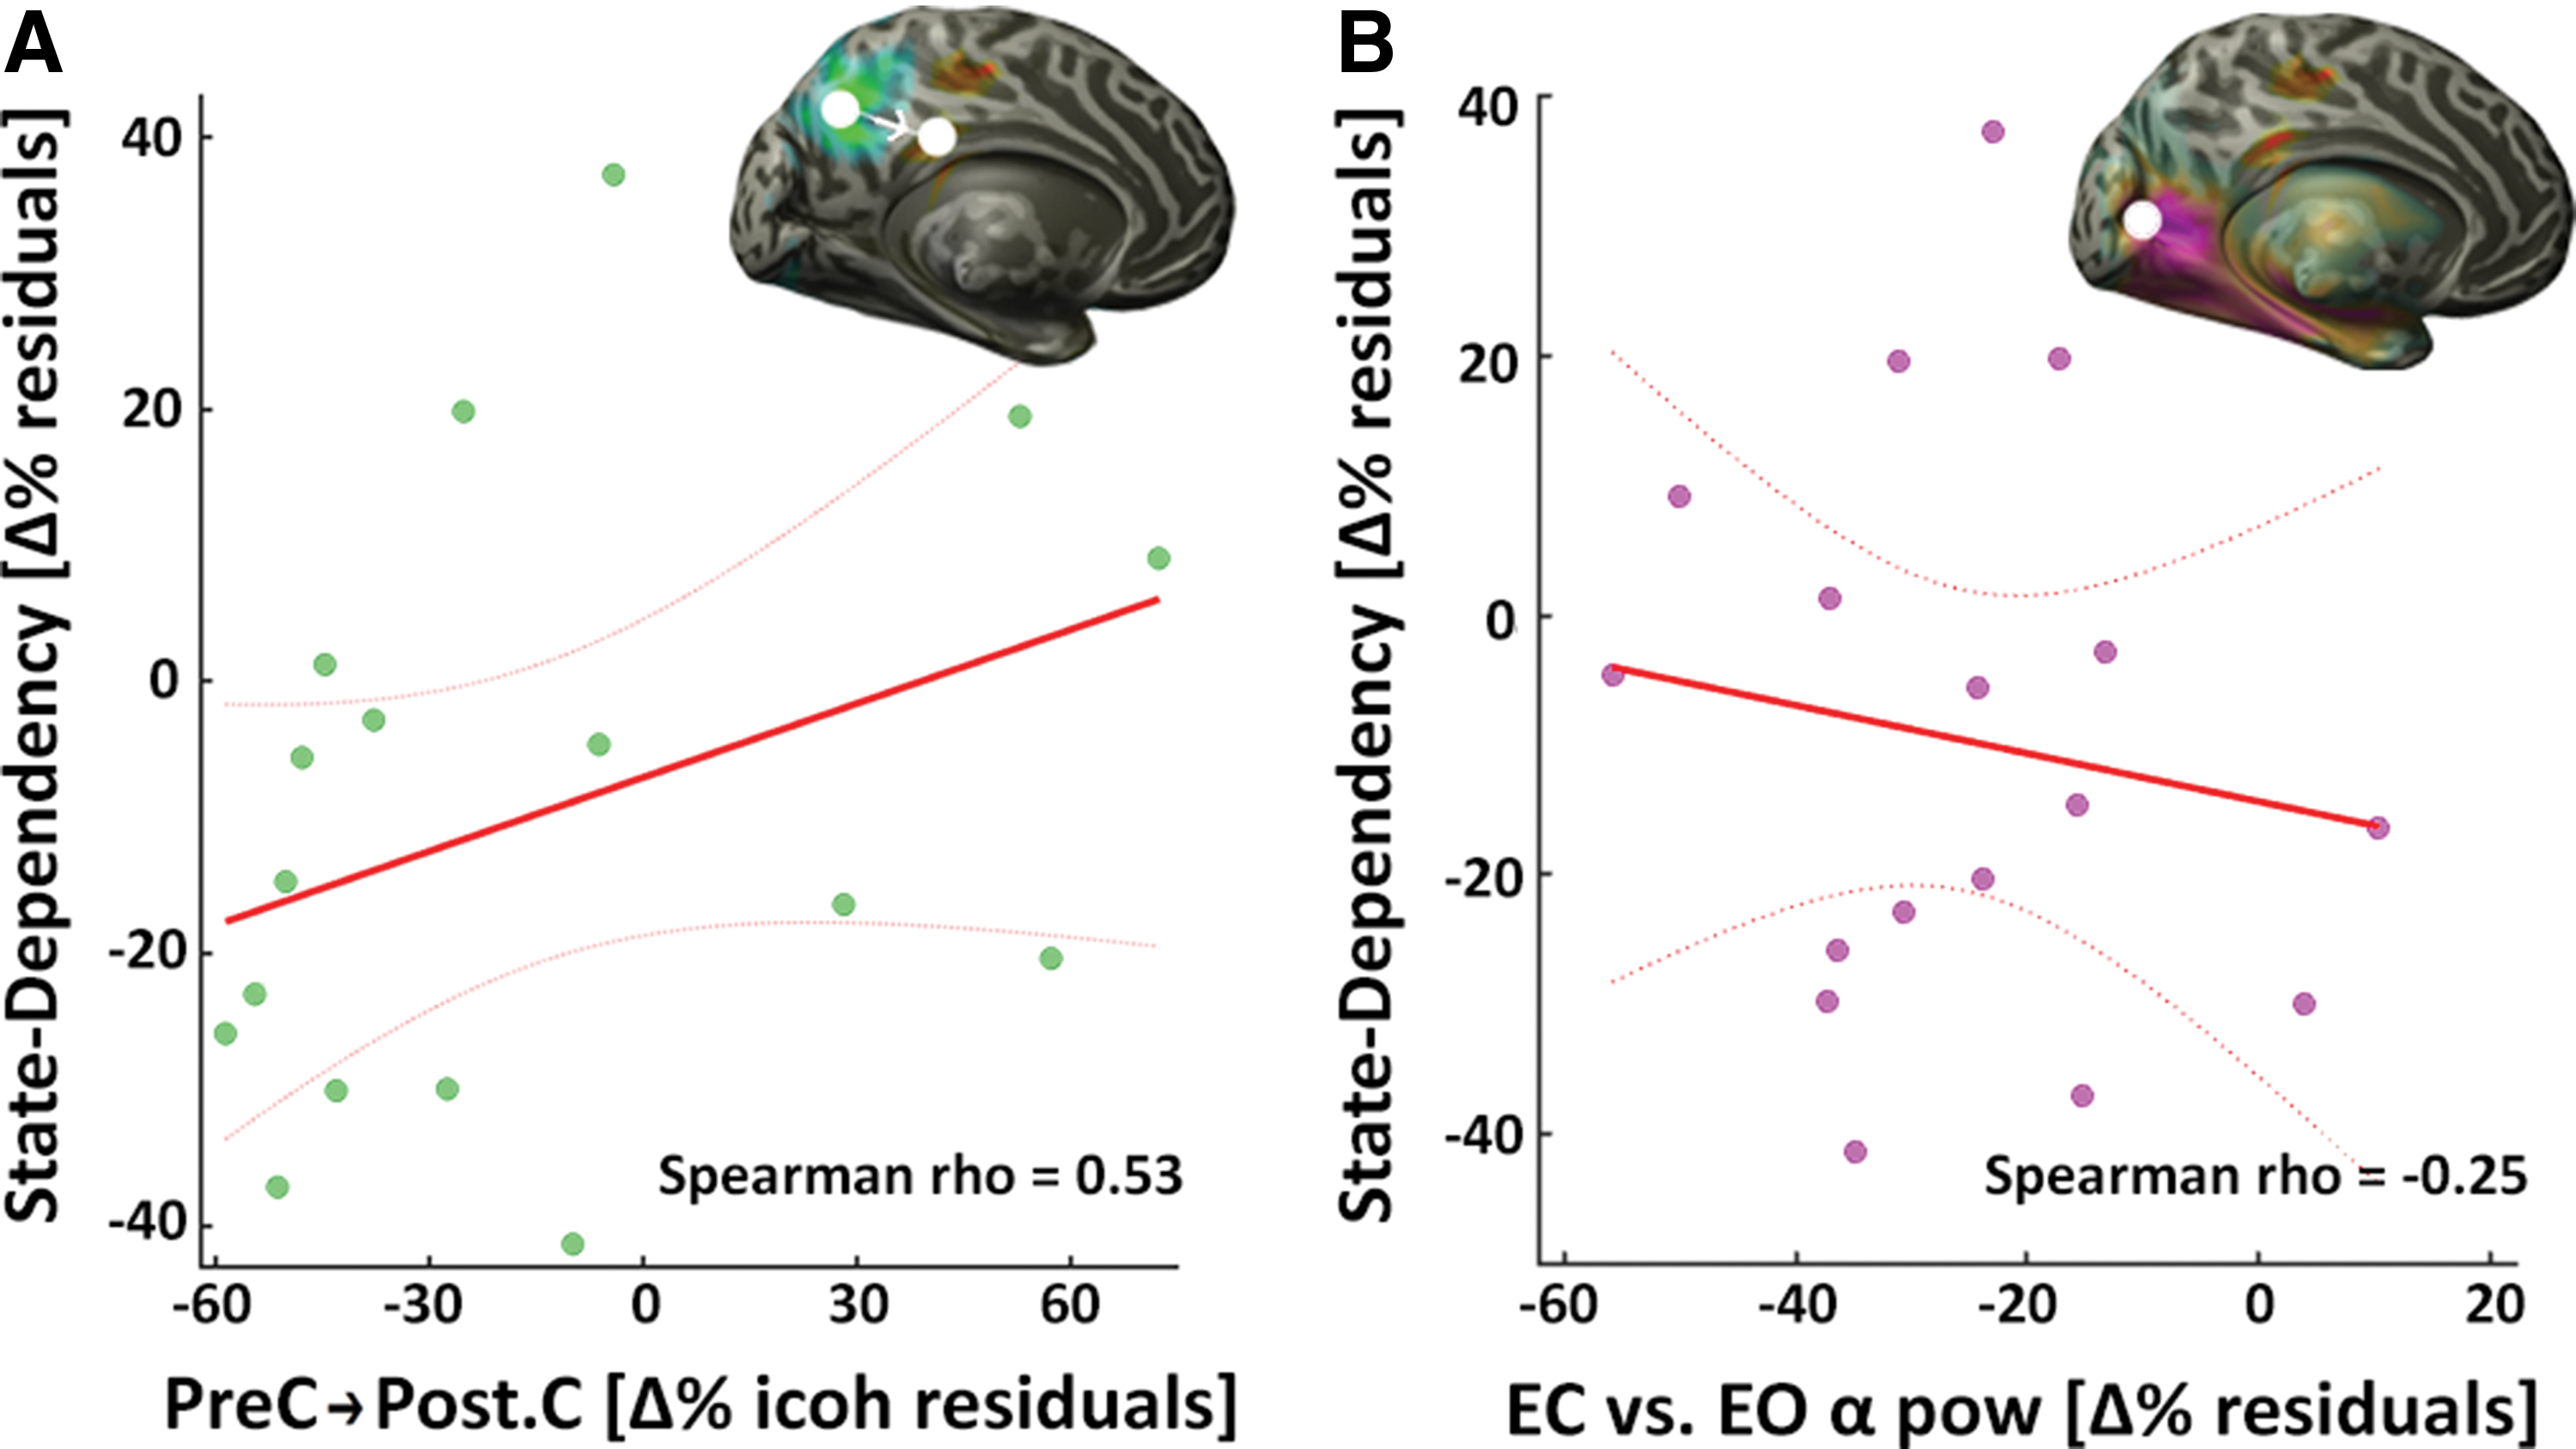
Partial correlations. Correlations and linear model fits to the individual state-dependency percentage changes. Dotted lines represent the 95% confidence intervals.
Discussion
State-dependent power effect of tACS
Our analyses uncovered online interactions of tACS with brain states at the alpha frequency. Power enhancements driven by the external stimulation interacted with endogenous alpha increases in the transition from EO to EC. The impact of tACS changed depending on the brain state: it was more pronounced during EC in the posterior cingulate (Fig. 1C), an area between the stimulation electrodes but where current flow is not at its peak (Fig. 1A, but see below). This is further proof for the specificity of tACS efficacy, which is seen in certain tasks, setups, and sensory modalities but not in others (Bikson and Rahman, 2013; Veniero et al., 2017). The posterior cingulate cortex was affected differently by the stimulation in different brain states, which raises questions concerning the consequences for resting networks, as well as for task-active cognition (Leech and Sharp, 2013).
It is uncertain whether state-dependent effects of tACS in primary target regions (occipitoparietal cortex) are actually absent. Alternatively, it might be that they are simply overshadowed by the dominant Eigen frequency increase in these regions following closing the eyes (Fig. 1B, seen also in off-line aftereffects in Helfrich et al., 2014b). That is, neural firing rate in occipital and parietal regions might still be influenced by tACS differently in the EC brain state with respect to EO, but if present, this effect is too small relative to the endogenous power modulation.
When contrasting induced alpha power for different tACS conditions, there were differences distributed across the whole brain (Fig. 1A). This is difficult to interpret, as the variance was probably also driven by the different beamformer filters obtained separately from different conditions. As the filters have to suppress the artifact in the strong tACS condition, their profile is very different from the ones during no stimulation. However, one can appreciate how the cluster reflects maximum current flow of tACS located between the electrodes, as it has been modeled (Neuling et al., 2012b). Even though there is no information on tissue density in our analysis, the effect in source reconstruction shows the current diffusion where the finite-element model predicts it.
The state-dependent effect of tACS at 30 Hz showed a frontal source distribution and again there was a higher increase in the induced power in the EC state (Supplementary Fig. S2D, E). Anatomically connected areas respond, even if not directly stimulated, usually in the range of the natural frequency of their local corticothalamic circuit, with frontal regions most sensitive to higher beta (Rosanova et al., 2009). Multiples of the stimulated frequency (harmonics) also have an effect on the brain (Neuling et al., 2017). The cluster in the right frontal pole showing a state-dependent interaction in the second harmonic (30 Hz) seems to be influenced by its preferred frequency. It is hard to declare what drives this modulation, be it EO/EC differential frontal activity (Barry et al., 2007), resting-state network connections from the posterior cingulate, excitability for the natural frequency of the region (Rosanova et al., 2009), or an interaction between these factors during stimulation. Thus, we refrained from investigating this further. Yet again, harmonics and their brain state dependencies are another variable to consider when applying tACS (see also Ruhnau et al., 2016a).
Effects of tACS not driven by phase locking
The interaction of tACS with EC seems to be driven only by power resonance, without a change in PLV (Supplementary Fig. S2B). The posterior topography of higher alpha in EC relative to EO, seen in all tACS conditions as clearly as during sham (Fig. 2B), was likewise not accompanied by phase alignment. This means that a strong continuous entrainment, in which endogenous oscillators align their phase and their frequency to the stimulation, is not seen alongside the power increase or the online state dependency of tACS. A trend of reduction in synchrony measured by PLV was present in the posterior cingulate, but not in the parieto-occipital areas.
As we have seen, the network profile changes in different states and so could the influence and spread of entrainment in different conditions. Many tACS studies show phasic modulation of behavior (e.g., Neuling et al., 2012a), which has been attributed to entrainment. State-dependent stimulation-driven phase alignment can be seen after trial averaging (Ruhnau et al., 2016b). Conversely, in another online tACS study, effects on PLV (same formula used in this study) are missing, if not even dampened, at the simulation frequency (Ruhnau et al., 2016a), even though in that paradigm there were several oscillators driven at the same time.
Alternatively, there is some debate on whether entrainment is really the mechanism behind tACS effects (Vossen et al., 2014). Rather than an instantaneous synchronization of endogenous oscillators, tACS has been proposed to be altering synaptic strength, as its mechanism of action to modify brain frequencies (Vossen et al., 2014). Whether intertrial phase coherence is related to entrainment or not, it is not associated to the increase in source power, especially in this tACS setup (Neuling et al., 2013). If a subneural ensemble is entrained, it is not large enough to be the dominant pattern in intertrial PLV, but there is yet no strong support on the current situation at this level. Effects of tACS related to phase are furthermore not seen in recordings with implanted electrodes (Opitz et al., 2016; Lafon et al., 2017; but see Noury et al., 2017, also for a reproach on phase estimates in deep-brain recordings).
It needs to be clear that tACS in some individual conditions leads to an increase in phase alignment, potentially indicating entrainment (selectively for EO, similarly to Ruhnau et al., 2016b; Supplementary Fig. S1C); however, since tACS and sham conditions were based on different filters as mentioned above, this needs to be interpreted with caution. Furthermore, our main focus is on the state dependency of tACS, which doesn't seem to be mitigated by phase alignment in the regions most strongly affected.
Brain connectivity behind state dependency
Functional connectivity fluctuates continuously, but it varies mostly when the brain changes its mode of functioning. This happens during changes between different tasks or in the diverse repertoire of states like vigilance or attention. Even a simple change like closing the eyes creates profound reorganizations of brain activity. In this case, parietal cortices exhibit modifications in their oscillatory balance, especially in the low frequency bands, closely accompanied by changes in connectivity in the same frequencies. In the alpha frequency, the most stable change seems to be the integration of the parietal cortex with the rest of the brain, which increases when eyes are closed (Fig. 1D). It is reasonable to assume that the variation in connectivity from this region to the rest of the brain is bound to influence other processes that ride on these functional connections (Ruhnau et al., 2014), such as activity modulations caused by tACS.
Reasonably, it appears that tACS influence dependent on the ongoing brain state is mostly driven by the intensity of the electrical stimulation (Supplementary Fig. S3). On top of that, regional variation in the system's connectivity is related to the amount of this state dependency. Namely, the connection strength increase to this region is followed by a better integration and efficiency (Fig. 2A). Regional alpha power modulations as commonly seen during EC versus EO, however, do not seem to mediate this state-dependent effect of tACS (Fig. 2B).
Since functional connectivity indicates electrical information flow among brain areas, it would be evocative to think that it also controls the flow of tACS. The current flow at the neuronal scale should be the same across conditions (Fig. 1A), yet changes in functional connections during different brain states might guide the impact of tACS distinctively. In other words, connectivity controls and follows patterns of inhibition and excitation in oscillatory activity, so it is likely to interact with tACS. Our data are the first to provide evidence for this notion, as they reveal tACS-mediated activity in cortical regions distinct from the maximum induced current.
Conclusion
Although there is some convincing evidence on the reliability of tACS and its impact on behavior, its direct influence on brain processes is unknown. The main message of this study is that the online effects of tACS in the parenchyma are also defined by functional factors. Oscillatory activity and connectivity are interwoven, which enables tACS to affect regions that are connected to—but clearly spatially separated from—the focal stimulated zone. As we have seen, a modulation of the functional network architecture by a simple behavioral manipulation has a profound impact on tACS effects. Our analyses confirm that state-dependent tACS efficacy is not due to changes in power but in network reorganization. This finding yields important confirmation that it is connectedness that matters in determining whether activity in a region will affect downstream areas (Ruhnau et al., 2014). As modeling and predicting effects become more complex, this should have profound implications for the use of tACS in cognitive and clinical neuroscience, that is, one should be wary when treating patients based on results obtained in controls.
Researchers need to control as many variables as possible in a neurostimulatory experiment, in which varying a single parameter can reverse its effect (Moliadze et al., 2012; Veniero et al., 2017). Alternate current stimulation is alluring: if it can manipulate physiological frequencies directly, then we can assess whether oscillatory activity actually plays a causal role in cognition and behavior. However, the state dependency of tACS effects, as well as their nonlinearity, makes these current causality assumptions naive and likely inadequate. It is unwarranted to assume a linear mapping between external perturbations and internal brain activity, and neurostimulation paradigms should be approached with a perspective as informed as possible (for a review see Romei et al., 2016). Thus, it is important to take this into account, both for researchers, applying tasks with distinctive activity and connectivity profiles, and for clinicians, who often have to deal with brain systems that have altered network organizations.
Footnotes
Acknowledgments
This project was supported by the European Research Council (ERC StG 283404). The authors thank Dr. Elie El Rassi and Dr. Benjamin Timberlake for comments on an earlier version of the article.
Author Disclosure Statement
No competing financial interests exist.
References
Supplementary Material
Please find the following supplemental material available below.
For Open Access articles published under a Creative Commons License, all supplemental material carries the same license as the article it is associated with.
For non-Open Access articles published, all supplemental material carries a non-exclusive license, and permission requests for re-use of supplemental material or any part of supplemental material shall be sent directly to the copyright owner as specified in the copyright notice associated with the article.