
Abstract
Chemotherapy for testicular cancer (TC) has been associated with neurotoxic effects shortly post-treatment. Late effects of chemotherapy on brain function in this patient group are still unknown. In this study, we investigated differences between patients with and without chemotherapy in functional brain networks at rest and during an affective processing functional magnetic resonance imaging (fMRI) task on average >14 years post-treatment. In addition, we report on changes in cognitive functioning during survivorship by comparing present and previous performance on a neuropsychological test battery on average 11 years earlier (3 years post-treatment). Twenty-eight chemotherapy (43.1 ± 7.5 years) and 23 surgery-only (48.2 ± 9.5 years) TC survivors were examined using neurocognitive tests and 3T-fMRI >10 years after treatment end. Brain functional networks were identified using dual regression independent component analysis. Task fMRI was analyzed using a block design. Standardized domain change scores were calculated for each individual to assess cognitive change. TC patients in the chemotherapy group showed functional hyperconnectivity at rest in the precuneus network, sensory and motor function network, executive control network, and the ventral stream network when compared with surgery-only patients. Furthermore, hypoactivation was found when performing the affective processing task. Cognitive data revealed that both groups showed comparable patterns of change from 3 to 14 years after initial treatment. This study provides novel insights on the possible underlying neurobiological mechanisms of late neurotoxic effects of cisplatin-based chemotherapy. Present findings reveal that functional hyperconnectivity is widespread, possibly to compensate for the pathophysiological disturbances. This concurs with our previous findings of structural hyperconnectivity in white matter. Longitudinal multimodal imaging studies are warranted to further investigate the association between long-term structural and functional network connectivity data, as well as its relationship with cognitive changes.
Introduction
The outcomes for many patients with noncentral nervous system (CNS) cancers have improved markedly, which is often due to the effectiveness of chemotherapy. However, several studies show that up to 20 years after being treated, patients exhibit lower cognitive functioning, which is accompanied by changes in brain structure and function (de Ruiter et al., 2011, 2012; Koppelmans et al., 2014; Pomykala et al., 2013; Stouten-Kemperman et al., 2015a) and is most prominent after exposure to chemotherapy (Ahles et al., 2012; Joly et al., 2015; Wefel et al., 2015).
So far, most studies on the cognitive sequelae of chemotherapy have been conducted in breast cancer survivors, although lower cognitive functioning in other non-CNS cancers, such as testicular cancer (TC), has received increased attention. However, this has only been investigated in a small number of studies (Amidi et al., 2015b; Amidi et al., 2017a,b; Pedersen et al., 2009; Schagen et al., 2008; Stouten-Kemperman, 2015b; Wefel et al., 2008), while TC is the most prevalent cancer among young men (15–35 years). Its treatment is highly effective, with 5-year survival rates of >95% (Travis et al., 2010). Fortunately, many patients are therefore able to successfully return to an active working and social life.
Cisplatin-based chemotherapy, the cornerstone of combination chemotherapy in the treatment of TC, is associated with neurotoxicity (Eiseman et al., 2015; Sprauten et al., 2012; Zhou et al., 2016). Moreover, platinum in blood plasma can be detected up to 20 years after administration (Gietema et al., 2000). Cisplatin can have detrimental effects on hippocampal dendrites, neurons, and cell proliferation (Andres et al., 2014; Manohar et al., 2014).
The hippocampus is strongly interconnected with the amygdala (Hamann et al., 1999; Pitkänen et al., 2000), which is involved in affective processes such as fear recognition and aversive conditioning (Fine and Blair, 2000; Hariri, 2011; Killgore et al., 2000). It is arguable that cisplatin-related damage to hippocampal cells could lead to alterations to the amygdala, which in turn could lead to deficits in affective processing. Up until now, this has not been examined.
We still do not know much about the long-term effects of CT in TC patients. Only five of the previous neurocognitive studies in TC patients, including our own previous work, specifically focused on long-term effects (2–7 years post-treatment), showing mixed results (Amidi et al., 2015b; Amidi et al., 2017a,b; Pedersen et al., 2009; Stouten-Kemperman et al., 2015b).
Our previous cross-sectional work in the same patient group showed a difference in global white matter microstructure as measured with diffusion kurtosis imaging and lower cognitive functioning in TC 14 years post-CT compared with patients who only received surgery (Stouten-Kemperman et al., 2015b). Other than that, only two studies have been published up until now investigating the underlying neurobiological substrates of cognitive dysfunction in TC patients.
In a magnetic resonance imaging (MRI) study of Amidi and coworkers (2017a,b), TC patients undergoing CT were examined after surgery but before further treatment, and again 3 months after CT. Voxel-based morphometry revealed gray matter reductions in the prefrontal region, associated with poorer overall cognitive performance (Amidi et al., 2017a). However, this study also showed widespread reductions in gray matter in TC patients who did not receive CT. According to the researchers, this could partially be an effect of postorchiectomy-lowered testosterone levels, yet this finding requires confirmation in future studies.
In the second publication on the same patient sample, disrupted brain structural networks were reported based on diffusion tensor imaging data using graph theory. Three months after finishing CT, the efficiency of exchanging information across the entire network, as well as local efficiency and small-worldness, was decreased, the latter being related to poorer overall cognitive performance.
Studies on resting-state functional MRI (rs-fMRI) and task-fMRI in TC patients have not been published. Rs-fMRI can be used to study the intrinsic connectivity of brain networks in task-free settings by mapping temporally synchronous, spatially distributed, spontaneous low-frequency (<0.08 Hz) blood oxygen-level-dependent (BOLD) signal fluctuations (Fox and Raichle, 2007). Previous studies investigating rs-fMRI in various groups of patients with non-CNS cancer report that various networks involved in cognitive functioning appear to be vulnerable to the effects of CT (Bromis et al., 2017; Bruno et al., 2012; Cheng et al., 2017; Dumas et al., 2013; Kesler and Blayney, 2015; Kesler et al., 2013, 2014; Kim et al., 2017; Miao et al., 2016a,b; Mo et al., 2017; Piccirillo et al., 2015; Simó et al., 2017; Tao et al., 2017; Wang et al., 2016; Xuan et al., 2017).
The present study adds to existing literature by examining the late effects of CT on brain function in TC patients. Rs-fMRI was used to investigate group differences in functional networks at rest on average 14 years post-treatment. Furthermore, a facial expression fMRI task was used to investigate affective processing, possibly affected by neurotoxic effects of CT on the amygdala, and hair cortisol levels were determined to assess long-term stress. In addition, we report on changes in cognitive functioning during survivorship, by using longitudinal cognitive data of TC patients.
Materials and Methods
Participants
All TC survivors were recruited at the Netherlands Cancer Institute. Written informed consent was obtained from all participants. The Review Board of the Netherlands Cancer Institute approved the study and this research was completed in accordance with the Helsinki Declaration.
The study population consisted of two groups of patients with TC (either seminoma or nonseminoma): one group of TC patients who received chemotherapy after surgery (CT), and one group of TC patients who received surgery only (S). All patients were unilaterally orchidectomized and in the CT group this was followed by three or four courses of BEP chemotherapy (bleomycin 30 mg/m2; etoposide 100 mg/m2; cisplatin 20 mg/m2).
Participants had to fulfill the following inclusion criteria: previous participation in our neuropsychological study, no presence of metastatic disease or relapse, no history of neurological or psychiatric conditions, sufficient command of the Dutch language, and eligibility to undergo the MRI scanning session. The total sample consisted of 28 CT and 23 surgery only TC survivors. More detailed information on subject attrition can be found in our previous study that reports on cross-sectional cognitive data (14 years post-treatment) and brain structure (Stouten-Kemperman et al., 2015b).
Assessment procedures
Multimodal MRI data were obtained on average 14 years after initial therapy at a 3.0-T Ingenia MRI scanner (Philips Medical Systems, Best, The Netherlands) with a dStream SENSE 32-channel receiver head-spine coil. A magnetization prepared rapid gradient echo (TR = 7000 ms, TE = 3200 ms, FOV = 256 × 240 mm, FA = 9°, 180 × 1.0-mm-thick sagittal slices, in-plane resolution of 1 mm2) scan was acquired for registration purposes. For BOLD analyses, a fast single shot echo planar image (EPI) was obtained with the following imaging parameters: TR/TE 2150/27 ms; FOV 240 × 240 mm; 48 slices; voxel size 2.5 × 2.5 × 2.7 mm, SENSE factor 2.0. We acquired 130 volumes for rs-fMRI and 60 volumes for task fMRI. For the rs-fMRI, subjects were instructed to lie still with their eyes closed and not to fall asleep.
For the affective processing task, we used an Emotional Face Matching Task (EFMT), an adapted version of the task used by Hariri et al. (2002). This paradigm consisted of five experimental blocks: two blocks each of an emotional (matching faces) condition interleaved with three control blocks. Each block consisted of six trials, resulting in 30-sec blocks, for a total scan length of 2:30 min. The emotional stimuli consisted of angry and fearful faces, whereas the neutral stimuli consisted of ellipses assembled from scrambled faces.
For each emotional trial, three stimuli were presented simultaneously, and subjects had to decide which one of the lower two stimuli expressed the same emotion as the target stimuli presented above. Similarly, for each neutral trial, three stimuli were presented, but subjects had to decide which of the bottom two ellipses was identically oriented to the target ellipse. This task is specifically designed as an “amygdala localizer” and very easy to perform. Performance is therefore typically (nearly) at ceiling.
To objectively assess long-term stress, hair cortisol levels were collected at the same time as the fMRI data and analyzed by the Department of Biopsychology of the Technische Universität Dresden. Cortisol levels were determined in segments of 2 cm, representing the 2-month period before the assessment. Wash and steroid extraction procedures as described in Kirschbaum et al. (2009) were followed.
Eight neurocognitive tests were used to assess verbal memory (Dutch version of the California Verbal Learning Test [CVLT]) and visual memory (Visual Reproduction Test of the WMS-R); attention (Flanker Test); executive functioning (Trail Making Test card B, Word Fluency Test); motor speed (Fepsy Finger Tapping Test); and processing speed (Digit Symbol of the WAIS-III, Trail Making Test card A) (Stouten-Kemperman et al., 2015b).
Statistical analyses
FMRI analyses
Preprocessing of rs-fMRI data was carried out using FEAT version 6.0, part of FSL version 5.08 (Smith et al., 2004). Anatomical and resting state images were brain extracted, motion corrected, and spatially smoothed using a 5-mm full-width at half-maximum (FWHM) Gaussian kernel, and high-pass filtering at 0.01 Hz. After preprocessing, rs-fMRI volumes were registered to the subject's high-resolution T1 and subsequently warped to standard space (Montreal Neurologic Institute [MNI] 152). Then, data of all subjects were temporally concatenated and decomposed into a single four-dimensional file containing all the independent components (group independent component analysis [ICA]).
Components of interest were selected by visual inspection based on previous literature (Beckmann et al., 2005; Damoiseaux and Greicius, 2009). The group spatial maps were regressed into each subject's individual time courses and subsequently these time courses were regressed into subject-specific spatial maps (dual regression) (Filippini et al., 2009). Nonparametric permutation tests (500 permutations and corrected for multiple comparisons at a cluster-level threshold p < 0.05) were performed on each component to detect statistically significant differences between the CT and S group, correcting for age (Nichols and Holmes, 2002).
To examine associations between rs-fMRI networks and previously reported diffusion kurtosis imaging (DKI) measures (Stouten-Kemperman et al., 2015b), we extracted mean intensity values from regions from the rs-fMRI networks that significantly differed in the CT versus S group and correlated these with mean DKI values across white matter. As reported previously, these were significantly higher in the CT versus S group.
Task-fMRI data were processed and analyzed using SPM8 (Statistical Parametric Mapping; Wellcome Department of Cognitive Neurology, London, United Kingdom). After manual reorientation to the anterior commissure, ArtRepair was used to detect and repair artifacts (Mazaika et al., 2009). Subsequently, images were realigned to the first volume. Individual high-resolution T1 scans were segmented based on gray matter, white matter, and cerebrospinal fluid, and coregistered EPI and T1 scans were normalized to the MNI T1 template based on previous segmentation parameters. Finally, images were spatially smoothed using a 5-mm FWHM Gaussian kernel. The contrast studied was face matching greater than control.
All task-fMRI group differences were analyzed with ANOVA with age as covariate, and were regarded significant at p < 0.001 and masked with the main effect across groups at p < 0.05 to reduce the search volume to those voxels showing a main effect of task with a cluster size threshold of 10 voxels. A region of interest (ROI) analysis was performed by extracting mean BOLD activation in the bilateral amygdala with the MarsBaR toolbox (Brett et al., 2002) using a mask of the bilateral amygdala as defined by the Automated Anatomical Labeling atlas (Tzourio-Mazoyer et al., 2002).
Due to scanner hardware problems, rs-fMRI data and task-fMRI data were not available for three patients in the CT group and one patient in the S group.
Cognitive data
Cognitive performance was evaluated by comparing test performance on six domains assessed in the present study (on the same day that the MRI scans were acquired) with that of test performance assessed in a prior study by our group that took place on average 3 years after treatment (i.e., on average 11 years before the present study) (Schagen et al., 2006). Standardized z-scores were calculated using the raw M1 scores of the S group as a reference. Domain scores at 3 years post-treatment (M1) were subtracted from the domain scores of the present assessment 14 years post-treatment (M2), and between-group differences in domain change scores were tested with an ANOVA, including IQ and age as covariates. For these calculations, IBM SPSS Statistics 20 (IBM, Armonk, NY) was used.
Results
Demographic and clinical data
Patient characteristics are presented in Table 1. No significant differences were found between groups on estimated premorbid IQ and time since treatment. However, the CT group was significantly younger than the S group [t(49) = −2.16, p = 0.04].
Characteristics of Study Population and Results of Cognitive Assessment
Values indicate mean (SD) unless specified otherwise.
p < 0.05. Positive change scores indicate improvement, negative change scores indicate decline.
CT, BEP chemotherapy; S, surgery only; Sem, seminoma; nonsem, nonseminoma.
Rs-FMRI
Network identification
The group ICA estimated 27 components. Based on their spatial patterns and on previous literature (Beckmann et al., 2005; Damoiseaux and Greicius, 2009; Veer, 2010), 11 components were found to represent functional resting-state networks (RSNs). The remaining 16 components reflected artifacts such as movement and physiological noise. Figure 1 shows an overview of the functional RSNs, consisting of precuneus (a), visual areas (b and c), sensory and motor function (d), auditory function (e), default mode network (f), frontal and executive control networks (g–j), and the ventral stream (k).
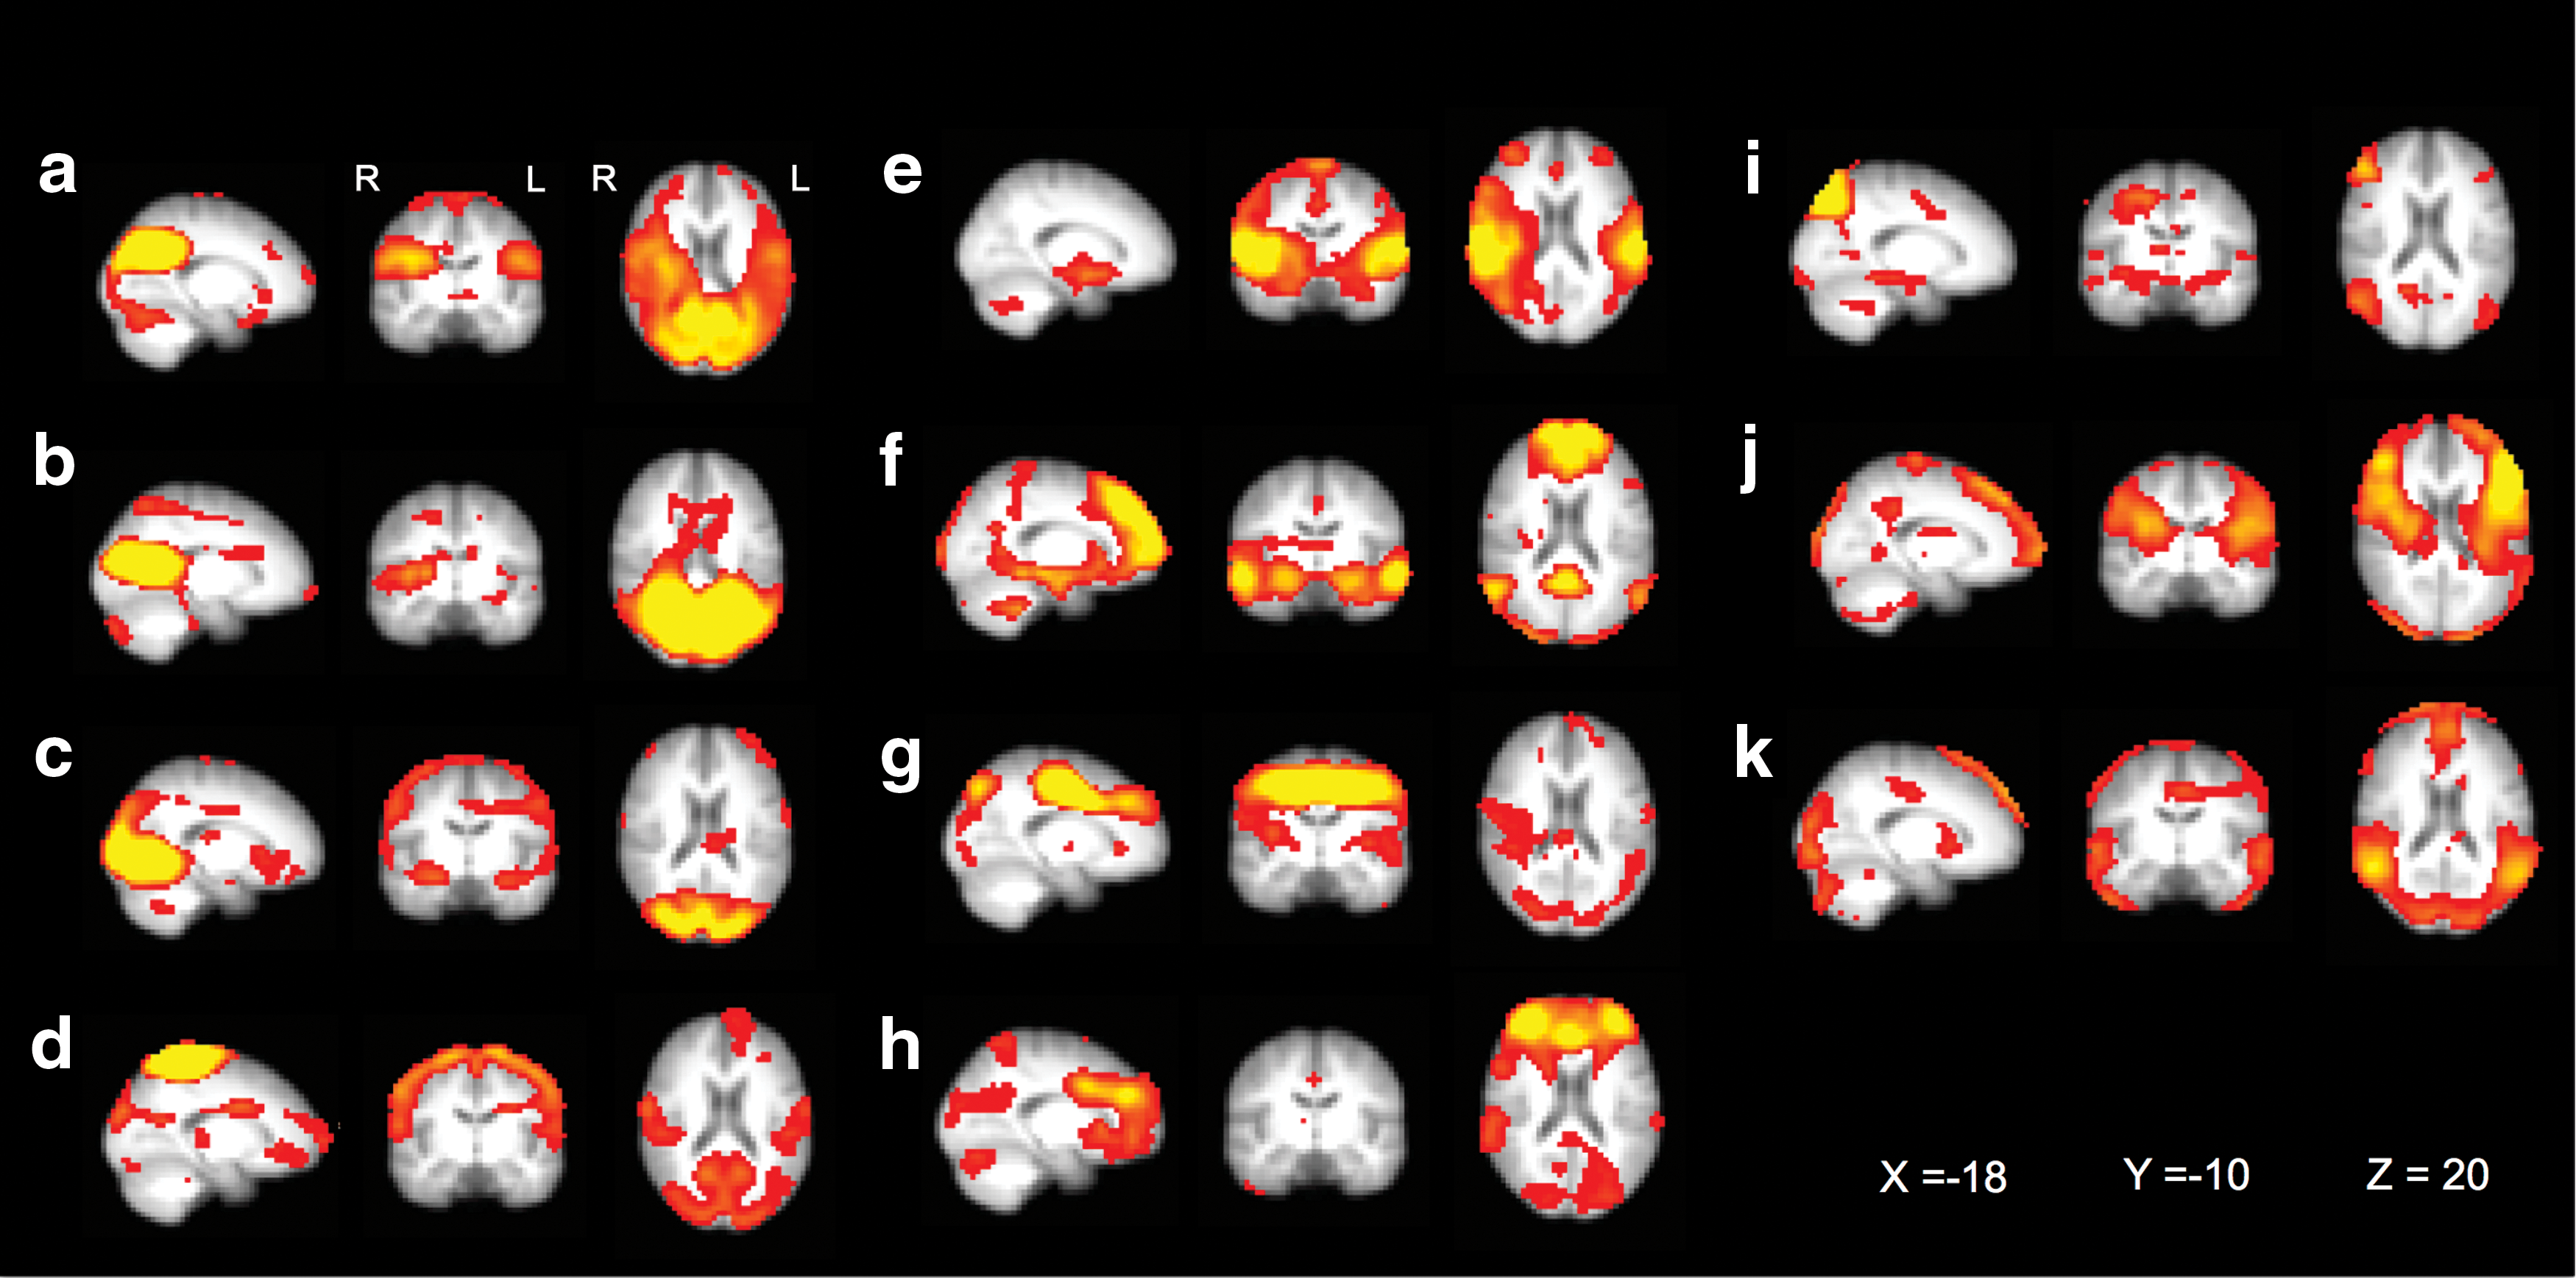
Group ICA of resting-state networks. Eleven functionally relevant resting-state networks were identified in both CT and S patients, consisting of precuneus
Functional connectivity
In 4 of 11 RSNs, statistically significant hyperconnectivity of the CT group relative to the S group was observed (Fig. 2). In the precuneus network (a), hyperconnectivity was found in frontal regions, parahippocampal gyrus, and left amygdala. In the sensory and motor function network (d), multiple regions of hyperconnectivity were found in prefrontal cortex, occipital cortex, and bilateral supramarginal gyrus. Within the executive control network (i), two regions of hyperconnectivity were found: the middle temporal gyrus and frontal region. Finally, three regions with hyperconnectivity were identified in the ventral stream network (k), two in the occipital area and one in the middle temporal gyrus.
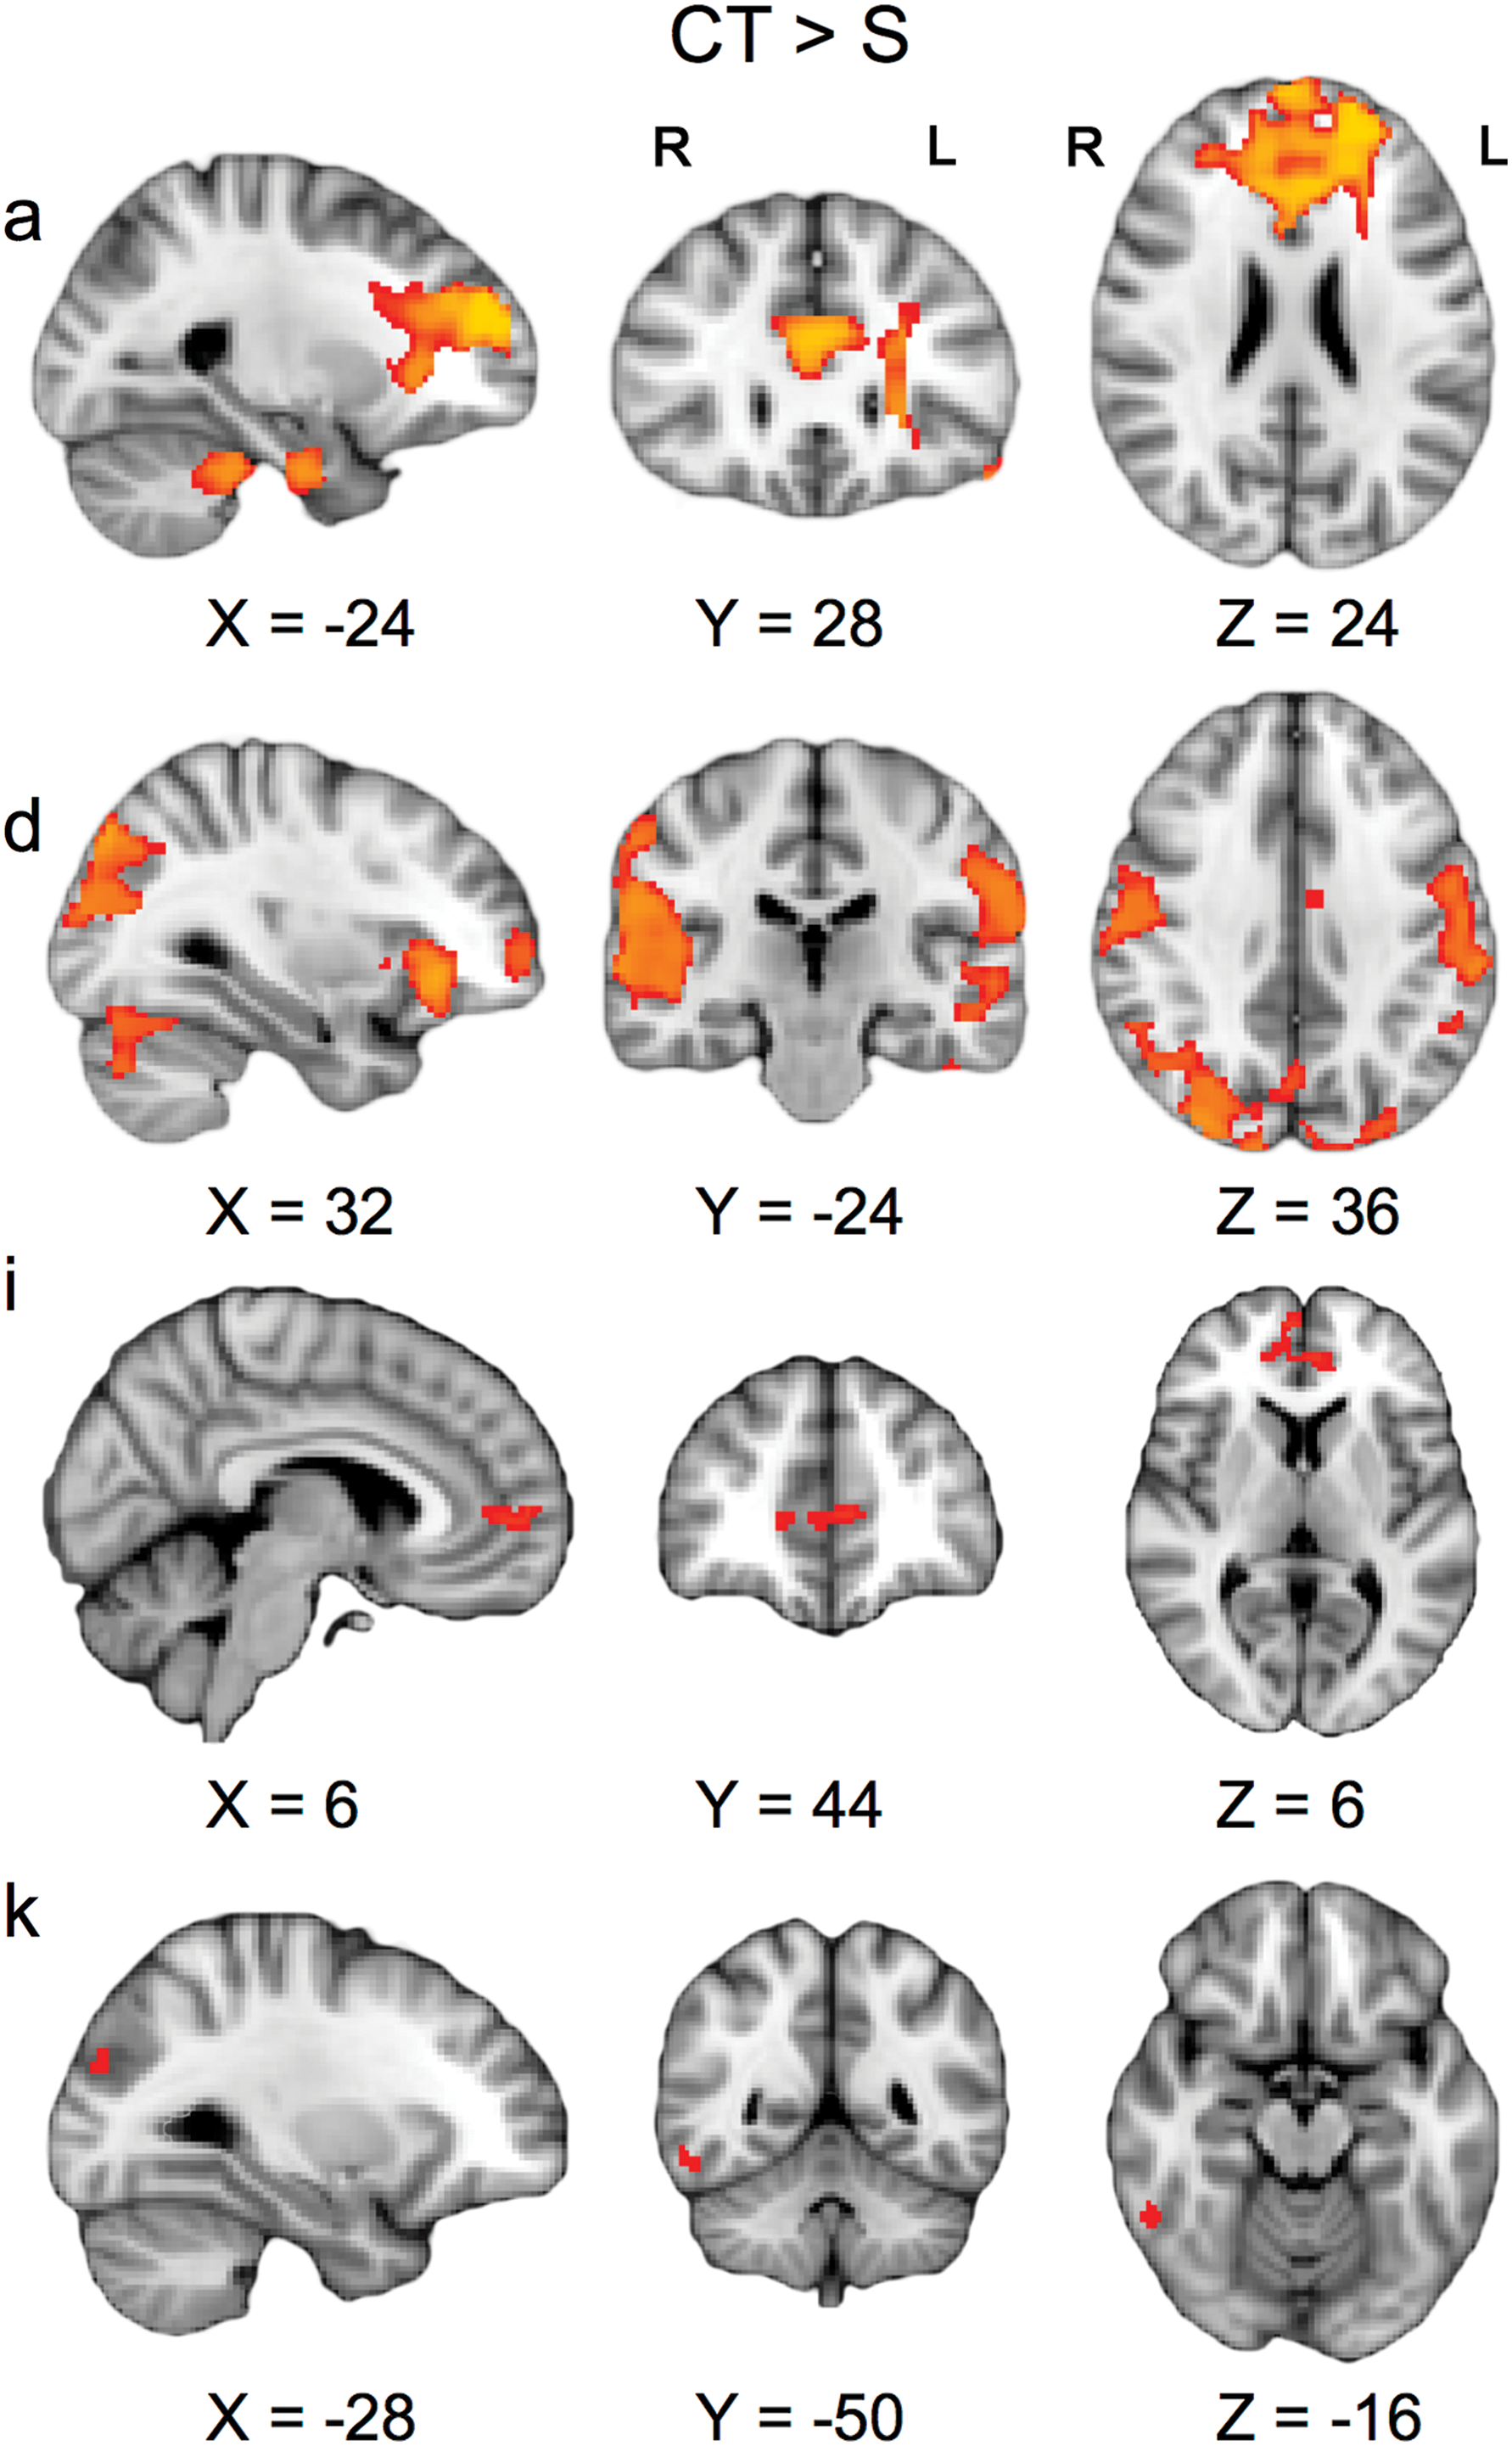
Between-group differences in resting-state networks. Lettering corresponds to the networks depicted in Figure 2; precuneus network
We did not find significant correlations between regions of the RSN that showed hyperconnectivity in the CT versus S group on the one hand and elevated DKI values in the CT group on the other hand.
Task fMRI: EFMT
Across groups, the fMRI results showed a significant main task effect for the matching faces versus control contrast in bilateral fusiform gyrus, bilateral amygdala, and bilateral prefrontal cortex (Fig. 3). The CT versus S comparison revealed hypoactivation in the CT group in bilateral fusiform gyrus, left middle temporal gyrus, right inferior occipital gyrus, medial orbitofrontal gyrus, and right cerebellum (Table 2 and Fig. 3). No significant differences were found between groups in mean task activation of left (p = 0.89) and right amygdala (p = 0.46) ROIs (Table 3).

fMRI BOLD activations for the Emotional Face Matching Task. Top panel: Red areas indicate task effect across groups. Blue areas indicate ROIs of the bilateral amygdala (p < 0.05, corrected for multiple comparisons). Bottom panel: Red areas indicate hypoactivation for the CT group compared with the S-only group. p < 0.05. BOLD, blood oxygen-level-dependent; ROIs, regions of interest. fMRI, functional magnetic resonance imaging. Color images available online at
Functional Magnetic Resonance Imaging Between-Group Analyses for the Emotional Face Matching Task
EFMT, Emotional Face Matching Task; MNI, Montreal Neurologic Institute.
Functional Magnetic Resonance Imaging Mean Blood Oxygen-Level-Dependent Activations of Region of Interest Analyses for the Emotional Face Matching Task
Values indicate mean (SD).
ROI, region of interest.
Cognitive test performance and cortisol data
Data on cognitive test performance and cortisol are presented in Table 1. No significant differences were observed between groups on the perceived stress questionnaire. Furthermore, cortisol concentrations were not significantly different between groups on the hair segments representing the previous 2 months before the assessment, both groups showing average cortisol values in the normal range. Also, no significant differences were found between the groups in cognitive change scores across the different domains. There was no significant relationship between cognitive change scores and cortisol concentrations (p > 0.1).
Discussion
In the present study, we found differences in brain function between TC patients treated with chemotherapy or surgery only on average 14 years after initial treatment. We observed hyperconnectivity in TC survivors after CT in the precuneus and ventral stream network, areas involved in affective processing and a diverse array of highly integrated tasks such as awareness and conscious information processing and self-related processing (Cavanna and Trimble, 2006; Veer, 2010). Furthermore, we found hyperconnectivity in areas involved in motor function and control of attention and working memory. This corresponds with previously reported chemobrain literature, indicating the most common domains of cognition affected by CT to be learning and memory, processing speed, and executive function.
Several rs-fMRI studies in patients with non-CNS cancer have reported alterations in network connectivity after chemotherapy. Till now, patterns of hyperconnectivity have mainly been found shortly (up to several months) after chemotherapy in various types of non-CNS cancer (lung, breast, and gastric cancer) (Cheng et al., 2017; Kim et al., 2017; Simó et al., 2017; Wang et al., 2016; Xuan et al., 2017). In addition, studies outside the field of oncology found functional hyperconnectivity, for example, in Parkinson's disease, multiple sclerosis, and mild traumatic brain injury (Hillary and Grafman, 2017; Hillary et al., 2015). A common interpretation is that after brain injury, the brain tends to hyperactivate to compensate for the pathophysiological disturbances (Iraji et al., 2016).
This is compatible with our previously reported higher kurtosis parameters in brain white matter in the present sample of TC patients, which could also be indicative of structural “hyperconnectivity” as a recovery mechanism after initial brain injury (Stouten-Kemperman et al., 2015b). Furthermore, higher kurtosis parameters were found in tracts that connect frontal areas to parietal areas and temporal lobe (superior longitudinal fasciculus), and tracts involving the motor pathway (corona radiata). Rs-fMRI and DKI measures were not significantly correlated, however. Alternatively, the functional and structural hyperconnectivity might reflect abnormalities in gray and white matter tissue due to neurotoxicity of chemotherapy. In this view, hyperconnectivity might reflect a maladaptive rather than a compensatory mechanism. Our task fMRI findings seem to be more in favor of the latter explanation.
Our task fMRI data demonstrate hypoactivation in the CT group of brain areas that are involved in processing of facial expression (e.g., fusiform gyrus), although looking at the amygdala specifically, no difference in activation was observed. Conversely, rs-fMRI data showed hyperconnectivity in amygdala areas in the CT group, as well as in areas that are involved in attention, sensorimotor function, and executive control. This suggests that CT patients are less able to recruit necessary brain regions to perform the task, possibly due to reduced neural functioning in these areas.
A consistent pattern of hypoactivation has often been found in earlier cross-sectional studies in breast cancer patients (de Ruiter and Schagen, 2013). It has been shown that networks derived from rs-fMRI are highly similar to the networks found in task activation studies. This implies that the resting brain's functional dynamics fully utilizes the set of functional networks involved in a wide range of cognitive functions (Smith et al., 2009). The fact that hyperconnectivity of “affective” brain networks, including the amygdala, does not translate into hyperactivation of this network during an affective task might indicate that the hyperconnectivity is maladaptive and nonfunctional.
The combination of these structural and functional connectivity findings indicates a possible underlying neurobiological mechanism for the widespread yet subtle lower cognitive performance that we previously observed in these same TC patients treated with CT, compared with the patients who received surgery only (Stouten-Kemperman et al., 2015b) and that has also been reported by others (Amidi et al., 2015a,b; Amidi et al., 2017a; Schagen et al., 2008; Wefel et al., 2011).
The present longitudinal analyses of cognitive data revealed that both groups showed comparable patterns of change from 3 to 14 years after initial treatment. This seeming inconsistency between the cognitive results of our cross-sectional cognitive analyses, and the present data on changes over time, could be explained by different methods that we used to quantify impairment and change. Furthermore, it could be explained by some differences between these studies in terms of test selection and the sensitivity of the different tests.
We did not find any differences in cortisol levels between the two groups. Furthermore, cortisol levels fell within the range of normal values of control groups in other published studies (Dettenborn et al, 2010; Stalder et al., 2010). While Amidi and colleagues (2015a) showed that cortisol could be a potential predictor of neuropsychological performance in TC patients before CT, the present study demonstrates that long after CT, cortisol values have returned to normal values and were not related to cognitive decline.
The patient groups enrolled in this study were highly comparable in terms of tumor type and health-related outcomes (for more information see the previous publication; Stouten-Kemperman et al., 2015b). However, no healthy control group was included in this study. Therefore, the proportion of individuals showing cognitive decline or lower cognitive performance may have been elevated in both groups when compared with a matched group of healthy controls. Furthermore, because of the cross-sectional nature of the imaging data in this study, our ability to relate these data to longitudinal cognitive changes was limited.
In summary, we demonstrated altered functional connectivity of brain networks long after the administration of cisplatin-based CT. This observation is compatible with our previous finding of increased “connectivity” in white matter structural brain networks in the same population of TC patients. Furthermore, it provides a novel insight on the stability of cognitive performance during long-term survivorship. However, there is a growing need for future longitudinal multimodal imaging studies that further investigate both structural and functional network connectivity measures, as well as the relationship with cognitive changes.
Footnotes
Acknowledgments
We thank all the participants and colleagues who contributed to our studies. This is a nonindustry-sponsored study. This research was supported by AMC Medical Research, grant 09.25.229 I 09.03.270.
Author Disclosure Statement
No competing financial interests exist.