
Abstract
Studies of brain structure in fetal alcohol spectrum disorder (FASD) have shown the global and focal effects that prenatal alcohol exposure (PAE) has on the brain, suggesting but not measuring altered function in FASD. This study aimed to (1) identify resting-state functional networks in children and adolescents with FASD, (2) investigate functional connectivity differences compared with healthy controls, and (3) assess the links to cognitive deficits. Participants included 66 children/adolescents with FASD (aged 5.5–18.9 years) and 67 healthy controls (aged 5.8–18.5 years) scanned across four sites as part of the NeuroDevNet study. Six core functional networks with 27 regions of interest (ROIs) were examined using seed-based and ROI-to-ROI analyses. Average seed-based connectivity maps showed significant spatial overlap of positively correlated regions for all six core networks between FASD and controls, but there was less overlap for negatively correlated regions. ROI-to-ROI matrices demonstrated lower internetwork connectivity between regions primarily associated with the salience network (anterior cingulate cortex and bilateral insula), frontal–parietal network (bilateral posterior parietal cortex), and language network (right posterior superior temporal gyrus). Post hoc correlations of the FASD participants without medication revealed a relationship between functional connectivity and performance on two cognitive tests associated with mathematics ability and attention. Even though participants with PAE exhibit very similar intranetwork functional connectivity patterns as controls, their lower internetwork functional connectivity suggests underlying deficits in the functional network brain architecture that may be related to cognitive impairment.
Introduction
The prevalence of fetal alcohol spectrum disorder (FASD) has been estimated as high as ∼1 in 100 and is characterized by a wide range of physical, cognitive, and behavioral impairments (May et al., 2009). Behavioral deficits in FASD are not limited to a single cognitive domain and include deficits in motor function, attention, learning and memory, expressive and receptive language, executive function, and visuospatial skills (Riley and McGee, 2005). The impact of prenatal alcohol exposure (PAE) on behavior provides insight into potential widespread neurological damage and motivates the study of anatomical and functional brain abnormalities in this debilitating disorder.
Findings from structural magnetic resonance imaging (MRI) include abnormal regional brain volumes, cortical thickness, and white matter microstructure in FASD [for review see Donald et al. (2015)]. Results from these studies suggest, but do not explicitly measure, altered brain function in FASD. Task-based functional MRI (fMRI) studies of children/adolescents with FASD have reported differences in functional activity while performing a variety of cognitive tasks. Studies of inhibition tasks (Fryer et al., 2007; O'Brien et al., 2013) have shown higher activation in participants with FASD in regions of the frontal and parietal lobes as well as the cingulate gyrus. A task-based study of sustained attention reported greater activation in an occipital–temporal region (Li et al., 2008). Children with FASD showed greater activation in parietal, frontal, and inferior temporal regions while performing a number processing task (Meintjes et al., 2010). Several studies have investigated functional activation related to working memory in FASD, as follows. Studies utilizing a conventional n-back working memory task have reported both lower (Astley et al., 2009; Roussotte et al., 2011) and higher (Diwadkar et al., 2013) functional activation in frontal, temporal, and parietal regions. Studies on subdomains such as spatial working memory (Malisza et al., 2005; Spadoni et al., 2009) have been more consistent reporting greater activation in inferior frontal lobe and insular cortex. Studies of verbal working memory (O'Hare et al., 2009; Sowell et al., 2007) have also shown greater activation of frontal regions. Studies on young adults with FASD have shown differences in functional activation during spatial working memory (Malisza et al., 2005) and number processing (Santhanam et al., 2011) suggesting that functional abnormalities persist into adulthood. Taken together, task-based fMRI studies suggest more regional functional demand in children/adolescents with FASD.
Resting-state fMRI (rsfMRI) has provided insight into typical brain development (Stevens, 2016) and a variety of neurodevelopmental disorders such as autism (Hull et al., 2017) and attention-deficit/hyperactivity disorder (ADHD) (Konrad and Eickhoff, 2010), but has had limited study in FASD. Studies of global network properties have suggested widespread functional network differences in FASD such as greater characteristic path length and less global efficiency in children and adolescents prenatally exposed to alcohol (Wozniak et al., 2013), with the potential for identifying FASD participants from controls who could not be classified based on facial dysmorphology features alone (Wozniak et al., 2017). Other studies have investigated specific functional connections in FASD populations using region of interest (ROI)-based analysis. Children and adolescents prenatally exposed to alcohol [same sample as Wozniak et al. (2013)] had lower interhemispheric connectivity between paracentral ROIs (Wozniak et al., 2011). In an investigation of default mode network (DMN) connections, lower connectivity was observed at rest, as well as reduced task-related deactivation of the DMN in young adults with FASD (Santhanam et al., 2011). Rather than investigating individual functional connections between regions or global network properties, other work has investigated the impact of PAE on connectivity in multiple functional networks simultaneously using independent component analysis. Greater connectivity of motor-related networks was observed in neonates prenatally exposed to alcohol (Donald et al., 2016), which may indicate a delayed development of the functional compartmentalization of these brain networks.
To our knowledge, only one study has investigated multiple functional networks in a sample of children/adolescents with FASD (Fan et al., 2017). In a group of 57 participants (19 FASD, 19 heavily exposed nonsymdromal, and 19 controls), independent component analysis showed lower within-network connectivity in FASD than controls in five regions of five separate functional networks: anterior default mode (right postcentral), salience (right middle frontal), dorsal attention (left precentral), ventral attention (right precentral), and right frontoparietal (left crus II of the cerebellum) networks. Results in rsfMRI studies suggest that the functional organization of the brain is altered in FASD and differences are widespread, manifesting in multiple networks at various stages in development. Given the limited study of functional networks in large samples of children/adolescents prenatally exposed to alcohol, more work is needed to evaluate the consistency of previous findings as well as to explore differences in internetwork connectivity and the relationship of functional connectivity with cognitive deficits in this population.
This study investigated alterations in functional connectivity of resting state networks in children/adolescents with FASD. Specifically, the study aims were to (1) identify the spatial overlap of positively and negatively connected regions of six core networks, namely the DMN, visual, frontoparietal, salience, language, and ventral attention networks in a relatively large cohort of 66 children/adolescents prenatally exposed to alcohol relative to 67 controls, (2) investigate differences of functional connectivity between the nodes of these six networks in FASD, and (3) determine whether functional connectivity alterations in FASD are associated with cognitive deficits.
Materials and Methods
FASD/typically developing participants
This study was approved by the Human Research Ethics Boards at Queens's University, University of Alberta, Children's Hospital of Eastern Ontario, University of Manitoba and the University of British Columbia. Written informed consent was obtained from a parent or legal guardian and assent was obtained from each child before study participation.
Participants (healthy control and FASD) were recruited as part of the NeuroDevNet multisite imaging project on FASD (Reynolds et al., 2011). Structural MRI and fMRI were acquired for 178 participants with 45 (22 FASD and 23 controls) being excluded for poor structural/functional imaging quality or excessive motion during the rsfMRI scan, and individuals with <5 min of scan time after artifact detection and removal. The remaining 133 participants included 66 children with FASD (12.9 ± 3.4 years, 37 males) and 67 healthy controls (12.3 ± 3.4 years, 40 males). Participants were scanned at four sites across Canada, namely University of Alberta (24 FASD, 30 controls), Queens University (18 FASD, 14 controls), University of Manitoba, (10 FASD, 8 controls), and University of British Columbia (14 FASD, 15 controls). Children/adolescents in the FASD group had either formal diagnoses according to the Canadian guidelines (Chudley et al., 2005) as fetal alcohol syndrome (FAS, n = 5), partial FAS (n = 10), and alcohol-related neurodevelopmental disorder (n = 33) or confirmed PAE without a formal diagnosis (n = 18). All FASD subtypes were combined into one group for statistical analysis. Socioeconomic status (SES) was calculated using Hollingshead's four-factor index of social status (Hollingshead, 2011). Further demographic information was collected through questionnaire, including ethnicity, current medication, and comorbid psychiatric disorders (Table 1).
Participant Characteristics and Demographics for Fetal Alcohol Spectrum Disorder and Control Groups
Group differences of categorical variables (e.g., sex) assessed with Mann–Whitney U; continuous variable (e.g., age) assessed with independent samples t-test (at p < 0.05).
ADHD, attention-deficit/hyperactivity disorder; FASD, fetal alcohol spectrum disorder; ns, nonsignificant; SES, socioeconomic status.
Cognitive testing
Research assistants trained by a single neuropsychologist for consistency across the four sites performed a battery of cognitive assessments. The test battery included five major evaluations of core functions affected in PAE such as mathematics, reading, executive function, memory, and inhibition as follows. The Woodcock Johnson III Tests of Achievement (WJ-III ACH) evaluated mathematic and quantitative reasoning skills (Woodcock et al., 2001). The Woodcock Reading Mastery Tests—Revised (WRMT-R) provided a comprehensive assessment of reading ability (Woodcock,
Image acquisition
Structural and functional images were collected for each participant at four magnetic resonance imaging centers: University of Alberta (1.5T Siemens Sonata), Queen's University (3T Siemens Trio), University of Manitoba (3T Siemens Trio), and University of British Columbia (3T Philips Intera). Each session had a total acquisition time of ∼25 min including anatomical T1-weighted, T2-weighted, fluid-attenuated inversion recovery, and DTI imaging. For this study, resting-state functional imaging was acquired using an echo planar imaging gradient echo sequence with 3 mm isotropic voxels, 40 axial slices, field of view (FOV) = 192 × 192 mm2, repetition time (TR) = 2.5 sec, echo time (TE) = 30 msec (3T scanners)/40 msec (1.5T scanner), phase encode direction anterior–posterior (Siemens Scanners)/posterior–anterior (Philips scanner), flip angle = 90°, 140 time points, and 6 min total acquisition. In addition, T1-weighted images used for anatomical registration were acquired with a high-resolution (1 × 1 × 1 mm3) magnetization prepared rapid acquisition gradient echo (MPRAGE) sequence with 160 axial slices, FOV = 256 × 256 mm2, inversion time (TI) = 1100 msec, flip angle = 15°, TR ∼2100 msec, TE ∼3.5 msec, and acquisition time ∼5:30 min.
Intersite correction participants
For assessing between-site reliability of functional connectivity measures, eight healthy young adults (age 28 ± 6 years, two males/six females) prospectively underwent two sequential imaging sessions at each of the four sites (mean 102 days from first to last scan).
Preprocessing
All study participants were processed and analyzed using the same standard pipeline from the Functional Connectivity Toolbox (version 17.a
Functional connectivity ROI-based analysis
ROIs were taken from the network-specific mask included in the functional connectivity toolbox version 17.a (Whitfield-Gabrieli and Nieto-Castanon, 2012). These ROIs were generated from an independent component analysis of 497 healthy individuals from the human connectome project and are detailed in Table 2. Included in this toolbox are labels that specify the functional network (e.g., DMN, dorsal attention) for each ROI. In this study, ROIs from six a priori defined networks were used: DMN (four ROIs), dorsal attention network (four ROIs), language network (four ROIs), frontal–parietal network (four ROIs), salience network (seven ROIs), and visual network (four ROIs). ROIs from the sensorimotor and cerebellar networks were excluded in the analysis because a large proportion of the participants had missing coverage. First, for the purpose of investigating spatial connectivity patterns between groups, seed-based connectivity maps were created for each individual by extracting a mean time series across all voxels of a given ROI, and correlating the time series to all voxels in the subject's image, resulting in 27 seed-based connectivity maps per subject for the six networks. By investigating multiple seed-based connectivity maps within a given network, this analysis remained sensitive to differences related to specific network ROIs. Second, correlations between average ROI time courses were calculated between all 27 ROIs for each subject, resulting in a connectivity matrix per subject. Correlations from seed-based maps and connectivity matrices were then fisher z-transformed. The same analysis was performed on the images acquired from the eight traveling control participants from the multisite reliability data.
Regions of Interest Are Listed for the Six Core Networks for Both Seed-Based and Region of Interest-Based Analyses (Center of Mass in Montreal Neurological Institute Coordinates) That Were Taken from the Network-Specific Mask Included in Functional Connectivity Toolbox Version 17.a (Whitfield-Gabrieli and Nieto-Castanon, 2012)
ROI, region of interest; L, left, R, right.
Multisite correction
To account for variability in connectivity measures between sites, the traveling control data were used to generate correction factors (linear mean shift) for each connectivity matrix in the childhood/adolescent cohort using the following process. First, a site correction matrix (Δ) was calculated for each site by subtracting the site mean correlation matrix (average of 16 functional images) from the total mean correlation matrix across all traveling subjects and sites (average of 64 functional images). The inverse of this Δ matrix was then applied to each individual's correlation matrix within each site. This approach would be analogous to covarying by site in a linear regression, except the site estimates per connection are taken from an independent sample of eight traveling control participants scanned twice at each site.
Spatial overlap of connected regions
Average seed-based connectivity maps were calculated separately for control and FASD groups for all 27 seeds and were thresholded to fisher z-scores >0.25 and <0. Positively and negatively connected regions between corresponding control and FASD maps were visually compared to assess general between-group spatial agreement of connected regions. Positively connected (z-score >0.25) and negatively connected (z-score <0) group average maps were created and binarized where 1 indicates values other than 0. As a quantitative measure of voxel-wise spatial agreement between groups, dice coefficients were calculated between average control and FASD binarized maps, resulting in a measure of overlap between groups separately for positive and negative connectivity maps for each seed. The dice coefficient used in this instance is calculated as two times the number of voxels intersecting FASD and control maps, divided by the sum of all voxels in the control map plus all voxels in the FASD map.
Group comparison/network matrices analysis
Connectivity matrices per subject were used to test for group differences in individual functional connections between controls and FASD participants. A general linear model was used to assess between group differences for every connection between ROIs, covarying for effects of age, sex, number of removed time points during scrubbing, and average motion during scanning session. Results were then corrected for multiple comparisons (27 ROIs, 351 connections) using false-discovery rate (FDR) correction and results (t-statistics, FDR-corrected p value) were reported for connections with group differences exceeding an FDR-corrected p value <0.05. To assess whether potential confounds influenced the group effect observed between FASD and controls, four potential confounding variables were selected for further analysis, namely diagnosis of ADHD, aboriginal ethnicity, currently on medication including stimulants, and currently on medication other than stimulants. The effects of confounders on connections surviving FDR correction were assessed within the FASD group using separate multivariate linear models (p < 0.05) for each potential confounder, including covariates previously included in the between-group analysis. Furthermore, a within-group (nonmedicated FASD group and control group separated) correlation analysis was performed to test for relationships (uncorrected for multiple comparisons p < 0.05) between cognitive scores and functional connectivity of the connections that show between-group differences surviving FDR correction.
Results
Cognitive and behavioral differences in FASD
Relative to controls, the FASD group had lower cognitive scores as well as higher BRIEF scores for all tests (Table 3). The cognitive tests with the greatest differences were related to response inhibition, whereas the largest difference in BRIEF scores was related to working memory and behavioral regulation.
The Fetal Alcohol Spectrum Disorder Group Showed Poorer Cognitive Test Performance in All Tests Relative to Controls, as Well as Greater Deficits in Executive Function (Behavior Rating Inventory of Executive Function) in All Parent-Reported Behaviors
Group differences assessed with independent samples t-test (at p < 0.05).
BRIEF, Behavior Rating Inventory of Executive Function.
Spatial characteristics of connectivity in FASD
All six networks, namely the DMN, dorsal attention, language, frontal parietal, salience, and visual networks, had similar connectivity patterns between healthy controls and participants with FASD for all 27 seeds. Average connectivity maps per group are presented for six seeds, one per network (Fig. 1). In general, average connectivity maps for both the control and FASD groups demonstrated excellent spatial agreement in positively connected regions (z-score >0.25) for all seeds, given high dice coefficients (0.85 ± 0.04) with 25 of the 27 seeds >0.8 (as high as 0.89). However, the dice coefficient between controls and FASD maps was notably lower for negative correlations (0.71 ± 0.06) with only 1 of 27 seeds being >0.8 (left posterior parietal seed of the frontal–parietal network) and the lowest being 0.55 for the anterior cingulate seed of the salience network.
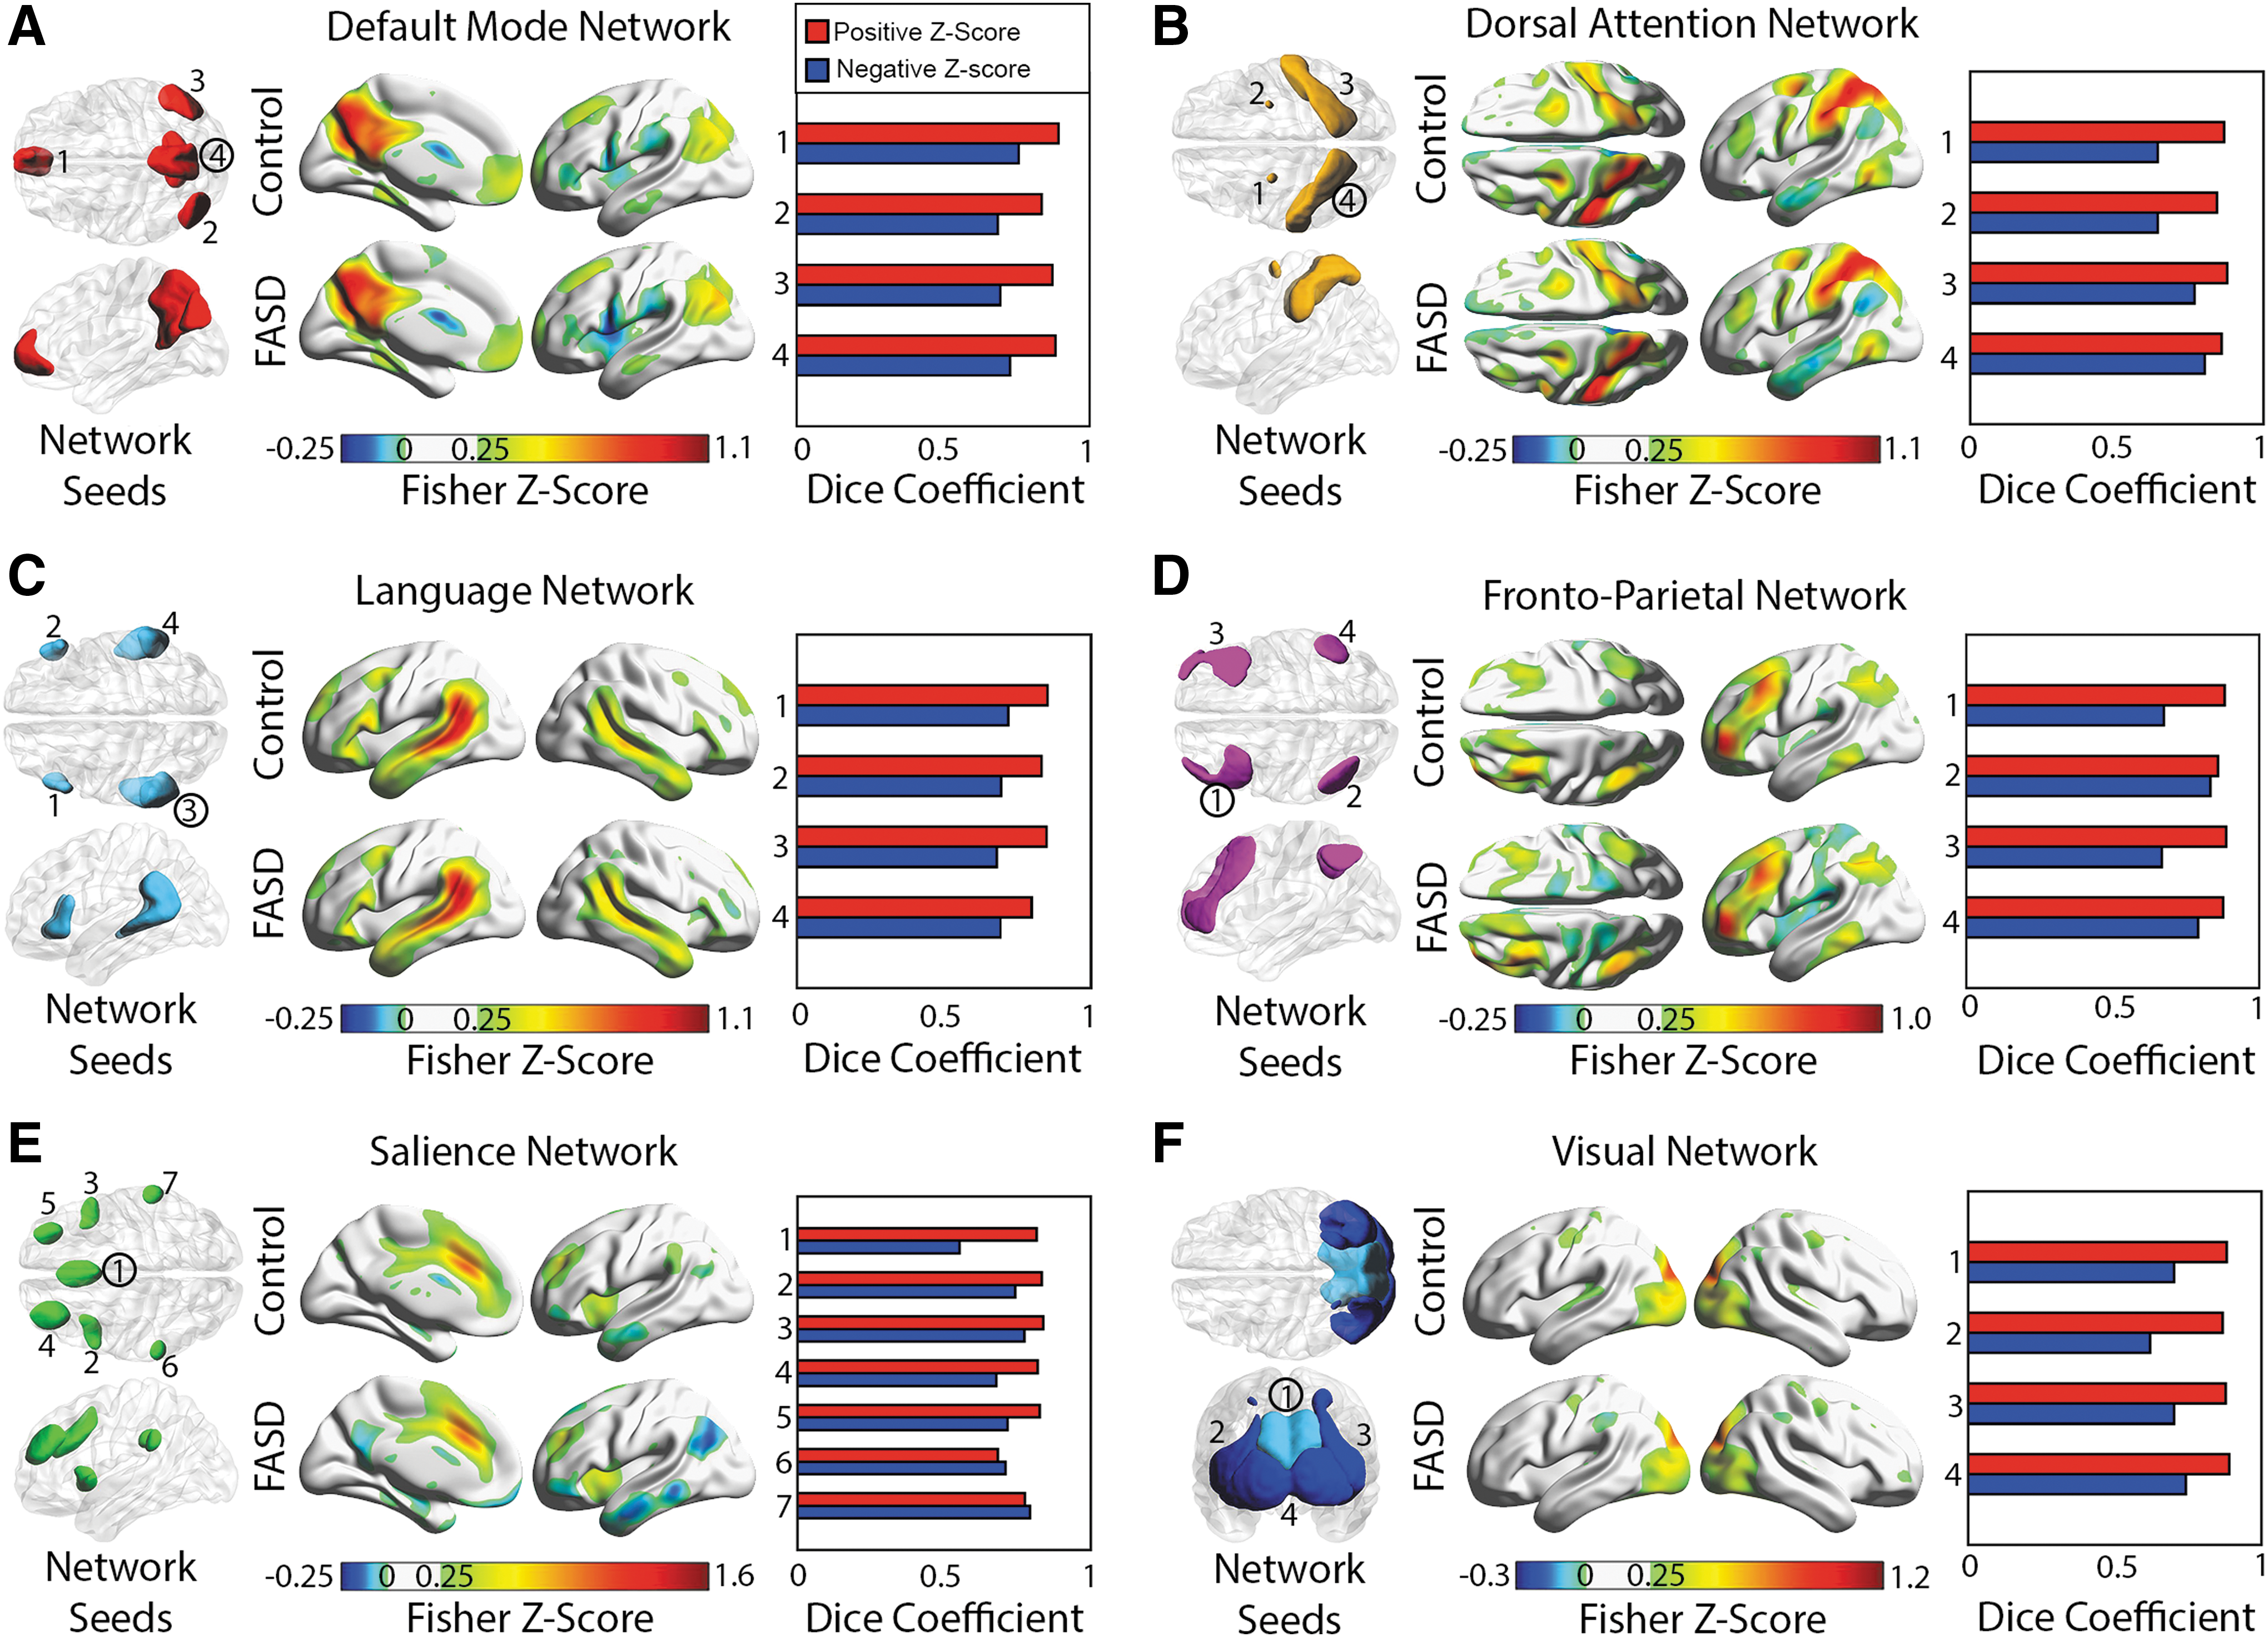
ROIs used for seed-based connectivity analysis are visualized separately for six functional networks
Functional connectivity differences in FASD
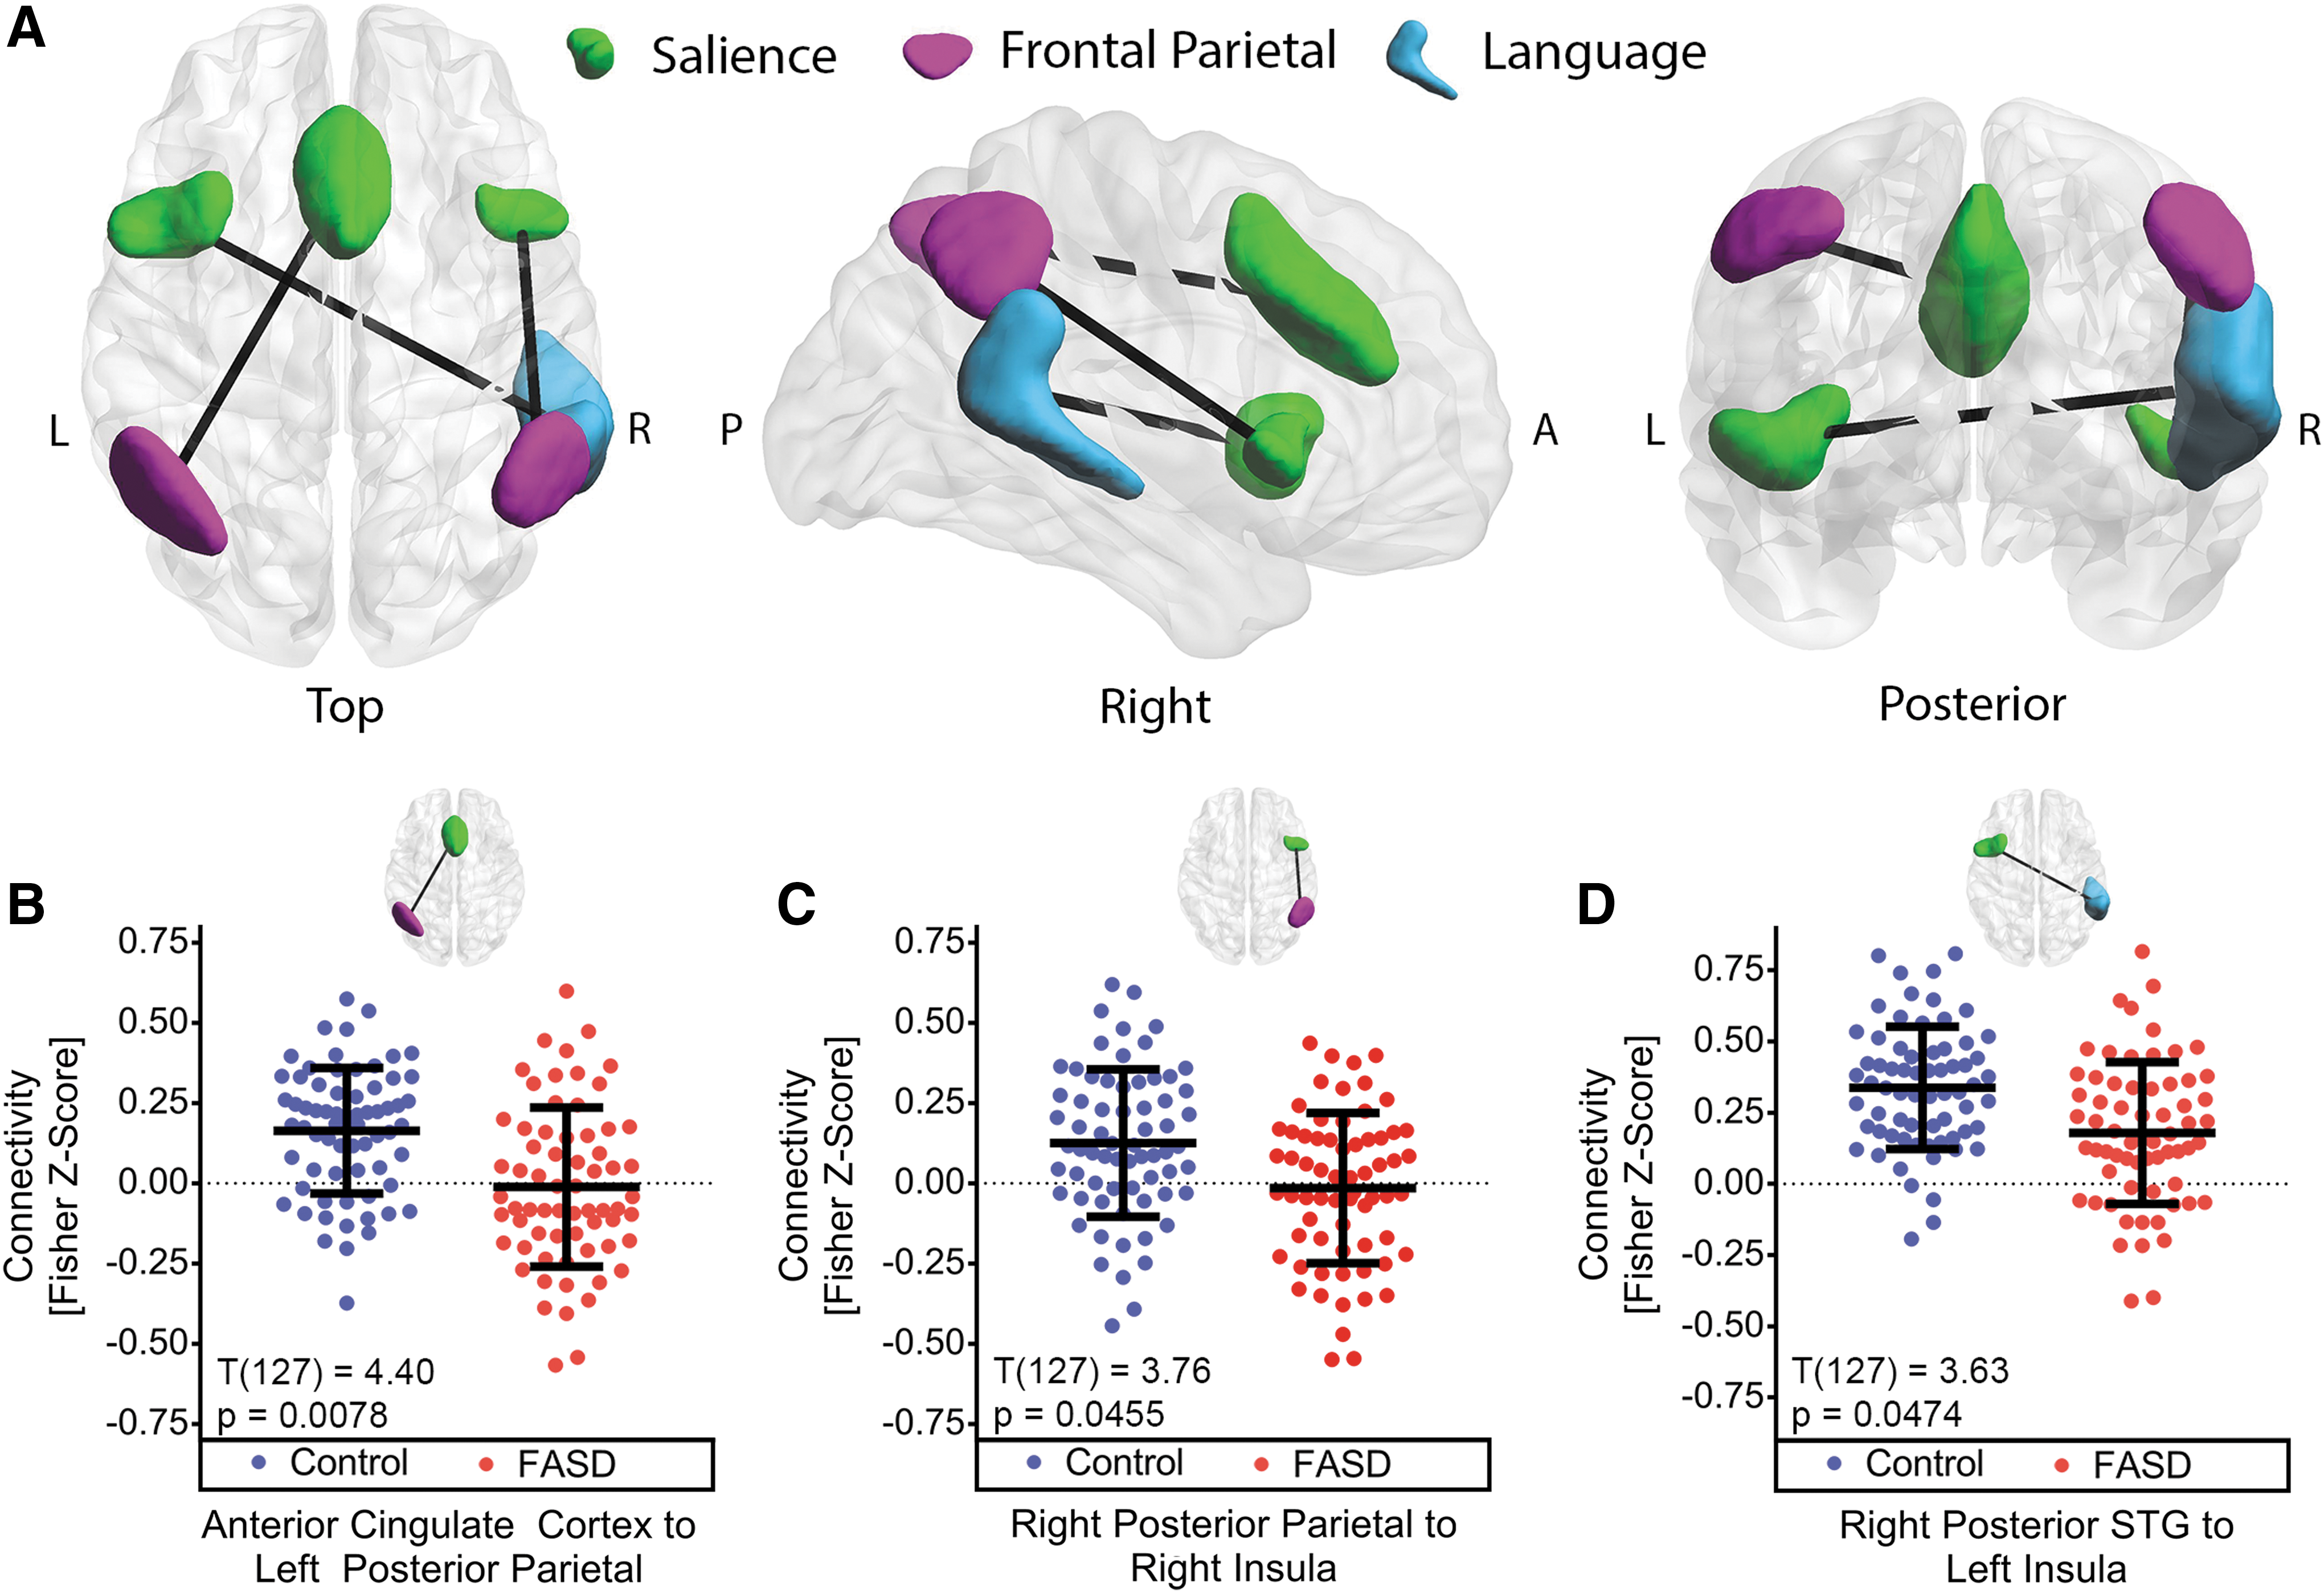
The three connections that had statistically significant between-group differences of altered connectivity (FDR-corrected p < 0.05) in FASD are rendered in three dimensions and displayed along with bee-swarm plots of individual z-scores for each connection (Fig. 2). Relative to controls, all three connections in FASD showed different internetwork connectivity to regions within the salience network. Relative to controls, functional connectivity was lower for the anterior cingulate cortex (ACC) to the left posterior parietal cortex (PPC), the right insula to the right PPC, and the left insula to the right posterior superior temporal gyrus (pSTG). The absolute differences of between-group averages in functional connectivity ranged from 0.140 to 0.176 for all three connections. In the control group, all connections had positive average fisher z-scores, whereas the FASD average connectivity qualitatively had a trend of negative or close to zero connectivity in the two connections between the salience and the frontal–parietal network. Notably, a more robust group effect was observed (T(127) = 4.40, p = 0.0078) in the connection between the ACC and left PPC relative to the other two connections.
Potential confounding variables and cognitive associations
Results of post hoc analysis of the three connections with observed group differences are reported in Table 4. No significant (p < 0.05) effects related to diagnosis of ADHD, aboriginal ethnicity, and medication not including stimulants were observed between functional connectivity of the three remaining connections in the FASD group. A positive effect on functional connectivity (p < 0.05) was observed between the FASD group on at least one stimulant and the nonmedicated FASD group in connectivity between the right pSTG and the left insula. Functional connectivity values are presented for this connection as bee-swarm plots (Fig. 3) separating the FASD group by medication class. The FASD group on at least one stimulant had an observed increase in functional connectivity (p < 0.05) relative to the nonmedicated FASD group.
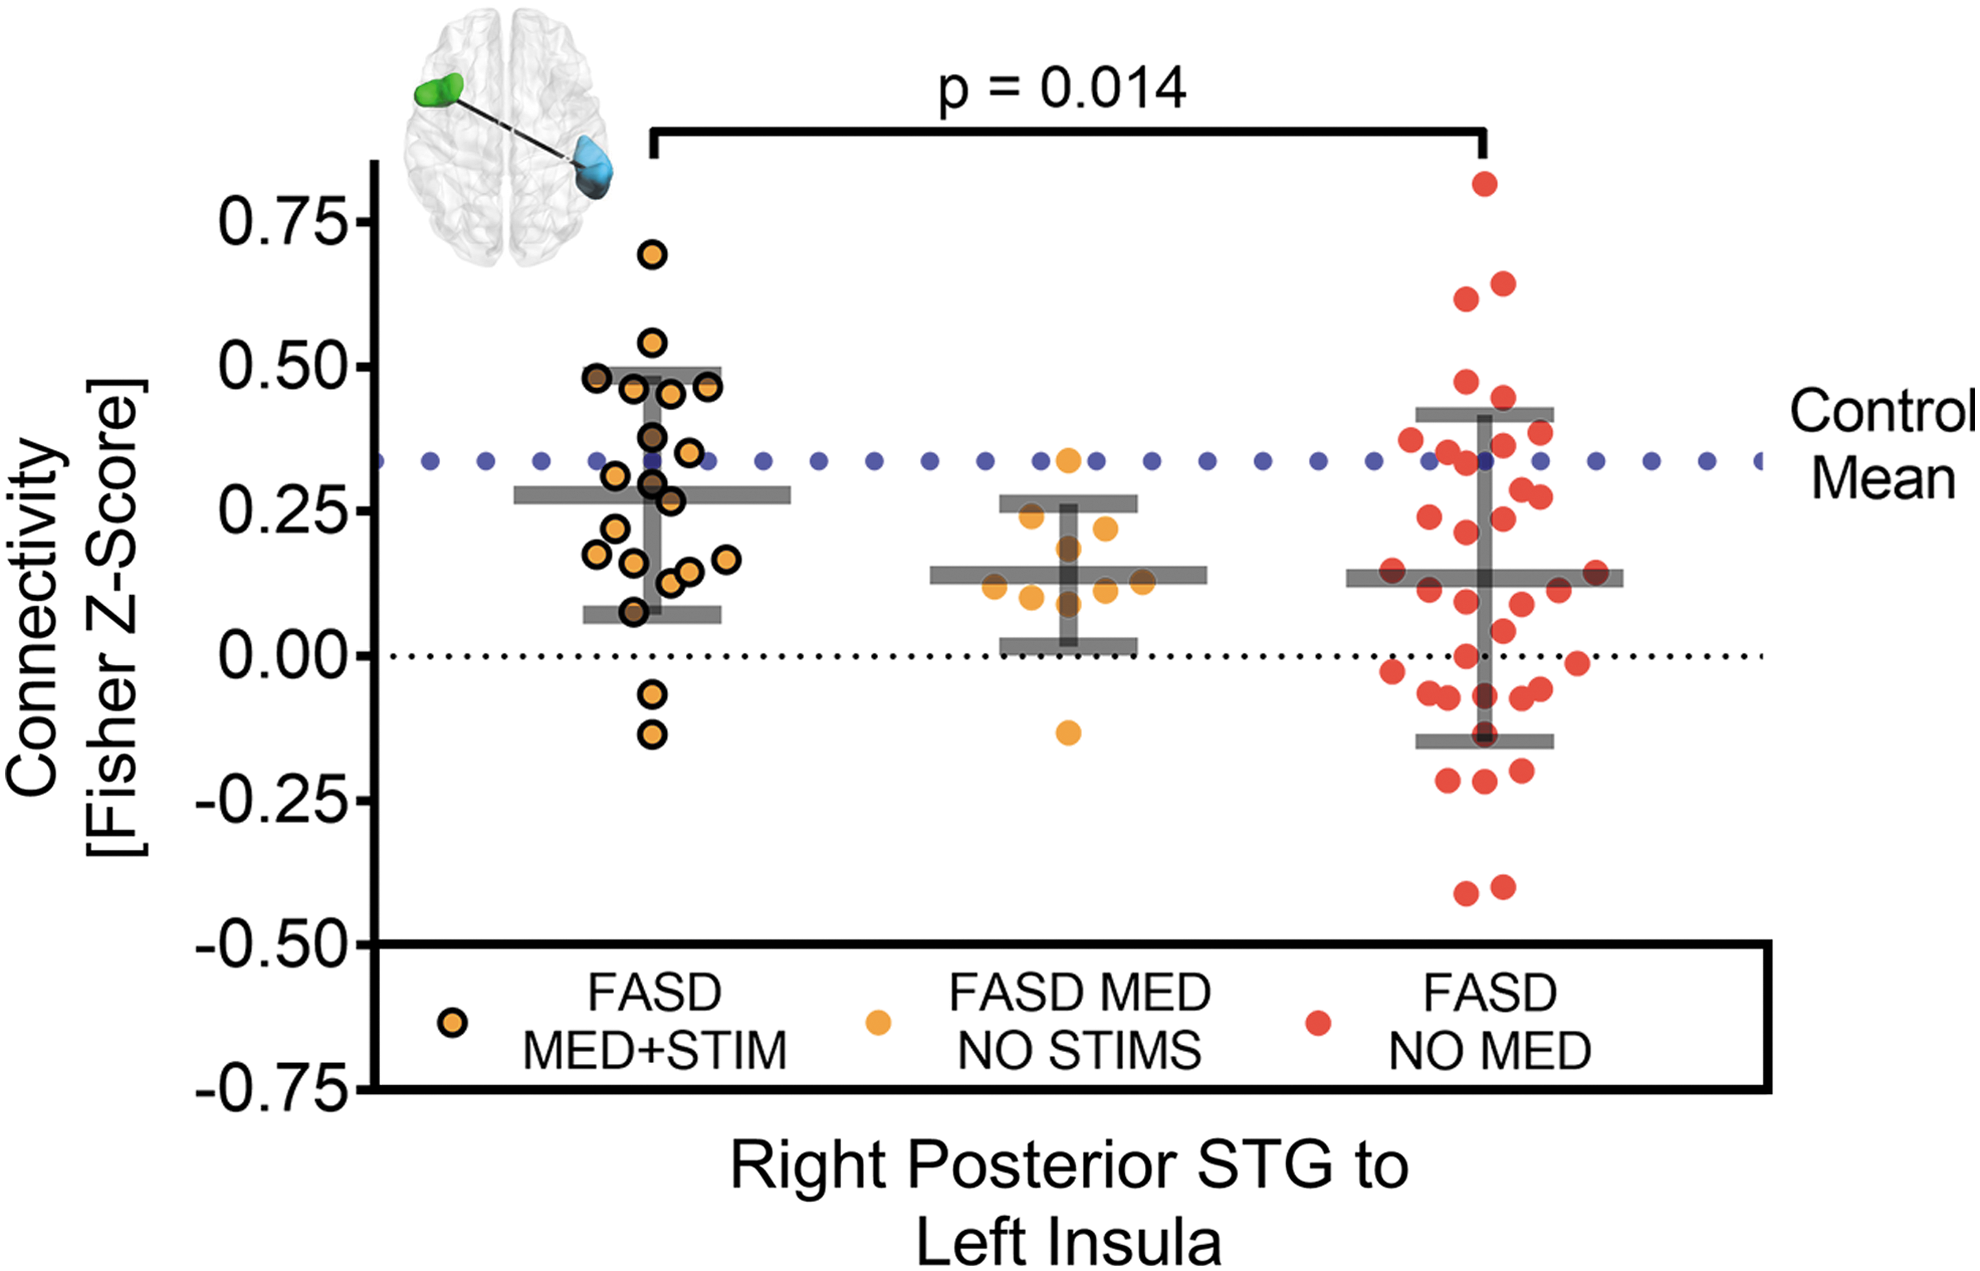
Difference between functional connectivity of FASD participants who were medicated with at least one stimulant (n = 20, orange/black MED+STIM), medicated without stimulants (n = 10, orange MED NO STIMS), and not medicated (n = 36, red NO MED). Relative to the no stimulants or nonmediated FASD, functional connectivity was greater in one connection (out of the three tested from Fig. 2), namely between the right pSTG and the left insula, in the FASD participants medicated with at least one stimulant. Notably the latter connectivity was near the control mean (dotted blue line). Note that the black dotted line marks a functional connectivity value of zero.
Post Hoc Analysis of Potential Confounds in the Fetal Alcohol Spectrum Disorder Group for the Three Connections with Lower Functional Connectivity in the Fetal Alcohol Spectrum Disorder Group Relative to Controls
Statistical differences were assessed with a multivariate linear regression (* and bolded text for p < 0.05) adjusting for age, sex, number of volumes removed during scrubbing, and average motion per subject.
ACC, anterior cingulate cortex; PPC, posterior parietal cortex; pSTG, posterior superior temporal gyrus.
Connectivity values for the three connections surviving FDR correction were carried forward to test for relationships of cognitive scores in the nonmedicated FASD group and control group separately. In the nonmedicated FASD group, a positive correlation (r = 0.472, p = 0.006) was observed between scores on the NEPSY II Auditory Attention subtest and functional connectivity between the left insula and right pSTG (Fig. 4A). In addition, in the nonmedicated FASD group, a negative correlation (r = −0.356, p = 0.036) was observed between performance on Woodcock Johnson Quantitative Concepts Subtest and functional connectivity between the left PPC and the ACC (Fig. 4B). Within the control group, no statistically significant correlations were observed between z-scores from the three connections investigated and cognitive scores.
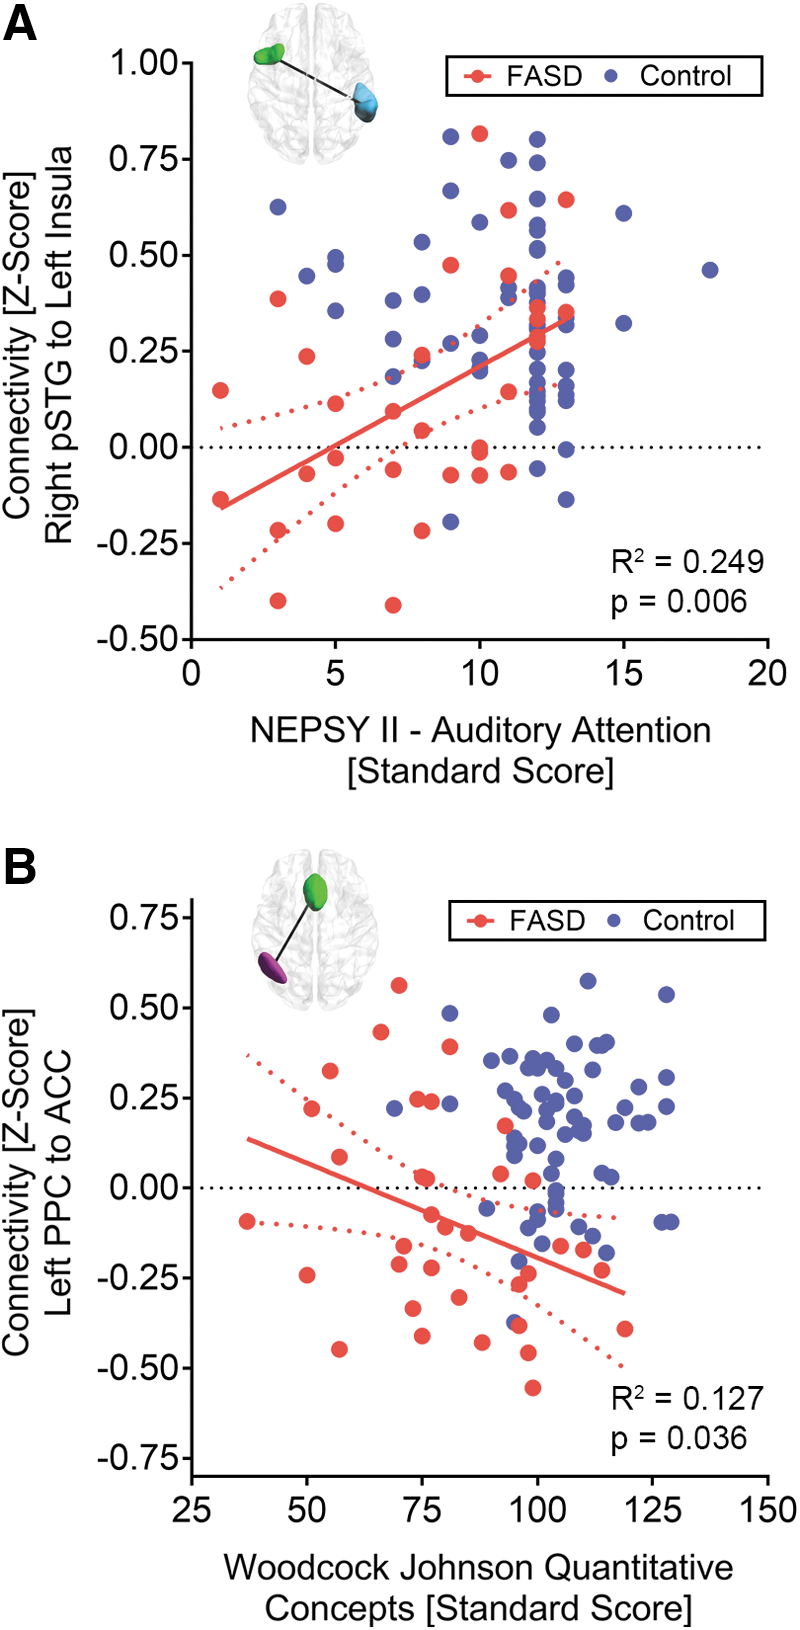
Statistically significant (uncorrected p < 0.05) correlations (red lines) between two internetwork connections and cognitive scores in the nonmedicated FASD group (red) are presented along with 95% confidence intervals (red dotted lines).
Discussion
Spatial patterns of resting state networks in FASD
This study reports six resting-state functional networks in children/adolescents with FASD that share strong spatial agreement with controls in positively connected regions and slightly weaker spatial agreement of negatively connected regions, namely the DMN, frontoparietal, salience, dorsal attention, language, and visual networks. These results suggest that spatial patterns of connectivity remain intact in FASD, and that the ROIs can be confidently used for between-group analysis in this study. This is in agreement with one study that showed similar connectivity patterns in FASD of the salience, DMN, visual, somatosensory, frontoparietal, and dorsal/ventral attention networks (Fan et al., 2017). In addition, similar functional connectivity patterns have been shown in adults with FASD in a seed-based analysis of the DMN (Santhanam et al., 2011), and in an independent component analysis of neonates with FASD (Donald et al., 2016) in motor regions. These results are unsurprising given that regional functional connectivity patterns have been shown to be highly replicable in large samples (Yeo et al., 2011), and different rsfMRI analysis techniques have been applied successfully in many studies of other neurodevelopmental disorders such as autism (Hull et al., 2017) and ADHD (Konrad and Eickhoff, 2010).
Functional connectivity differences in FASD
In this study, functional connectivity differences were primarily observed in connections to the salience network, a network thought to be involved in identifying stimuli that are meaningful or important for behavior. Functional connectivity differences were also observed in connections to the frontal–parietal network that plays a role in executive function, a known cognitive deficit in FASD (Rasmussen, 2005). More recently, it has been suggested that the salience network modulates the switching between the DMN and the executive function network (Goulden et al., 2014), suggesting that the lower connectivity in FASD in both the salience and frontoparietal networks could be interrelated. Moreover, abnormal connectivity in any of these networks could result in more widespread cognitive deficits observed in FASD rather than deficits related to a specific cognitive domain.
Functional connectivity was lower in three internetwork connections for the FASD participants, in agreement with other work reporting lower functional connectivity in children/adolescents with FASD in both the bilateral PPCs (Wozniak et al., 2011), and in other networks including the salience and frontoparietal networks (Fan et al., 2017). Importantly, these results differed with the current findings as the previous studies showed functional connectivity differences within strongly correlated (intranetwork) regions, whereas differences in this study were observed between weakly connected (internetwork) regions. Relative to controls, lower connectivity between networks may indicate decreased between-network integration in these disorders. To our knowledge, functional connectivity studies of FASD have only investigated intranetwork connectivity, making a comparison with previous findings difficult. However, FASD diagnosis is highly comorbid with ADHD (note: 48% of our FASD participants, Table 1) where studies have shown lower internetwork connectivity primarily related to the DMN connections in adults with ADHD (Castellanos et al., 2008) and children and adolescents with ADHD (Sripada et al., 2014). More specifically, these studies report lower connectivity to the cingulate cortex (Castellanos et al., 2008) as well as regions related to both salience and frontal–parietal networks (Sripada et al., 2014) overlapping regions with lower connectivity in our study. This suggests that internetwork connectivity deficits could be common in populations with neurodevelopmental disorders rather than specific to FASD.
Two connections were observed to have positive average connectivity in the control group and negative average connectivity in the FASD group. Negative correlations have been an area of controversy in the field and distributions of positive and negative correlations have been shown to change based on varying preprocessing steps (Chai et al., 2012), and may have a vascular basis in large cerebral veins (Bianciardi et al., 2011), thus a proper interpretation based purely on these quantitative values is not yet feasible. Future work investigating anticorrelations and their physiological basis could provide a better understanding of how negative and positive connectivity manifest in FASD.
The analysis from this study did not use slice timing correction as a preprocessing step. A secondary ROI-to-ROI analysis was performed while including slice timing correction as a preprocessing step and this resulted in the same three connections showing similar group differences (data not shown). In addition, most multisite rsfMRI studies use site as a covariate to correct for intersite systematic differences (Di Martino et al., 2014; Fair et al., 2013). This is necessary practically since most studies do not usually acquire prospective scans from the same traveling subjects at each site. A reanalysis of our data using the conventional “site as a covariate” approach showed the same FASD versus control group difference for the ACC to right posterior parietal connection. However, of the three connections with group differences from the original analysis, there were small systematic decreases in group difference t-statistics when using site as a covariate, resulting in two of the three connections having a slightly larger p value than the statistical threshold of p < 0.05. This suggests that the traveling participant correction technique may improve sensitivity to detect group differences across site. For a secondary analysis demonstrating the consistency of these findings across site, see Supplementary Figs. S1 and S2 (Supplementary Data are available online at
Regional functional alterations in FASD
A large number of fMRI studies have reported alterations of brain activation in FASD during tasks related to working memory, executive function, sustained attention, and number processing. Of these studies, many have shown alterations in functional activity of the ACC, both parietal lobes, pSTG, and both insular cortices, the same regions that showed robust lower resting functional connectivity in our study. Task-related fMRI studies of working memory and verbal learning have reported lower activation in FASD of the right PPC during a 2-back task related to working memory (Astley et al., 2009), greater activation in FASD in the right inferior parietal cortex during a spatial working memory task (Diwadkar et al., 2013), greater activation in FASD in the left inferior parietal lobe during a verbal working memory task (O'Hare et al., 2009), and greater activation in FASD in right superior parietal cortex during a verbal learning task (Sowell et al., 2007). In addition, the anterior cingulate has shown greater activity in FASD in a go/no-go (executive function) task (O'Brien et al., 2013), and decreased activity in a working memory task (Roussotte et al., 2011). Insular cortices have shown differential functional activation in PAE participants during tasks related to working memory (Norman et al., 2013; Roussotte et al., 2011; Spadoni et al., 2009) and number processing (Meintjes et al., 2010), whereas the pSTG has shown greater activation in FASD participants during a working memory task (O'Hare et al., 2009). Even though the relationship is unclear between resting functional connectivity and task-related functional activity, resting state functional connectivity has been shown to predict task-related activation patterns of a variety of cognitive tasks in healthy participants (Tavor et al., 2016). Given that both task-related activity and resting-state functional connectivity of similar regions are reported to be altered in FASD, a relationship between greater functional demand and lower functional connectivity could exist in this disorder.
Functional connectivity may be associated with structural/metabolic alterations in FASD
Structural MRI studies of volume have shown abnormal regional cortical volumes in FASD. Cortical thickness studies of FASD have shown thicker (Sowell et al., 2008b; Yang et al., 2012) and thinner cortex (Zhou et al., 2011) in the parietal lobe, as well as thinner cortex in the pSTG (Chen et al., 2012). Diffusion MRI studies of children/adolescents with FASD have revealed alterations to white matter structure in long range tracts that connect regions with reduced functional connectivity in this study. Specifically, the lateral splenium of corpus callosum (Sowell et al., 2008a) and bilateral superior longitudinal fasciculus (Lebel et al., 2008) showed lower fractional anisotropy in their respective tracts, suggesting that structural “connectivity” may explain the lower functional connectivity in FASD from this study. One MR spectroscopy study has shown lower metabolic ratios of NAA/Cho and NAA/Cr in both the right parietal cortex and anterior cingulate of adolescents/young adults (ages 14–21 years) with FASD (Fagerlund et al., 2006). Converging results from multiple imaging modalities in similar regions may indicate an underlying structural and metabolic explanation for the functional connectivity results observed in this study; many studies have shown structural and metabolic differences in FASD participants in other brain regions, so another possible interpretation is that nonlocal structural/metabolic differences could have indirect effects on functional connectivity differences reported in this article.
Correlations with cognitive scores
Within-group correlations with cognitive test scores indicated a positive correlation between performance on the NEPSY II auditory attention subtest and functional connectivity between the left insula and the right pSTG only in the nonmedicated FASD group. Interestingly, it has been suggested that the anterior insula is involved in high-level cognitive tasks such as attention and may be responsible for mediating the switching between other task-related networks (Menon and Uddin, 2010). The pSTG is thought to be involved in auditory language processing (Friederici et al., 2000), a necessary component of the auditory attention task in this study. This suggests that this internetwork connection may be functionally specific to the observed auditory attention task performance in the FASD group. In addition, a negative correlation was observed between the average connectivity from the left posterior parietal ROI to the anterior cingulate and mathematics ability (Woodcock Johnson Quantitative Concepts 18A&B) only in the FASD group. Previous work has revealed a relationship between white matter structure in the left parietal lobe and mathematics ability in healthy young adults (Matejko et al., 2013) and in children/adolescents with FASD (Lebel et al., 2010). Interestingly, in both these studies, mathematics ability was positively correlated with measures of fractional anisotropy (white matter “integrity”) contrary to the negative correlation with left parietal lobe functional connectivity observed in this study. Taken together, these studies show that larger fractional anisotropy and less functional connectivity of the left parietal lobe are predictors of positive mathematics outcomes in children/adolescents with FASD. Furthermore, this may indicate that lower functional connectivity is a compensatory change related to underlying structural deficits in FASD. Notably, brain–behavior relationships were only found in a subgroup of medically naive FASD participants. A secondary analysis including all FASD participants yielded no such relationships (data not shown), suggesting that separating groups by medication status may be desired to be sensitive to brain–behavior relationships.
Limitations
Several limitations exist in this study, primarily associated with unknown environmental exposures. Animal studies have shown a dose-dependent effect of developmental alcohol on neurodegeneration (Ikonomidou et al., 2000). The patients in this study were recruited long after birth and many were adopted from a young age so an accurate characterization of maternal alcohol consumption was not available. Even though SES was characterized from a child's current household, children prenatally exposed to alcohol often experience adverse environmental events at a young age (McCrory et al., 2010) that could have a varying effect on the development of functional connectivity patterns in children and adolescents. To control for these confounds, future work may be able to characterize the level and timing of exposure as well as adverse life events to better assess the effect of PAE on functional connectivity.
In our sample, participants with FASD had a variety of comorbid diagnoses, including ADHD, anxiety, depression, bipolar, oppositional defiant disorder, conduct disorder, or autism. Comorbidities in this population are quite common and thus developmental effects of various medications, treatments, and diagnosis are difficult to separate. In this study, post hoc testing revealed that greater connectivity between the left insula and the right pSTG in the FASD group was associated with current use of stimulant medication (Fig. 3). Importantly, an analysis of the entire cohort showed lower connectivity in this same connection for the FASD group relative to controls. Taken together, these results suggest that the group difference was not driven by stimulant, and if anything the effect of stimulant weakened the observed group difference. To our knowledge, no studies have investigated the effect of stimulant use on brain function in an FASD cohort. However, increased insular connectivity may be comparable with task-based studies of children with ADHD that show different salience network activity in the right insula and anterior cingulate associated with stimulant use (Rubia et al., 2014).
Conclusions
In this study of children/adolescents aged 5–18 years, functional connectivity of six resting-state networks was identified in the FASD participants that were spatially consistent with the same functional networks in the control group. Functional connectivity was lower in internetwork connections between salience network regions and regions of the frontoparietal and language networks. This suggests abnormal network-to-network functional communication in FASD. Functional connectivity of two connections in the nonmedicated FASD group was associated with mathematics ability and performance on an attention task, indicating that these changes may underlie cognitive deficits. Overall, individuals with PAE demonstrate functional differences in regions spanning multiple networks of the brain.
Footnotes
Acknowledgments
The authors thank Networks of Centres of Excellence (NeuroDevNet/Kids Brain Health Network) and Women's and Children's Health Research Institute for operating funds, WCHRI and Brain Canada for studentship scholarship (G.L.), and Alberta Innovates Health Solutions and Canada Research Chair program for salary (C.B.). We also acknowledge the contributions from the research assistants, technicians, and physicians involved in the collection of data for this study.
Author Disclosure Statement
No competing financial interests exist.
References
Supplementary Material
Please find the following supplemental material available below.
For Open Access articles published under a Creative Commons License, all supplemental material carries the same license as the article it is associated with.
For non-Open Access articles published, all supplemental material carries a non-exclusive license, and permission requests for re-use of supplemental material or any part of supplemental material shall be sent directly to the copyright owner as specified in the copyright notice associated with the article.