
Abstract
Brain parcellation is often a prerequisite for network analysis due to the statistical challenges, computational burdens, and interpretation difficulties arising from the high dimensionality of neuroimaging data. Predominant approaches are largely unimodal with functional magnetic resonance imaging (fMRI) being the primary modality used. These approaches thus neglect other brain attributes that relate to brain organization. In this article, we propose an approach for integrating fMRI and diffusion MRI data. Our approach introduces a nonlinear mapping between the connectivity values of two modalities, and adaptively balances their weighting based on their voxel-wise test–retest reliability. An efficient region level extension that additionally incorporates structural information on gyri and sulci is further presented. To validate, we compare multimodal parcellations with unimodal parcellations and existing atlases on the human connectome project data. We show that multimodal parcellations achieve higher reproducibility, comparable/higher functional homogeneity, and comparable/higher left out data likelihood. The boundaries of multimodal parcels are observed to align to those based on cytoarchitecture, and subnetworks extracted from multimodal parcels matched well with established brain systems. Our results thus show that multimodal information improves brain parcellation.
Introduction
T
To reduce the dimensionality, a common strategy is to group voxels into parcels. In addition, reliable whole-brain connectivity estimation heavily depends on the variable-to-sample ratio. For example, when the number of parcels exceeds the number of time samples for functional data, the standard error of the connectivity estimates would be at the same order of magnitude as the connectivity estimates themselves, which is unreliable. Hence, parcellation tackles this problem by grouping spatially contiguous voxels with similar signals into a more biologically relevant unit. The set of properties for defining brain parcels is an open question (Fornito et al., 2013), and the accuracy of the parcellation greatly affects connectome estimation and its characterization (Smith et al., 2011).
Whole-brain parcellation is challenging due to multiple intertwined problems. First, what properties define a brain unit are unclear. For MRI data, a voxel is often taken as a brain unit (Stanley et al., 2013), but this definition solely depends on the scan protocol, for example, 1 mm versus 2 mm acquisition would result in “neuron patches” of different sizes defined as brain units. A common and likely more neuroanatomically meaningful strategy is to group voxels based on certain neurobiological properties, such as cytoarchitecture (Brodmann, 2007), myeloarchitecture (Glasser and Van Essen, 2011), chemoarchitecture (Caspers et al., 2013), cortical folding (Fischl et al., 2008), shared brain function (Wandell et al., 2007), functional homogeneity (Shi et al., 2007), meta-analytic activation modeling (Yang et al., 2016), and connectivity patterns (Arslan et al., 2017).
With today's wide availability of MRI scanners, most strategies are now designed around using only MRI-based features for parcellation (de Reus and van den Heuvel, 2013; Glasser and Van Essen, 2011). In particular, majority of recent studies focus on using functional MRI (fMRI) data for parcellation (Blumensath et al., 2013; Craddock et al., 2012; Gordon et al., 2014; Shen et al., 2013). A related problem is the choice of the number of parcels. Often, this number is arbitrarily set (Zalesky et al., 2010). More principled strategies include using criteria, such as predictability on left out data (Varoquaux et al., 2011) or stability over data splits (Thomas Yeo et al., 2011). Based on architectonic (Van Essen and Ugurbil, 2012) and functional (Tucholka et al., 2008) information, 500 parcels appear probable. Others argue that this choice should be application specific (Jirsa et al., 2010). For example, estimating a 500 × 500 connectivity matrix given 100 time samples would result in high estimation errors (Molinaro et al., 2005).
Given a single modality, such as fMRI, which is by far the most widely used for brain parcellation (Blumensath et al., 2013; Craddock et al., 2012; Gordon et al., 2014; Shen et al., 2013), there exists numerous parcellation methods that can be broadly divided into three categories, namely clustering techniques, community detection techniques, and image segmentation-based techniques.
Under the clustering category, k-means clustering (Flandin et al., 2002; Kahnt et al., 2012), mixture models (Golland et al., 2007; Yeo et al., 2011), and hierarchical clustering (Eickhoff et al., 2011; Michel et al., 2012; Orban et al., 2015) [e.g., the Ward method (Johnson, 1967; Ward, 2012)] have been extensively explored. Under the community detection category, Normalized cuts (Ncuts) is typically used (Craddock et al., 2012; Shen et al., 2013), and affinity propagation (Zhang et al., 2011) as well as “Snowball sampling” has also been put forth (Wig et al., 2014). Under the image segmentation-based category, watershed by flooding (Gordon et al., 2014), random walker (Abraham et al., 2014), and region growing (Blumensath et al., 2013) have been investigated.
A general limitation with these unimodal approaches is that they do not capture other brain attributes, such as fiber pathways (serving as the physical substrate for functional interactions) that provide additional indication of how the brain is organized. Incorporating this information would presumably provide more reliable parcellation than using fMRI data alone. Toward this end, consensus maps have been generated from overlap among probabilistic parcellation maps that were derived from different modalities (Wang et al., 2015b; Zhang et al., 2010), and cortical surface parcellation approaches based on multimodal information have been recently proposed (Fan et al., 2016; Glasser et al., 2016; Parisot et al., 2016). These multimodal parcellations mostly combine information from functional (either task or resting state functional connectivity [FC] or topography information) and anatomical (either cortical architecture, myelin, or tractography-based connectivity) aspects either using multiplication of the edge costs where the candidate borders/edges were interpreted by the neuroanatomists to exclude artefacts (Glasser et al., 2016) or iteratively merging the parcellations from different modalities based on their consensus (Parisot et al., 2016). Most existing multimodal parcellations are presented in cortical surface space, which might limit their usage to the important studies on subcortical regions for clinical investigations.
In this article, we propose a multimodal approach for whole-brain parcellation in the volumetric format. We explore whether incorporating multimodal information would improve the unimodal brain parcellation. Our approach is based on the idea of connectivity fingerprint, in which voxels having similar connectivity patterns with the rest of the brain are assigned to the same parcels (Johansen-Berg et al., 2004). Grouping by connectivity, as opposed to, for example, functional homogeneity, has the advantage of capturing both local and longer range brain interactions. The connectivity patterns are derived from diffusion MRI (dMRI) (AC Estimation section) and fMRI (FC Estimation section) data with their connectivity value distribution having a nonlinear relationship mapped into a common value range (Distribution Normalization of AC and FC Estimates section). Then the connectivity information from two modalities are fused with their relative weighting adaptively and automatically determined based on voxel-wise test–retest reliability (MC Estimation Using Adaptive Weighting section).
Our rationale in incorporating anatomical connectivity (AC) into FC-based parcellation is that FC estimates tend to contain many false positive correlations due to structured noise arising from confounds such as head movements, whereas AC estimates tend to contain false negatives mainly due to the crossing fiber problem during tractography. Integrating FC and AC should help alleviate the problems linked to individual modalities since they carry different facets of information. Ncuts is then applied to generate multiscale brain parcellations (Clustering section). We further present a region level extension (Region Level Extension section) that uses whole-brain connectivity to separately parcellate predefined brain regions. This extension substantially reduces computational cost, while enabling incorporation of structural information on gyri and sulci.
The study in this article is a substantial extension to the strategy in our conference article (Wang et al., 2015a). We improved our multimodal connectivity (MC) estimation model by incorporating a reliability term from each of the multiple modalities, and extended our parcellation scheme from two brain regions to the whole brain. Besides, we proposed a region level extension that additionally incorporated the structural information into the multimodal model for multiscale parcellation. We also added a much wider range of evaluation metrics than the conference article on a bigger data set to validate our multimodal whole-brain parcellation approach.
We apply our approach on the human connectome project (HCP) data and compare it against a number of unimodal techniques (Craddock et al., 2012; Gordon et al., 2014; Shen et al., 2013), multimodal techniques (Fan et al., 2016; Glasser et al., 2016), and existing atlases (Desikan et al., 2006; Tzourio-Mazoyer et al., 2002) over a number of evaluation metrics. Multimodal parcellations, which encapsulate structural information, AC, and FC, display higher reproducibility, comparable/higher functional homogeneity, comparable/higher left out data likelihood, and moderate overlaps with cytoarchitectonic areas. Subnetworks extracted from the multimodal parcellations also matched well with known brain systems. Our results thus show benefits of incorporating brain attributes beyond FC into brain parcellation.
Materials and Methods
Data sets
Data sets from the HCP (Q2 and Q3) were used in this study. The data set release has data from 80 subjects. Data from three of the subjects were excluded due to structural abnormalities in the original data set. A total of 38 subjects were from the Q2 release, and the remaining 39 subjects were denoted as Q3. The data and scanning details can be found in Van Essen et al. (2013) and Supplementary Data (Supplementary Data are available online at
Data preprocessing
Preprocessing already applied to the HCP RS-fMRI data includes gradient distortion correction, motion correction, spatial normalization to Montreal Neurological Institute (MNI) space with nonlinear registration based on a single spline interpolation, and intensity normalization (Glasser et al., 2013). In addition, we regressed out motion artifacts, mean white matter and cerebrospinal fluid confounds, and principal components of high variance voxels using compCor (Behzadi et al., 2007). Next, we applied a band-pass filter with cutoff frequencies of 0.01 and 0.1 Hz. The data were further demeaned and normalized by the standard deviation.
Preprocessing already applied to the HCP dMRI data (Van Essen et al., 2013) includes B0 intensity normalization, echo-planar imaging distortion correction, eddy current correction, gradient nonlinearity correction, and motion artifacts removal (Glasser et al., 2013). We used constant solid angle—orientation distribution function for qBall reconstruction and global tractography (Neher et al., 2012). Details can be found in Supplementary Data.
Multimodal brain parcellation
Most existing parcellation methods use structural information (e.g., gyri and sulci), FC, or AC alone to group voxels into parcels. Each of these modalities has its inherent limitations. For instance, structural attributes might not relate to brain function, FC estimates are prone to false positives, and AC estimates are prone to false negatives. We thus examine whether combining information across these brain attributes could alleviate the limitations of each modality. We propose an approach for integrating multimodal information, as summarized in Figure 1, which involves the following:
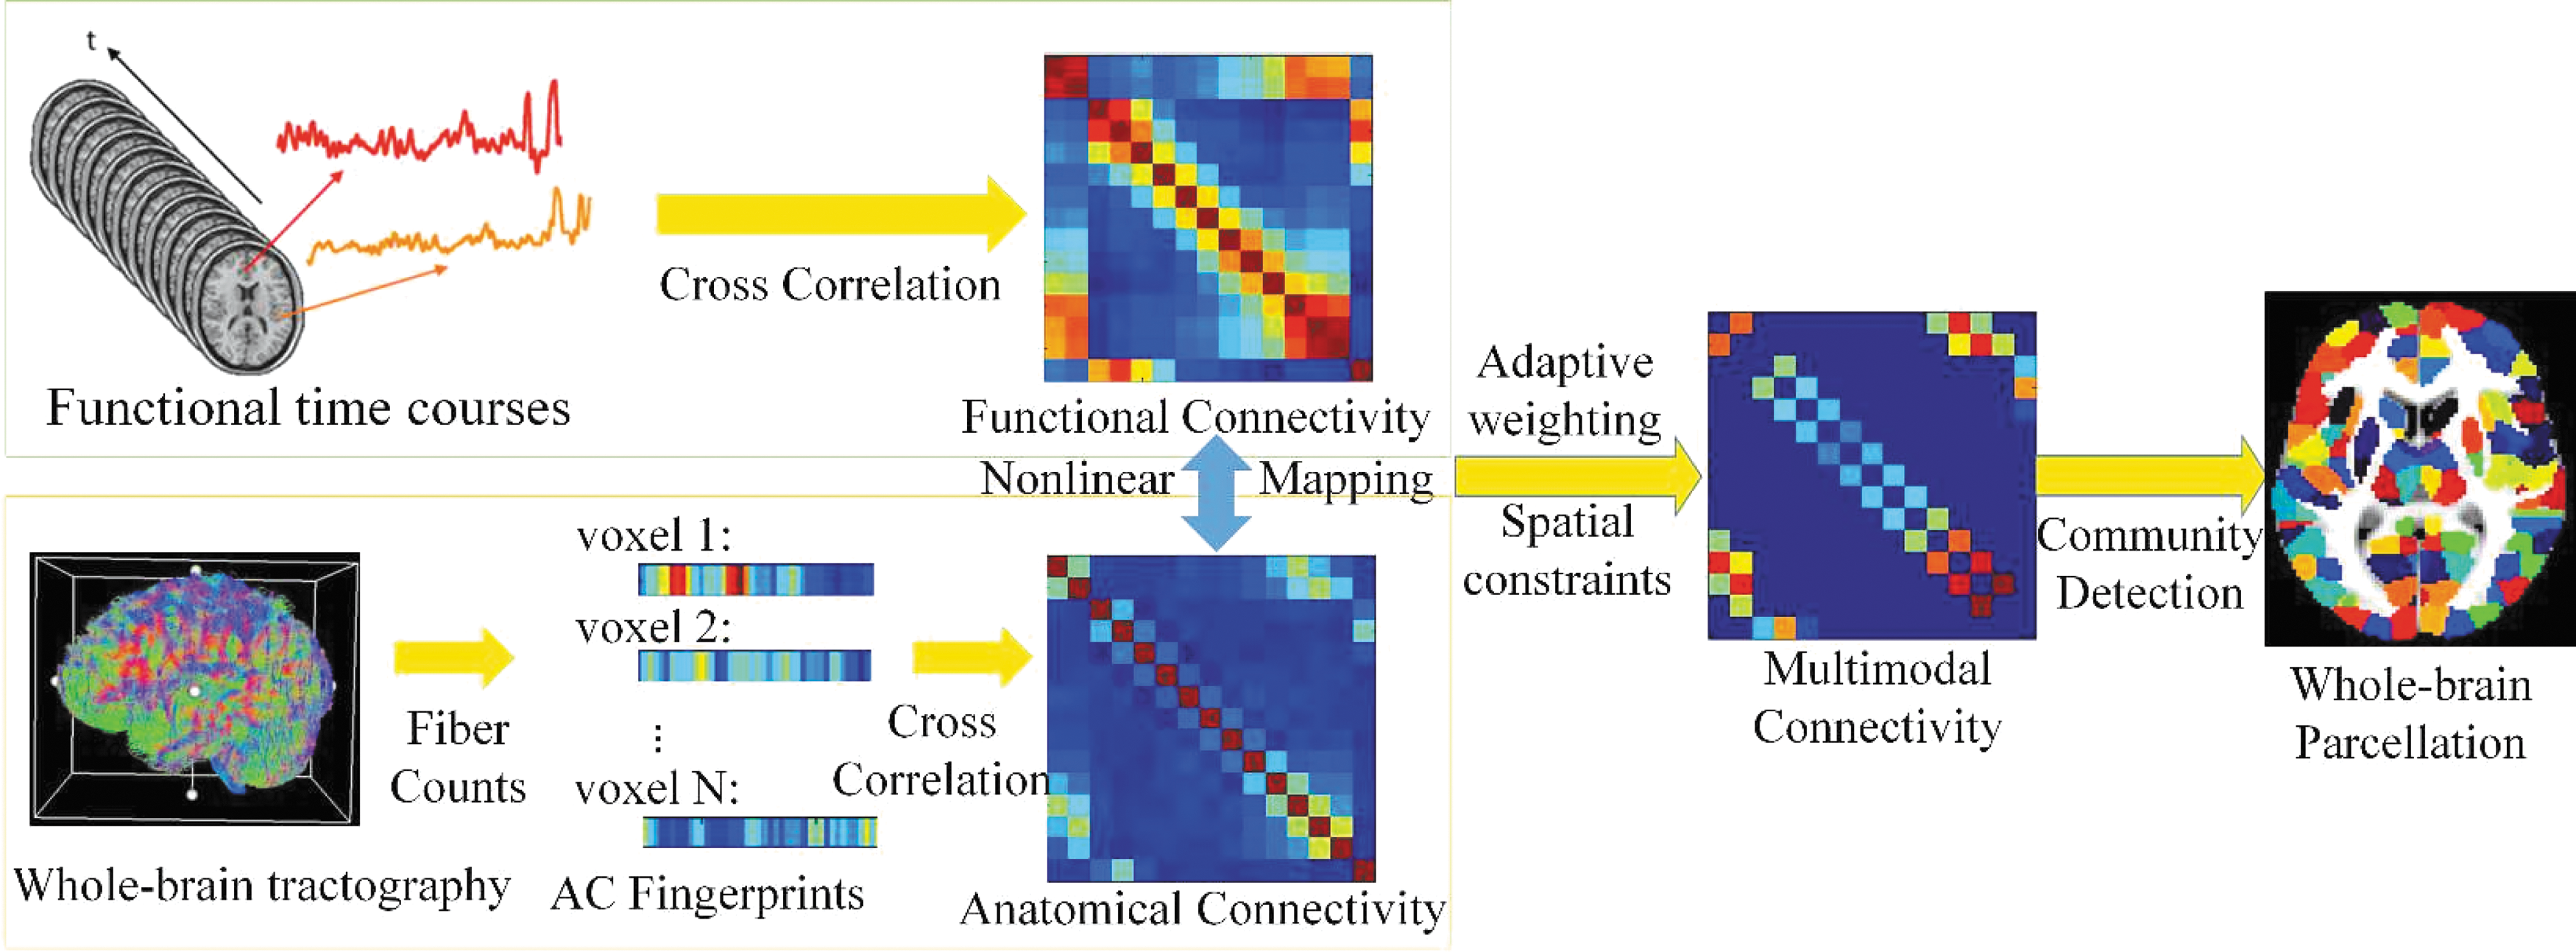
Flowchart of proposed approach for multimodal brain parcellation. AC and FC estimates are generated for each voxel to derive voxel-by-voxel connectivity matrices followed by a distribution normalization. The resulting matrices are integrated to generate MC estimates. Ncuts is applied on the integrated similarity matrices to generate whole-brain parcellation. AC, anatomical connectivity; FC, functional connectivity; MC, multimodal connectivity; Ncuts, Normalized cuts. Color images available online at
Generate AC and FC estimates for each voxel to derive voxel-by-voxel similarity matrices.
Map AC and FC estimates to a common value range using a distribution normalization function.
Integrate these matrices based on adaptive weighting, where the weights are derived from the reliability of the AC and FC estimates.
Apply standard clustering algorithms, such as Ncuts, on the integrated similarity matrices, to parcellate the brain.
Our multimodal approach can be used for both subject and group level parcellation. For subject parcellation, we derive the integrated similarity matrix from each subject's AC and FC estimates. For group level parcellation, we average the AC and FC estimates across subjects before AC–FC integration.
AC estimation
Given the estimated fiber tracts, we first define an AC fingerprint for each voxel (Johansen-Berg et al., 2004) as the number of tracts connecting that voxel to a set of target regions. Target regions can be taken as every other voxels or regions of interest (ROIs) from existing atlases.
We use the 112 regions in the well-established Harvard-Oxford (HO) atlas in this study, because HO atlas consists of the highest number of subjects with both manual and automatic labeling technique compared with other commonly used anatomical atlases (Bohland et al., 2009). Using the HO atlas as target regions has multiple advantages. First, this strategy reduces the number of unknowns to be estimated, that is, the number of elements in each AC fingerprint is reduced from >100,000 to 112. Second, using ROIs instead of voxels provides more tolerance for uncertainty in fiber end-point location (Jbabdi and Johansen-Berg, 2011). AC is then estimated as the cross-correlation between the AC fingerprints of each voxel pair. To constrain the parcels to be spatially contiguous, we keep only AC estimates of the 26 neighbors for each voxel.
FC estimation
Let X be a t × d matrix of RS-fMRI time courses, where t is the number of time points and d is the number of voxels. We generated FC matrices based on Pearson's correlation: CF = XTX/(t − 1). Again, for constraining the parcels to be spatially contiguous, we kept only FC estimates of the 26 neighbors for each voxel.
Distribution normalization of AC and FC estimates
It is important to note that naive combination of AC and FC values would not be suitable, since their estimates have different distributions, and there is a lack of straightforward correspondence between these two estimates. This difference is important to take into account to eliminate the risk of overweighting one modality over the other.
To ensure no possible overweighting in generating combined connectivity estimate occurs, we apply a nonlinear mapping based on distribution normalization to gain a better correspondence between the two modalities. We use histogram matching to match the distribution of AC values to that of FC (Wang et al., 2015a). Let a
1 ≤ a
2,…, ≤ aM
be the raw AC values and f1
≤ f2
,…, ≤ fM
be the FC values, where M is the number of voxel pairs, we compute the histograms of AC and FC values, denoted as random variable X and Y, respectively, as well as their cumulative distribution functions Fa
(x) = p(X ≤ x), x ∈ [a1, aM
] and Ff(y) = p(Y ≤ y), y ∈ [f1, fM
]. p(·) is the probability of a random variable, for example, X or Y takes on a value less than or equal to x or y. Next, we replace each AC value ai
with the FC value fj
, which satisfies Fa(ai) = Ff(fj) as
This distribution normalization procedure enables unbiased integration of AC and FC, where each mapped AC value is used in the MC estimation in MC Estimation Using Adaptive Weighting section.
MC estimation using adaptive weighting
To overcome the inherent limitations associated with each of the two modalities, we propose combining connectivity estimated from two modalities using an adaptive weighting scheme based on voxel-wise reliability:
where
where we construct a measure of connection reliability
We then generate local fingerprints for the two subsets and use their Pearson's correlation as the AC voxel reliability. Note that we use the information from the immediate 26 one-ring neighbors of a given voxel, as it has been shown that larger neighborhoods might make the analysis more prone to acquisition and registration artifacts (Honey et al., 2009). The reliability of an edge connection is implicitly bounded by one of the two end voxels having relatively lower reliability. As such, we define
Owing to the difficult interpretation of negative connectivity (Skudlarski et al., 2008), we set negative values in
where σ is the local average value of 1 −
Clustering
We apply Ncuts on
With regard to the number of parcels, instead of finding an “optimal” number, we adopt a multiscale perspective based on the number of time samples in typical fMRI data sets as well as based on the literature. In particular, the number of brain regions in human is estimated to be of the order of 100 or more using comparison study with nonhuman primates (Van Essen et al., 1998), and 200 or more based on evolution from early mammals to humans, where galagos appear to have at least 50 cortical areas, and as many as 129 areas have been proposed for macaque monkeys (Kaas, 2013). We examine a range of values {256, 512, 1024}. A total of 256 parcels are examined to compare with existing anatomical atlases, which have between 100 and 200 regions. A total of 512 parcels are selected based on prior studies on architectonic information (Van Essen and Ugurbil, 2012) and functional information (Tucholka et al., 2008) that suggest that the human brain comprises ∼500 regions. A total of 1024 parcels are chosen since ∼1000 parcels have also been used in studies to examine high-resolution parcellations (Honey et al., 2009).
Region level extension
We present here a simple region level extension of our parcellation approach that substantially reduces computational cost and simplifies the problem of parcel correspondence between subjects, while having a side advantage of incorporating structural information on gyri and sulci. Specifically, we decompose the whole-brain parcellation problem into multiple ROI parcellation subproblems, by separately parcellating each ROI of the HO atlas (which was derived based on structural MRI information). Exactly the same procedure used in whole-brain parcellation can be applied at region level. The number of parcels within each ROI is set based on the proportion of voxels in the brain covered by the given ROI.
Evaluation metrics
Reproducibility
Based on the assumption that a parcellation exists, the parcellation should presumably remain stable for each subject and consistent across subjects (Shen et al., 2010), we evaluate the parcellations on three types of reproducibility, namely intrasubject test–retest reliability, intersubject test–retest reliability, and subject–group consistency. To measure intrasubject test–retest reliability, we first divide the RS-fMRI data and dMRI data into two splits and generate two subject-specific parcellations from each data split. For functional data, we use two RS-fMRI scans to assess reproducibility. In terms of diffusion data, we propose a method for splitting a dMRI data set into two subsets to assess reproducibility, see details in Supplementary Data. We then compare the two parcellations using Dice similarity coefficient (DSC) (Dice, 1945).
DSC is defined as
For intersubject test–retest reliability, exactly the same procedures are performed except we compare group parcellations generated from random half splits of the subjects. Ten random splits are performed. Moreover, we assess the subject–group consistency with the same procedures by comparing each subject level parcellation and the group level parcellation.
Functional homogeneity
To assess functional homogeneity, we employ two metrics, namely connectivity homogeneity (Gordon et al., 2014) and temporal homogeneity (Shen et al., 2013). The first metric evaluates how much variance in the voxel FC patterns is captured by the largest principal component (FC principal component [pc] ratio). If all voxels within a parcel have similar FC patterns, then the largest principal component would capture a large proportion of the variance. The other metric (mean distance) evaluates the homogeneity of temporal patterns based on the Euclidean distance between the fMRI time course of each voxel within a parcel and the mean time course across all voxels within that parcel. If all voxels have similar temporal patterns, then their Euclidean distance from the mean should be small. For both metrics, the averages over parcels are reported.
Left out data likelihood
Accuracy of connectome estimation heavily depends on brain parcellation. Thus, another way to evaluate the parcellations is to assess the generalizability of connectivity estimates derived from one scan to an unseen scan. For this, we employ the left out log data likelihood (Schwarz, 1978; Thirion et al., 2014). Given a parcellation generated from the first scan (using both RS-fMRI and dMRI data for multimodal approach), we generate parcel time courses for each subject by averaging the voxel time courses within each parcel. Assuming a multivariate Gaussian distribution, we then estimate the inverse covariance,
where det(·) is the determinant, tr(·) is the trace, and n is the number of samples used to compute
Overlaps with cytoarchitecture
We examined the overlaps between our parcels and the areal borders of the Juelich probabilistic cytoarchitectonic mapping thresholded at 0.25. To avoid false boundary alignments arising from the structural constraints of the HO atlas, we assess overlaps between the cytoarchitectonic areas and multimodal group parcellation generated without using the region level extension.
Subnetwork extraction
To attach a functional meaning to the parcels, we group the parcels into subnetworks and correspond the subnetworks to established brain systems (Power et al., 2011). Specifically, we first compute the Pearson's correlation matrix between the RS-fMRI parcel time courses and apply a threshold of 0.2, which helps reduce the influence from nonsignificant connections (van den Heuvel et al., 2008). Ncuts is then applied to group the parcels. To set the number of subnetworks, we search from 5 to 45 at a step size of 1, and choose the value that maximizes modularity. The optimal number of subnetworks found with this scheme is 9. We also examine setting the number of subnetworks to 25 following previous studies (Power et al., 2011).
Results
We evaluated the proposed multimodal parcellation approach based on reproducibility, functional homogeneity, left out data likelihood, and cytoarchitectonic overlap. We further grouped the parcels into subnetworks and associated them with well-established brain systems (Power et al., 2011). Multimodal parcellations at various resolutions derived using the whole-brain and region level schemes as well as parcels' subnetwork labels are provided in the Supplementary Data.
For comparisons against our multimodal approach (MC), we examined unimodal parcellations based on FC, AC, and physical distance (DC), random parcellation (RM) with roughly equal-sized parcels (Zalesky et al., 2010), as well as other existing atlases based on functional information (Craddock et al., 2012; Gordon et al., 2014; Shen et al., 2013), anatomical information (Desikan et al., 2006; Tzourio-Mazoyer et al., 2002), and representative multimodal parcellations (Brainnetome atlas-BNT and HCP team developed multimodal parcellation-HCP) (Fan et al., 2016; Glasser et al., 2016). Unless stated otherwise, all results are based on parcellations generated using the region level extension for both unimodal and multimodal strategies with the number of parcels set to 512. The parcellation derived based on our multimodal approach at the 512 scale at the group level is shown in Figure 2a. All statistical comparisons are based on the Wilcoxon signed rank test with significance declared at an α of 0.05 with Bonferroni correction.
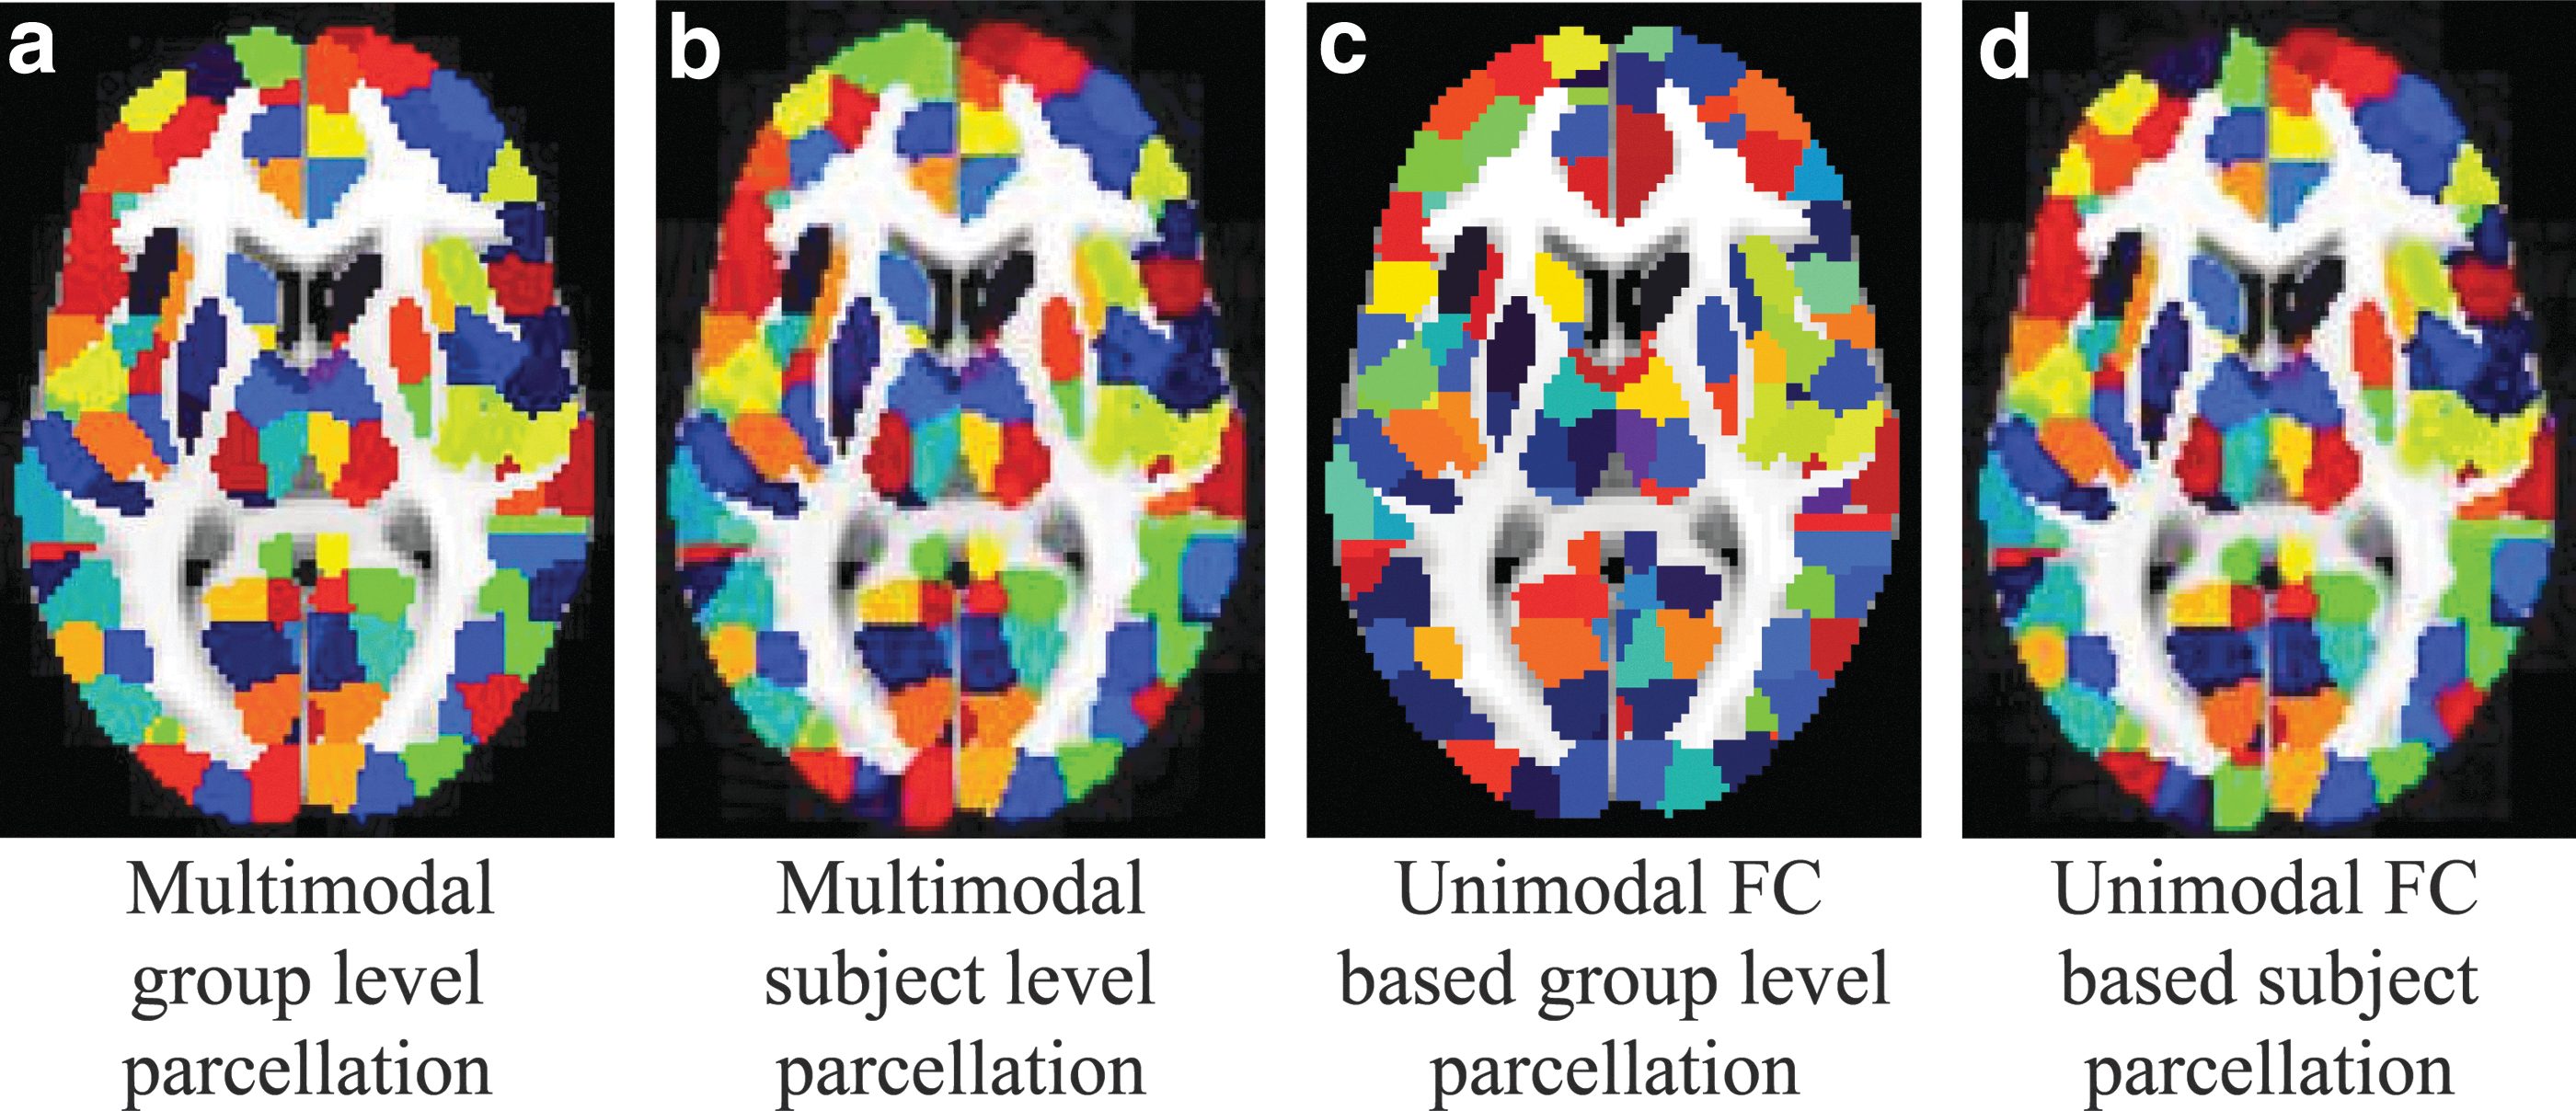
Group-wise parcellation and subject–group consistency. Both the parcellations based on the proposed multimodal approach (left two) and unimodal FC-based parcellations (right two) are displayed at 512 parcel scale in 2D using the “NIH” colormap in MRIcro. Second and fourth column: subject level parcellation having the lowest Dice similarity coefficient with the group parcellation. The proposed multimodal parcellations attain higher subject–group consistency
Reproducibility
We compared multimodal parcellations against those generated solely based on fMRI data. Multimodal parcellations achieved an intrasubject test–retest reliability of 0.949 ± 0.009, which is significantly higher (p = 0.00475) than that generated with the unimodal FC approach (0.939 ± 0.011). The same trend was observed with the number of parcels set to 256 (MC: 0.980 ± 0.0078 against FC: 0.978 ± 0.0078 at p = 0.0017), and 1024 (MC: 0.9091 ± 0.01 against FC: 0.9040 ± 0.01 at p = 1.46e-7), Figure 3.
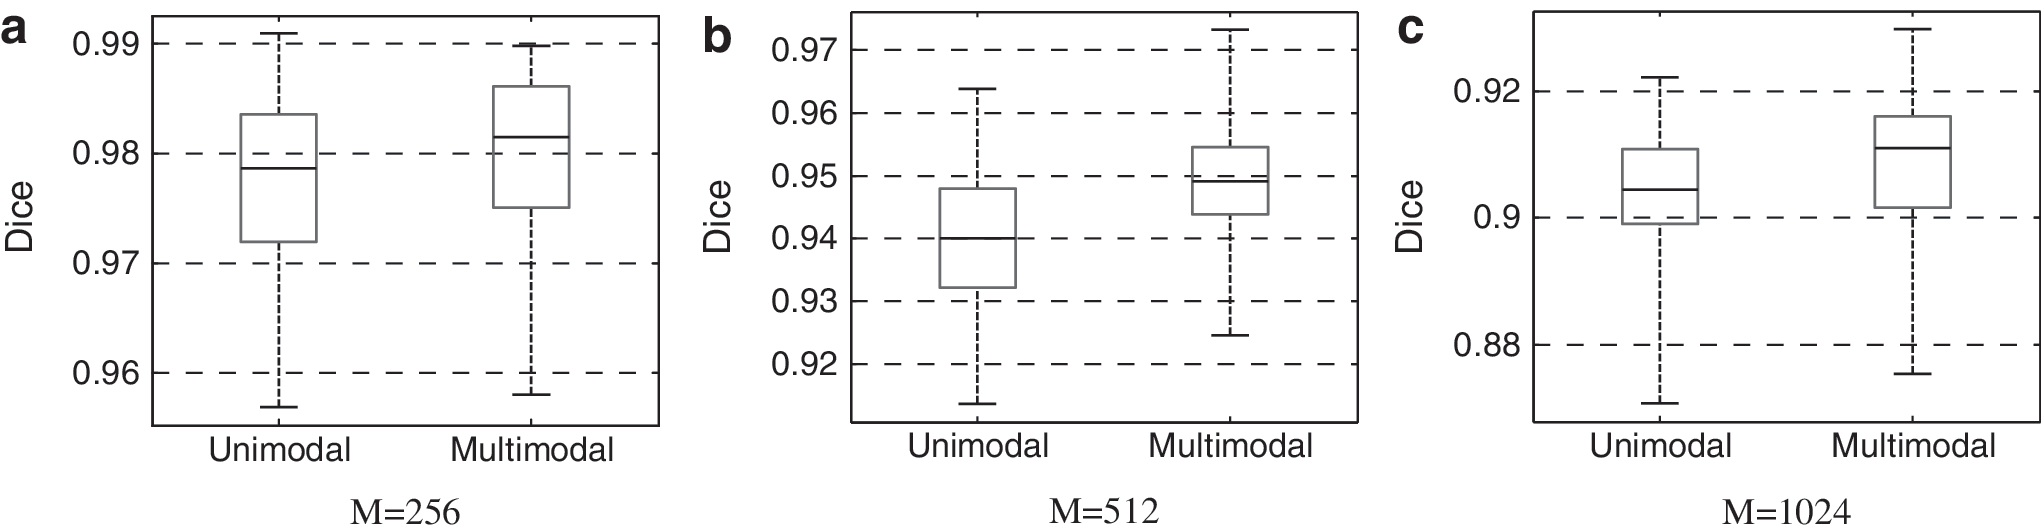
Intrasubject test–retest reliability using the Dice coefficient as the evaluation criterion. The number of parcels was set to 256, 512, and 1024, respectively
Multimodal parcellations achieved a significantly higher intersubject test–retest reliability of 0.9507 ± 0.0049 (p = 0.0098) compared with that of FC-based parcellations (0.9419 ± 0.0053). The trend persisted with the number of parcels set to 256 (MC: 0.9906 ± 0.0022 against FC: 0.9799 ± 0.0030 at p = 0.0020), and 1024 (MC: 0.9336 ± 0.0026 against FC: 0.9178 ± 0.0038 at p = 0.0019). We observed the difference of intersubject test–retest reliability in different brain regions, Figure 4.
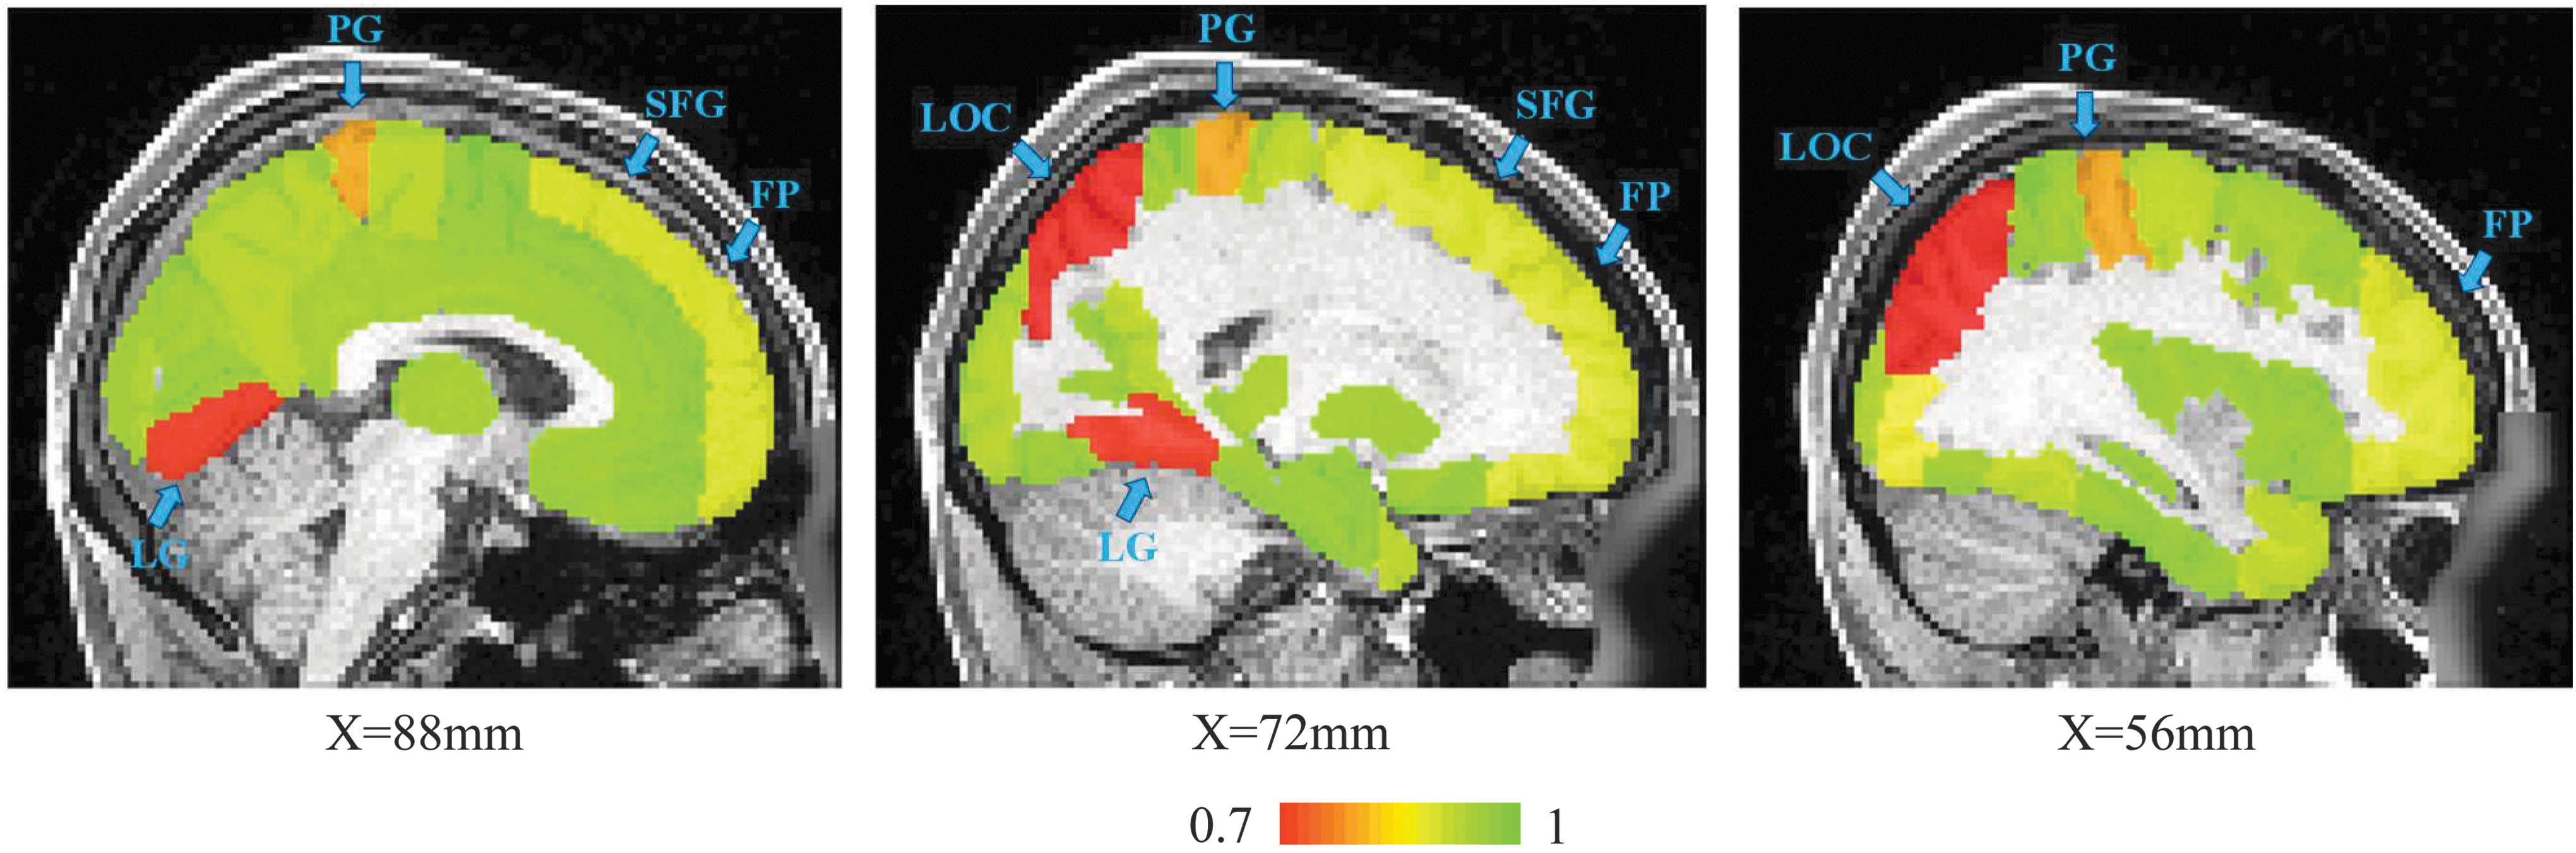
The intersubject test–retest reliability (range from low red to high green) of each brain region of the HO atlas (only shown on sagittal slices X = 88, 72, and 56 mm as exemplars). Regions, such as the LG, LOC, PG, FP, and SFG, show relatively lower reproducibility. FP, frontal pole; HO, Harvard-Oxford; LG, lingual gyrus; LOC, lateral occipital cortex; PG, postcentral gyrus; SFG, superior frontal gyrus. Color images available online at
Multimodal approach significantly improved the subject–group consistency from 0.872 ± 0.0099 for the unimodal approach to 0.883 ± 0.0105 (p = 0.00138) at the scale of 512 parcels. We observed a similar trend with the number of parcels set to 256 (MC: 0.8876 ± 0.0127 against FC: 0.8826 ± 0.0129 at p = 2.46 e-14) and 1024 (MC: 0.5098 ± 0.011 against FC: 0.5069 ± 0.011 at p = 1.523e-13).
Qualitatively, we compared the subject parcellation having the lowest similarity with the group parcellation based on DSC (the worst case). We observed that multimodal parcellations have higher subject–group consistency than its unimodal counterpart (Fig. 2). To more clearly illustrate the differences, we plotted the parcellations of an exemplar ROI, namely the frontal pole of the right hemisphere in Figure 5. Major differences between the subject (Fig. 5c) and the group parcellations (Fig. 5b) were observed for the unimodal approach in both the number of parcels and the parcel boundaries, whereas substantially more consistent parcels were found with the multimodal approach (Fig. 5d, e)).
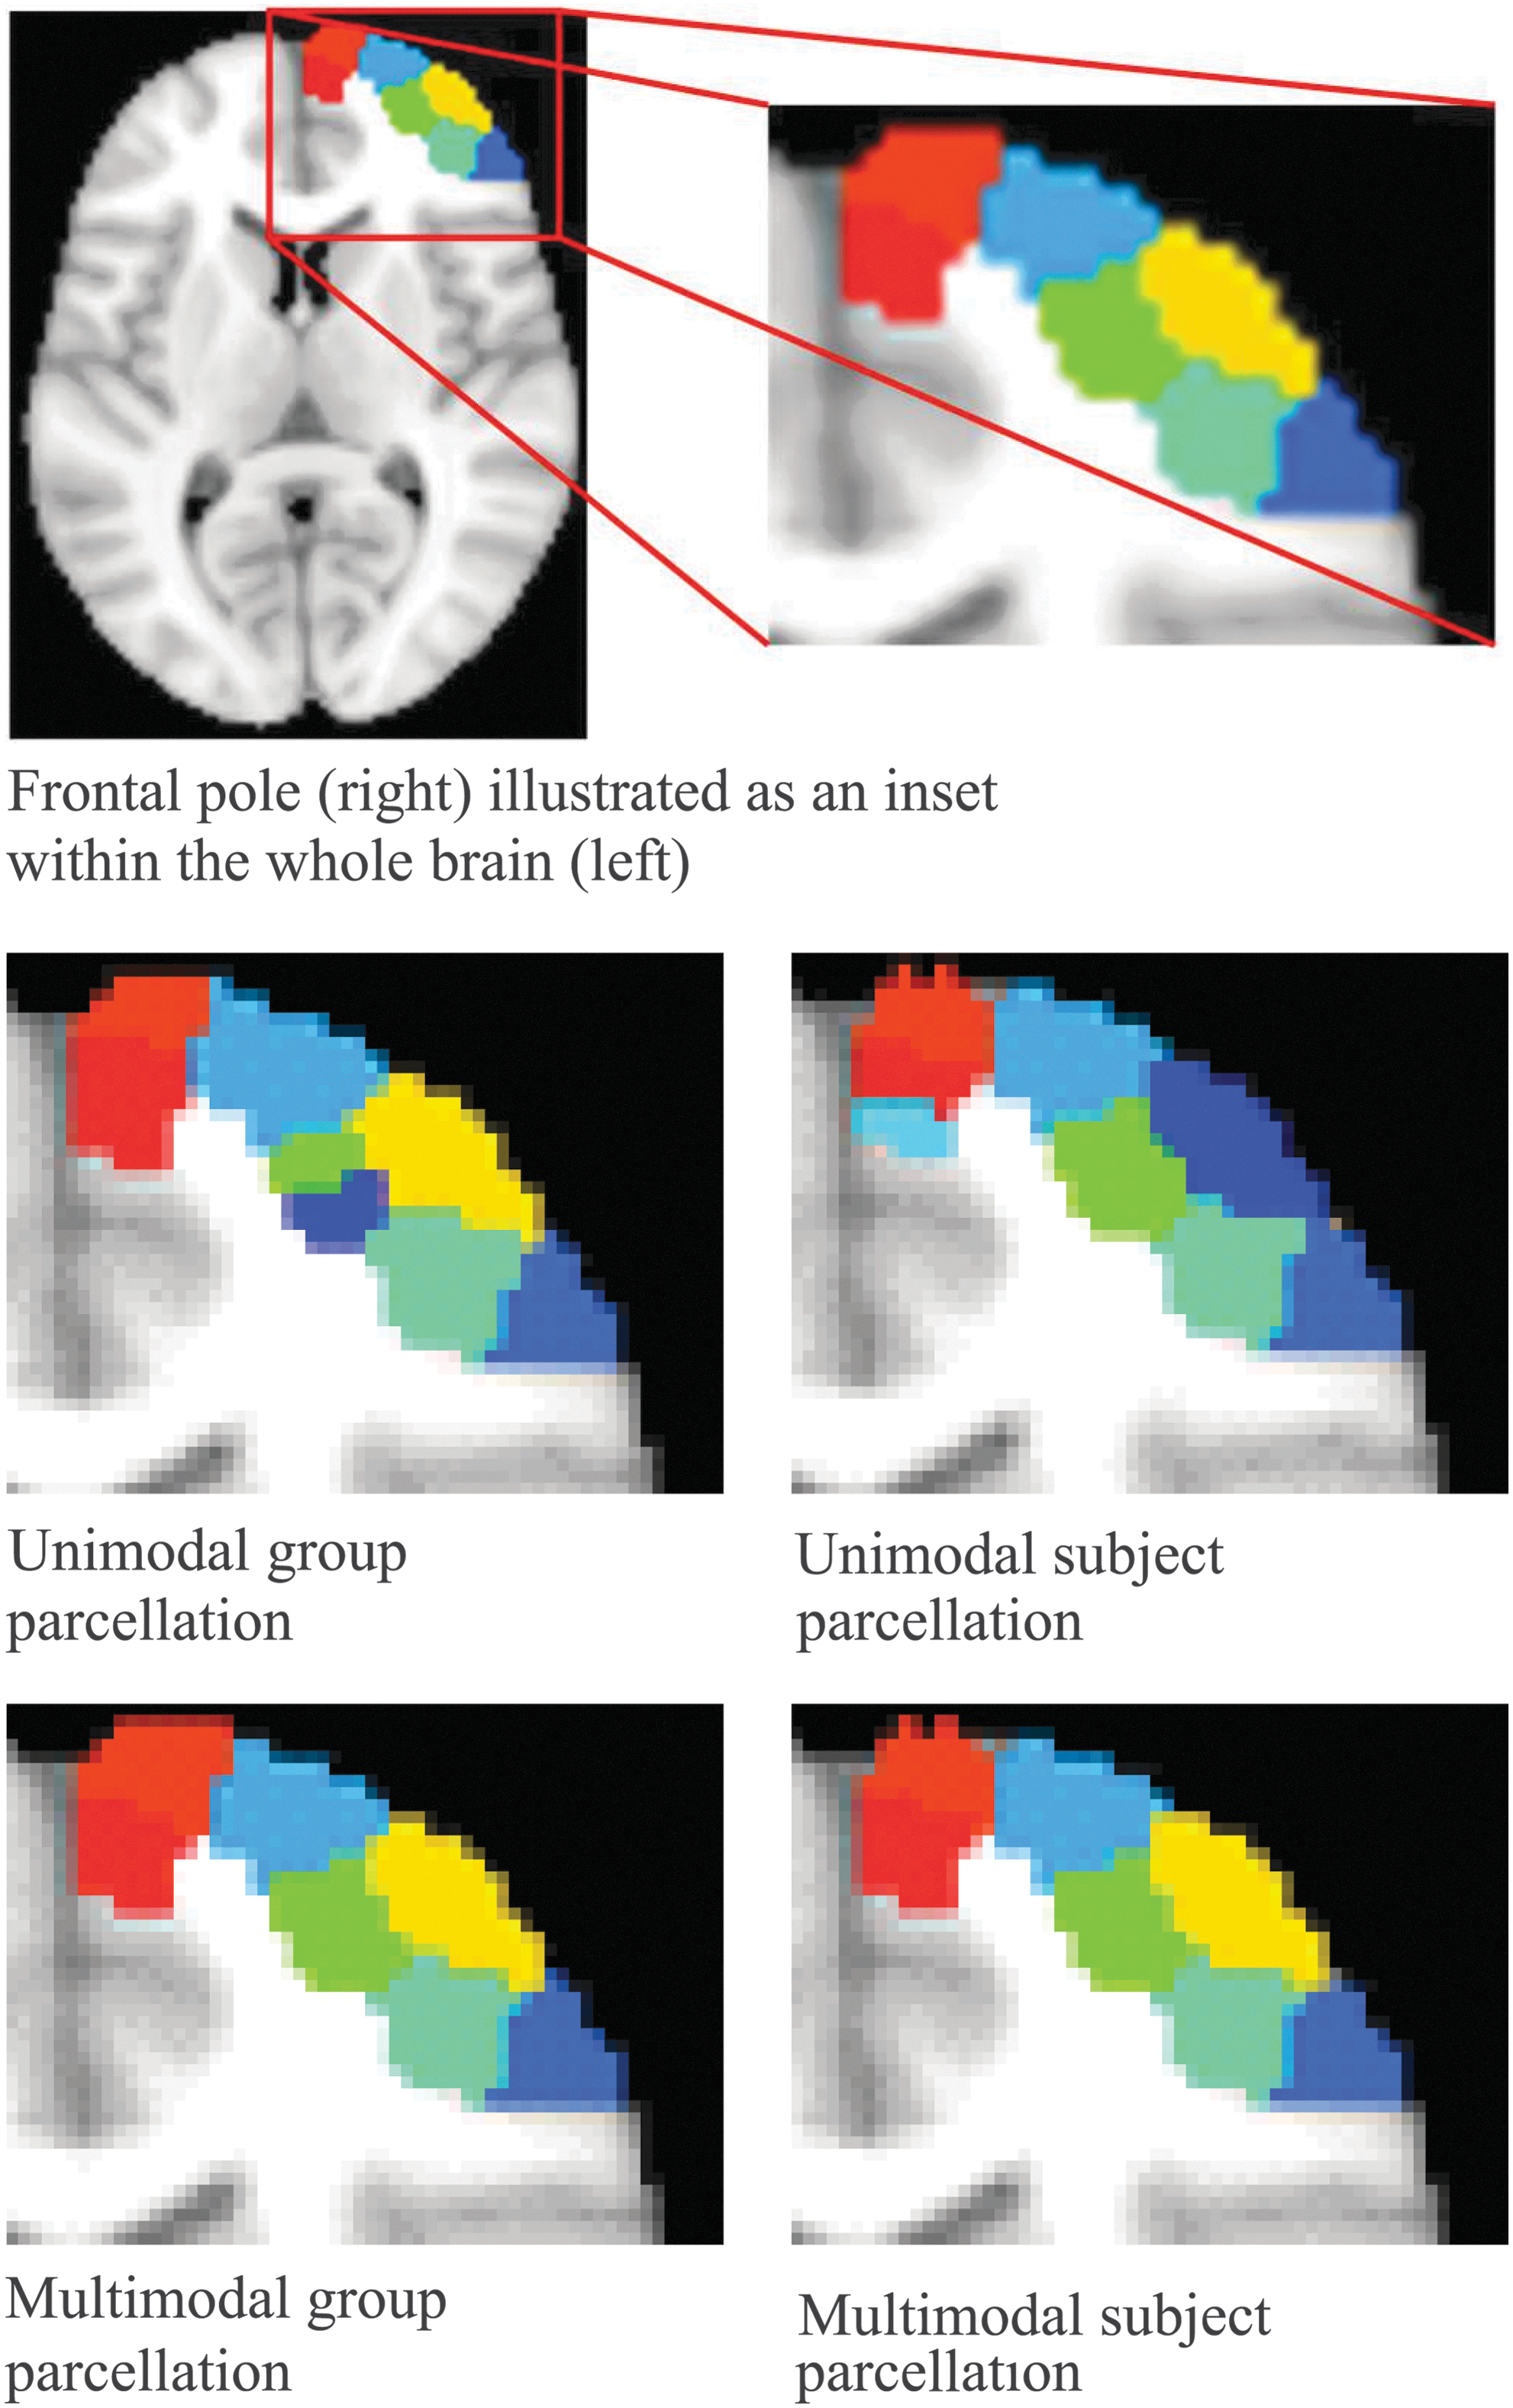
Subject–group consistency. Second row: FC-based unimodal parcellation. Third row: Multimodal parcellation with proposed approach. Left column: group parcellation of frontal pole. Right column: subject parcellation of frontal pole having the lowest Dice coefficient with the group parcellations. Color images available online at
Functional homogeneity
Multimodal parcels achieved significantly higher functional homogeneity in both FC pc ratio and mean distance (0.3751 and 67.2022) than those based on AC (0.3681 and 67.4321), DC (0.3695 and 67.6756), and RM (0.3461 and 68.1732), and comparable with parcels based on FC (0.3750 and 67.2028), Figure 6. A similar trend was observed with the number of parcels set to 256 and 1024.
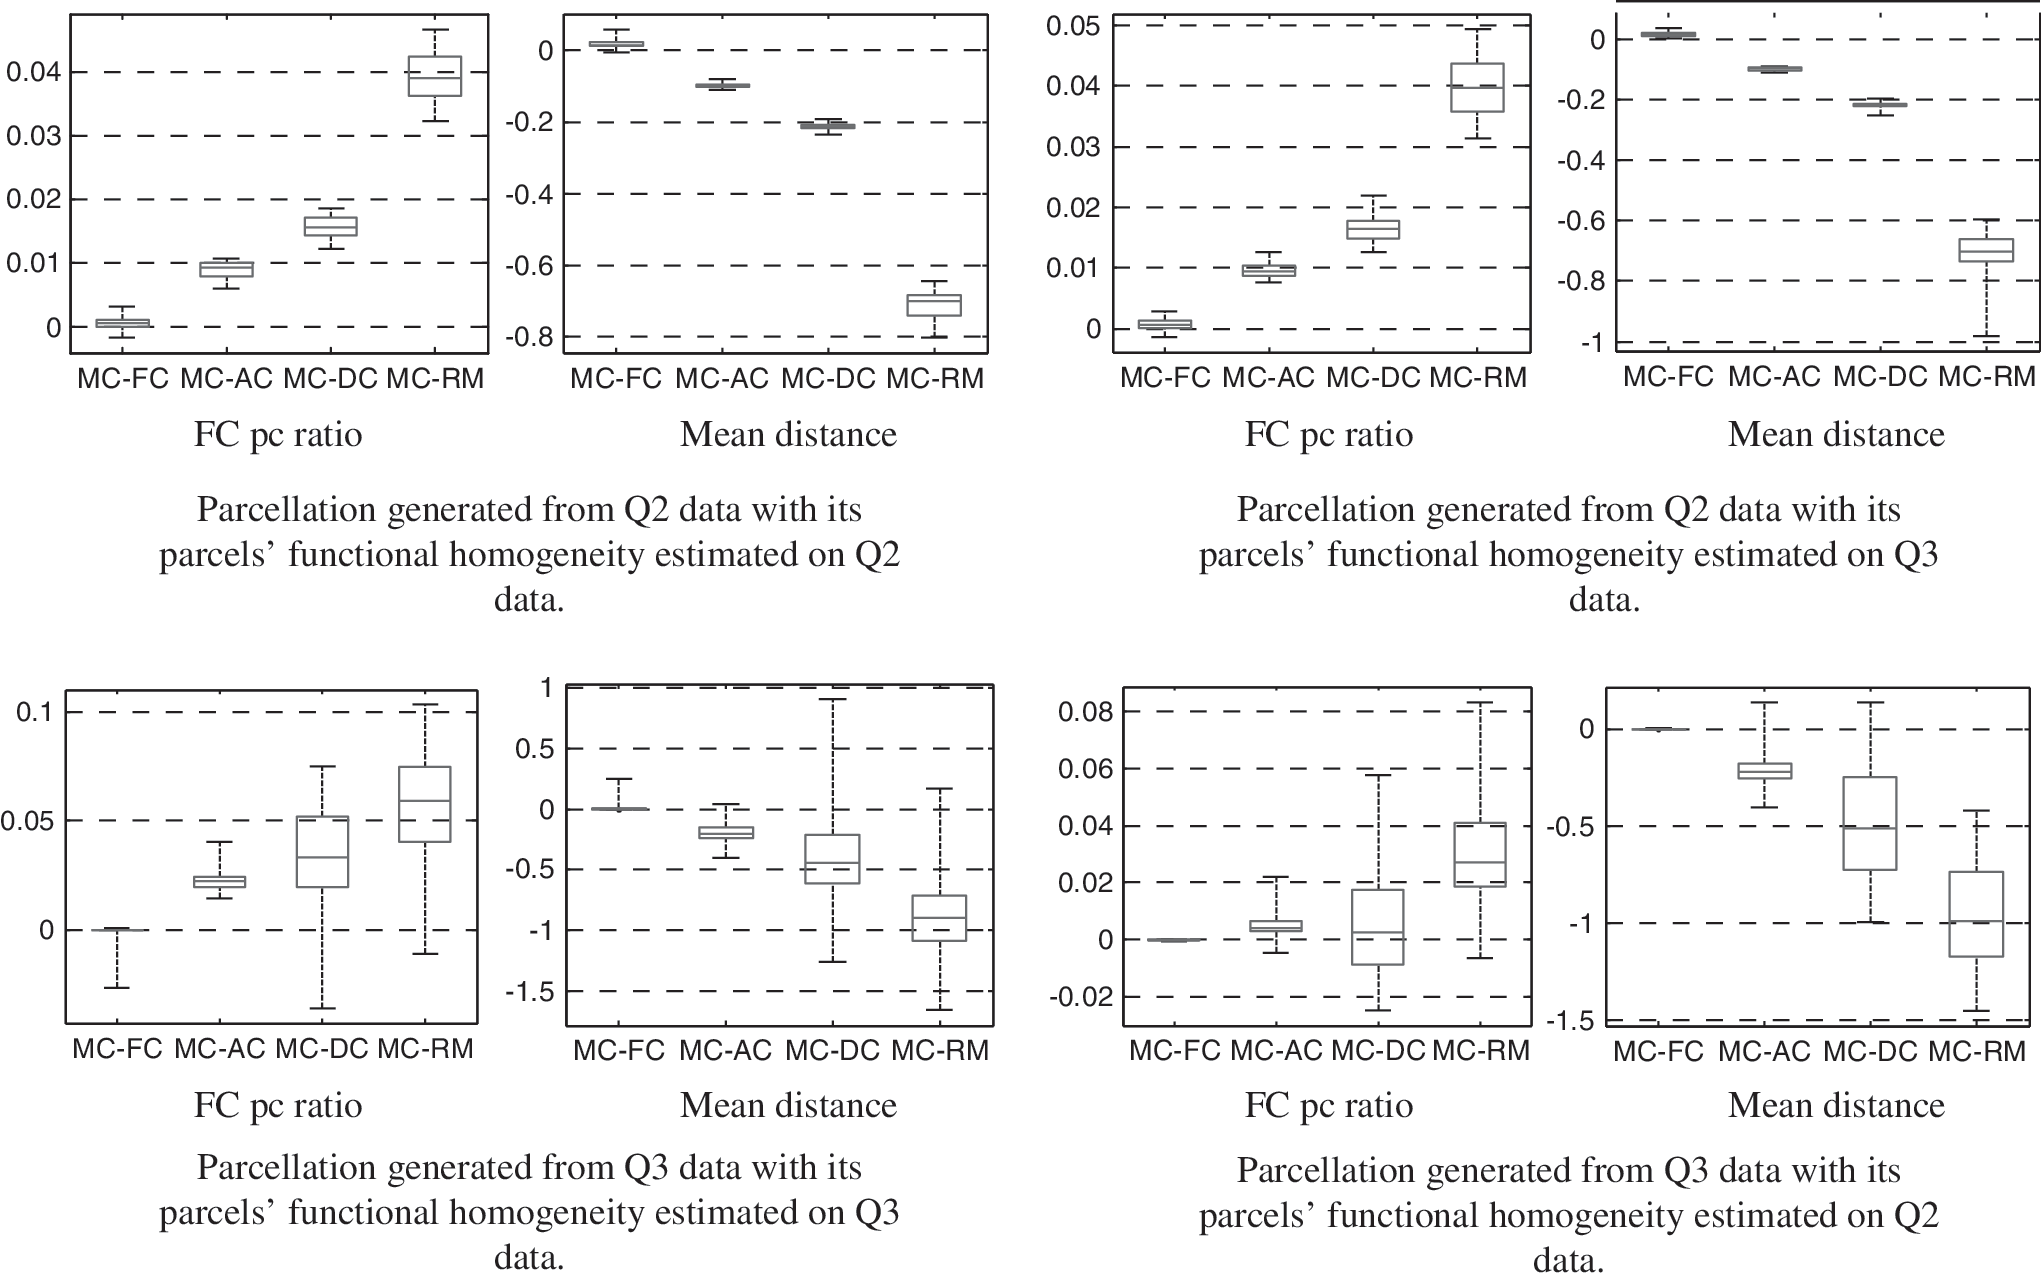
Functional homogeneity comparisons between multimodal and unimodal parcellations. To show consistent gain in each case of comparisons, plots of MC-FC, MC-AC, MC-DC, and MC-RM are provided. Positive FC pc ratio and negative mean distance indicate higher functional homogeneity gained from multimodal parcellations. Number of parcels was set to 512. Multimodal parcels achieved significantly higher functional homogeneity in both FC pc ratio and mean distance, see text for details. DC, geometric distance-based parcellation; RM, random parcellation.
When the number of parcels was set to 256, multimodal parcels achieved significantly higher functional homogeneity in both FC pc ratio and mean distance (0.3493 and 67.0495) than AC (0.3482 and 67.1005), DC (0.3393 and 67.4590), and RM (0.3335 and 67.4682) at p < 0.05 based on the Wilcoxon signed rank test, and comparable with parcels based on FC (0.3493 and 67.0497). When the number of parcels was set to 1024, multimodal parcels achieved significantly higher functional homogeneity in terms of both FC pc ratio and mean distance (0.3942 and 66.7457) than FC (0.3938 and 66.7591), AC (0.3936 and 66.7536), DC (0.3937 and 66.7883), and RM (0.3819 and 67.0490) at p < 0.05.
To compare against existing atlases (Craddock et al., 2012; Desikan et al., 2006; Fan et al., 2016; Glasser et al., 2016; Gordon et al., 2014; Shen et al., 2013; Tzourio-Mazoyer et al., 2002), we also generated parcellations with comparable number of parcels. Details on existing anatomical and functional atlas can be found in Supplementary Table S1 and Supplementary Figure S1. To measure the interparcellation spatial similarity between our parcellations and representative existing atlases, we computed the normalized mutual information (NMI) of the parcel labels. The NMI between the contrasted atlases and our parcellations (with comparable number of parcels) are 0.7322 for automatic anatomical labeling (AAL), 0.7743 for HO, 0.8060 for Gordon, 0.8150 for Shen, 0.7913 for Craddock, 0.7949 for BNT, and 0.7076 for HCP. Our parcellations thus by and large resemble the contrasted atlases.
Our multimodal parcellations achieved significantly higher functional homogeneity compared to existing atlases, Figure 7. The only exception is when being compared to Gordon's atlas (Gordon et al., 2014), our parcellation perform on par with p = 0.2372 in terms of for FC pc ratio (details shown in Supplementary Fig. S4). Gordon's atlas' higher functional homogeneity is likely due to the bias arising from parcellating only a thin shell of the cortex (i.e., more voxels would introduce more variability; Supplementary Fig. S1). Thus, to more directly compare against Gordon's atlas, we adjusted the experiment, where we randomly bootstrap the same number of voxels from the most matched parcels in our multimodal parcellations to the Gordon's parcels.

Functional homogeneity comparison between multimodal parcellations and existing atlases. Number of parcels for multimodal parcellation was set to the exact number of parcels in the contrasted atlas. Contrasted atlases included HO (112 parcels), AAL (116 parcels), Gordon's (333 parcels), Shen's (268 parcels), Craddock (190 parcels), Brainnetome atlas BNT (246 parcels), and HCP multimodal atlas (360 parcels). Multimodal approach achieved significantly higher homogeneity against the contrasted atlases. AAL, automatic anatomical labeling; HCP, human connectome project.
The average homogeneity of our randomly picked voxels for 50 bootstraps outperformed that of the Gordon's parcels with p = 5.141e-5 for FC pc ratio and p = 7.740e-5 for mean distance, details shown in Figure 7. The average homogeneity improvement using our parcellation in terms of FC pc ratio across seven existing atlases is 7.23% (8.54% for AAL, 11.39% for HO, 1.99% for Gordon, 9.54% for Shen, 9.26% for Craddock, 3.54% for BNT, and 6.34% for HCP).
Left out data likelihood
The mean left out log data likelihood of multimodal parcellations was higher than that of FC and AC though not statistically significant (p = 0.53 and p = 0.37). RM and DC attained higher left out log data likelihood than AC, FC, and MC. The trend moderately changed with the number of parcels set to 256 and 1024. Specifically, at the scale of 256 parcels, the likelihood of MC was higher than FC and DC, and significantly higher than AC. At the scale of 1024 parcels, the likelihood of MC was significantly higher than FC, AC, and DC (Fig. 8). In this study, RM and DC at some scales perform better due to the regular sampling of volume of interest from parcels with roughly equal size (Thirion et al., 2014).
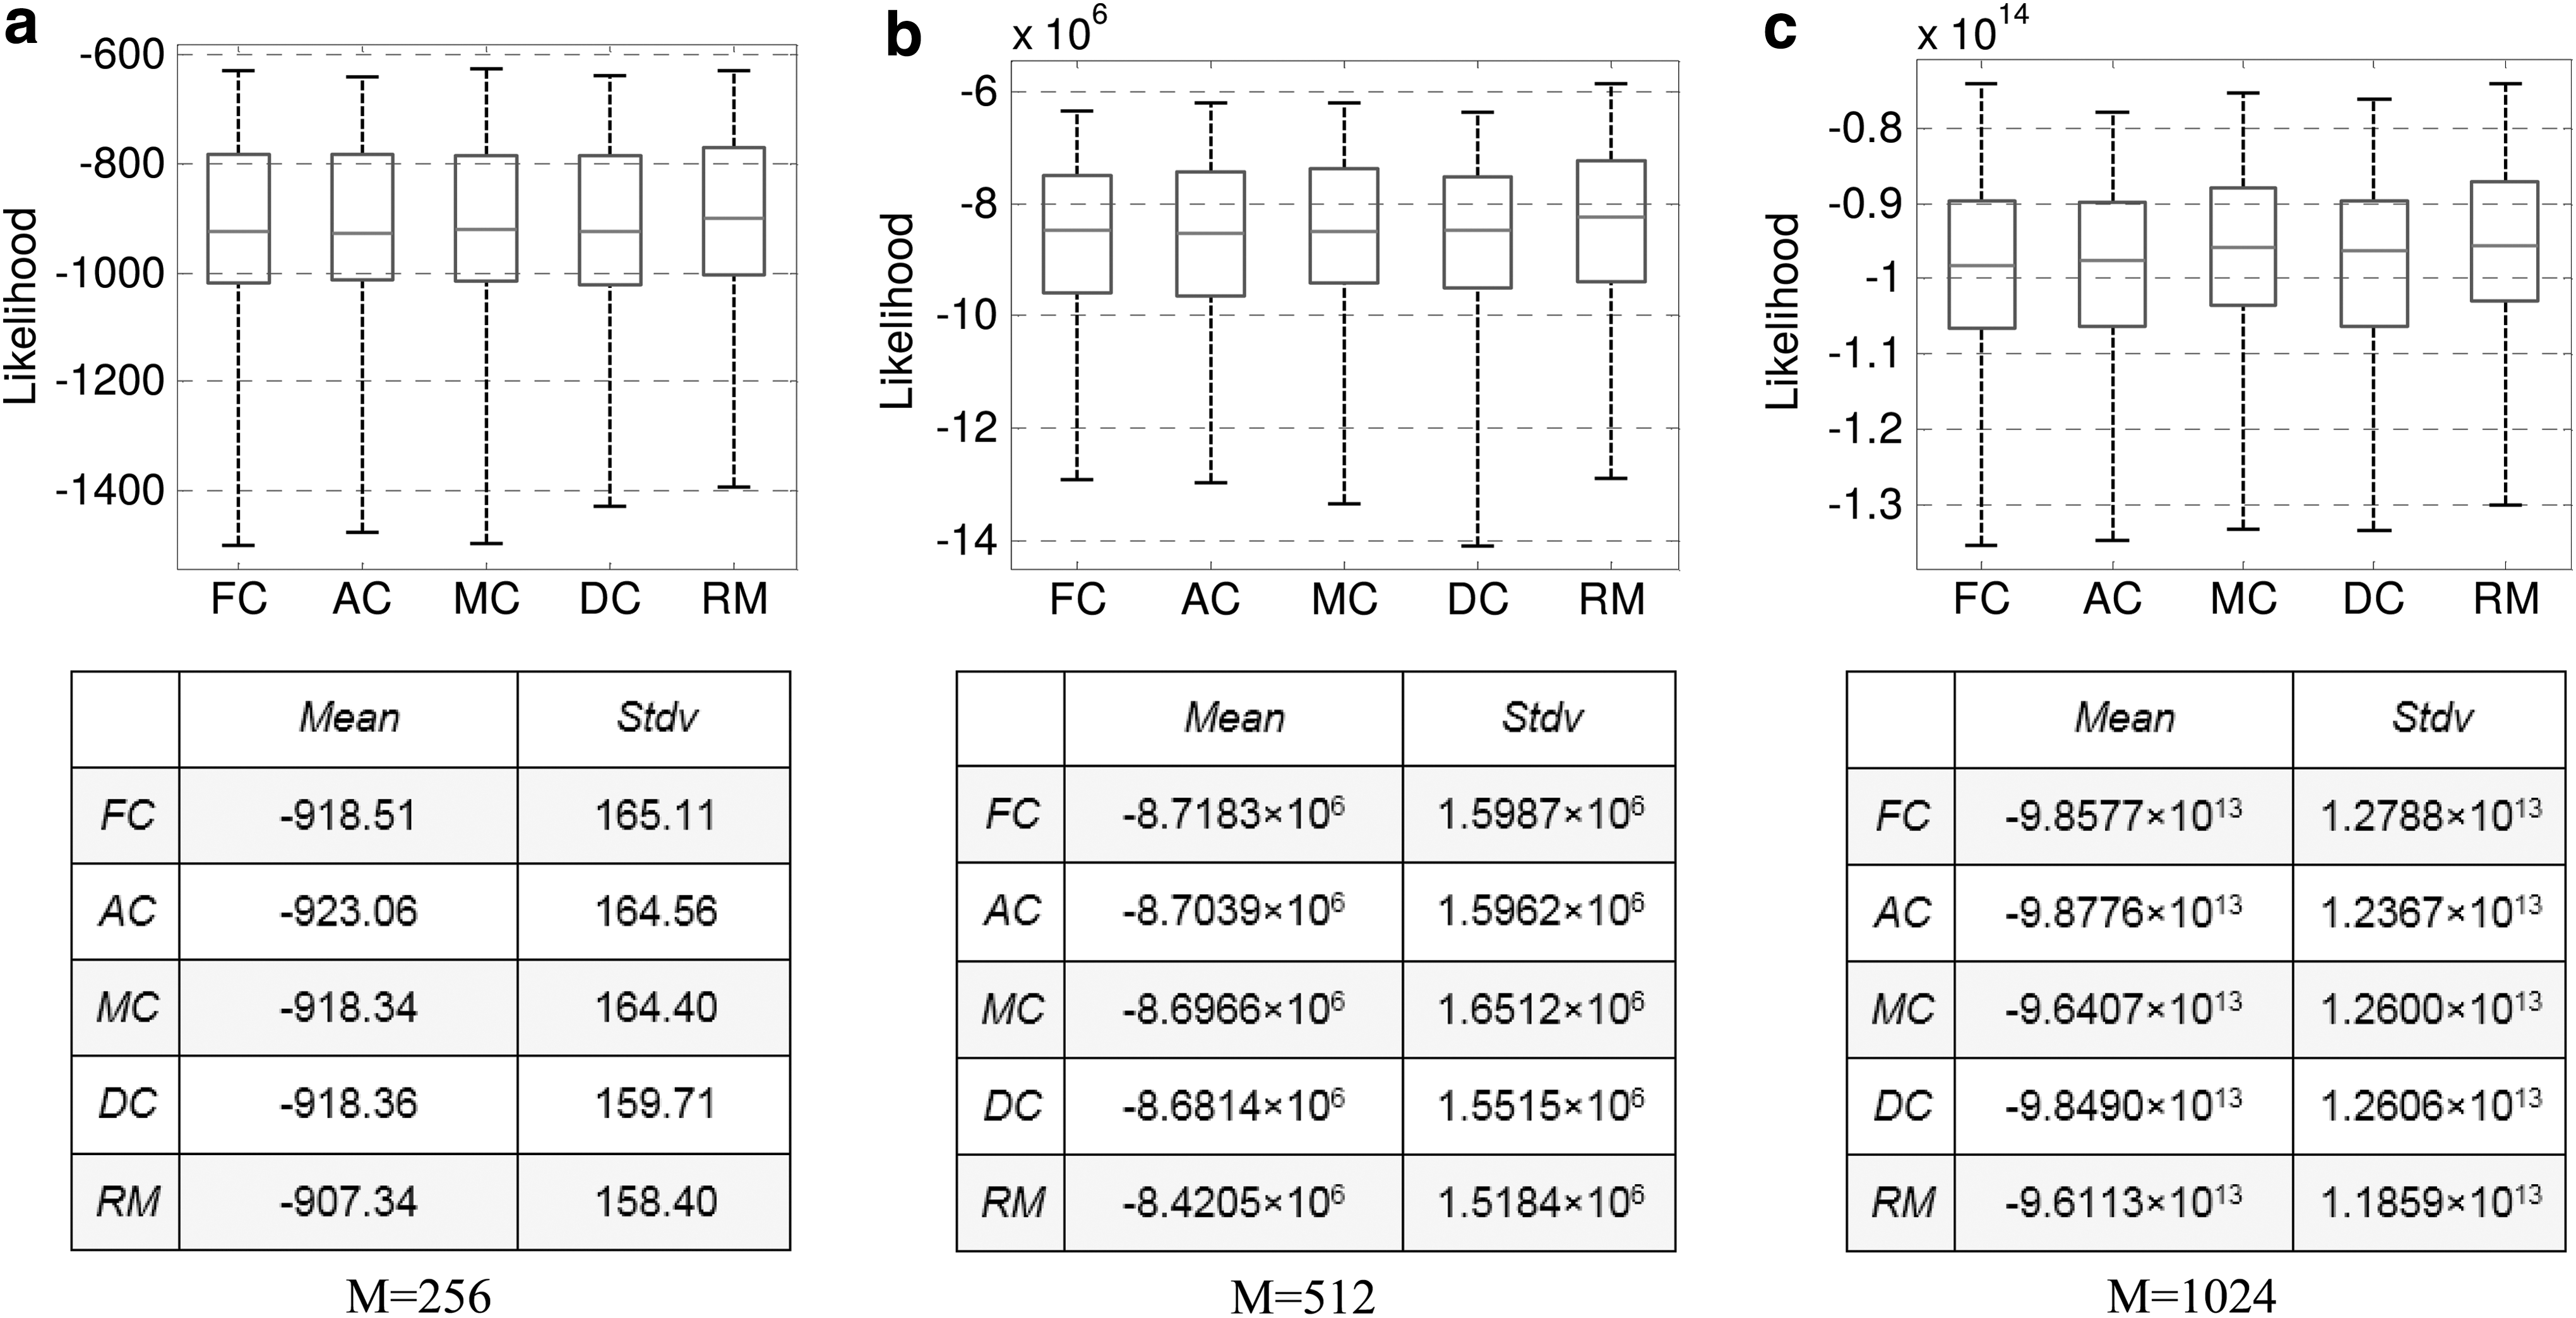
Left out log data likelihood comparison between multimodal and unimodal parcellation. Number of parcels was set to 256, 512, and 1024, respectively.
Overlaps with cytoarchitecture
We examined whether multimodal parcellations (without applying the region level extension) match cytoarchitectures (Fischl et al., 2008), Figure 9. For clearer visualization, we mapped the multimodal parcellations from MNI space to the Population-Average, Landmark- and Surface-based (PALS) midthickness surface using the Caret software (Van Essen et al., 2012). We note that we focused on a few well-established areas, namely the primary somatosensory cortex including area 1, 2 and 3a and 3b; premotor cortex including area 6; visual cortex area including V1, V2, V3v, V4; and V5 and BA 44/45 area, since the Juelich atlas does not cover the whole brain. We also acknowledge that certain areas in the cytoarchitecture atlas are subject to high intersubject variability.
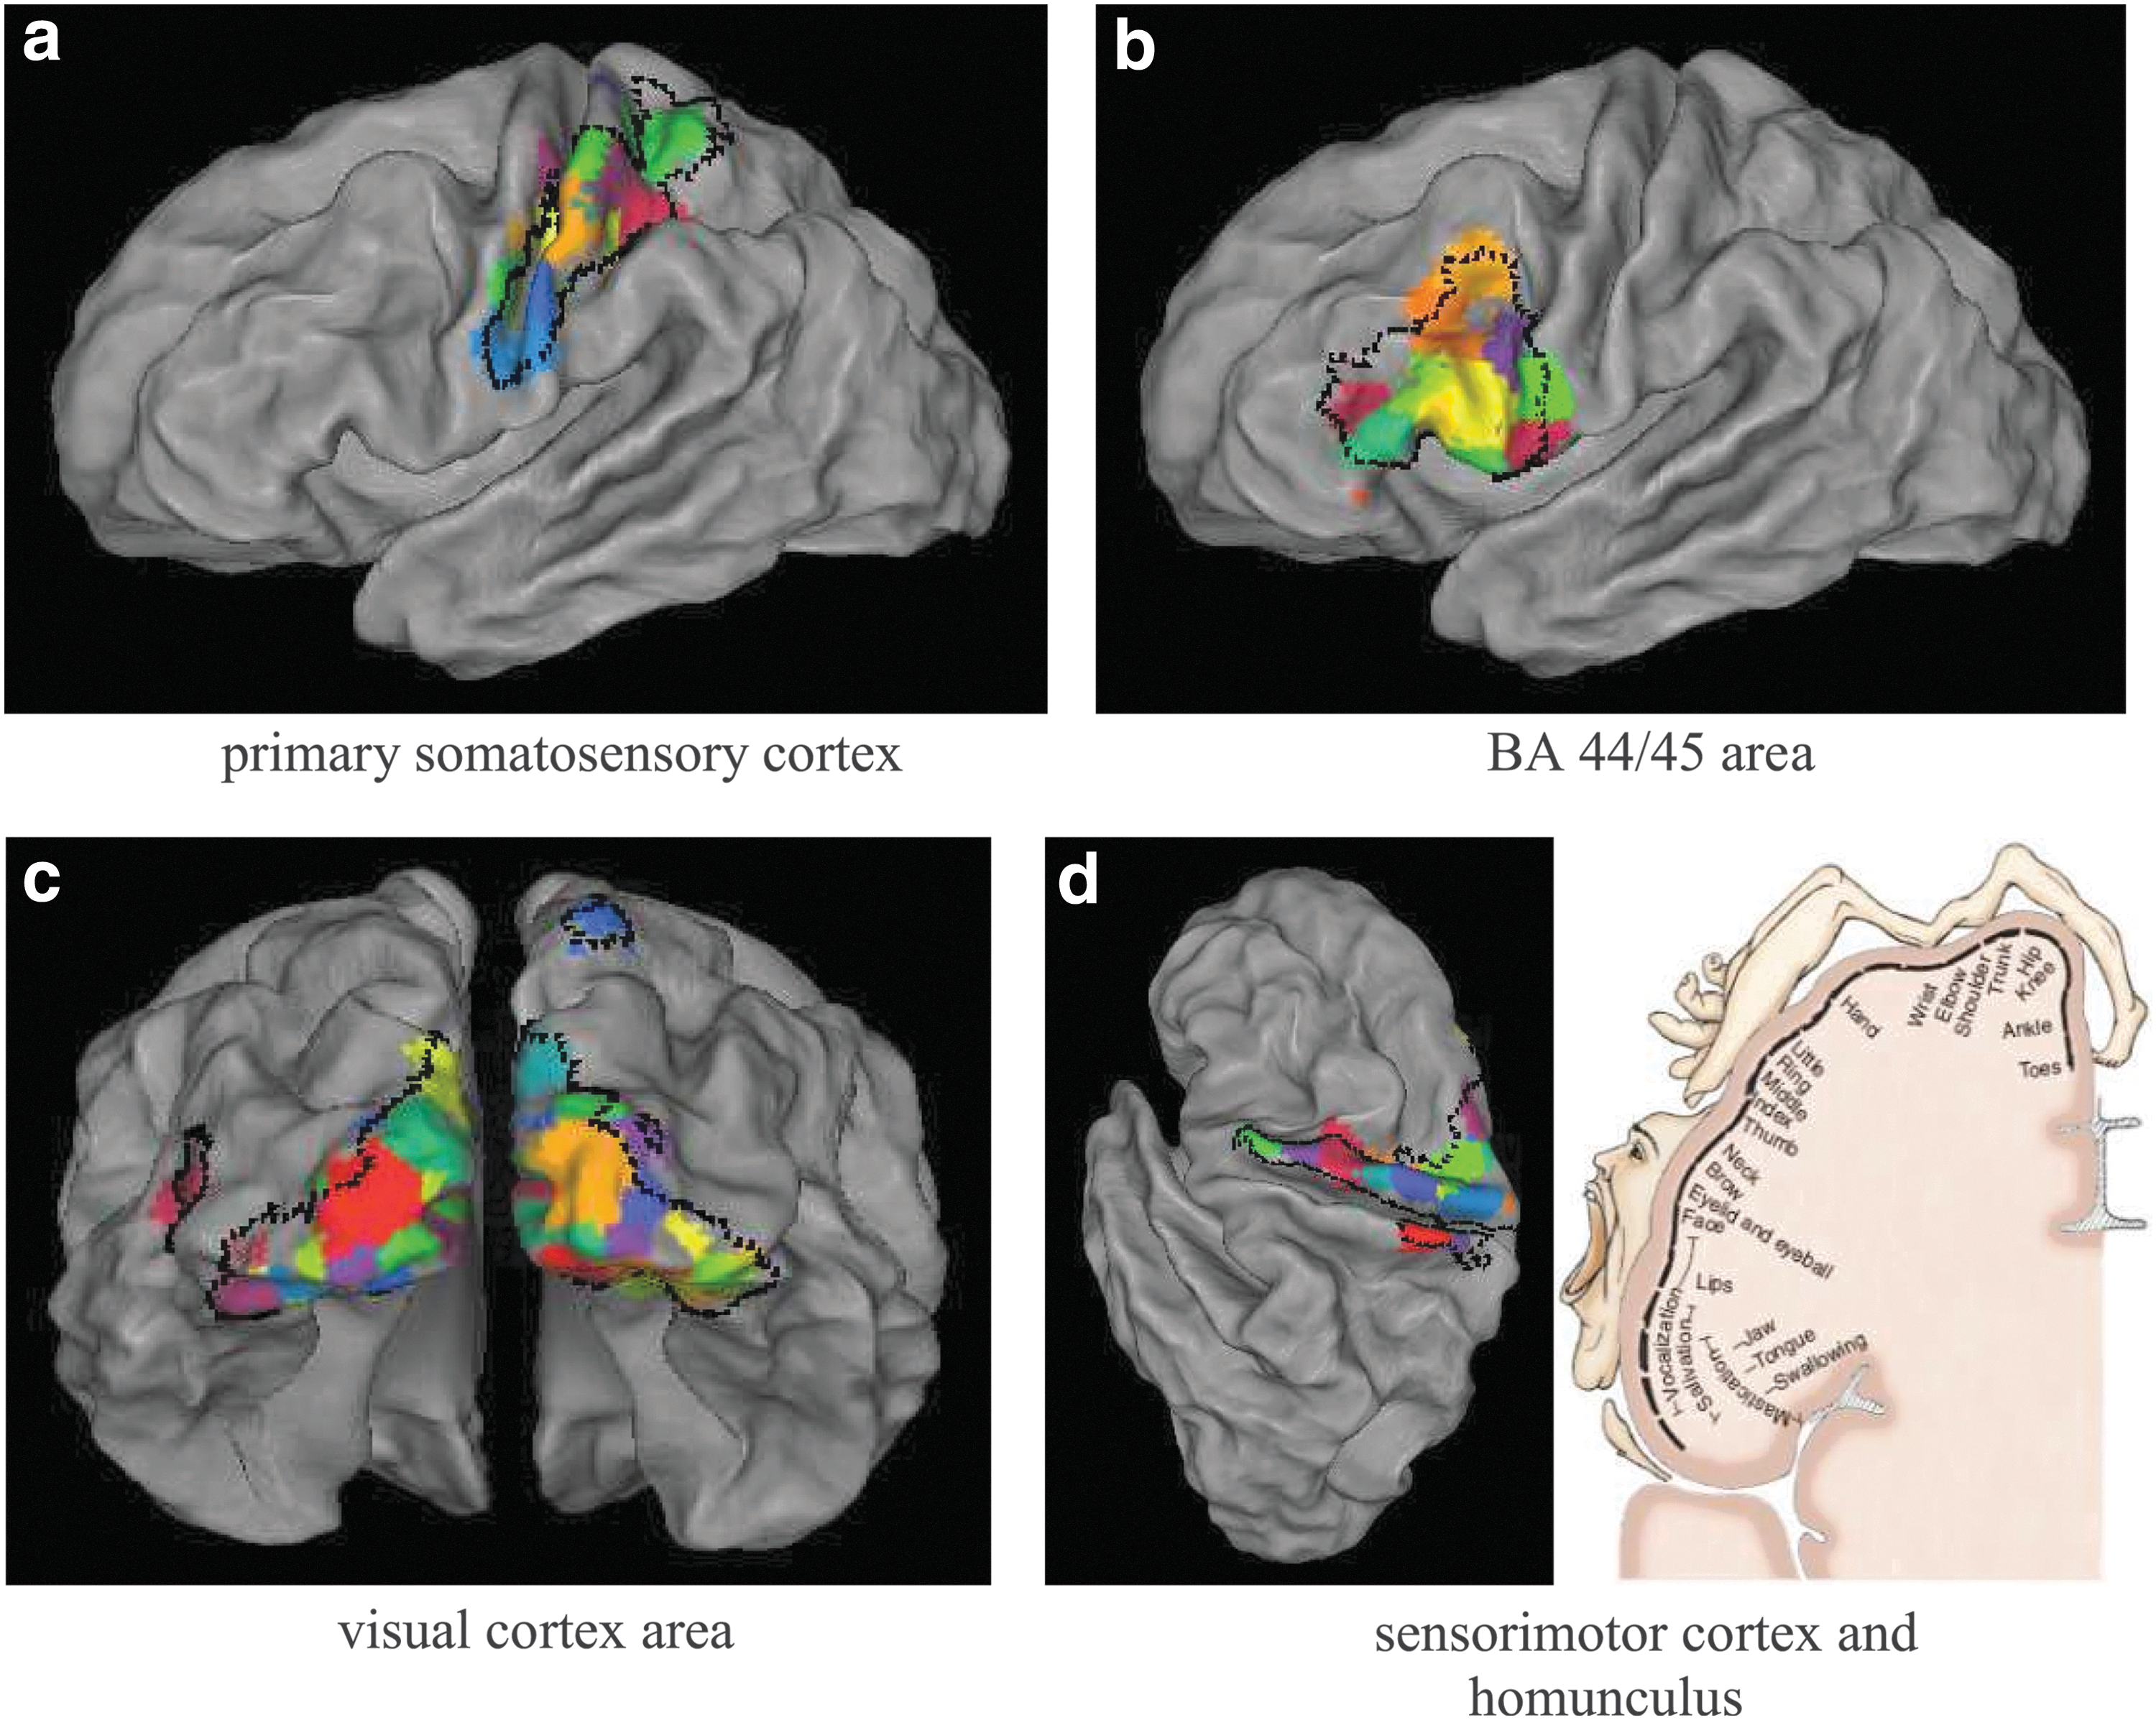
Comparison of the parcel boundaries with exemplar cytoarchitectonic areas
The areas in cytoarchitectonic atlas are bordered in black dotted lines, and parcels having at least 70% volume overlap with the cytoarchitectonic areas are displayed in solid color based on the “RGBYR” colormap in Caret.
The parcel boundaries align well with the primary somatosensory area, although part of the parcels extended into the posterior boundaries of the postcentral gyri, Figure 9a. The Broca's area (BA 44/45) is largely covered by the parcels, with part of the parcels extending into the frontal cortex, Figure 9b. The parcels also conformed well to the histological areas for the majority of the visual cortex, especially the primary visual cortex across the central visual field, Figure 9c. For outer visual cortex area, the parcels slightly extend beyond the histological areas. Also, the parcels well cover the histological areas of sensorimotor areas with each parcel approximately corresponding to a functional subdivision of the motor map that represents a different part of the human body, the homunculus (John Wiley & Sons, Inc., n.d.), Figure 9d.
Network structure
We annotate functions to the multimodal parcels, then the users can more easily describe and interpret their results, for example, parcels in the primary motor network were found active. Following (Power et al., 2011), we grouped the parcels into 25 subnetworks, Figure 10a. At this resolution, we found the Visual Network (two subnetworks in purple and spring green), Auditory Network (grass green), “Hand” Somatosensory-Motor Network (yellow), “Mouth” Somatosensory-Motor Network (purple blue connected to yellow), Dorsal Attention Network (orange), Frontoparietal Task Control Network (blue), and Default Mode Network (red in frontal lateral and medial area, posterior lateral area, and posterior medial area).
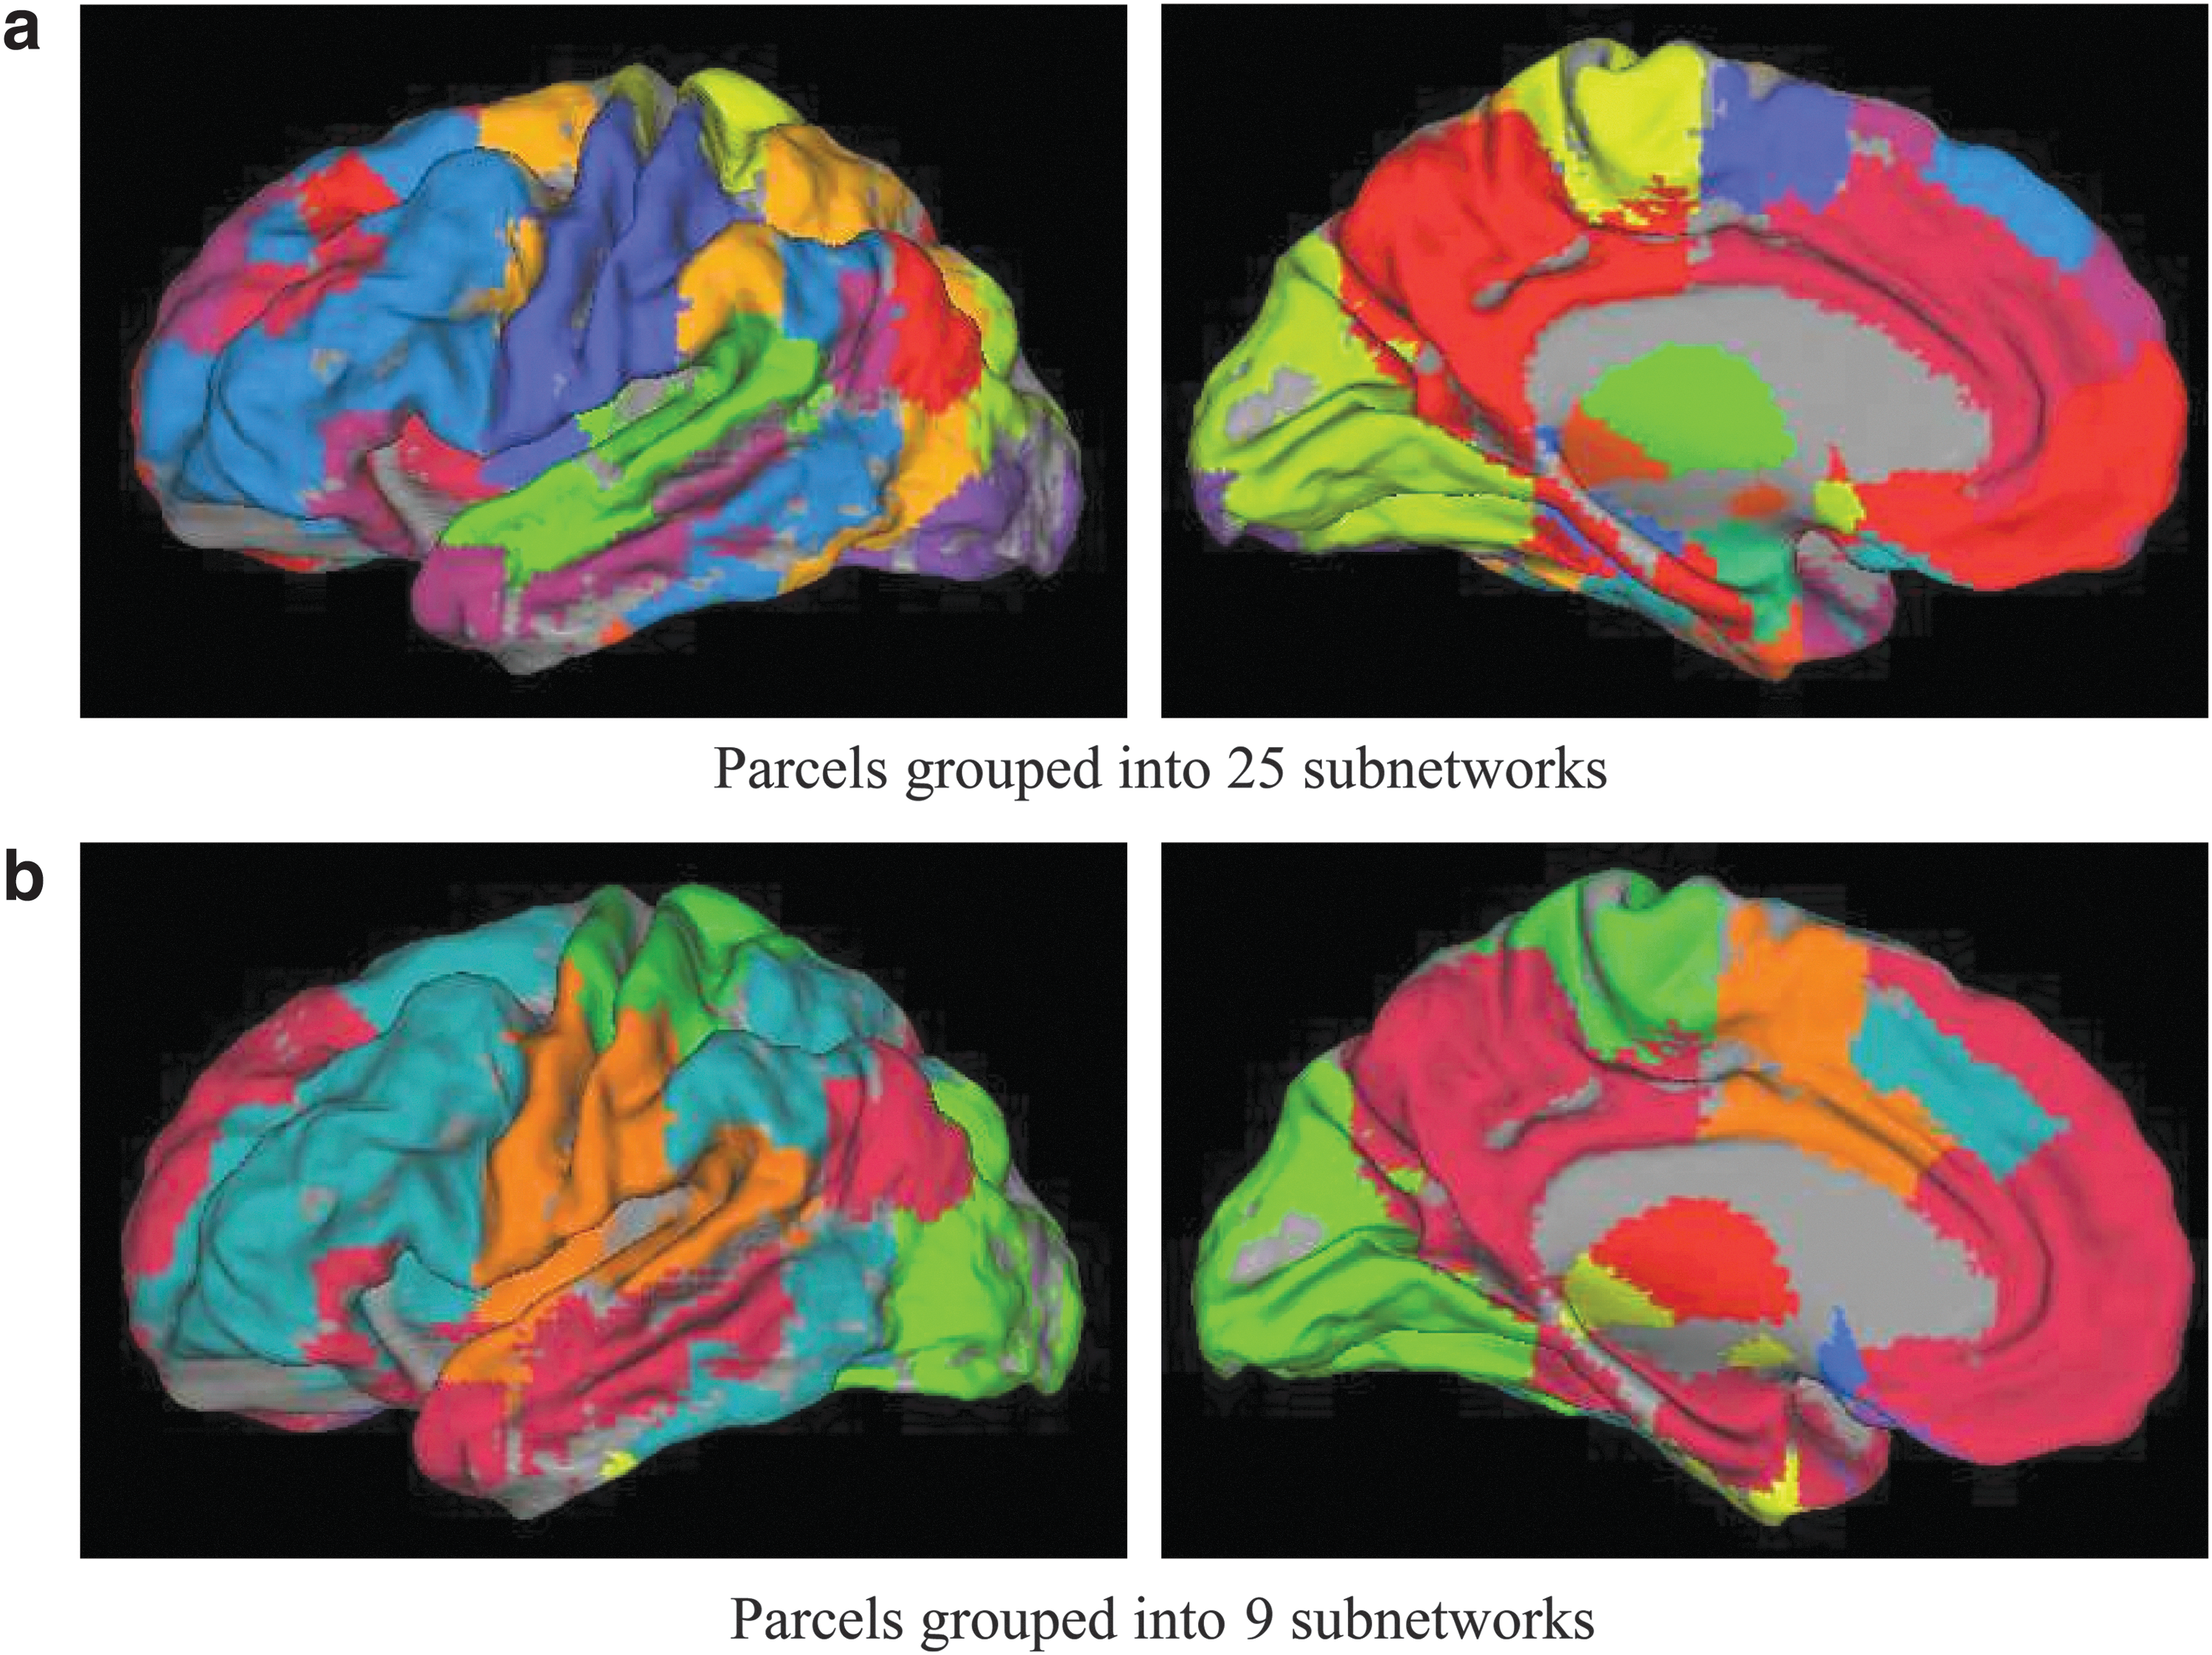
Extracted subnetworks.
We also found a number of less well-known systems (light purple) implicated in memory retrieval that have been detected in more recent studies (Power et al., 2011; Yeo et al., 2011). Note that based on maximal modularity, the “optimal” number of subnetworks was found to be nine, Figure 10b.
Discussion
Purposes and key challenges of multimodal parcellation
Through evolution, the human brain has been structured in a certain way for executing various functions. The cortical foldings, the white matter wiring, and the electrical signaling mechanisms all pertain to this complex organization. Thus, jointly exploiting brain attributes should theoretically generate parcellations that better resemble the brain's inherent division than examining each attribute in isolation.
One of the key challenges to adopting a multimodal approach is drawing the “right” balance between different brain attributes. We proposed basing this weighting on test–retest reliability of each attribute, which we empirically showed to work well in practice. More knowledge of the relationship between different attributes warrants further research. Another key challenge, which applies to brain parcellation in general, is the choice on the number of parcels. Choosing a criterion for finding the “ground truth” number of parcels is nontrivial, and this choice is largely a matter of the spatial resolution that is suitable for one's analysis. Our take on this issue is not to settle on any particular number, but to adopt a multiscale strategy. Findings that are consistent across scales are less likely to be false positives.
Multimodal parcellation improves reproducibility and data likelihood, and maintains functional homogeneity
Our results show that complementing FC with structural information and AC improves the reproducibility of the parcellations. Although multimodal information would presumably disrupt maximization of functional homogeneity, the functional homogeneity of our multimodal-based parcellations was on par with pure functional parcellations, and higher than those based on AC, physical distance, randomly generated, and most existing atlases. Furthermore, the multimodal-based parcellations achieved higher left out data likelihood than parcellations based on AC and pure functional parcellation.
Linking parcels to prior knowledge
The subnetworks extracted from our multimodal-based parcellations match well with a good number of established functional systems (Power et al., 2011; Yeo et al., 2011), which enabled us to assign neuroanatomically meaningful labels to the parcels. Multimodal parcel boundaries also moderately align with those of cytoarchitectonic areas, despite that we did not explicitly optimize for this overlap in multimodal parcellation scheme. We suspect this overlap arose from the correlation between cytoarchitecture and brain function (Amunts, 2014). As for the misalignments, a likely reason is intersubject misregistration and transition regions between cytoarchitecture areas (Fischl et al., 2008).
Region level extension versus whole-brain parcellation
We presented a region level extension to our multimodal parcellation approach, which greatly reduces computational cost and provides the side benefit of incorporating structural information on gyri and sulci. This extension simplifies the problem of parcel correspondence between subjects. Also, part of the boundaries for some parcels would necessarily be confined to the boundaries of the predefined regions. To ensure fair comparisons, we applied exactly the same region level strategy for the contrasted methods and showed that multimodal information indeed provides substantial gains.
Future directions
In this study, we demonstrated the benefit of multimodal fusion based on the conventional stationary FC estimation. Recent studies showed that the estimation of FC dynamics was applied to parcellations for the whole brain (Preti and Van De Ville, 2017) or specific areas (Nomi et al., 2016; Yang et al., 2014). Specifically, informative dynamical properties can better characterize functional connections using functional flexibility (Nomi et al., 2016), and reveal various brain states, which provide a representation of the dynamic repertoire of the brain's responses (Cabral et al., 2017; Yang et al., 2014). There has been exploratory research on developing unimodal parcellations by applying the representative dominant patterns derived from dynamic FC.
Our future study will focus on extending our multimodal strategy by incorporating temporal dynamics of the functional connectome, for example, integrating AC with the dominant patterns of dynamic FC (derived from clustering dynamic states of FC), or a modified FC formulation using the dynamic FC states as fluctuation profiles.
Conclusion
Given the recent widespread effort and substantial investment from various laboratories in generating high-quality multimodal neuroimaging data, we investigated the important question of whether combining modalities can actually improve brain parcellation. We proposed an approach for integrating anatomical and FC information for brain parcellation. Applying our multimodal approach to real data, we quantitatively showed the superiority of multimodal parcellation compared with unimodal parcellation and existing atlases in terms of reproducibility, functional homogeneity, and left out data likelihood. Multimodal parcellations also overlap with known cytoarchitetonic areas, and the extracted subnetworks matched well with established brain systems. Our proposed multimodal method achieved better performance than using FC alone for all metrics, but the improvements in absolute value are only modest for functional homogeneity and left out data likelihood. Collectively, our results demonstrated that integrating multiple brain attributes that intrinsically reflect the brain's organization indeed improves brain parcellation. Our multimodal volumetric parcellations could thus serve as excellent complements to cortical surface parcellations, especially considering the importance of subcortical regions for clinical investigations, such as Parkinson's disease studies.
Footnotes
Acknowledgments
We thank our colleagues inside our group, Biomedical Signal and Image Computing Laboratory, for their feedback of how to present the results in the article.
Author Disclosure Statement
No competing financial interests exist.
References
Supplementary Material
Please find the following supplemental material available below.
For Open Access articles published under a Creative Commons License, all supplemental material carries the same license as the article it is associated with.
For non-Open Access articles published, all supplemental material carries a non-exclusive license, and permission requests for re-use of supplemental material or any part of supplemental material shall be sent directly to the copyright owner as specified in the copyright notice associated with the article.