
Abstract
The insula has been implicated in playing important roles in various brain functions including consciousness, homeostasis, perception, self-awareness, language processing, and interpersonal experience. Abnormalities of the insula have been observed in patients suffering from addiction, deteriorating language function, anorexia, and emotional dysregulation. We analyzed typical development of insular connections in a large-scale pediatric population using 642 magnetic resonance imaging examinations. Interpreting large quantities of acquired data is one of the major challenges in connectomics. This article focuses its analysis on the connectivity observed between the insula and many other regions throughout the brain and performs a hemispheric asymmetry analysis comparing localized connectome measurements. Results demonstrate asymmetries in the pathways connecting the insula to the superior temporal region, pars opercularis, etc. that may be representative of language lateralization in the brain. Results also demonstrate multiple fiber pathways that exhibit hemispheric dominance in tract length and an inverted hemispheric dominance in tract counts, implying the presence of asymmetric lateralization of some of the brain's insular pathways. This study illustrates the investigative potential of performing connectomics-style analyses in a clinical context across a large population of children as part of routine imaging, demonstrating the feasibility of using current technologies to perform regionally focused clinical connectivity studies.
Introduction
The insula is situated in the lateral sulcus between the parietal, frontal, and temporal lobes and is extensively connected to various regions and pathways in the brain. The insula is also a key region of distinction between humans and primates (Bauernfeind et al., 2013), and has been implicated as a major site for the link “between experience, affect, and behavior” (Mesulam and Mufson, 1985). The insula contains connections to the emotional and viscerosensory regions of the brain (Türe et al., 1999). The posterior regions of the insula receive sensory inputs, whereas the anterior portions have connections to the brain's limbic regions (Namkung et al., 2017). The insular lobe has connections with the cerebral cortex, basal nuclei, amygdaloid body, dorsal thalamus, and other limbic areas (Augustine, 1996). Sensory information arrives through the thalamus to the posterior insula and then is integrated with emotional, cognitive, and motivational signals of the anterior insula (Namkung et al., 2017). The diversity of insular connections may be linked with the wide variety of brain functions and medical conditions that have been associated with abnormalities of the insula.
The insula is a key region of the brain involved in the perception and development of awareness of internal bodily states (Craig, 2002). The insula has been implicated in many aspects of brain function, including sudden insight, cigarette craving, and bowel distension, and it may play a fundamental role in awareness as a potential neural correlate of consciousness (Craig, 2009). Activity in the insula has also been associated with temperature sensation (Craig et al., 2000), auditory processing (Bamiou et al., 2003), attempted foot lifting among paraplegics (Nowak et al., 2005), subjects being provided with unfair offers (Sanfey et al., 2003), subjects observing people exhibiting disgust (Wicker et al., 2003), subjects imagining pain (Ogino et al., 2007), subjects observing their own heartbeats (Critchley et al., 2004), risky decision-making (Xue et al., 2010), and awareness of causal actions (Farrer and Frith, 2002). Variations in the insula have also been linked with a subject's education level (Teipel et al., 2009). The insula has been implicated in many aspects of brain function, but detailed developmental trajectories of the insula are still elusive.
Structural and functional abnormalities of the insula have been observed in patients with a wide array of medical conditions. Abnormalities of the insula have been implicated in the early stages of psychotic disorders (Hatton et al., 2014), articulatory planning deficits (Dronkers, 1996), psychosis (Hatton et al., 2014), depression (Murphy and Frodl, 2011; Murphy et al., 2007), post-traumatic stress disorder (Lei et al., 2015), autism spectrum disorder (Kennedy and Courchesne, 2008), conduct disorders (Lopez-Larson et al., 2012), schizophrenia (Hoptman et al., 2008), Parkinson's disease (Christopher et al., 2014), irritable bowel syndrome (Piché et al., 2013), and social anxiety disorder (Qiu et al., 2014). Abnormalities of insular asymmetries have been specifically implicated in depression, bipolar disorder, psychosis, and anxiety disorder (Hatton et al., 2012), as well as disorders of language and speech (Cao et al., 2003). These research studies imply that investigation of the insula, and specifically asymmetries of the insula, may elucidate our understanding of a wide variety of pathological conditions.
Traditional magnetic resonance imaging (MRI) acquires information related to the concentration of hydrogen protons distributed across the patient being imaged. In the brain, this supports the imaging of different types of tissues such as white matter (WM), gray matter (GM), and cerebrospinal fluid. Diffusion MRI measures movement of hydrogen protons and acquires multiple diffusion measurements pertaining to diffusion directionality (i.e., fractional anisotropy [FA]), overall diffusion (i.e., apparent diffusion coefficient [ADC]), and additional pathway measures (fiber tract lengths, etc.) that can be localized to an extensive set of region pairs to support connectomics-style data analysis.
Diffusion tensor imaging (DTI) tractography in healthy patients has demonstrated strong connections between the insula and the middle temporal gyrus' sulcus (Xu et al., 2015) as well as interhemispheric connectivity differences between the left and right insula (Jakab et al., 2012). Higher WM integrity in the insula, as assessed with FA, has been shown to be associated with more years of education among healthy subjects (Teipel et al., 2009). DTI of the insula has been used to investigate patients with early psychosis, with results indicating reduced FA in short association fibers among patients with early psychosis relative to healthy controls (Hatton et al., 2014). Reduced FA of the insula has also been implicated in patients with depression (Murphy and Frodl, 2011; Murphy et al., 2007). Children with post-traumatic stress disorder have been shown to exhibit decreased mean diffusivity in the insula (Lei et al., 2015). Decreased FA and an increased ADC in the insula have also been linked with social anxiety disorder (Qiu et al., 2014).
High-angular resolution diffusion MR imaging (HARDI) tractography enables identification of complex crossing-fiber tissue coherence in the brain (Tuch et al., 2003), even in immature brains (e.g., Takahashi et al., 2012; Vasung et al., 2017; Wilkinson et al., 2017), which are typically more challenging to segment due to a surplus of unmyelinated fibers [see discussions in Wilkinson et al. (2017)]. HARDI tractography allows for the reconstruction of water diffusivity in many different directions in each imaging voxel. This technique, theoretically, provides an advantage over DTI (Frank, 2002; Tournier et al., 2004), because there are many places throughout the brain where WM tracts cross and project in many different directions (Tournier et al., 2007). We have previously successfully applied HARDI tractography to insular development in fetal human brains (Das and Takahashi, 2017).
Diffusion MRI of the insula has the potential to assist in the characterization of a variety of pathological conditions as departures from healthy brain development. Many research studies have investigated WM pathways in adults using diffusion tractography (Cercignani et al., 2012; Chao et al., 2009; Jin et al., 2011; Racine et al., 2014; Thong et al., 2014; Trojsi et al., 2013; Varentsova et al., 2014) and only a few studies (e.g., Cancelliere et al., 2013; Cohen et al., 2016; Uda et al., 2015; Wilkinson et al., 2017) investigated WM pathways from infant to adult ages. This study presents a combined structural (T1) and HARDI analysis of the insula in a large clinical pediatric population (642 examinations aged 0.7–23.5 years), supporting a focused analysis of the insular connectome. This study provides connectome fiber tract measurements focused on pairing the insula with a wide variety of other brain regions. Connectomics tractography measurements are complemented with FA, ADC, surface area, surface curvature, volume, and cortical thickness measurements. This study is intended to demonstrate the feasibility of performing a connectomics-style tract analysis of healthy development of the insula based on large-scale clinical imaging. We aimed to provide a baseline of healthy development of the insula for clinical reference and to support future research and diagnoses of a variety of neurological conditions as departures from healthy insular growth trajectories. In this study, we hypothesize that tractography-based measurements acquired clinically can be useful in the assessment of a patient's insular fiber tract-based asymmetries.
Materials and Methods
Patient population
After approval by Boston Children's Hospital's (BCH) Institutional Review Board (informed consent was waived due to the lack of risk to patients included in this retrospective analysis), the clinical imaging electronic database at BCH was reviewed for this study from January 1, 2008 until February 24, 2016, and all brain MRI examinations were included for further analysis. Examinations deemed to be of low quality (because of excessive patient motion, large metal artifact from a patient's dental hardware, lack of a T1 structural MRI volume providing diagnostically useful axial, sagittal, and coronal oriented images, etc.) were excluded from the study. Examinations that were inaccessible for technical reasons were also excluded. Healthy patients were previously assembled retrospectively (Levman et al., 2017) by selecting participants on the basis of a normal T1 MRI examination, as assessed by a BCH neuroradiologist, and whose medical records provided no indication of any neurological problems (patients with any known neurological disorder were excluded such as autism, cerebral palsy, traumatic brain injury, brain cancer, developmental delay, multiple sclerosis, tuberous sclerosis complex, stroke, neurofibromatosis, cortical dysplasia, epilepsy, and attention deficit hyperactivity disorder). Patients with any form of cancer were also excluded so as to avoid presenting measurements that may be adversely affected by chemotherapy and other treatments. Patients who did not receive 30 directional DTI with 5 b0 fields (protocol is described hereunder) were also excluded. This resulted in 642 examinations of patients aged 0.7–23.5 years old (mean 11.7, standard deviation 4.8). This population inevitably had a variety of reasons for receiving an MRI examination, the most common of which were headaches, to rule out intracranial pathologies, vomiting, and night awakenings. This population's medical records also indicated that the participant's most common comorbidities were migraines, headaches, and abdominal pain.
MRI data acquisition and preprocessing
Participants were imaged with clinical 3 Tesla MRI scanners (Skyra; Siemens Medical Systems, Erlangen, Germany) at BCH, yielding T1 structural volumetric images accessed through the Children's Research and Integration System (Pienaar et al., 2014). The clinical T1 imaging approach used in this study has been previously presented (Levman et al., 2017). Examinations with substantial motion artifacts on T1 imaging were carefully excluded based on visual assessment. T1 structural examinations were processed with FreeSurfer (Fischl, 2012). If FreeSurfer results substantially failed, they were excluded from this analysis. Please see Levman et al. (2017) for a detailed description of the methods employed for examination exclusion.
Diffusion MRI data were acquired using isotropic diffusion-weighted (DW) spin-echo echo-planar imaging. Thirty DW measurements (b = 1000 sec/mm2) and five non-DW measurements (b = 0 sec/mm2) were acquired with TR = 10 sec; TE = 88 msec; δ = 12.0 msec; Δ = 24.2 msec; field of view = 22 × 22 cm; matrix size = 128 × 128, iPAT = 2, spatial resolution 1.72 × 1.72 mm. Diffusion MR images were aligned to FreeSurfer output space (computed from T1 examinations) using the Functional Magnetic Resonance Imaging of the Brain Software Library's (FSL) flirt-based image registration to compensate for spatial misalignment between diffusion and T1 images (Jenkinson and Smith, 2001; Jenkinson et al., 2002). FA and ADC images were computed using dti_tracker (Wang et al., 2007) for the left and right hemisphere's WM and GM of the insula, respectively. HARDI reconstruction was performed to reconstruct the orientation distribution function data using odf_tracker (Wang et al., 2007) of each patient by processing the diffusion MRI data in its native input space. HARDI-based streamline trajectories were propagated by consistently pursuing the orientation vector of least curvature. Tracking was terminated when the angle between two consecutive orientation vectors was greater than the given threshold (45°) or when the fibers extended outside of the brain surface using a brain mask. Displayed tracts were color coded by orientation: left–right (red), anterior–posterior (green), and superior–inferior (blue). The resultant tractography pathways were transformed into FreeSurfer output T1 space using the registration transformation previously computed by FSL flirt with the track_transform algorithm (Wang et al., 2007). Tract count, mean tract length, and tract length variability measurements were extracted with TrackVis (Wang et al., 2007) for all supported region pairs (see “Insular-focused connectomics and statistical analysis”) for those tracts that start or end in the regions-of-interest (ROIs) under consideration. Tract count measurements pertain to the number of neural fiber tracts identified from the odf_tracker fiber tract reconstruction with TrackVis (Wang et al., 2007). The average and standard deviation of the length of the fiber tracts were computed with TrackVis from the fiber tract reconstructions created with odf_tracker (Wang et al., 2007). Limitations and sources of error pertaining to the fiber tract measurements included in this analysis are further addressed in the Discussion section. Each tractography file was opened for viewing in TrackVis (Wang et al., 2007) and all examinations with visually assessed neural fiber tract reconstruction errors were excluded from the analysis. This visual evaluation involved assessment of the presence of known major fiber tracts, including left–right (red) fiber tracts bridging the left and right hemispheres at the corpus callosum and superior–inferior (blue) fiber tracts extending up from the brainstem. A lack of presence of these major fiber tracts was sufficient for the exclusion of the examination. Examinations for which the diffusion MRI to T1 alignment was visually observed to fail were also excluded. This yielded 642 examinations that included both diffusion MRI and volumetric T1 and passed our quality control procedure.
For each of the four insular ROIs (left and right hemisphere's GM and WM, respectively), the following measurements were extracted from the T1 structural examinations using FreeSurfer (Fischl, 2012): volumes, cortical surface area, average cortical thickness, cortical thickness standard deviation, and cortical surface curvature measurements. FreeSurfer ROI maps were also used to extract the mean and standard deviation of FA and ADC in each of the four insular ROIs.
Insular-focused connectomics and statistical analysis
Measurements pertaining to fiber tract connections (tract count, tract length mean, and tract length standard deviation) focused on those pathways connecting each of the four main insular ROIs with a wide variety of supported brain regions were extracted with TrackVis (Wang et al., 2007).
Supported regions paired with each of our insular ROIs include both GM and WM ROIs from both the left and right hemispheres acquired from the banks of the superior temporal sulcus, cingulate (caudal anterior, isthmus, posterior, and rostral anterior), caudal and rostral middle frontal, cuneus, entorhinal, fusiform, inferior (parietal and temporal), lateral (occipital and orbitofrontal), lingual, medial orbitofrontal, middle temporal, parahippocampal, paracentral, pars opercularis, orbitalis and triangularis, pericalcarine, postcentral, precentral, precuneus, superior (frontal, parietal, and temporal), supramarginal, frontal and temporal pole, transverse temporal, and cerebellar regions; left and right hemisphere ROIs were also included for the thalamus, caudate, putamen, pallidum, hippocampus, amygdala, accumbens, and the ventral diencephalon; ROIs were also included for the brainstem, optic chiasm, and posterior, mid posterior, central, mid anterior, and anterior segments of the corpus callosum.
For each supported region pair (one of our four insular ROIs paired with any of the ROIs outlined previously), we compute an asymmetry index defined as the left hemisphere measurement pair's measurement-of-interest divided by the right hemisphere's equivalent (e.g., the fiber tract measurement connecting the left hemisphere's insular WM to the left hemisphere's putamen is divided by the same tract measure calculated from the pairing of the right hemisphere's insular WM with the right hemisphere's putamen). This process was repeated for all possible pairings supporting all regions described previously. Three tract measures were computed for each pairing: the tract count, the average tract length, and the standard deviation of the tract lengths. Note that although tract count and length are affected by the diffusion pulse sequence employed, we have used a standardized MRI protocol and we are normalizing the values based on hemispheric asymmetry, creating measurements that may hold across pulse sequence variations. For each hemispheric asymmetry index computed, we also compute a p-value based on the t-test (Student, 1908) for two groups of samples. This resulted in m = 1051 group-wise comparisons, yielding a Bonferroni corrected threshold for achieving statistical significance of p < 0.05/m = 4.757e−5.
Results
Table 1 summarizes those region pairs that exhibit the strongest asymmetries. All entries in the table exceeded the Bonferroni corrected threshold for statistical significance. An asymmetry index <1 indicates right dominance, and an index >1 indicates left dominance.
Leading Asymmetry Connectomics Measurements of the Insula
GM, gray matter; STD, standard deviation; WM, white matter.
Connectivity measurements between the insula and the putamen exhibit both left and right dominance (Table 1). Left dominance was observed in terms of the tract length (average and standard deviation), whereas right dominance was observed in terms of tract count. Similarly, right dominance was observed between the insula and the pars opercularis in terms of tract length, whereas left dominance was observed in terms of tract count.
Example reconstructed tractography pathways based on the techniques used in this analysis are shown in Figure 1, demonstrating axial, coronal, and sagittal views of the resultant tractography with insular ROIs cast in three dimensions with their surfaces colored.
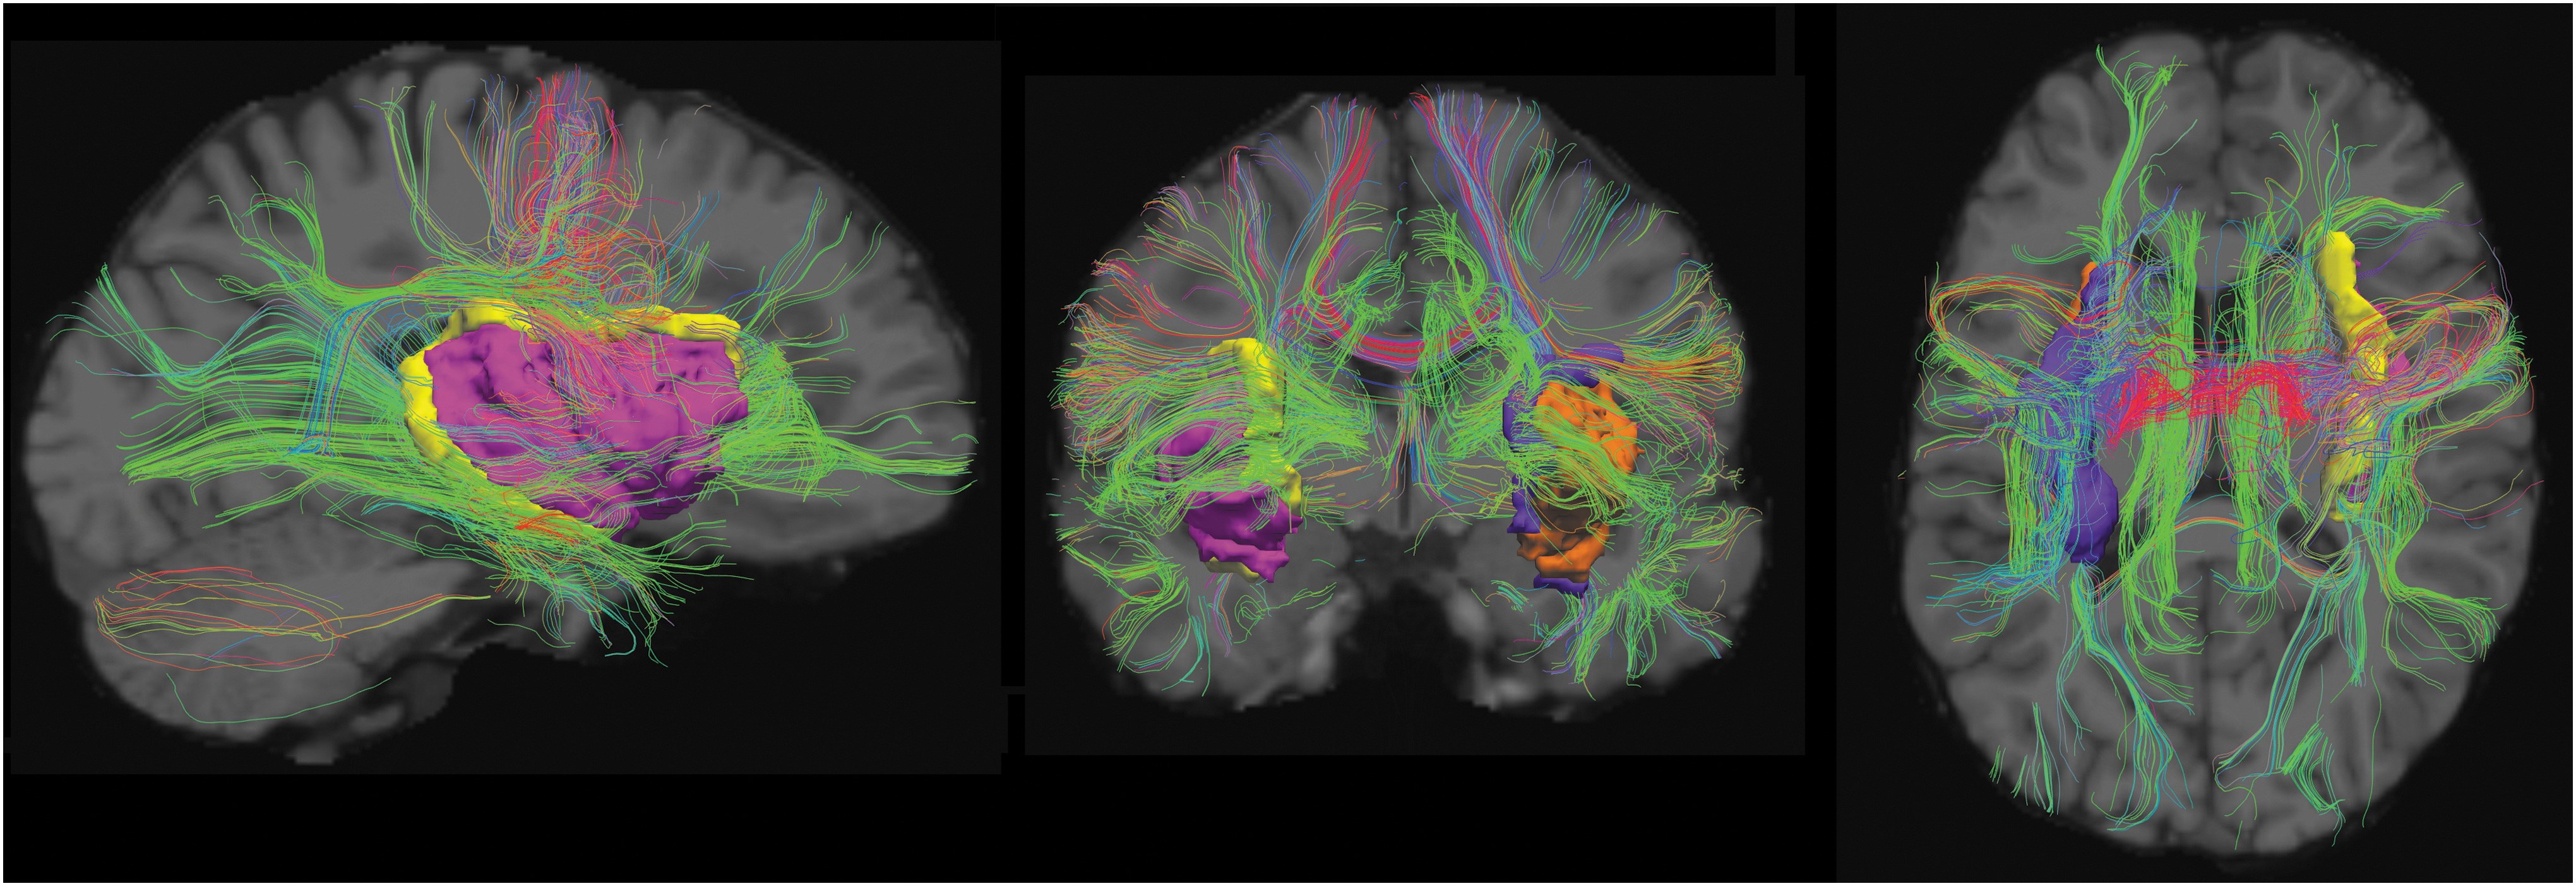
Example tractography pathways from a 23-year-old patient included in this study. Sagittal (left), coronal (center), and axial (right) tractographic projections are superimposed on a T1-weighted image (gray scale in the background). Three-dimensional views of our four insular ROIs are provided in orange (left insular GM), pink (right insular GM), purple (left insular WM), and yellow (right insular WM). Visualized with TrackVis (Wang et al., 2007). GM, gray matter; ROI, region of interest; WM, white matter. Color images are available online.
Scatter plots of the mean and standard deviation of the FA values for the left and right insular WM and GM are shown in Figure 2. Results demonstrate that average FA increases with age in the WM and decreases with age in GM. The variability in FA as assessed with the standard deviation demonstrates profiles similar to the average FA values. FA also demonstrates small asymmetries in average values in the WM exhibiting leftward dominance. Plots of the mean and standard deviation of the ADC values for the left and right insular WM and GM are also shown in Figure 2. Results demonstrate a reduction in average ADC with age in both the WM and GM as well as an increase in variability of ADC with age. Results also demonstrate modest ADC asymmetries in the WM exhibiting rightward dominance.
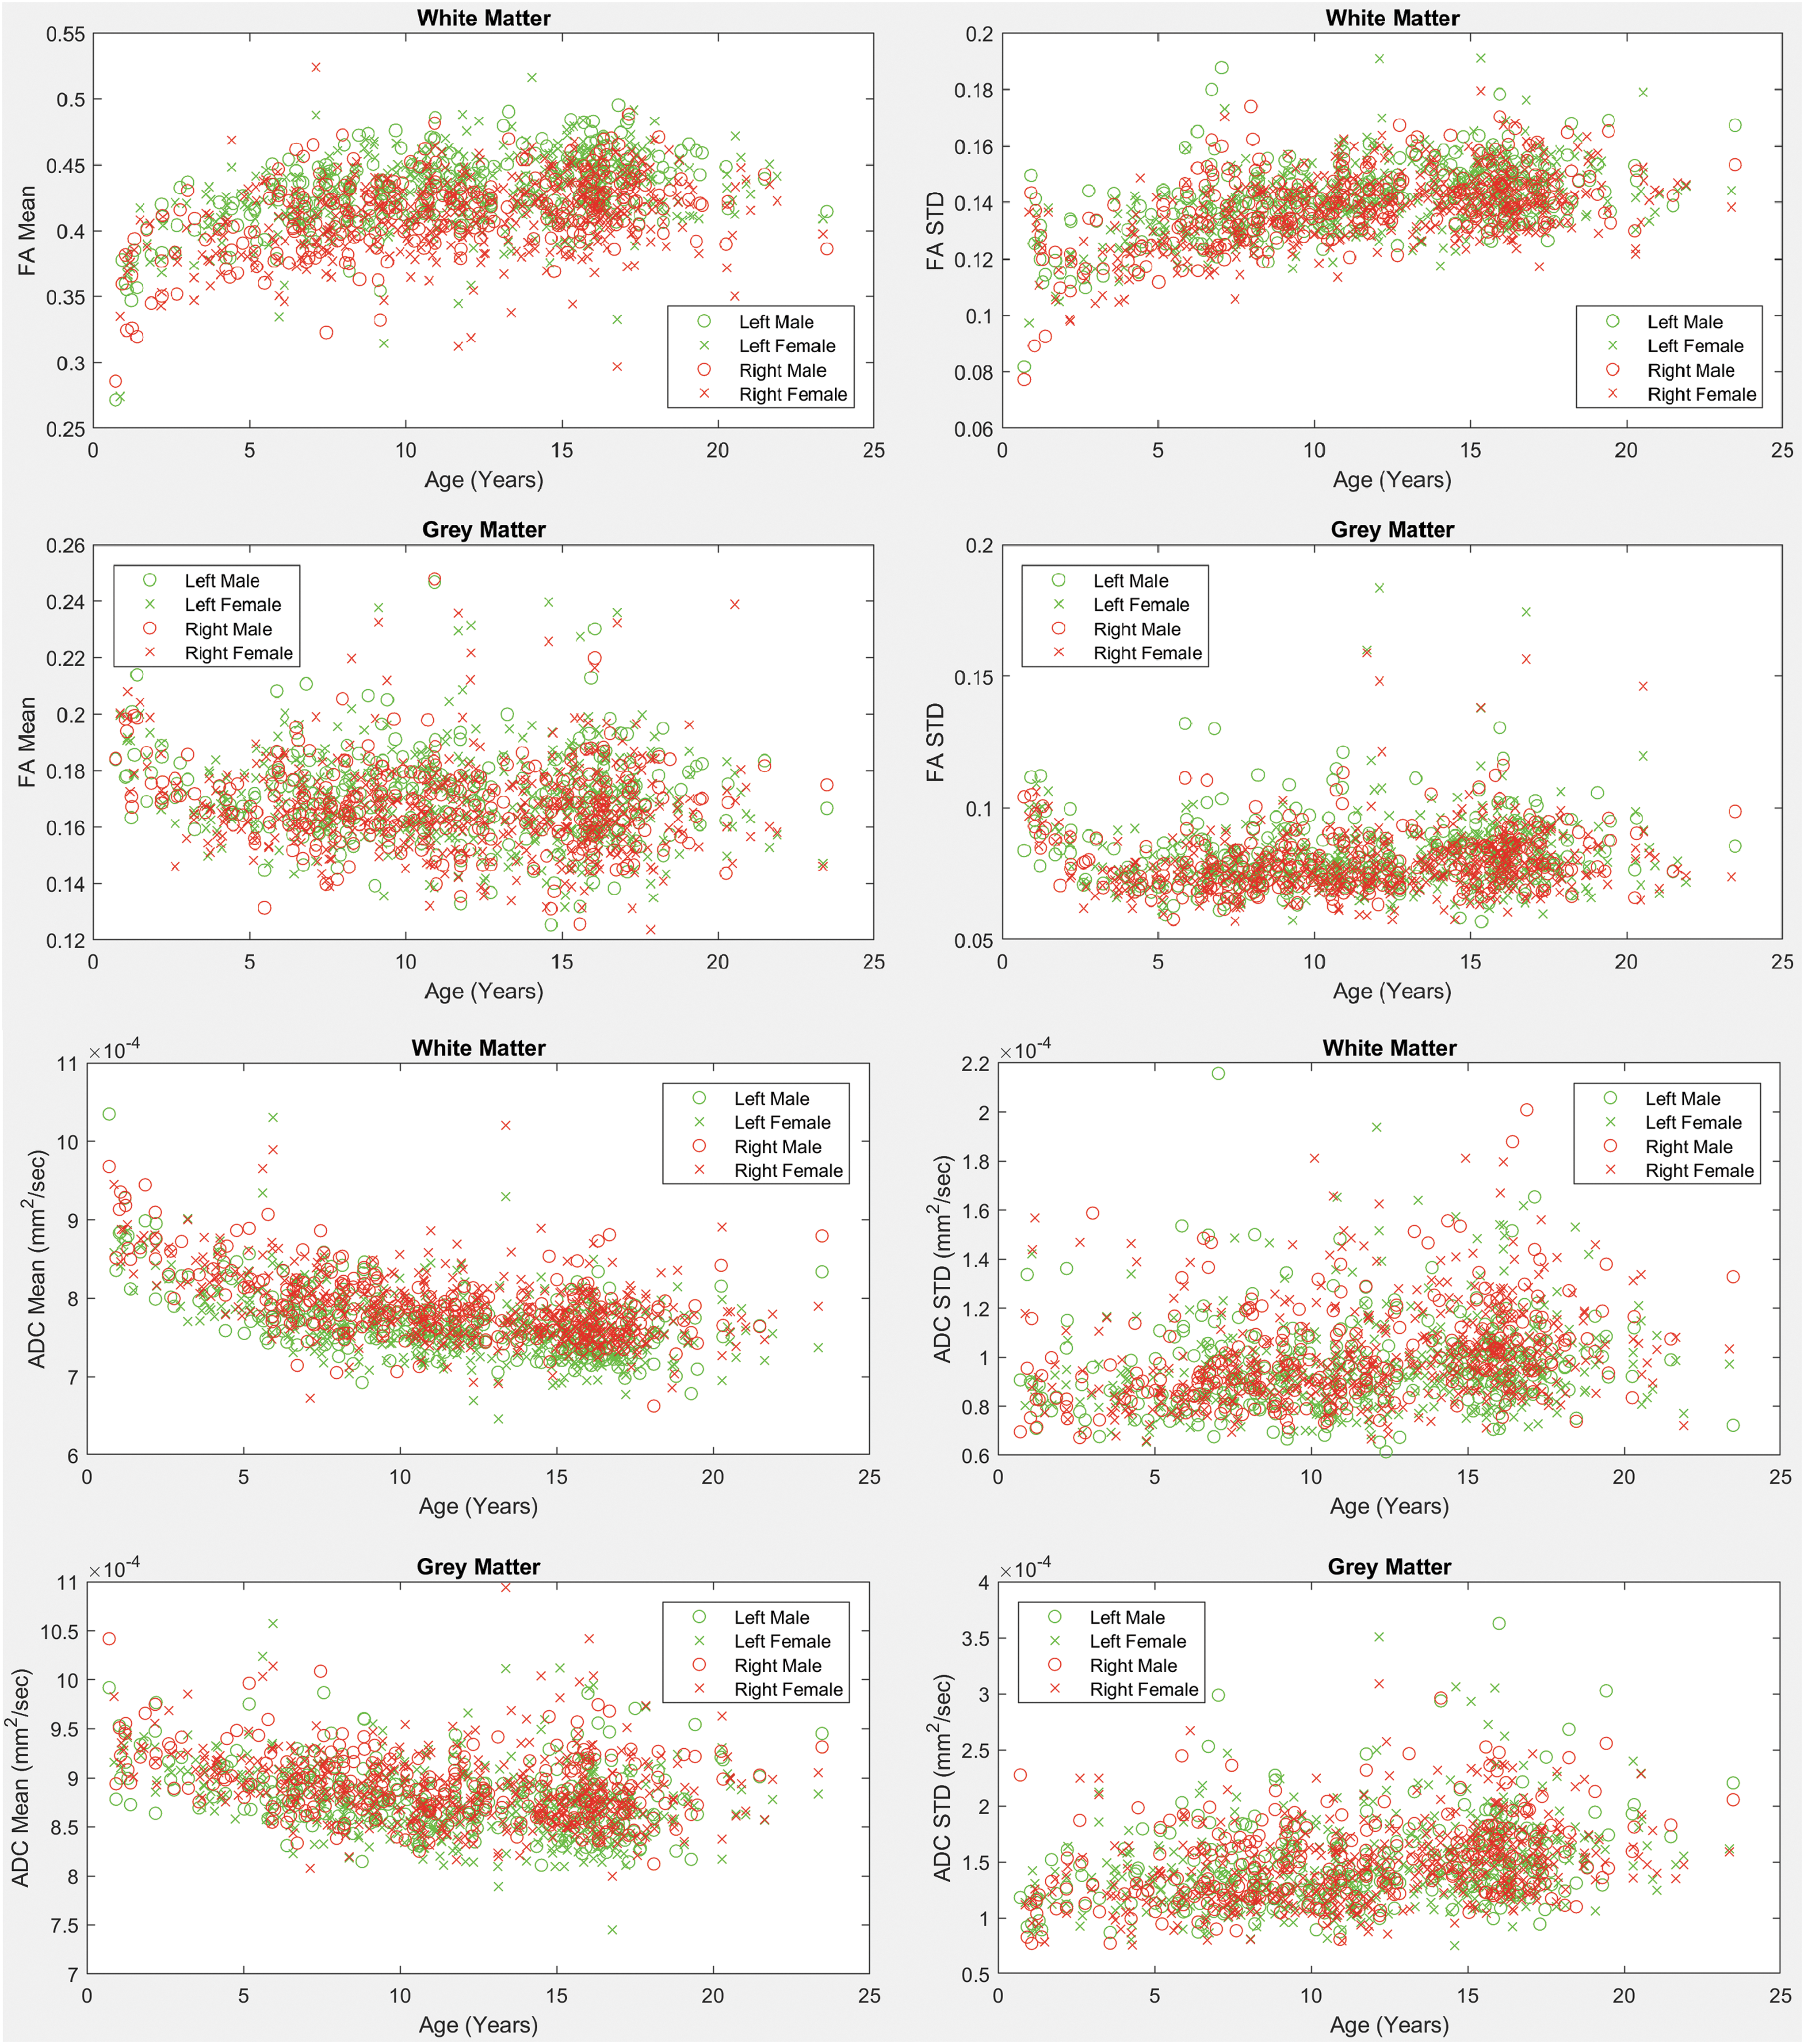
Mean and standard deviation of fractional anisotropy and ADC values across ages for males and females. Left and right hemisphere measurements are provided on the same subplots. WM and GM measurements are provided. ADC, apparent diffusion coefficient; FA, fractional anisotropy. Color images are available online.
Figure 3 shows scatter plots of volumetric T1 measurements extracted with FreeSurfer (Fischl, 2012), including the GM surface area, volume, average cortical thickness, standard deviation of cortical thickness, average surface curvature, and WM volumes.

T1 structural measurements of the left and right insula from both the GM and WM. Scatter plots are provided for the GM's surface area (upper left), volume (upper right), average cortical thickness (ThickAvg, center left), standard deviation of cortical thickness (ThickStd, center right), and average curvature (bottom right). A scatter plot is also provided for the WM volumes (lower left). Color images are available online.
Scatter plots of the mean and standard deviation of tract lengths of all pathways detected from/to the insular ROIs (both left and right sides, WM and GM) are shown in Figure 4. Results demonstrate strong rightward asymmetries in the average tract length in the WM and GM. Detected pathways from/to the insular GM also exhibited asymmetry in the standard deviation of the tract lengths, indicating higher tract length variability on the right side of the brain.
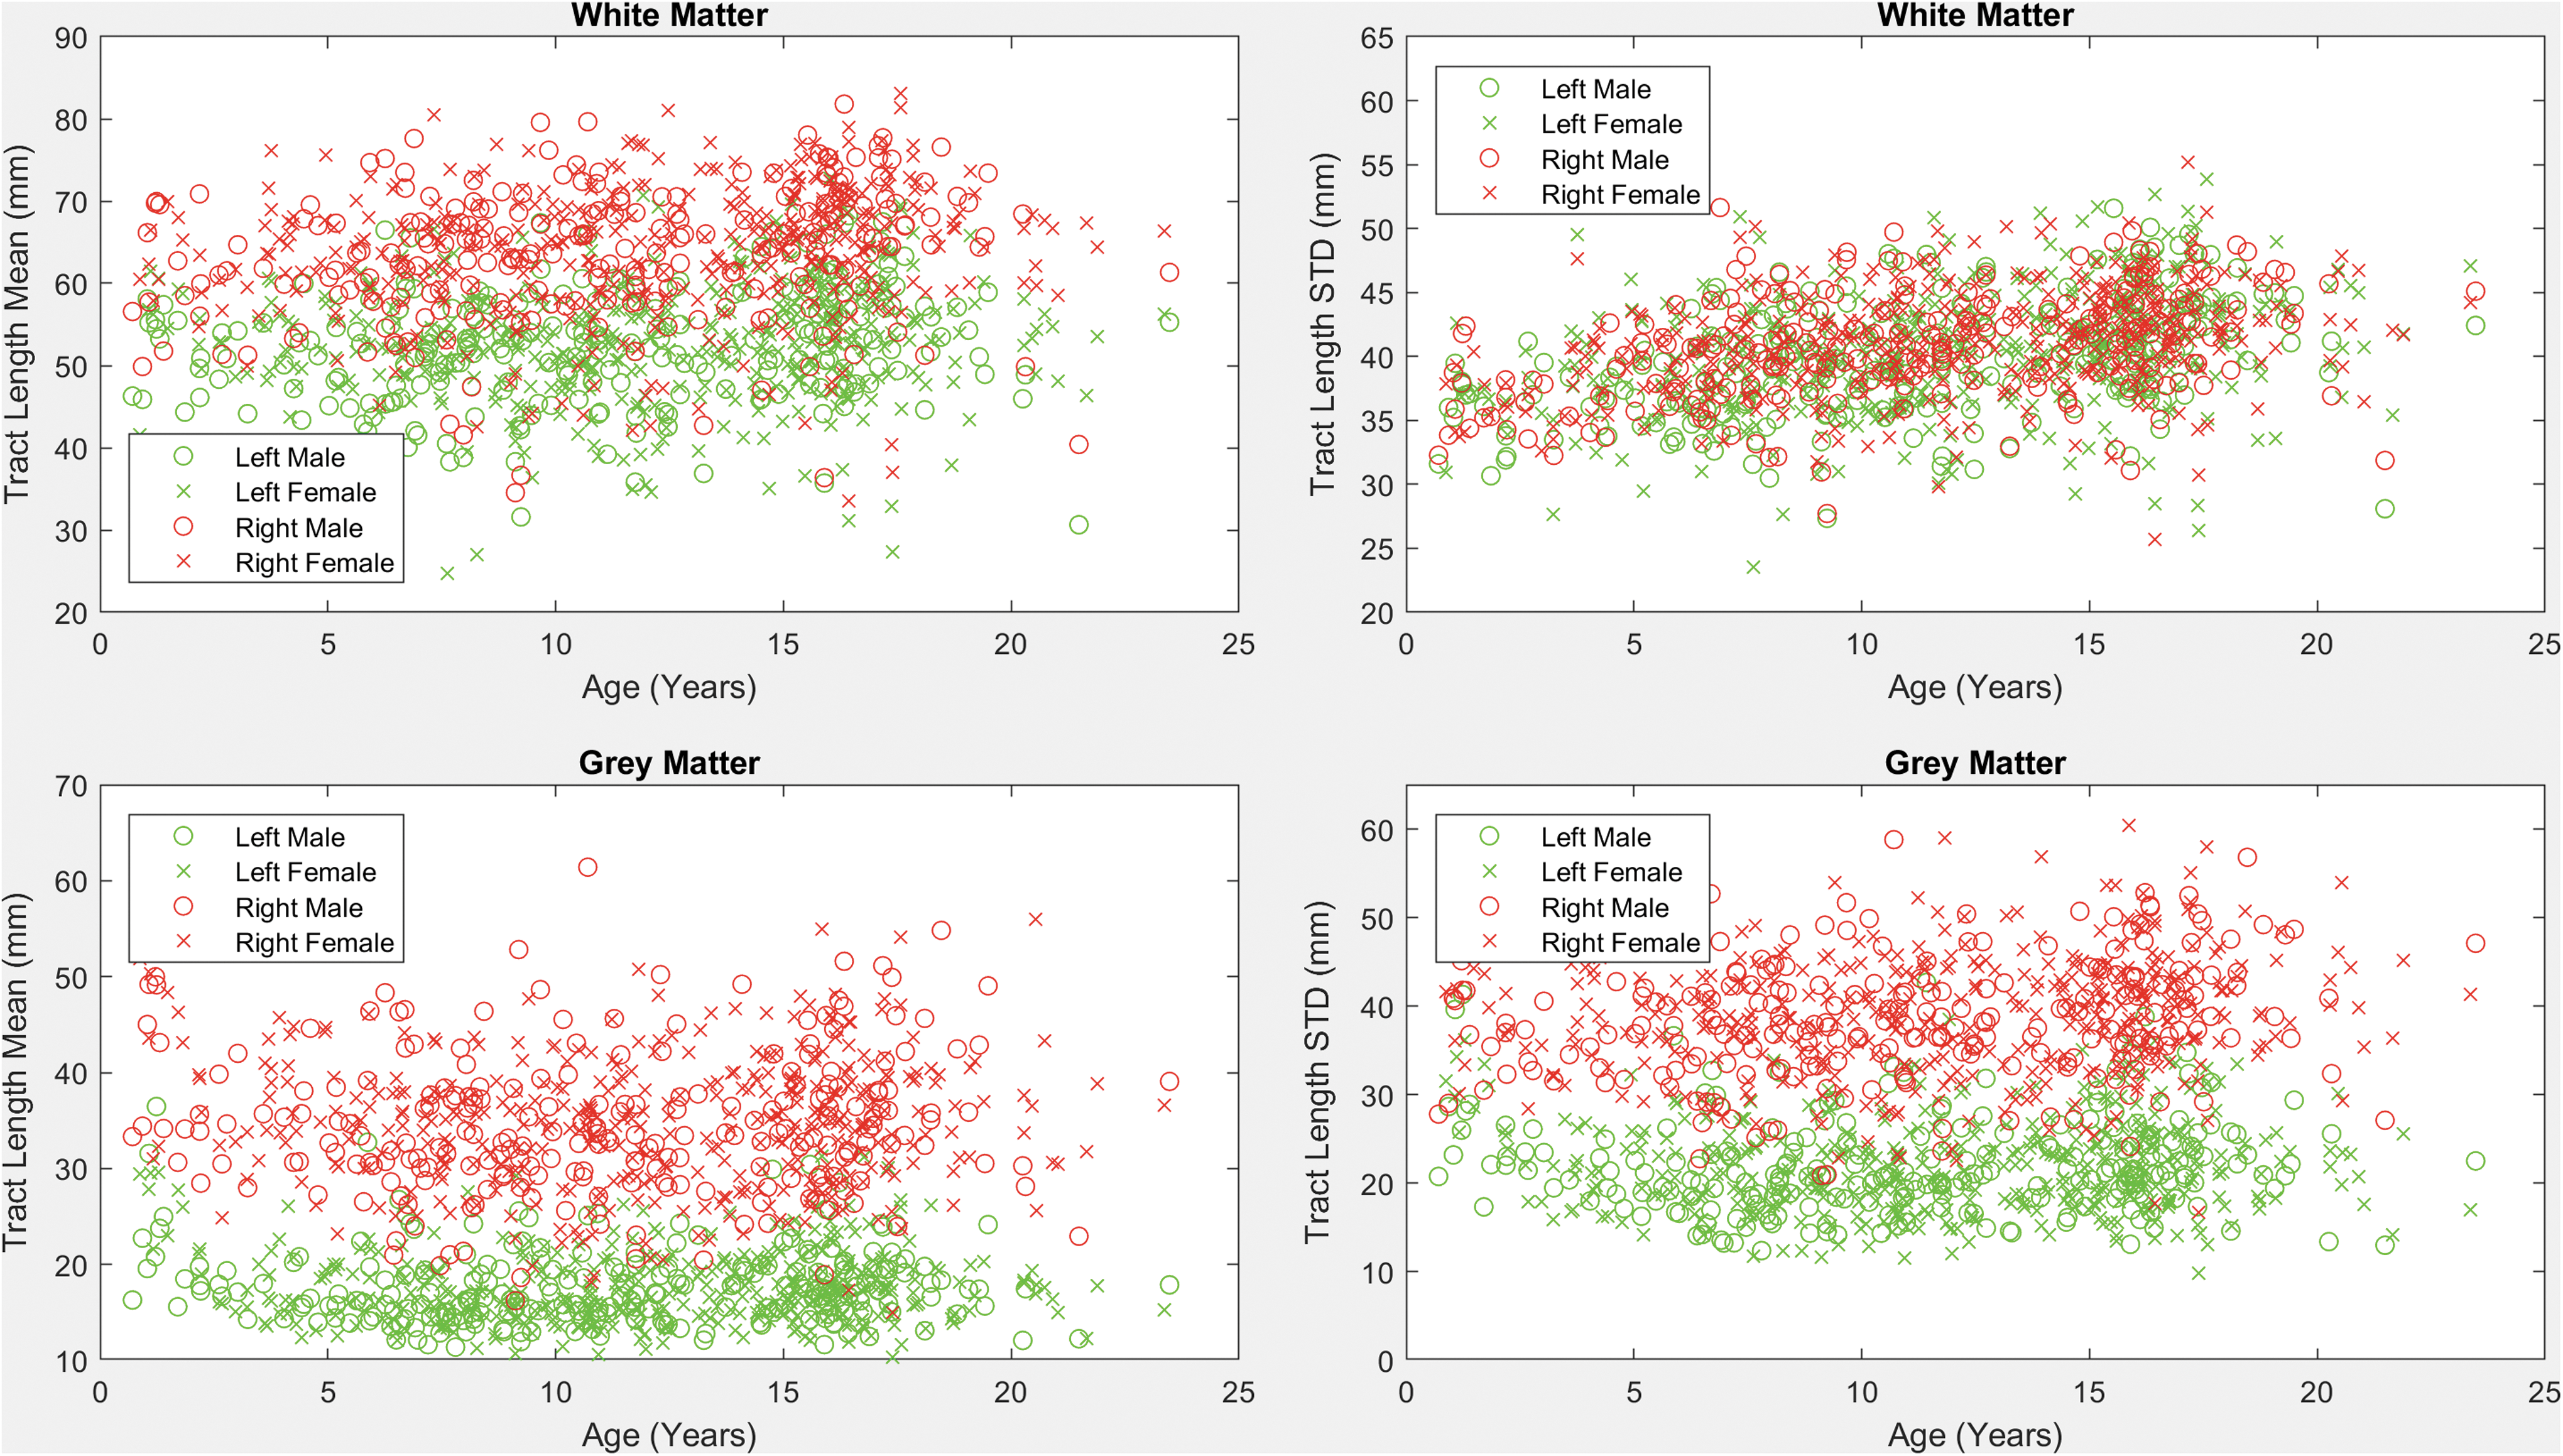
Mean and standard deviation of tract length across ages for males and females. Plots were established based on all fiber tracts that intersect with the four insular regions (left and right, WM and GM). Color images are available online.
Discussion
We analyzed the development of insular GM and WM in both hemispheres as well as pathways from/to the insular GM and WM using 642 MRI examinations from neurologically healthy subjects aged 0.7–23.5 years. We found several examples of left and right dominance in terms of tract count as well as the average and standard deviation of the tract lengths. This includes right dominance in the tract counts of the fiber pathways connecting the insular WM with the putamen; however, left dominance was observed in the tract length mean and standard deviation connecting the insular WM to the putamen, indicating that healthy brain development may consist of a greater quantity of tracts connecting the insula and the putamen in the right hemisphere, while having longer tracts with increased variation in length in the left hemisphere. Fiber tract connections between the insular GM and the superior temporal GM have a reversed effect, whereby we observed left dominance in terms of the number of tracts and right dominance in terms of average tract length and tract length variability. Also of interest is an observed left dominance in terms of tract counts linking the insular WM and GM. To confirm whether insular WM–GM tract count asymmetries are related to GM surface area, we also calculated the GM surface area asymmetry score of 0.95, indicating slight right dominance in contrast to the tract count asymmetries that exhibited very strong left dominance with an asymmetry score of 2.22.
The insula is thought to play an important role in language processing (Ardilla et al., 2014; Oh et al., 2014). Hemispheric asymmetries established in this study may reflect known left-dominant language-linked lateralization in the brain. Findings from our study demonstrate leftward dominance in the counts of fiber pathways linking the insula to the superior temporal region, which has been implicated in categorical speech representation (Chang et al., 2010), sentence comprehension (Friederici et al., 2003), multimodal integration of action and language (Willems et al., 2009), and auditory processing (Bigler et al., 2007). Our study has also demonstrated left dominant asymmetries of tract counts connecting the insula to the transverse temporal region, which is known to play an important role in speech and language and for which leftward asymmetries in the temporal plane have been identified in early neurodevelopment during the last trimester of fetal life (Chi et al., 1977). We have also demonstrated left dominance of tract counts linking the insula to the pars opercularis, which is part of Broca's language area (Foundas et al., 1998). In addition, our findings demonstrated leftward dominance in hemispheric asymmetries of the fiber pathway lengths linking the insula to the putamen (Table 1), for which previous analyses demonstrated coactivation with brain regions directly associated with language processing (Vinas-Guasch and Wu, 2017). In addition, observed WM–GM tract count asymmetries in the insula may be linked with language-based lateralization in the brain. These findings imply that diffusion-based imaging of insular connectomics may be useful in the assessment of language-linked lateralization of a patient's major neural fiber tracts in a clinical setting.
Numerous studies indicate cytoarchitectonic connectivity-related functional differentiation of the insular region in primates (Mesulam and Mufson, 1985). In particular, functional neuroimaging studies indicate that the insula is composed of four functionally distinct regions: the posterior region important for sensorimotor functions, the anterioventral region relevant for socioemotional functions, the central region activated by olfactogustatory stimuli, and the anteriodorsal region relevant for cognition. Each one of these regions has a specific set of connections. In nonhuman primates, anterioventral regions of the insula are tightly connected with the limbic system, the temporal regions, and the orbitofrontal cortex (Mesulam and Mufson, 1985); the dorsal parts of the central regions receive input from the thalamus (Craig, 2002) and the posterior regions have dense connections with sensory and motor areas, whereas anteriodorsal regions include bilateral connections with frontal cortices (Mesulam and Mufson, 1985). Despite its anatomical and functional segregation, the insula plays an important role in integration of all of the aforementioned functional systems (Craig, 2002, 2009; Dolan, 2002), and thus, it has been suggested that the insula's role in function/integration of these systems might represent a correlate of awareness in humans (Craig, 2009).
In addition to its functional and anatomical segregation, insular regions also exhibit hemispheric specialization. Empathic processing has been predominantly linked with functional MRI (fMRI) activation of posterior regions of insula of the left hemisphere, olfactory stimulation with fMRI activation of central insular regions of the right hemisphere, somatosensory stimuli with fMRI activation of the central region of the insula in the contralateral hemisphere (usually left for right-handed subjects), language and speech processing with activation of the left anterior insula, and working memory with bilateral activation of the insula in anteriodorsal regions (Kurth et al., 2010). Our results also indicate stronger connectivity of the left insula with cortical regions (pars opercularis and transverse temporal GM). In addition, the maturation changes of the insular cortex indicate an accented maturation of the insula predominantly during the first 5 years of life. However, whether or not the stronger anatomical connectivity of the left insula is related, in part, to self-awareness, which predominantly develops in childhood (Rochat, 2003), and to the development of language skills or empathy remains to be confirmed by multimodality MRI analysis.
The insula is also known to exhibit leftward structural asymmetries in surface area (Bidula and Kroliczak, 2015; Chiarello et al., 2013). Rightward asymmetries in connectivity strength have also been observed between the insula and the temporoparietal junction (Kucyi et al., 2012); however, our study did not include an ROI for the temporoparietal junction as this was not supported by FreeSurfer (Fischl, 2012). Strong rightward asymmetries were previously observed in the anterior insular cortex in terms of GM volumes (Watkins et al., 2001), which is in concordance with our findings. Additional work has focused on the use of tractography to assess asymmetries in a variety of brain regions, and determined that the insula most likely exhibits right dominance in connectivity between the insula and the putamen (Lee et al., 2014), which we were able to confirm in our experiment with tract count asymmetries. Lee's study was only able to resolve these connections with diffusion kurtosis imaging (DKI), not with DTI; however, our experiment demonstrates that with the use of HARDI tractography, these asymmetries can be resolved without DKI. Our results demonstrated structural connections between the insula and the basal ganglia. These connections have been successfully tracked in primates and have been suggested to serve as a neural correlate of feeding behavior determined by tactile hand and mouth object recognition (Chikama et al., 1997; Friedman et al., 1986; Preuss and Goldman-Rakic, 1989). Previous work has also performed connectomics whole brain asymmetry analyses on a small data set of older adults (Bonilha et al., 2014). To the best of our knowledge, ours is the first study to target the structural development of the insula's connective pathways with the rest of the brain in an asymmetry enabled connectomics analysis.
Fiber tract reconstruction techniques are known to be imperfect technologies. We used an established method; however, our analytic approach is not dependent on any single fiber tracking methodology and so the technique relied upon can be replaced with any alternative method, including any new developments in this field. The many insular connectomics measurements extracted from paired ROIs in this analysis inevitably assess many spurious pathways (i.e., region pairs wherein pathways should not be found in a healthy population). In practice, using the methods described in this article, many region pairs yield no fiber tracts in many of our patients. The asymmetry analysis performed in this study has the added benefit of producing invalid asymmetry indices when no fiber tracts are detected (the equation: left hemisphere measurement divided by right hemisphere measurement returns an invalid index when the right measurement is zero). This helps us focus our analysis on those region pairs for which the establishment of the existence of fiber tracts is consistent across patients. A potential shortcoming of this approach is that it may result in our analysis not considering interesting neural pathways based on ROI pairs for which current tracking methods are unable to consistently establish existing fiber tracts. In addition, fiber tracking was performed for those tracts that appear (based on the methods employed) to naturally initiate or terminate in the two ROIs under consideration. This has the potential to ignore other interesting aspects of insular fiber tract configurations for those pathways that merely pass through the ROIs under consideration. In addition, although pathways extending from GM to GM are of particular interest from a functional perspective, we have also assessed GM to WM and WM to WM pathways, which may represent part of the underlying GM to GM pathway. It is well known that existing techniques for the reconstruction of fiber pathways are imperfect technologies that inevitably produce some spurious fiber tracts. Research is ongoing to create improved fiber tracking algorithms and to validate the resultant technologies on phantoms and animal models. Unfortunately, in a human population, validation of individual tracts is impossible as we only have observational data with which to analyze.
Previous DW research recommends that studies be conducted with a minimum of 45 angular diffusion directions to be “sufficient to fully characterize the DW signal” (Tournier et al., 2013). However, it should be noted that in their discussion section they recommend the inclusion of eight integer harmonic degrees (spherical harmonics) to characterize a DW signal, but also indicate that “if scan time is limited and/or SNR is low, it is likely that the l = 8 terms will be negligible compared with the noise. In this case, the l = 6 terms will dictate the angular resolution, and these only require 28 DW directions” (Tournier et al., 2013). Thus if scan time is limited such that you cannot acquire the recommended number of diffusion volumes (as often happens clinically and happened in our study), the eighth integer spherical harmonic degree is negligible, so in these situations we actually only need 28 DW directions. Our study included 30 DW directions, an additional 2 directions over the scan time recommendations (Tournier et al., 2013).
Although we used a consistent pulse sequence for all of our diffusion measurements, our data set included T1 pulse sequence variation limitations previously discussed (Levman et al., 2017). In addition, the typically developing population used for this analysis (Levman et al., 2017) represents those patients who received clinical imaging at Boston Children's Hospital and were inferred to be typically developing (no indications of neurological impairments and a normal MRI examination as assessed by a neuroradiologist). This population inevitably had a variety of reasons for receiving an MRI examination, the most common of which were headaches, to rule out intracranial pathologies, vomiting, and night awakenings. This population's medical records also indicated that the participant's most common comorbidities were migraines, headaches, and abdominal pain.
Our analysis used Diffusion Toolkit's default tract seeding (Wang et al., 2007), which initializes the center of each voxel as a potential location to start tracking a neural fiber tract. Thus spatial resolution of the pulse sequence can affect tract count measurements and it is known that tract length measurements are also influenced by spatial resolution issues (higher resolution results in longer tracts). It is also possible that the position of the temporal lobe may affect the length of the reconstructed tracts and represents an additional potential source of error. It should be noted that the same pulse sequence and analysis used in this study can be employed in other centers which would align other experiments to the tract count and length measurements computed herein. Furthermore, we have elected to perform an asymmetry analysis that creates an index normalized between the hemispheres of the brain. This results in relative tract measurements (left vs. right) and so these quantifications may align with other studies performing analyses with alternative diffusion MRI pulse sequences.
Future work will investigate extending this analysis to other regions of the brain, creating connectomics technology for clinical MRI that can compute all possible major neural fiber tracts throughout the brain (instead of just the insula connected to any ROI, we will examine any ROI connected to any ROI). In addition, clinical populations with directional diffusion MRI examinations allow us to apply connectomics technologies large scale to children with a wide variety of pathologies. Future work will look at extending this study to the analysis of children with autism, attention deficit hyperactivity disorder, cerebral palsy, and more. Future work will also investigate the effect of a range of quality control procedures on study findings. Future work will involve a thorough investigation of age and gender interactions on the measurements extracted in this analysis. Future work will also extend these analyses to diffusion sequences with higher angular resolutions.
Footnotes
Acknowledgments
This study was supported financially by the National Institutes of Health grants R01HD078561, R21MH118739, and R03NS091587 to E.T. This study was also supported financially by a Natural Science and Engineering Research Council of Canada Research Chair grant, a Canada Foundation for Innovation grant, a Nova Scotia Research and Innovation Trust grant, and a St. Francis Xavier University research startup grant to J.L.
Author Disclosure Statement
No competing financial interests exist.