
Abstract
Structural covariance networks (SCNs) may offer unique insights into the developmental impact of childhood maltreatment (CM) because they are thought to reflect coordinated maturation of distinct gray matter regions. T1-weighted magnetic resonance images were acquired from 121 young people with emerging mental illness. Diffusion-weighted and resting-state functional imaging was also acquired from a random subset of participants (n = 62). Ten study-specific SCNs were identified using a whole-brain gray matter independent component analysis. The effects of CM and age on average gray matter density and the expression of each SCN were calculated. CM was linked to age-related decreases in gray matter density across an SCN that overlapped with the default mode network (DMN) and frontoparietal network. Resting-state functional connectivity (rsFC) and structural connectivity were calculated in the study-specific SCN and across the whole brain. Gray matter covariance was significantly correlated with rsFC across the SCN, and rsFC fully mediated the relationship between gray matter covariance and structural connectivity in the nonmaltreated group. A unique association of gray matter covariance with structural connectivity was detected among individuals with a history of CM. Perturbation of gray matter development across the DMN and frontoparietal network following CM may have significant implications for mental well-being, given the networks' roles in self-referential activity. Cross-modal comparisons suggest that reduced gray matter following CM could arise from deficient functional activity earlier in life.
Introduction
Distributed gray matter covariance was first demonstrated in a postmortem study of the visual system, in which the sizes of the optic tract, lateral geniculate nucleus, and primary visual area were found to be strongly correlated within individuals, irrespective of hemispheric mass (Andrews et al., 1997). In the ensuing two decades, advances in neuroimaging have aided the identification of some organizing principles of gray matter covariance. The probability of gray matter covariance between two brain regions decreases exponentially with greater anatomical distance (He et al., 2007). However, contralateral homologous regions typically exhibit strong covariance of gray matter volume (Mechelli et al., 2005), and large-scale networks of gray matter covariance, commonly referred to as structural covariance networks (SCNs), have also been identified (Bernhardt et al., 2014). SCNs are highly heritable (Schmitt et al., 2008) and change with age (Li et al., 2013; Zielinski et al., 2010). SCNs provide valuable insight into the organization of interindividual differences in gray matter into networks. This approach is critical to understanding gray matter abnormalities in complex brain disorders at a network level.
Biological interpretations of SCNs are presently hindered by the paucity of studies on the correspondence of structural covariance with brain connectivity. Multi-modal imaging takes advantage of the differential sensitivity of neuroimaging modalities to brain physiology and enables a more detailed, integrated understanding of the relationship between brain structure and function. T1-weighted structural magnetic resonance imaging (MRI) scanning allows precise tissue-type segmentation, delineation of subcortical structures, and estimation of gray matter volume (van der Kouwe et al., 2008). Diffusion-weighted imaging enables characterization of white matter tracts and, in combination with structural MRI, estimation of the structural connectivity of two gray matter regions. Finally, functional imaging can be used to estimate patterns of neural activity through proxy measures such as the blood oxygenation-level-dependent (BOLD) signal. The correlation of distinct regions' BOLD signal (commonly referred to as “functional connectivity”) is suggested to indicate a dynamic interaction between the underlying neuronal populations (Friston, 1994). Structural covariance has been demonstrated between regions connected by white matter tracts, such as Broca's area and Wernicke's area (van der Kouwe et al., 2008), however, structural covariance does not appear to depend on a direct structural connection. A whole-brain comparison of gray matter covariance with structural connectivity reported that only 35–40% of cortical thickness covariance converged with white matter connections (Gong et al., 2012). Cortical thickness covariance is more tightly coupled to resting-state functional connectivity (rsFC), especially in cingular, superior temporal, prefrontal, and insular areas (Alexander-Bloch et al., 2013; Kelly et al., 2012). Importantly, SCNs are topologically similar to maturational networks; networks characterized by the similarity of regions' developmental trajectories (Alexander-Bloch et al., 2013). In 0- to 2-year-old children, gray matter covariance is preceded by the regions' coordinated maturation, which is in turn preceded by the emergence of rsFC networks (Geng et al., 2017). The functional basis of SCNs is also evident in their recapitulation of intrinsic connectivity networks derived from resting-state functional MRI (fMRI), such as the default mode network (DMN) (Guo et al., 2015). Age-related changes in SCNs also mirror the development of skills in childhood, including the maturation of language (Zielinski et al., 2010). These parallel lines of evidence have been used to suggest that functional coactivation of distinct gray matter areas prompts coordinated maturation, which drives the development of SCNs (Alexander-Bloch et al., 2013; Zielinski et al., 2010).
Following on from this assertion, it stands to reason that SCNs would be particularly sensitive to developmental insults, such as childhood trauma. Childhood maltreatment (CM), encompassing acts of abuse and neglect before the age of 16, has an enduring negative impact on sociality, academic performance, and psychiatric health as well as physical health (McLeod et al., 2014; Rapoza et al., 2014; Romano et al., 2015). In a recent meta-analysis of 38 articles, adults with a history of CM were found to commonly exhibit reduced hippocampal, amygdala, and dorsolateral prefrontal cortex gray matter (Paquola et al., 2016). Longitudinal structural MRI studies have shown that CM leads to decreased amygdala growth in young adolescents (12–16 years) and decreased hippocampal growth in youth (14–28 years) (Paquola et al., 2017; Whittle et al., 2013), which suggests that CM alters the developmental trajectory of related gray matter regions. Only one study to date has investigated the impact of CM on gray matter covariance (Teicher et al., 2014). This study utilized graph theory to estimate the centrality (an index of importance) of cortical regions according to the strength and frequency with which the thickness of one region covaried with the thickness of other regions. CM was associated with a shift in centrality from the anterior cingulate cortex to the precuneus, anterior insula, and right parieto-occipital sulcus (Teicher et al., 2014). In line with these findings, functional imaging studies have also shown CM to be related to decreased centrality of regions involved in emotion regulation and social cognition (Cisler et al., 2017; Wang et al., 2014).
SCNs also provide unique insight into the spatial extent of CM-related effects. For example, reduced gray matter across an SCN would be indicative of a wide spread effect, whereas atypical covariance between regions would be indicative of a more localized effect. In the present study, we use SCNs to assess the impact of CM on gray matter development in young people. In doing, we aim to show the sensitivity of SCNs to developmental insults. We hypothesize that unsupervised detection of SCNs will result in networks similar to intrinsic connectivity networks, and that CM will be related to reduced gray matter across networks involved in stress and emotion. To further elucidate the biological underpinnings of SCNs, we aim to determine the correspondence of gray matter covariance with structural connectivity and functional connectivity at the level of the SCN, intrinsic connectivity network, and whole brain. We hypothesize that gray matter covariance will be more closely associated with functional connectivity than structural connectivity.
Materials and Methods
A broad overview of the study design is provided in Figure 1.
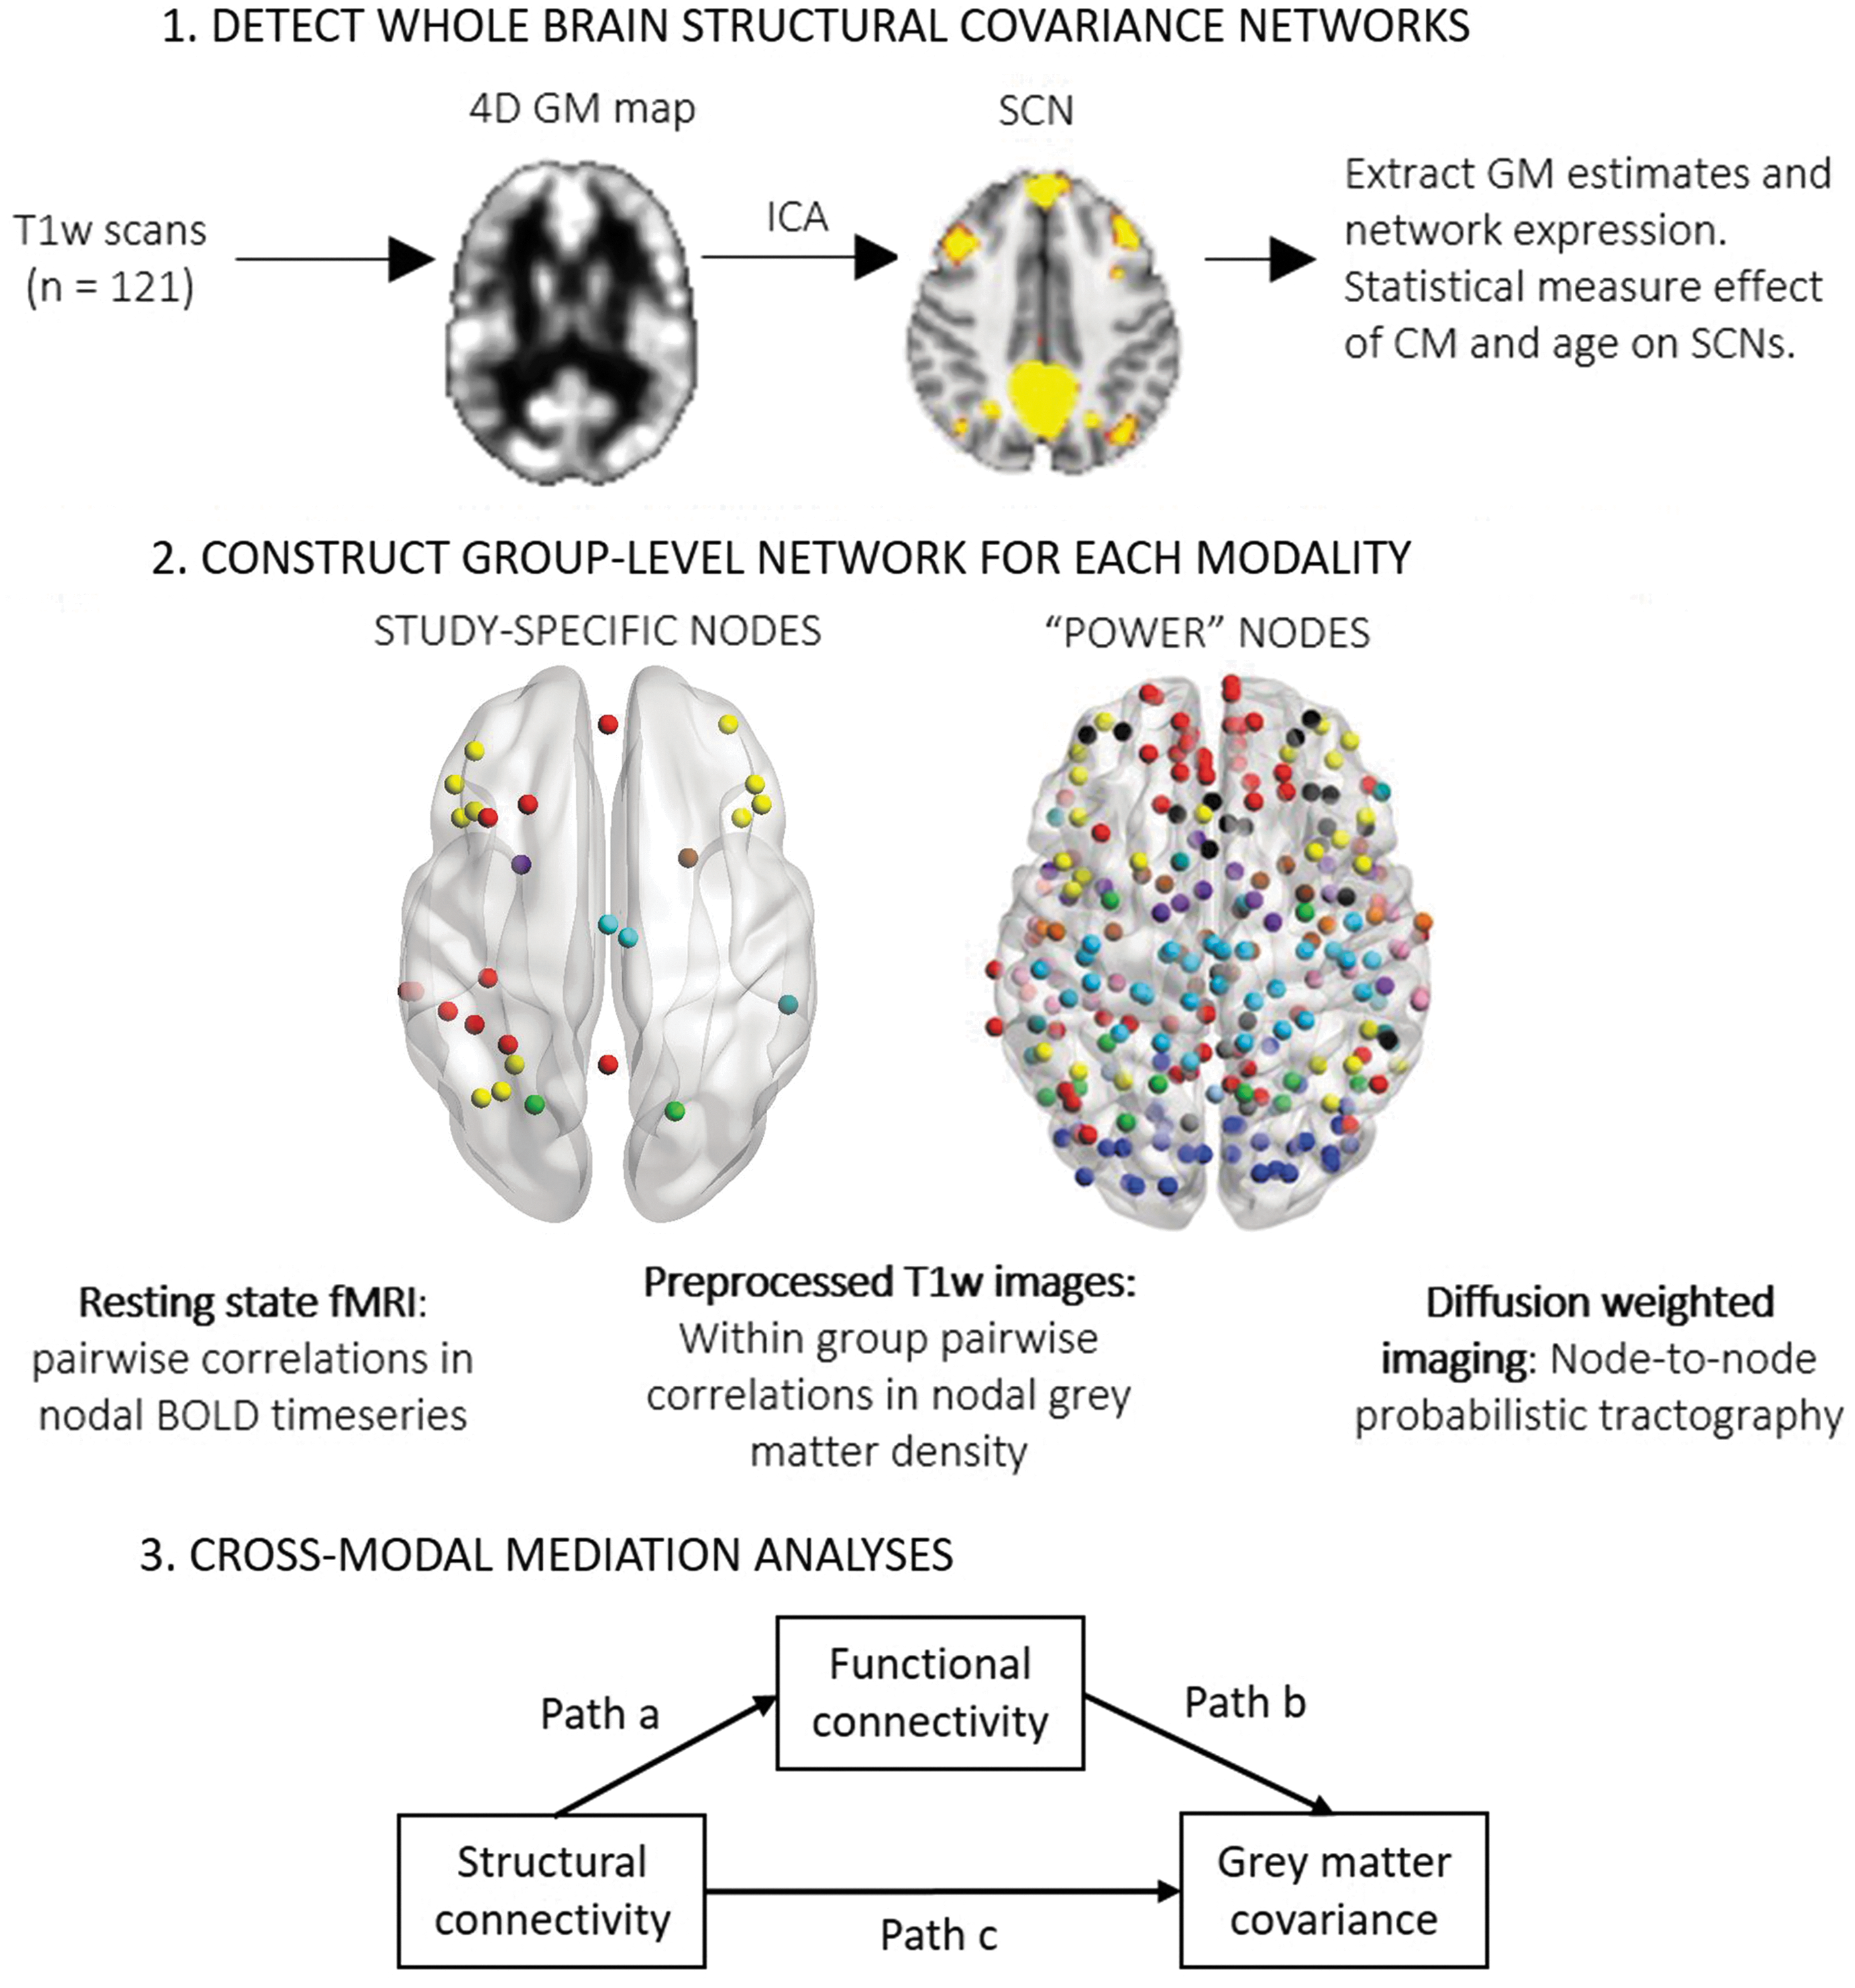
Study design outline.
Participants
One hundred twenty-one young people (78 women, age range = 14–26 years) were recruited unbiasedly from a specialized mental health clinic for young people in line with Research Domain Criteria recommendations (Cuthbert and Insel, 2013). This cohort was reflective of a wide range of young people seeking clinical psychiatric assistance. The advantages of such a transdiagnostic approach are discussed at length elsewhere (Casey et al., 2013; Cuthbert, 2014; Cuthbert and Insel, 2013). All patients were receiving clinician-based case management and relevant psychosocial interventions at the time of assessment. Exclusion criteria for all participants were medical instability (as determined by a psychiatrist, on the basis stability of treatment and symptoms), history of neurological disease (e.g., tumor, head trauma, epilepsy), medical illness known to impact cognitive and brain function (e.g., cancer, electroconvulsive therapy in the last 3 months), intellectual and/or developmental disability (a predicted IQ score <70), insufficient English for testing or psychiatric assessment, and current substance dependence. The study was approved by the University of Sydney Human Research Ethics Committee, and all participants provided written informed consent.
Clinical assessment
The Childhood Trauma Questionnaire (CTQ) short form, a retrospective self-report questionnaire, was used to measure exposure to maltreatment before the age of 16 (Bernstein et al., 1997). The CTQ separately assesses experiences of sexual abuse, physical abuse, emotional abuse, physical neglect, and emotional neglect using a rating system along a 5-point Likert scale from 1 (never true) to 5 (very often true). Each participant produces a score from 5 to 25 for each subscale, and an additive score from 25 to 125 for the total CTQ. SCNs are inherently population based and statistical analyses are based on group comparisons, and therefore, participants were divided based on exposure to CM. Moderate to severe cutoffs for each subscore were used to classify the presence of CM; sexual abuse ≥8, physical abuse ≥10, emotional abuse ≥13, physical neglect ≥10, and emotional neglect ≥15 (Bernstein et al., 1997). Subjects reporting moderate to severe maltreatment in one or more categories were allocated to the CM group. Subjects reporting no moderate to severe maltreatment were allocated to the no childhood maltreatment (No-CM) group. Additional clinical assessments are described in the Supplementary Data and Supplementary Figure S2 (Supplementary Data are avilable online at
Image acquisition
Participants underwent MRI scanning using a 3-Tesla GE MR750 Discovery scanner (GE Medical Systems, Milwaukee, WI) at the Brain and Mind Centre, Sydney, Australia. A high-resolution structural image was acquired from all participants with a customized MP-RAGE 3D T1-weighted sequence: repetition time (TR) = 7264 ms; echo time (TE) = 2784 ms; 0.9 mm isotropic resolution; flip angle = 15°; coronal orientation; field of view (FOV) = 230 × 230 mm; matrix of 256 × 256; total slices = 196. Resting-state BOLD data were acquired with an echo planar imaging sequence (TR = 3000 ms; TE = 36 ms; slice thickness = 3.0 mm; 3.75 mm isotropic resolution; flip angle = 90°; FOV = 240 × 240 mm; matrix = 64 × 64; total slices = 20; total volumes = 273). Whole-brain diffusion-weighted images were acquired using an echo planar imaging sequence (TR = 7000 ms; TE = 68 ms; slice thickness = 2.0 mm; 0.9 mm isotropic resolution; FOV = 230 × 230 mm; acquisition matrix = 256 × 256; axial orientation; 69 gradient directions). Eight images without diffusion weighting (b = 0 s/mm2) were acquired before the acquisition of 69 images (each containing 55 slices) with spatially uniform diffusion gradients applied (b = 1,159 s/mm2). Participants were instructed to rest comfortably with eyes closed without moving or falling asleep for the duration of the scans.
T1-image processing
All T1-weighted images were analyzed using FMRIB software library (FSL), version 5.0.9 (Smith et al., 2004). First, nonbrain matter was removed using FSL automated brain extraction tool (Jenkinson and Smith, 2001; Smith, 2002). Next, brain extracted images were subjected to tissue-type segmentation. Individual T1-weighted images were linearly registered to the standard 2 mm Montreal Neurological Institute (MNI) 152 template, and this registration matrix was used to register the individual gray matter images to MNI space (Jenkinson et al., 2002). Standard space gray matter images were concatenated and averaged to create a study-specific template (Good et al., 2001), and then, each gray matter image was nonlinearly reregistered to the study-specific template and concatenated to produce a four-dimensional gray matter map. To compensate for contraction/enlargement after nonlinear registration, each voxel of the gray matter map was multiplied by the Jacobian of the warp field and smoothed with a 3 mm Gaussian kernel.
SCNs were identified by an independent component analysis using FSL Multivariate Exploratory Linear Optimized Decomposition into Independent Components (MELODIC) on the modulated four-dimensional gray matter map (Beckmann and Smith, 2004; Beckmann et al., 2005; Xu et al., 2009). A 10-component model was selected based on a Bayesian dimensionality estimation (Minka, 2000). Ten spatial components of maximal statistical independence, notably not maximal spatial independence, were defined in which the probability of a voxel being noise was less than 50%. Each spatial component represents a network of voxels where gray matter density covaries across subjects, namely an SCN. Each component was thresholded and binarized at 50%, removing voxels with negative weighting or minimal contribution to the network, to create SCN masks (for SCN masks, see Supplementary Fig. S1). The 10 SCN masks were then cross correlated with 10 intrinsic connectivity networks, which were deduced from an MELODIC analysis of 30,000 individuals' resting-state functional scans (Smith et al., 2009). The average gray matter density of each SCN was extracted for each participant. The loading coefficients of each component were also extracted to give insight into the strength of SCN “expression” for each participant.
Impact of CM on SCNs
The impact of CM on age-related changes in SCNs was assessed in a general linear model as such:
The model was repeated with network expression and total gray matter of each SCN entered as the dependent variable. Statistical p-values were deemed significant below a threshold of 0.05 following false discovery rate (FDR) correction for multiple comparisons across the 20 contrasts. Where β3 was significantly nonzero, the functional form of age-related changes in the SCN was determined by comparing adjusted R2 value of linear and quadratic models and post hoc within-group regressions of age on SCN gray matter density were conducted.
Definition of network nodes
CM was significantly related to gray matter in two SCNs. The two SCNs overlapped substantially (spatial cross correlation: r = 0.43). Further analyses were performed on the SCN that explained greater variance in total gray matter. “Study-specific nodes” were defined as 5 mm spheres around the local maxima of the SCN. The local maxima of the SCN depict the regions that maximally contribute to the SCN. Twenty-eight local maxima were identified and the nodes were labeled as per the Harvard–Oxford atlas (Supplementary Fig. S1 and Supplementary Table S1). The choice of nodes critically influences regional connectivity estimates and network properties (Zalesky et al., 2010). Connectivity of “study-specific nodes” informs on the SCN of interest, but the findings may be difficult to interpret in a wider context. To enhance reproducibility and interpretation, we conducted a parallel line of investigation using a previously established parcellation of the whole brain (Power et al., 2011). Power et al. (2011) defined 236 gray matter regions of interest and 28 white matter regions of interest by combining meta-analysis of task-based fMRI and cortical mapping of rsFC. For the present study, 236 “Power nodes” were generated as 5 mm spheres around the central coordinates of each gray matter region of interest within a functional network defined by Power et al. (2011) using the MarsBaR toolbox (Brett et al., 2002) (Supplementary Fig. S1).
Resting-state fMRI analysis
Functional images of 62 participants were preprocessed using the Statistical Parametric Mapping (SPM12) software package (Wellcome Department of Imaging Neuroscience, London, United Kingdom;
Diffusion-weighted image processing
Probabilistic tractography was performed on 62 diffusion-weighted images using FSL version 5.0.10 (Smith et al., 2004). Diffusion-weighted volumes were eddy current corrected, nonbrain tissue removed, and a diffusion tensor model was fitted at each voxel. Each resulting tensor map was inspected for the appropriate reconstruction of the major pathways. Using FSL PROBTRACK X, a three-fiber orientation diffusion model was fitted to estimate probability distributions on the direction of fiber populations at each brain voxel in the diffusion space of each subject (Behrens et al., 2007). For each subject, 5,000 samples were generated for each node to all other nodes (Supplementary Table S1). Structural connectivity probability of two nodes was calculated as the number of fibers projecting from the seed node to the target node, divided by the total number of fibers projecting from the seed node (Gong et al., 2012). Symmetric diffusion connectivity matrices were generated for each participant by taking the larger of a-to-b or b-to-a. The procedure was conducted twice per participant, with study-specific nodes and with Power nodes.
Impact of CM on functional connectivity and structural connectivity networks
To assess whether CM impacted functional and structural connectivity in a similar manner to gray matter covariance, the statistical procedure outlined in 2.5 was repeated using average functional connectivity and average connectivity probability. The procedure was performed for SCN 3, as well as the DMN and left frontoparietal and right frontoparietal networks as defined by Power et al. (2011).
Group-level network construction
Network analyses were conducted in MATLAB and Statistics Toolbox (The MathWorks, 2016) using the Brain Connectivity Toolbox (Rubinov and Sporns, 2010) and in-house functions. Brain regions were defined as nodes, and correlation/connectivity of brain regions defined as edges. Participants were categorized into CM and No-CM groups. Group average rsFC and structural connectivity matrices were generated within group for each analysis. Group-level gray matter covariance matrices were generated within each group from the Pearson correlation coefficients between each pair of nodes' gray matter density. In line with previous studies, negative edges were removed from group average rsFC and group-level gray matter covariance matrices (Alexander-Bloch et al., 2013; Gong et al., 2012; Teicher et al., 2014).
Debate surrounds the use of thresholding and binarization in graph theory analysis of brain networks (Garrison et al., 2015; Hinne et al., 2013). The primary analyses in the present study were performed using weighted networks for the following reasons: (1) the small size of the networks (28 nodes) conferred low computational demands, (2) optimal thresholding of gray matter covariance networks has not been directly explored, and (3) choice of threshold type and sparsity profoundly impacts the results and interpretation of group differences (Garrison et al., 2015). The majority of previous studies have implemented thresholding and binarization in network construction. Binary graphs are more computationally efficient than weighted networks and likely have fewer false positive connections (van den Heuvel et al., 2017). It has also been argued that thresholding is necessary to model the real sparsity of brain networks (Sporns, 2010). To enable comparison with previous studies, a parallel line of investigation was undertaken using thresholding and binarization in the network construction. Sparsity-based thresholding and binarization were used at 1% increments from 5% to 25%, using positive edges only. The range of thresholding was chosen in line with extant literature (Alexander-Bloch et al., 2013; Gong et al., 2012).
Weighted cross-modal correspondence
Structural connectivity probability was resampled for weighted cross-modal analyses to enable statistical comparison to gray matter covariance and rsFC. Nonzero values were resampled to a Gaussian distribution, then rescaled to a mean of 0.5 and standard deviation of 0.1 (Honey et al., 2009). It has also been suggested that this method more closely reflects the true structural connectivity of the brain (Honey et al., 2009).
The relationship of gray matter covariance and rsFC with structural connectivity was first examined based on the probability density of gray matter covariance values and rsFC values in the presence and absence of an underlying structural connection (nonzero connectivity probability). Next, the relationship of structural connectivity probability with gray matter covariance and rsFC was modeled within group by univariate linear regression. The unique relationship of structural connectivity probability with gray matter covariance, independent of rsFC, has not been estimated previously. To this end, a mediation analysis was conducted testing the effect of rsFC on the relationship between gray matter covariance and structural connectivity (Baron and Kenny, 1986). Group differences in cross-modal correspondence were assessed by means of nonparametric permutation testing (1,000 random group assignments) (Bullmore et al., 1999; Simpson et al., 2013) and deemed significant where p < 0.05.
Binary cross-modal convergence
The percentage of cross-modal convergence in two binary networks was defined as the ratio of convergent edges to the number of suprathreshold edges (Gong et al., 2012). In sparse proportionally thresholded networks, this metric informs on the similarity of the network backbones and the similarity of edge strength ranks. The analysis was repeated within each group for gray matter covariance-rsFC, gray matter covariance-structural connectivity, and rsFC-structural connectivity across 1% increments from 5% to 25% threshold levels. The area under the curve was calculated across the thresholds and group comparisons were performed by means of nonparametric permutation testing (1,000 random group assignments) (Bullmore et al., 1999; Simpson et al., 2013). Statistical p-values were deemed significant using an alpha level of 0.05 with FDR correction across the four network types and three contrasts.
Results
Clinical characteristics of the cohort
Demographic and clinical characteristics of the participants are described in Table 1. The maltreated and nonmaltreated groups did not differ in terms of age [t(119) = 0.08, p > 0.05] or proportion of females [χ2(119) = 0.03, p > 0.05]. The maltreated group reported significantly higher levels of CM across all subscales. Although the distribution of disorder types was similar in the maltreated and nonmaltreated groups, CM was associated with greater symptom severity, as illustrated by significantly higher OASIS scores in the whole cohort and significantly higher HDRS (Hamilton Depression Rating Scale), BPRS (Brief Psychiatric Rating Scale), OASIS (Overall Anxiety Severity and Impairment Scale), and K10 (Kessler-10) in the restricted cross-modal cohort.
Demographic and Clinical Characteristics of Cohort
Mean (standard deviation) or n (%) provided where relevant. t(df) and χ2 outcomes are presented, with * p < 0.003. Clinical data were not available for all participants. The number of participants with available data is equivalent to df + 2.
BPRS, Brief Psychiatric Rating Scale; CM, childhood maltreatment; CTQ, Childhood Trauma Questionnaire; HDRS, Hamilton Depression Rating Scale; No-CM, no childhood maltreatment; OASIS, Overall Anxiety Severity and Impairment Scale.
Relationship of CM with gray matter across SCNs
Ten SCNs were identified (Supplementary Fig. S3). Gray matter density significantly decreased with age in seven SCNs (Supplementary Table S2). Network expression significantly decreased with age in two SCNs (Supplementary Table S2). Neither gray matter nor network expression significantly increased with age in any SCN. CM was associated with reduced gray matter in SCN 3 (β = −0.138, se = 0.052, t = −2.652, p = 0.04 FDR corrected, Fig. 2) and SCN 5 (β = −0.148, se = 0.049, t = −3.001, p = 0.02 FDR corrected). Maltreated and nonmaltreated groups exhibited significantly different age-related gray matter loss in SCN 3 (β = 0.006, se = 0.003, t = 2.505, p = 0.05 FDR corrected) and SCN 5 (β = 0.007, se = 0.002, t = 2.931, p = 0.02 FDR corrected). A spatial cross correlation of SCN 3 and SCN 5 showed substantial overlap (r = 0.43). Further analyses were performed on SCN 3 because it explained greater variance in gray matter covariance than SCN 5 (Supplementary Table S2). The regions covered by SCN 3 are widely distributed (Fig. 2). Spatial cross correlation with resting-state intrinsic connectivity networks revealed overlap with the DMN (r = 0.28) and frontoparietal networks (left: r = 0.17, right: r = 0.10). We confirmed that CM was associated with reduced gray matter density across the DMN and frontoparietal network using a standard atlas of the networks (Power et al., 2011; Supplementary Data). Linear growth in SCN 3 gray matter provided a better fit than quadratic growth in the nonmaltreated (linear adjusted R 2 = 0.38, quadratic adjusted R 2 = 0.38) and maltreated group (linear adjusted R 2 = 0.07, quadratic adjusted R 2 = 0.05). Post hoc within-group regressions revealed that gray matter decreased at a slower rate with age among maltreated individuals (β = −0.004, t = −2.432, p = 0.018, Fig. 3-right) compared with nonmaltreated individuals (β = −0.0012, t = −6.100, p < 0.0001, Fig. 3-left). Subsequent analyses were performed using key nodes of SCN 3 (Supplementary Table S1).
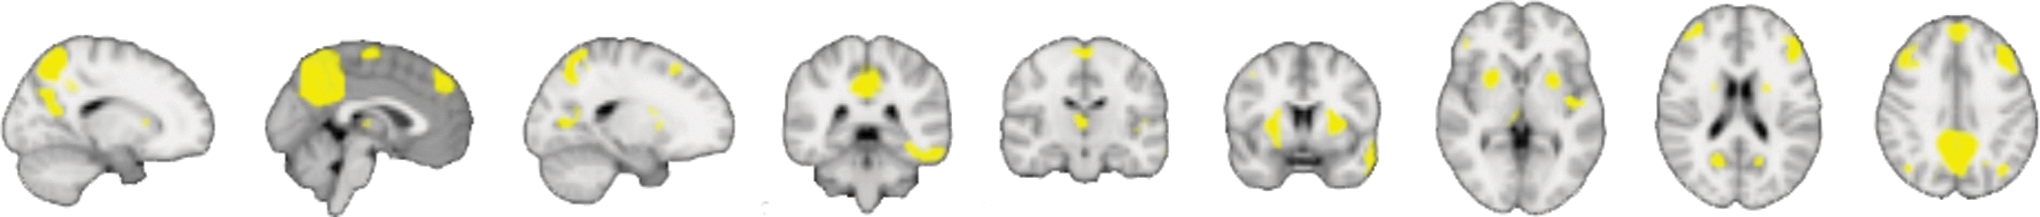
SCN in which gray matter density is significantly reduced in young people with a history of CM. Color images available online at
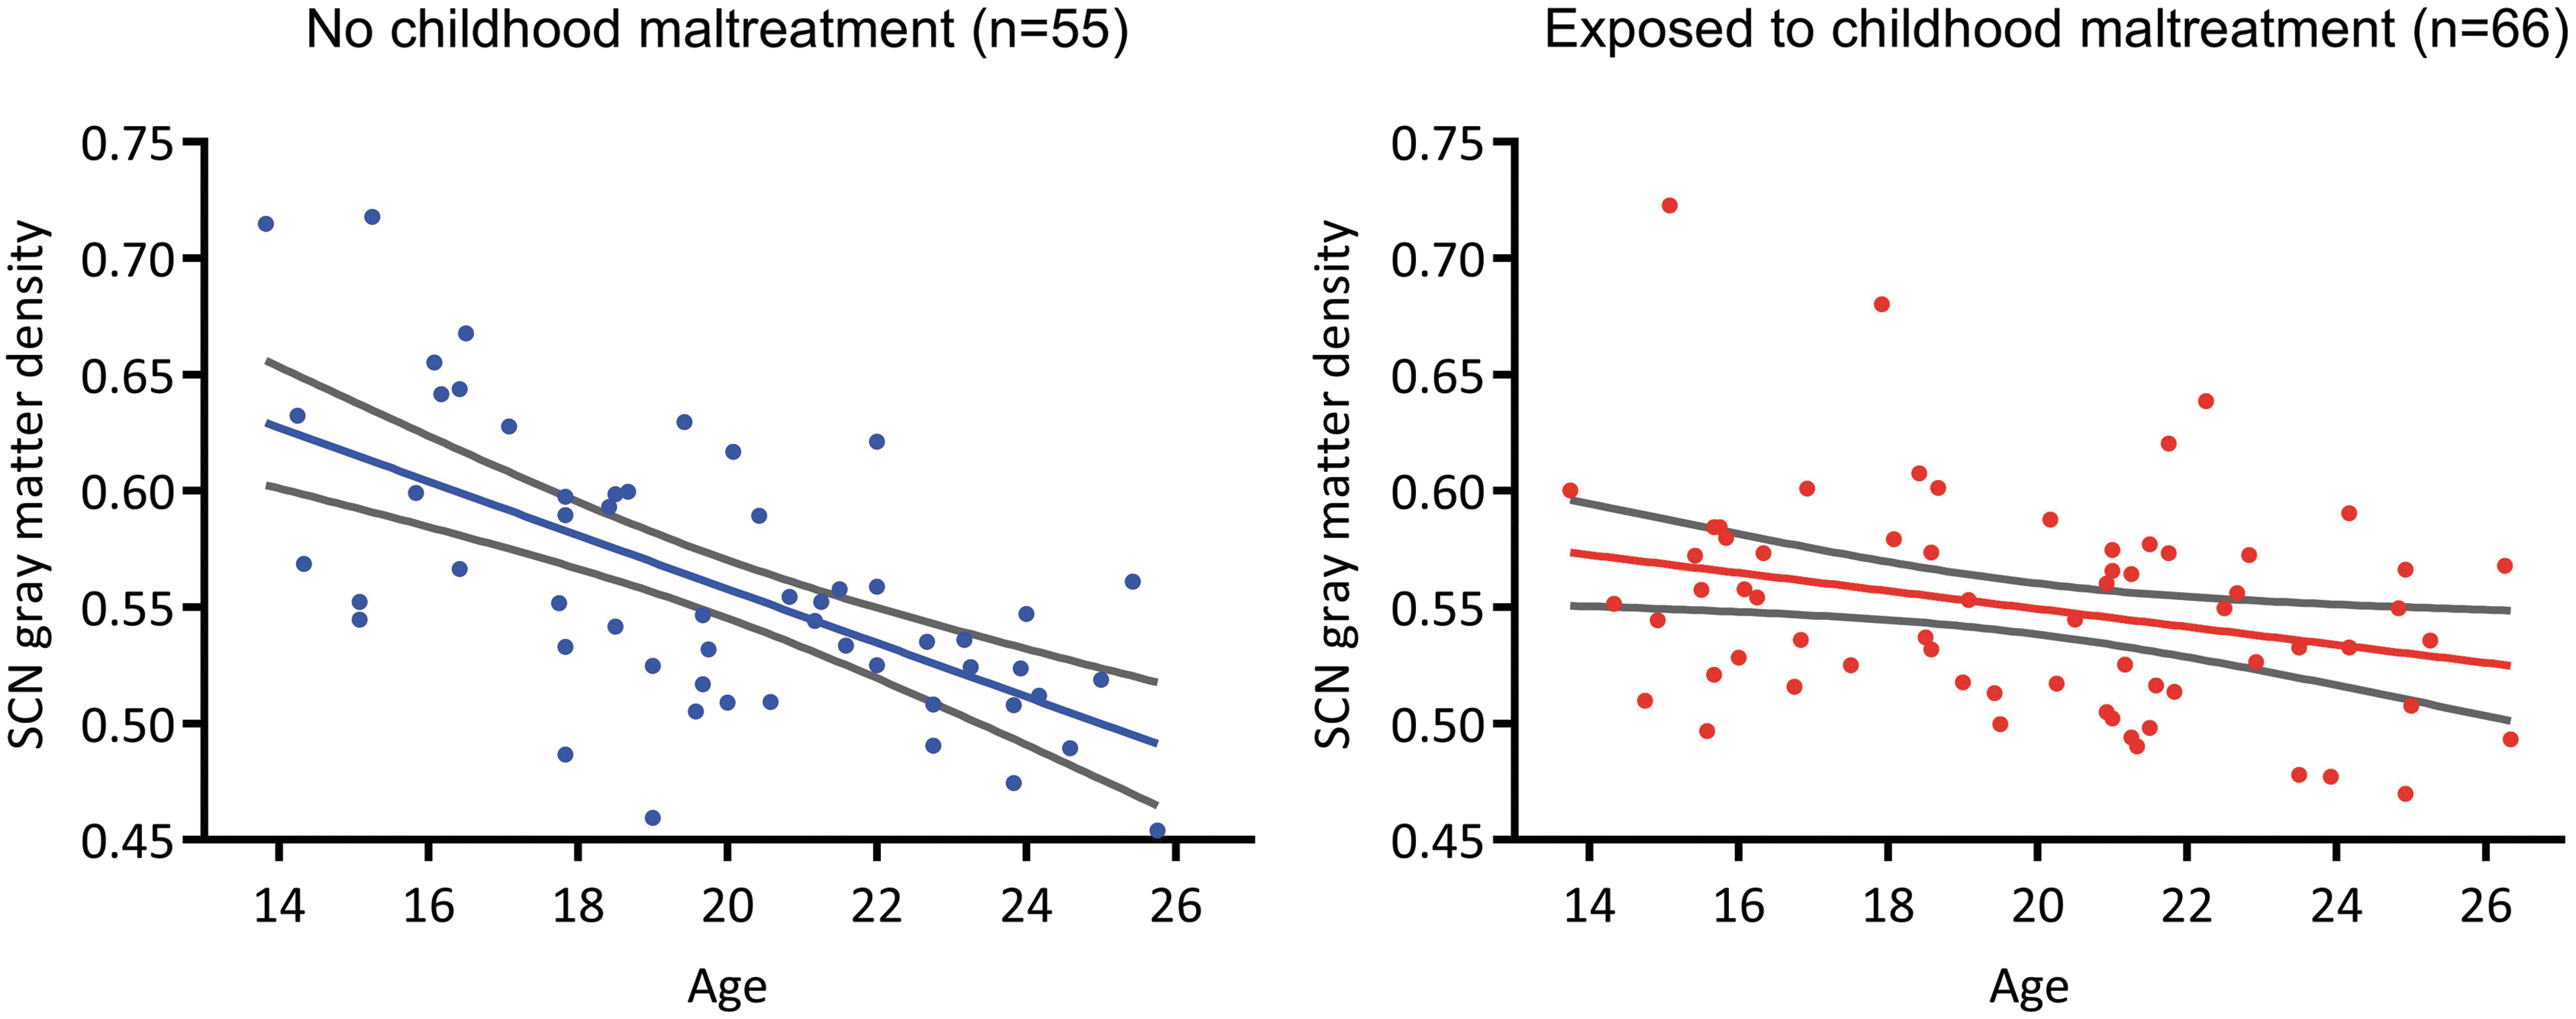
Age-related changes in gray matter density within the SCN significantly differ between youth without CM (left) and youth exposed to CM (right). Ninety-five percent confidence intervals shown in gray. Color images available online at
Impact of CM on functional and structural connectivity
Average functional connectivity and average structural connectivity probability were not significantly related to CM or age (Supplementary Tables S3 and S4).
Cross-modal correspondence in weighted networks
The full statistical outcomes of the mediation analyses are reported in Table 2. rsFC significantly predicted gray matter covariance in nonmaltreated and maltreated groups at the level of the SCN, DMN, frontoparietal network, and whole-brain connectome (path b). Interestingly, correspondence of rsFC and gray matter covariance was stronger in the SCN (No-CM: β = 0.39, CM: β = 0.43) than expected by the global correspondence (No-CM: β = 0.18, CM: β = 0.15). Structural connectivity probability significantly predicted rsFC to a small degree in both groups at all levels (path a: 0.06 ≤ β ≤ 0.13). To a lesser extent, structural connectivity probability also significantly predicted gray matter covariance in both groups at all levels (path c: 0.02 ≤ β ≤ 0.13). CM was associated with significantly greater correspondence of structural connectivity probability with gray matter covariance within the SCN (β = 0.13, se = 0.019, t = 6.87, p < 0.001), relative to the nonmaltreated group (β = 0.09, se = 0.021, t = 4.37, p < 0.001). Conversely, CM was also associated with significantly reduced global correspondence of structural connectivity probability and gray matter covariance (β = 0.03, se = 0.002, t = 17.50, p < 0.001), relative to the nonmaltreated group (β = 0.03, se = 0.002, t = 19.96, p < 0.001). A similar pattern of group differences emerged on inspection of the unique correspondence of structural connectivity probability with gray matter covariance, controlling for rsFC. In the nonmaltreated group, structural connectivity probability did not significantly predict gray matter covariance within the SCN after controlling for rsFC (β = 0.03, se = 0.022, t = 1.24, p = 0.215), indicating that rsFC completely mediates the relationship between structural connectivity probability and gray matter covariance within the SCN. In contrast, a small unique association between structural connectivity probability and gray matter covariance was evident in the maltreated group while controlling for rsFC (β = 0.07, se = 0.020, t = 3.42, p = 0.008). This pattern of results appeared to be specific to the SCN, as structural connectivity probability significantly predicted gray matter covariance in the DMN, frontoparietal network, and whole brain in both groups, after controlling for rsFC.
Cross-Modal Correspondence Within Structural Covariance Network, Default Mode Network, Frontoparietal Network, and the Whole Brain
Significant group differences in the regression coefficient are signified with an emboldened text.
Path a: rsFC ∼ structural connectivity probability; Path b: gray matter covariance ∼ rsFC; Path c: gray matter covariance ∼ structural connectivity probability; Path c′: gray matter covariance ∼ structural connectivity probability, controlling for rsFC.
DMN, default mode network; rsFC, resting-state functional connectivity; SCN, structural covariance network.
Cross-modal convergence in binary networks
CM was associated with significantly enhanced convergence of rsFC with structural connectivity probability in the study-specific SCN (p < 0.05 FDR corrected, Fig. 4). This effect was driven by convergence of rsFC and structural connectivity probability in the inferior temporal gyrus among the maltreated groups (Supplementary Fig. S4). Convergence of gray matter covariance and rsFC within the study-specific SCN ranged from 32% to 47% in the maltreated group and from 30% to 58% in the nonmaltreated group (Fig. 4). The groups did not significantly differ in gray matter covariance-rsFC convergence within the SCN, but CM was related to significantly reduced gray matter covariance-rsFC convergence in the DMN (p < 0.05 FDR corrected, Supplementary Fig. S5). CM was not associated with abnormal convergence of gray matter covariance and structural connectivity, which ranged from 33% to 41% in the maltreated group and from 27% to 45% in the nonmaltreated group in the study-specific SCN (Fig. 4).
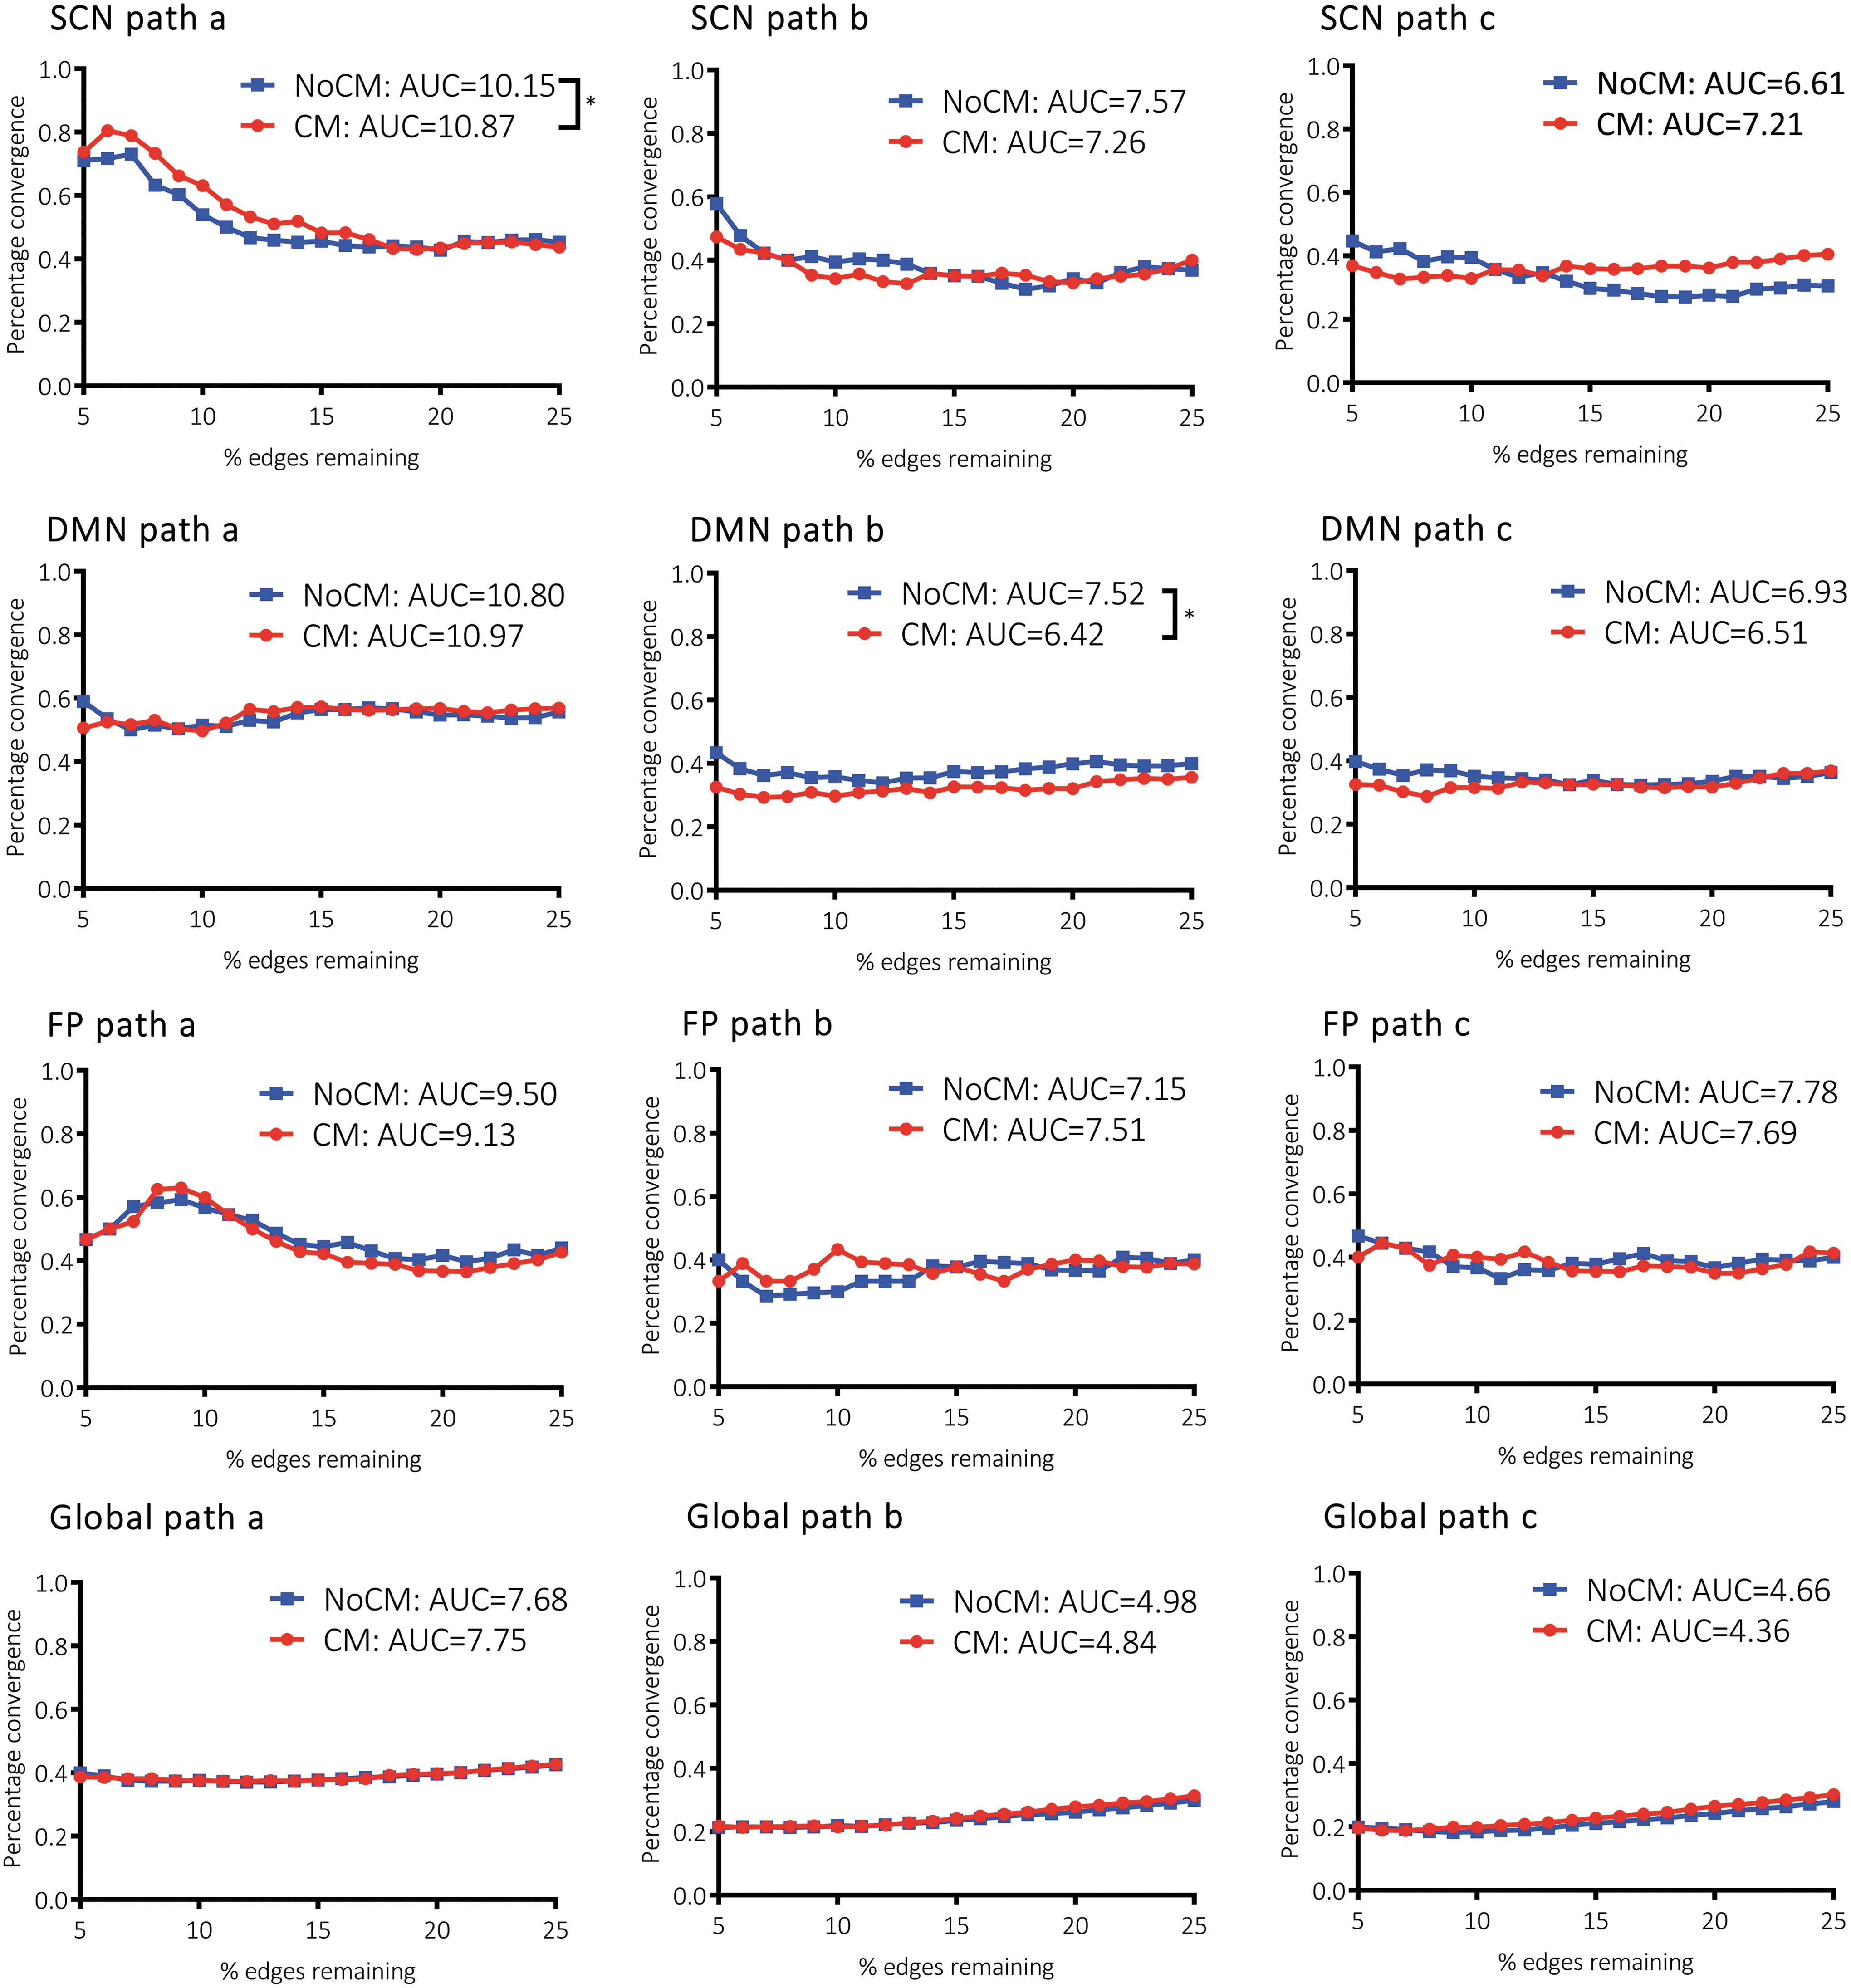
Distribution of cross-modal convergence as function of network sparsity. Significant group differences (*) in the AUC were determined by nonparametric permutation testing using an alpha value of 0.05, FDR corrected across the 12 contrasts. AUC, area under the curve; FDR, false discovery rate. Color images available online at
Discussion
The present study is the first cross-modal analysis of a network disrupted by CM. CM was linked to blunted age-related decreases in gray matter across an SCN, which encompassed default mode and frontoparietal areas. Gray matter covariance across this network was significantly correlated with rsFC, and rsFC mediated the relationship between gray matter covariance and structural connectivity in the nonmaltreated group. Individuals with a history of CM exhibited a unique association of gray matter covariance with structural connectivity. These findings were specific to a study-derived SCN, and further research is necessary to understand the spatial pattern of cross-modal correspondence across the whole brain.
Gray matter follows regionally distinct, inverted U-shaped developmental trajectories (Giedd et al., 2014; Gogtay et al., 2004). In the present study, gray matter in SCNs was found to linearly decrease through youth. Gray matter loss across two SCNs was significantly less among individuals with a history of CM. The present results suggest that CM induces flattened development, precocious peaking, or early accelerated decline of gray matter. In support of the former, longitudinal studies have shown that CM is related to reduced left amygdala growth from 12 to 16 years (Whittle et al., 2013) and reduced right hippocampal growth from 14 to 28 years (Paquola et al., 2017). Pre-clinical studies have begun to elucidate epigenetic pathways that may link early life stress to reduced gray matter growth. Increased DNA [cytosine-5-]-methyltransferase (DNMT1) and decreased retinoic acid receptor-a following maternal separation have been shown to mediate the reduced capacity of adult progenitor cells to differentiate in the dentate gyrus of adolescent rats (Boku et al., 2015). In combination with the present results, this evidence suggests CM could lead to a flattened trajectory of gray matter development in certain regions, with reduced growth before the peak and reduced loss after the peak.
The regions implicated in the present study overlap with the DMN (precuneus, posterior parietal lobules, lateral temporal cortex) (Raichle, 2015) and the frontoparietal network (rostrolateral prefrontal cortex, precuneus, anterior inferior parietal lobule) (Vincent et al., 2008). The DMN is involved in self-referential activity, and functional coupling of the DMN with the frontoparietal network supports autobiographical planning (Gerlach et al., 2014; Spreng et al., 2010). Findings on the long-term effects of CM on gray matter and functional connectivity across these regions are mixed (Paquola et al., 2016; Philip et al., 2013; van der Werff et al., 2013). The effect of CM on SCN gray matter, but not SCN expression, observed here is suggestive of a widespread network-level effect of CM. The widespread effects of CM may result from initial insults to hub regions, such as the precuneus. Brain regions at the core of a network have the strongest probability of influencing other regions (Kitsak et al., 2010). Hubs also appear to be disproportionately affected in brain disorders (Crossley et al., 2014). High susceptibility of hubs to neurological insult may be due to a high proportion of shortest paths between brain regions passing through hubs (van den Heuvel et al., 2012) and high baseline activity of hubs conferring enhanced vulnerability to metabolic stress (Fornito et al., 2015).
The present study is the first to explicitly investigate how rsFC mediates the relationship between structural connectivity and gray matter covariance in brain networks. Alongside the strong independent relationship of rsFC with gray matter covariance, partial mediation of the structural connectivity/gray matter covariance relationship by rsFC provides further support for functional coactivation driving SCN development. Decreased DMN activity, as has been observed in women with post-traumatic stress disorder subsequent to CM (Bluhm et al., 2009), may therefore contribute to resultant reduced gray matter across the default mode SCN. This assertion is further supported by significantly reduced convergence of gray matter covariance and rsFC in the DMN of maltreated individuals. While structural connectivity was not related to gray matter covariance beyond the indirect influence of rsFC in the nonmaltreated group, a unique association of structural connectivity with gray matter covariance was discovered within the maltreated group. Previous research has shown that structural connections are on average weaker in adults with a history of CM (Ohashi et al., 2017). CM may therefore engender greater dependence of synchronous gray matter growth on structural connectedness, but weak structural connections may lead to reduced gray matter growth. Alternatively, CM may independently impact gray matter and white matter growth. Increased gray matter covariance/structural connectivity coupling observed here may be symptomatic of the common trophic effect of early life stress. Longitudinal studies mapping the changes in structural and functional connectivity and their alignment with gray matter covariance are essential to elucidate the validity of these preliminary hypotheses.
This study also raises some important considerations. A data-driven approach was used in the present study in defining whole-brain SCNs, whereas previous studies have focused on a single cortical thickness covariance network or seed-based SCNs. We found that the effect of CM on the gray matter density extended from the study-specific SCN to the DMN and frontoparietal network, however, group differences in cross-modal correspondence were specific to the study-specific SCN. Enhanced sensitivity of the SCN to the impact of CM may arise from the construction of the SCN within the cohort and selection of the SCN based on its relationship with CM. Interestingly, the study-specific nodes were also asymmetric. There is some evidence that CM has a greater impact on the left hemisphere (Paquola et al., 2016), thereby interactions between the left dominant study-specific nodes may be more likely affected by CM than the symmetrical DMN and FP networks. Further research into the construction of SCNs and their relationship with intrinsic connectivity networks may shed light on how local differences in gray matter translate to alterations at a network level, as well as the evident influence of node definition. The cross-sectional nature of this study limited our ability to directly observe neurodevelopmental effects and establish causal relationships, and age-related changes in network topology could not be measured due to sample size constraints. Finally, the psychiatric heterogeneity of this cohort is reflective of the clinical service from which participants were recruited (Scott et al., 2012). Group differences in severity of mental illness may contribute to the findings, however, CM is related to worse clinical severity (Dovran et al., 2016; Simon et al., 2009) and selecting participants based on clinical severity would introduce additional bias. Replication in other psychiatric cohorts and healthy cohorts is essential to validate the generalizability of these findings.
Conclusion
For the first time, the present study expounds the relationship of gray matter covariance with both structural connectivity and rsFC. Cross-modal relationships were found to be sensitive to CM. From these comparisons, reduced gray matter following CM was suggested to arise from deficient functional activity or heightened dependence on structural connections for coordinated gray matter growth. The widespread perturbation of gray matter development across the DMN and frontoparietal network following CM may have significant implications for mental well-being, given the networks' roles in self-referential activity. Future studies should aim to replicate these findings in healthy and psychiatric cohorts to determine whether abnormal neurodevelopment confers enhanced psychiatric risk.
Footnotes
Acknowledgment
This research did not receive any specific grant from funding agencies in the public, commercial, or not-for-profit sectors.
Author Disclosure Statement
No competing financial interests exist.
References
Supplementary Material
Please find the following supplemental material available below.
For Open Access articles published under a Creative Commons License, all supplemental material carries the same license as the article it is associated with.
For non-Open Access articles published, all supplemental material carries a non-exclusive license, and permission requests for re-use of supplemental material or any part of supplemental material shall be sent directly to the copyright owner as specified in the copyright notice associated with the article.