
Abstract
The primary hand motor region is classically believed to be in the “hand knob” area in the precentral gyrus (PCG). However, hand motor task-based activation is often localized outside this area. The purpose of this study is to investigate the structural and functional connectivity driven by different seed locations corresponding to the little, index, and thumb in the PCG using probabilistic diffusion tractography (PDT) and resting-state functional magnetic resonance imaging (rfMRI). Twelve healthy subjects had three regions of interest (ROIs) placed in the left PCG: lateral to the hand knob (thumb area), within the hand knob (index finger area), and medial to the hand knob (little finger area). Connectivity maps were generated using PDT and rfMRI. Individual and group level analyses were performed. Results show that the greatest hand motor connectivity between both hemispheres was obtained using the ROI positioned just lateral to the hand knob in the PCG (the thumb area). The number of connected voxels in the PCG between the two hemispheres was greatest in the lateral-most ROI (the thumb area): 279 compared with 13 for the medial-most ROI and 9 for the central hand knob ROI. Similarly, the highest white matter connectivity between the two hemispheres resulted from the ROI placed in the lateral portion of PCG (p < 0.003). The maximal functional and structural connectivity of the hand motor area between hemispheres occurs in the thumb area, located laterally at the “hand knob.” Thus, this location appears maximal for rfMRI and PDT seeding of the motor area.
Introduction
The part of the brain that controls hand motor function in the precentral gyrus (PCG) has been studied with task-based functional magnetic resonance imaging (fMRI) (Drobyshevsky et al., 2006; Hlustík et al., 2001; Lotze et al., 2003; Marshall et al., 2004; Porro et al., 1996; Siero et al., 2014; Yousry et al., 1997, 2001) and transcranial magnetic stimulation (TMS) (Ahdab et al., 2016; Diekhoff et al., 2011). However, the exact anatomical location of this brain area remains somewhat nebulous. Identification of the precise anatomical location associated with hand motor function is essential, particularly for pre-neurosurgical planning.
Traditionally, the primary hand motor region is believed to be in the “hand knob” in the PCG, which resembles an upside-down omega or epsilon shape from the axial imaging (Yousry et al., 1997, 2001). However, several studies opened a possibility that the hand knob may not be the optimum area for projecting maximum functional and structural connectivity between hemispheres. A study using fMRI and electrocorticography (ECoG) (Hlustík et al., 2001; Siero et al., 2014) showed specific finger-associated activation areas and displayed a topographical medial to lateral layout for the little finger to index to thumb, which reflects that specific finger-oriented activation is not controlled by the hand knob. Recently, another study using TMS further supports our clinical observations, demonstrating that the “hotspot” for hand-motor activation is not always located in the hand knob of the PCG for all subjects (Ahdab et al., 2016).
In addition, our clinical fMRI experience related to presurgical brain mapping suggests that the task-based fMRI activation for hand motor function is not always within the upside-down omega region. In addition, our group and others have found that when performing diffusion tensor imaging (DTI) tractography in clinical practice, the best connectivity is achieved by slightly shifting the regions of interest (ROIs) away from the hand knob.
Resting-state fMRI (rfMRI) is able to measure cortical and subcortical functional connectivity based on the low-frequency oscillations of spontaneous neural activity (Biswal et al., 1995, 1997). The rfMRI data can be processed through several techniques, including the seed analysis method, which examines the functional connectivity of a specific brain region (Beckmann et al., 2005; Biswal et al., 1997; Cordes et al., 2000; Martijn et al., 2010; van den and Hulshoff Pol, 2010). DTI provides a reliable, in vivo, and noninvasive model that estimates the diffusion anisotropy and orientation of neural structure and extract white matter tracks using a variety of tractography algorithms. Probabilistic rather than deterministic tractography has been used to precisely depict fiber connections in the hand motor area of both hemispheres (Basser et al., 2000; Behrens et al., 2003, 2007; Kreher et al., 2008; Mori and Mori, 1995). One of the advantages of probabilistic diffusion tractography (PDT) over deterministic DTI is the former method can detect cross-fibers and fiber bundles associated with the hand motor region that branch and deviate (Pan et al., 2012; Jenabi et al., 2014).
To analyze rfMRI and PDT data based on seed-based techniques, an a priori defined seed region must be selected. Therefore, one of the biggest challenges that could change the accuracy of both rfMRI and PDT results is choosing a suboptimal location for the seed ROI. Although many methods of generating seed ROIs have been used across studies, there is no accepted standardized method. Even in healthy individuals, because of normal variability in brain anatomy, the exact area that represents a functional and anatomical region for one individual may not always represent the same region as strongly in another individual (Sohn et al., 2015).
The purpose of this study is to investigate the structural and functional connectivity driven by three different locations on the PCG that correspond to three specific fingers (little, index, and thumb), based on published anatomical drawing that generally depicts the thumb area larger than the other fingers, using PDT and rfMRI methods. We hypothesize that the maximal structural and functional connectivity will be driven by the ROI corresponding to the thumb representation area.
Materials and Methods
Subjects
Data were obtained from the Human Connectome database, openly available to the scientific community for examination and exploration (data set name: WU-Minn HCP lifespan pilot data
MR acquisition
MRI data set (Washington University Siemens 3T Tesla Connectome MR Scanner) was extracted from each subject. Structural data, including T1-weighted (slice thickness = 0.8 mm isotropic, TR/TE = 2400/2.12 msec, matrix = 300 × 208, flip angle = 8°, FOV = 256 × 80 mm) and T2-weighted (slice thickness = 0.8 mm isotropic, TR/TE = 3200/565 msec, matrix = 300 × 208, flip angle = T2 variable, FOV = 256 × 180 mm) data, were obtained. rfMRI data were obtained with following parameters: gradient-echo EPITR/TE = 720/33.2 msec, matrix = 104 × 90 with 72 slices, flip angle = 52°, slice thickness = 2 mm isotropic, multiband factor = 8, FOV = 208 × 180 mm, echo spacing = 0.58 msec, BW = 2290 Hz/Px, volumes = 420. DTI data were obtained with the following parameters: spin-echo EPI, TR/TE = 3730/76.6 msec, matrix = 140 × 120 mm with 92 slices, slice thickness = 1.5 mm isotropic, flip angle = 78°, multiband factor = 3, echo spacing = 0.78 msec, BW = 1488 Hz/Px, b values = 1000, 2500 sec/mm, 80 directions with both RL and LR phase-encoding polarity (Setsompop et al., 2012; Sotiropoulos et al., 2013; Van Essen et al., 2013).
Data processing and analysis
Resting-state fMRI
Functional data for each subject were preprocessed using AFNI's “uber_subject.py” scripting algorithm (Cox, 1996). For all the preprocessing strategies, the functional data underwent established preprocessing steps, including despising, slice-time correction, three-dimensional motion correction, nuisance regression with motion parameters, and registration to MNI 152 (the Montreal Neurological Institute template 152). Bandpass filtering consisted of filtering the functional data between 0.01 and 0.1 Hz to isolate spontaneous fluctuation corresponding to neuronal response, followed by spatial smoothing with Gaussian kernel (4 mm full-width at half-maximum [FWHM]).
Determination of region of interest for rfMRI
A previous study (Hlustík et al., 2001; Siero, et al., 2014) applied high-resolution blood-oxygenation-level-dependent (BOLD) fMRI and high-density ECoG to obtain a topographical map of cortical columns in the sensorimotor cortex. The study identified individual finger movement activation areas and showed a topographical medial to lateral layout of activation areas of the little, index, and thumb finger. Therefore, ROIs used in this study have been chosen based on the location of these three activation areas.
After standard preprocessing procedures, three seed ROIs, each depicted as a sphere with the diameter of 6 mm, were placed in the cortical surface along the posterior aspect of the PCG (a) immediately lateral (defined as thumb finger representation) to the hand knob, (b) within the hand knob (defined as index finger representation), and (c) immediately medial (defined as little finger representation) to the hand knob of the PCG in the left hemisphere on a T1 image (Fig. 1) of each subject. A neuroradiologist checked to ensure the location of ROIs. Then nonlinear transformation was applied to transfer ROI to functional and diffusion space of the same subject. These ROIs were thus named lateral, hand knob, and medial, respectively, and were used to generate both resting-state functional connectivity maps from rfMRI data and probabilistic connectivity maps from PDT data.
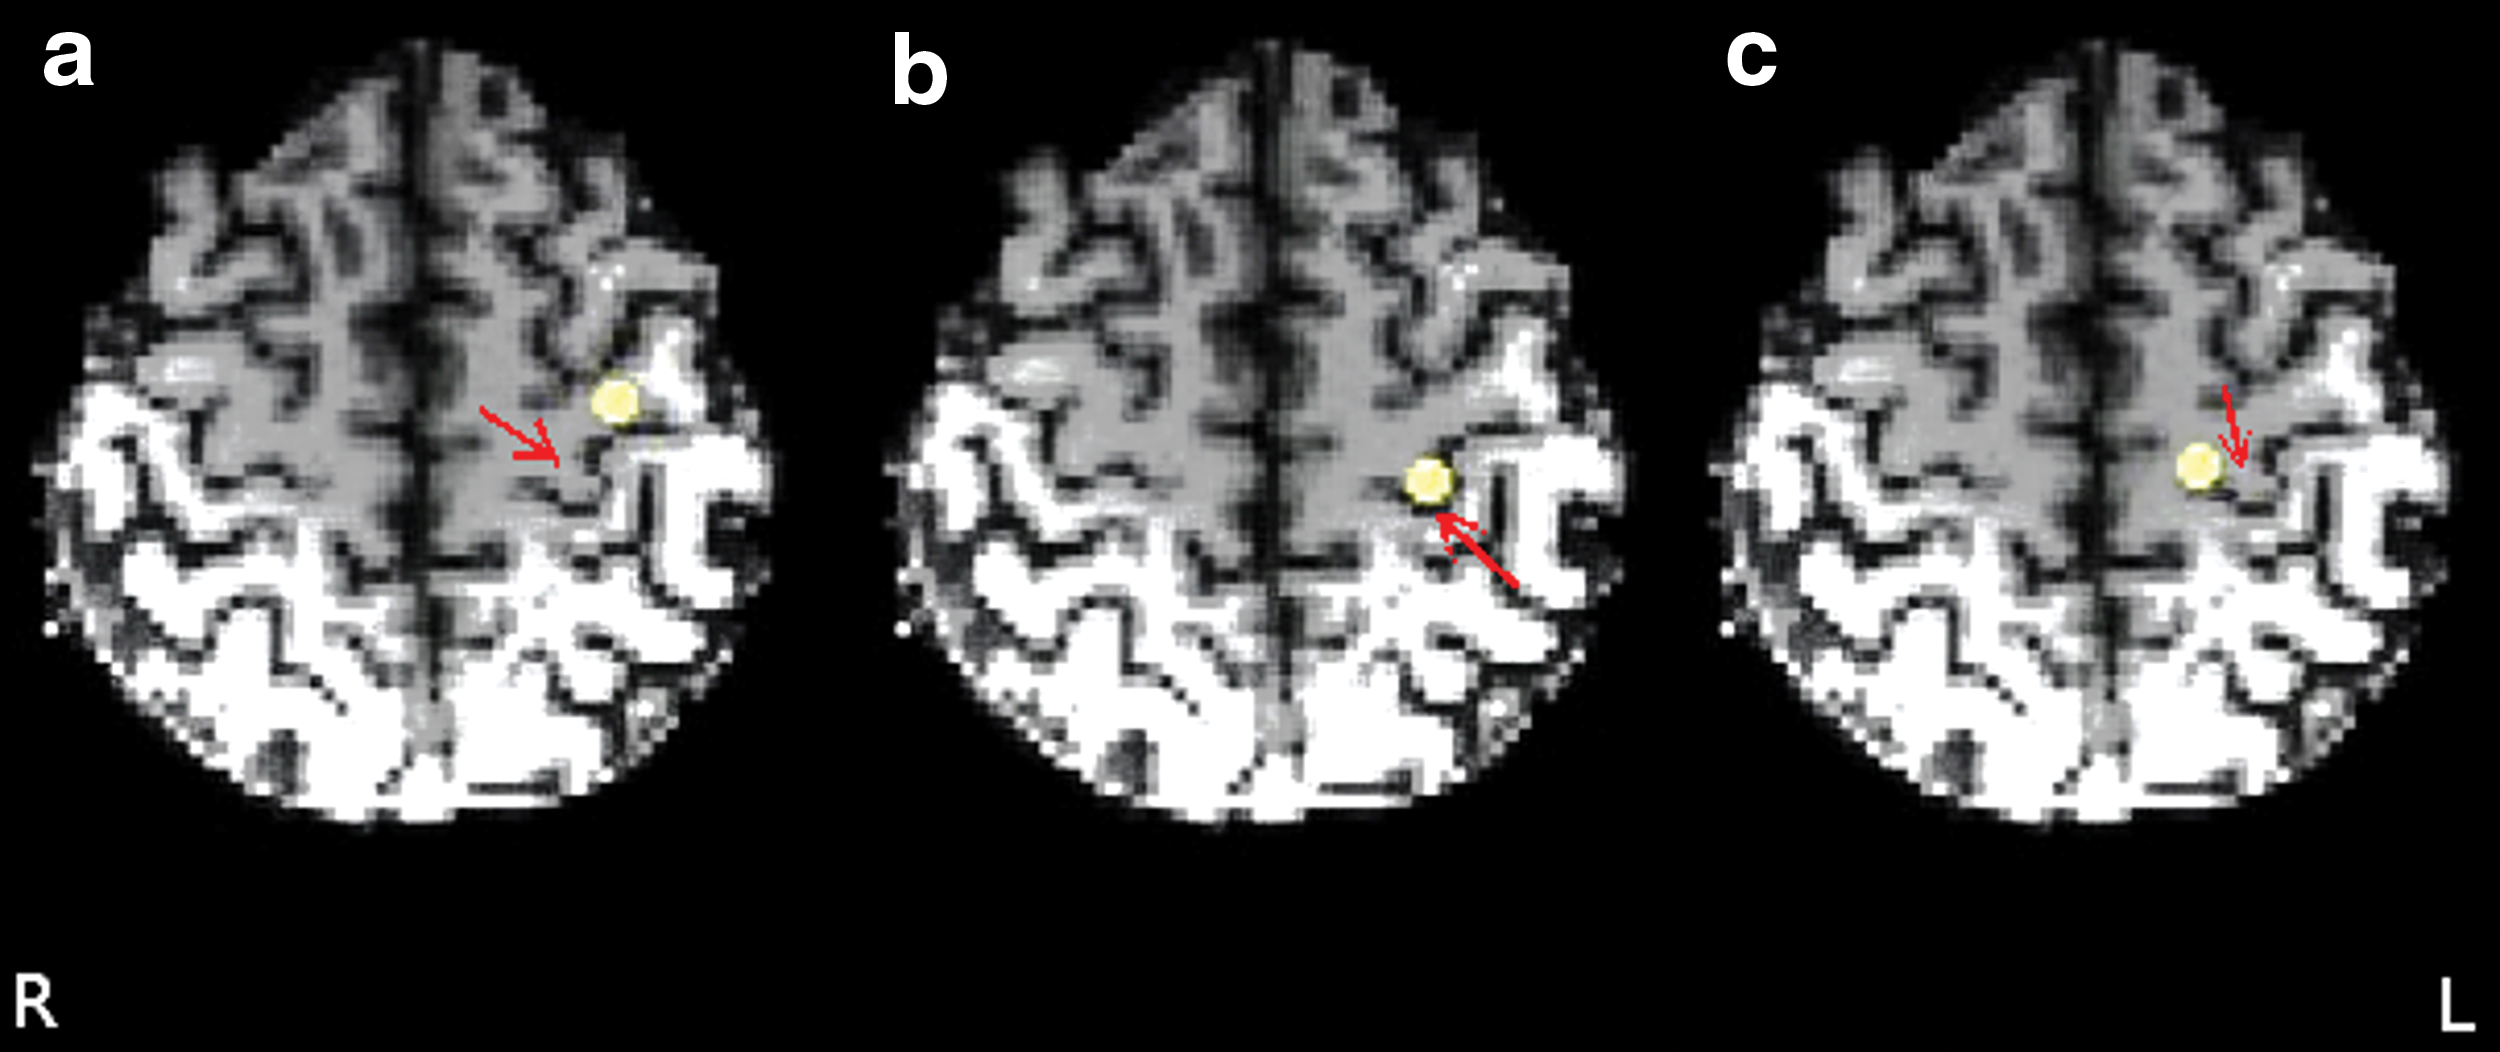
ROIs used for rfMRI and probabilistic tractography. Sphere ROIs with the diameter of 6 mm are shown on the axial T1-weighted image. ROIs were placed on the
DTI and probabilistic tractography
Diffusion-weighted data were preprocessed using the FSL FDT-Diffusion toolbox (FSL;
PDT was performed to estimate interregional connectivity probability along white matter pathways using the FSL tools PROBTRACKX. A multifiber tractography model using Metropolis Hastings Markov Chain Monte Carlo sampling was used for probabilistic tracking (Behrens et al., 2003, 2007). The number of streamline samples per voxels was set to 5000 and the curvature threshold was set to 0.2 mm−1 to estimate the connectivity distribution from each ROI to the whole brain. Three connectivity paths for each subject were generated that contained all possible voxels connecting each ROI to the whole brain.
Group analysis
Using the AFNI, cross-correlations between the mean time series of each predefined ROI and each voxel in the brain were calculated for each subject first. Then, a threshold of t > 4 (p < 0.002, false discovery rate [FDR], q < 0.05%) was set to preserve all significant voxels in the right PCG. The t value was considered to minimize false positive. Finally, three functional connectivity maps, one for each ROI, were generated for each subject. Cross-correlations maps were converted to z-scores using Fisher's Z transformation to normalize and reduce skewing the results. To generate functional connectivity group maps, we performed the t-test, setting the z-scores against zero. A high t would indicate that r, the distribution mean, was significantly different from zero. Thus, three functional connectivity group maps, one for each ROI, were generated and were named lateral, hand knob, and medial functional maps with respect to the origin of ROIs.
The FSL was used to generate probabilistic connectivity group maps. To prepare individual images for group-level analysis, nonlinear transformation of probabilistic maps into MNI 152 space was performed to create a basis of uniformity between the individual images. Then, all probabilistic maps were combined into one four-dimensional image. As a result, three probabilistic connectivity maps were generated and named lateral, hand knob, and medial probability maps with respect to the origin of ROIs. Finally, threshold-free cluster enhancement was applied to perform a one-sample t-test on each map (Smith and Nichols, 2009; Smith et al., 2006) using the FSL randomize tool. Group connectivity maps were then thresholded at 95% and 99% to collect all significant voxels of each map at p < 0.05 and p < 0.01. To improve homogeneity, 5 mm FWHM variance smoothing was applied.
Statistical analysis
For each functional connectivity map of individual, the number of activated voxels above the threshold (measured with p < 0.002, FDR q < 0.05%) in the right PCG was counted to perform two unpaired t-tests between lateral and hand knob or medial maps, respectively. These clusters of voxels with the highest connectivity value in the PCG of the right hemisphere were then used to measure the correlation values between the lateral, hand knob, and medial maps of the left hemisphere, respectively. Only maximum connected voxels (∼10–15 voxels) in the right side were considered. Then, the averaged correlation value from those voxels was calculated for each subject. The correlation values calculated were displayed in the graph. As a next step, a conjunction analysis was applied to show which voxels are commonly connected among all 12 subjects.
For PDT, all the connected voxels from lateral, hand knob, and medial probabilistic maps in the right hemisphere at the level of hand motor with at least mean probabilistic connectivity index of 0.95 were counted to perform two unpaired t-tests between lateral and hand knob maps and between lateral and medial maps. Mean connected voxels for individual maps also were measured.
Results
Both rfMRI and PDT demonstrated a consistent finding: for every subject, PDT showed that the lateral ROI successfully mapped a visible hand motor tract through both hemispheres. In all cases, rfMRI also indicated that the lateral ROI showed the strongest connectivity between PCGs in two hemispheres.
Resting-state functional connectivity (rfMRI)
There is robust connectivity in the right motor cortex revealed by the lateral map as shown in Figure 2. The connectivity maps are seen along the lateral aspects of the right PCG. Connected voxels are also identified on the hand knob map; however, the volumes are much less than the lateral location. Significantly connected voxels within the right hemisphere PCG (boxed in Fig. 2) were counted at t > 4 (p < 0.002). The number of connected voxels above the threshold (measured with p < 0.002) in the right PCG was 279, 13, and 9 voxels when an ROI was placed in the lateral, medial, and hand knob areas in the left PCG, respectively (Fig. 2). As a result, the lateral ROI showed stronger hand motor resting-state connectivity through visually larger numbers of connected voxels. The size of the connected voxels contralateral to the lateral ROI was about 22 and 31 times larger in number than those contralateral to the hand knob and medial ROIs, respectively (p < 0.002).
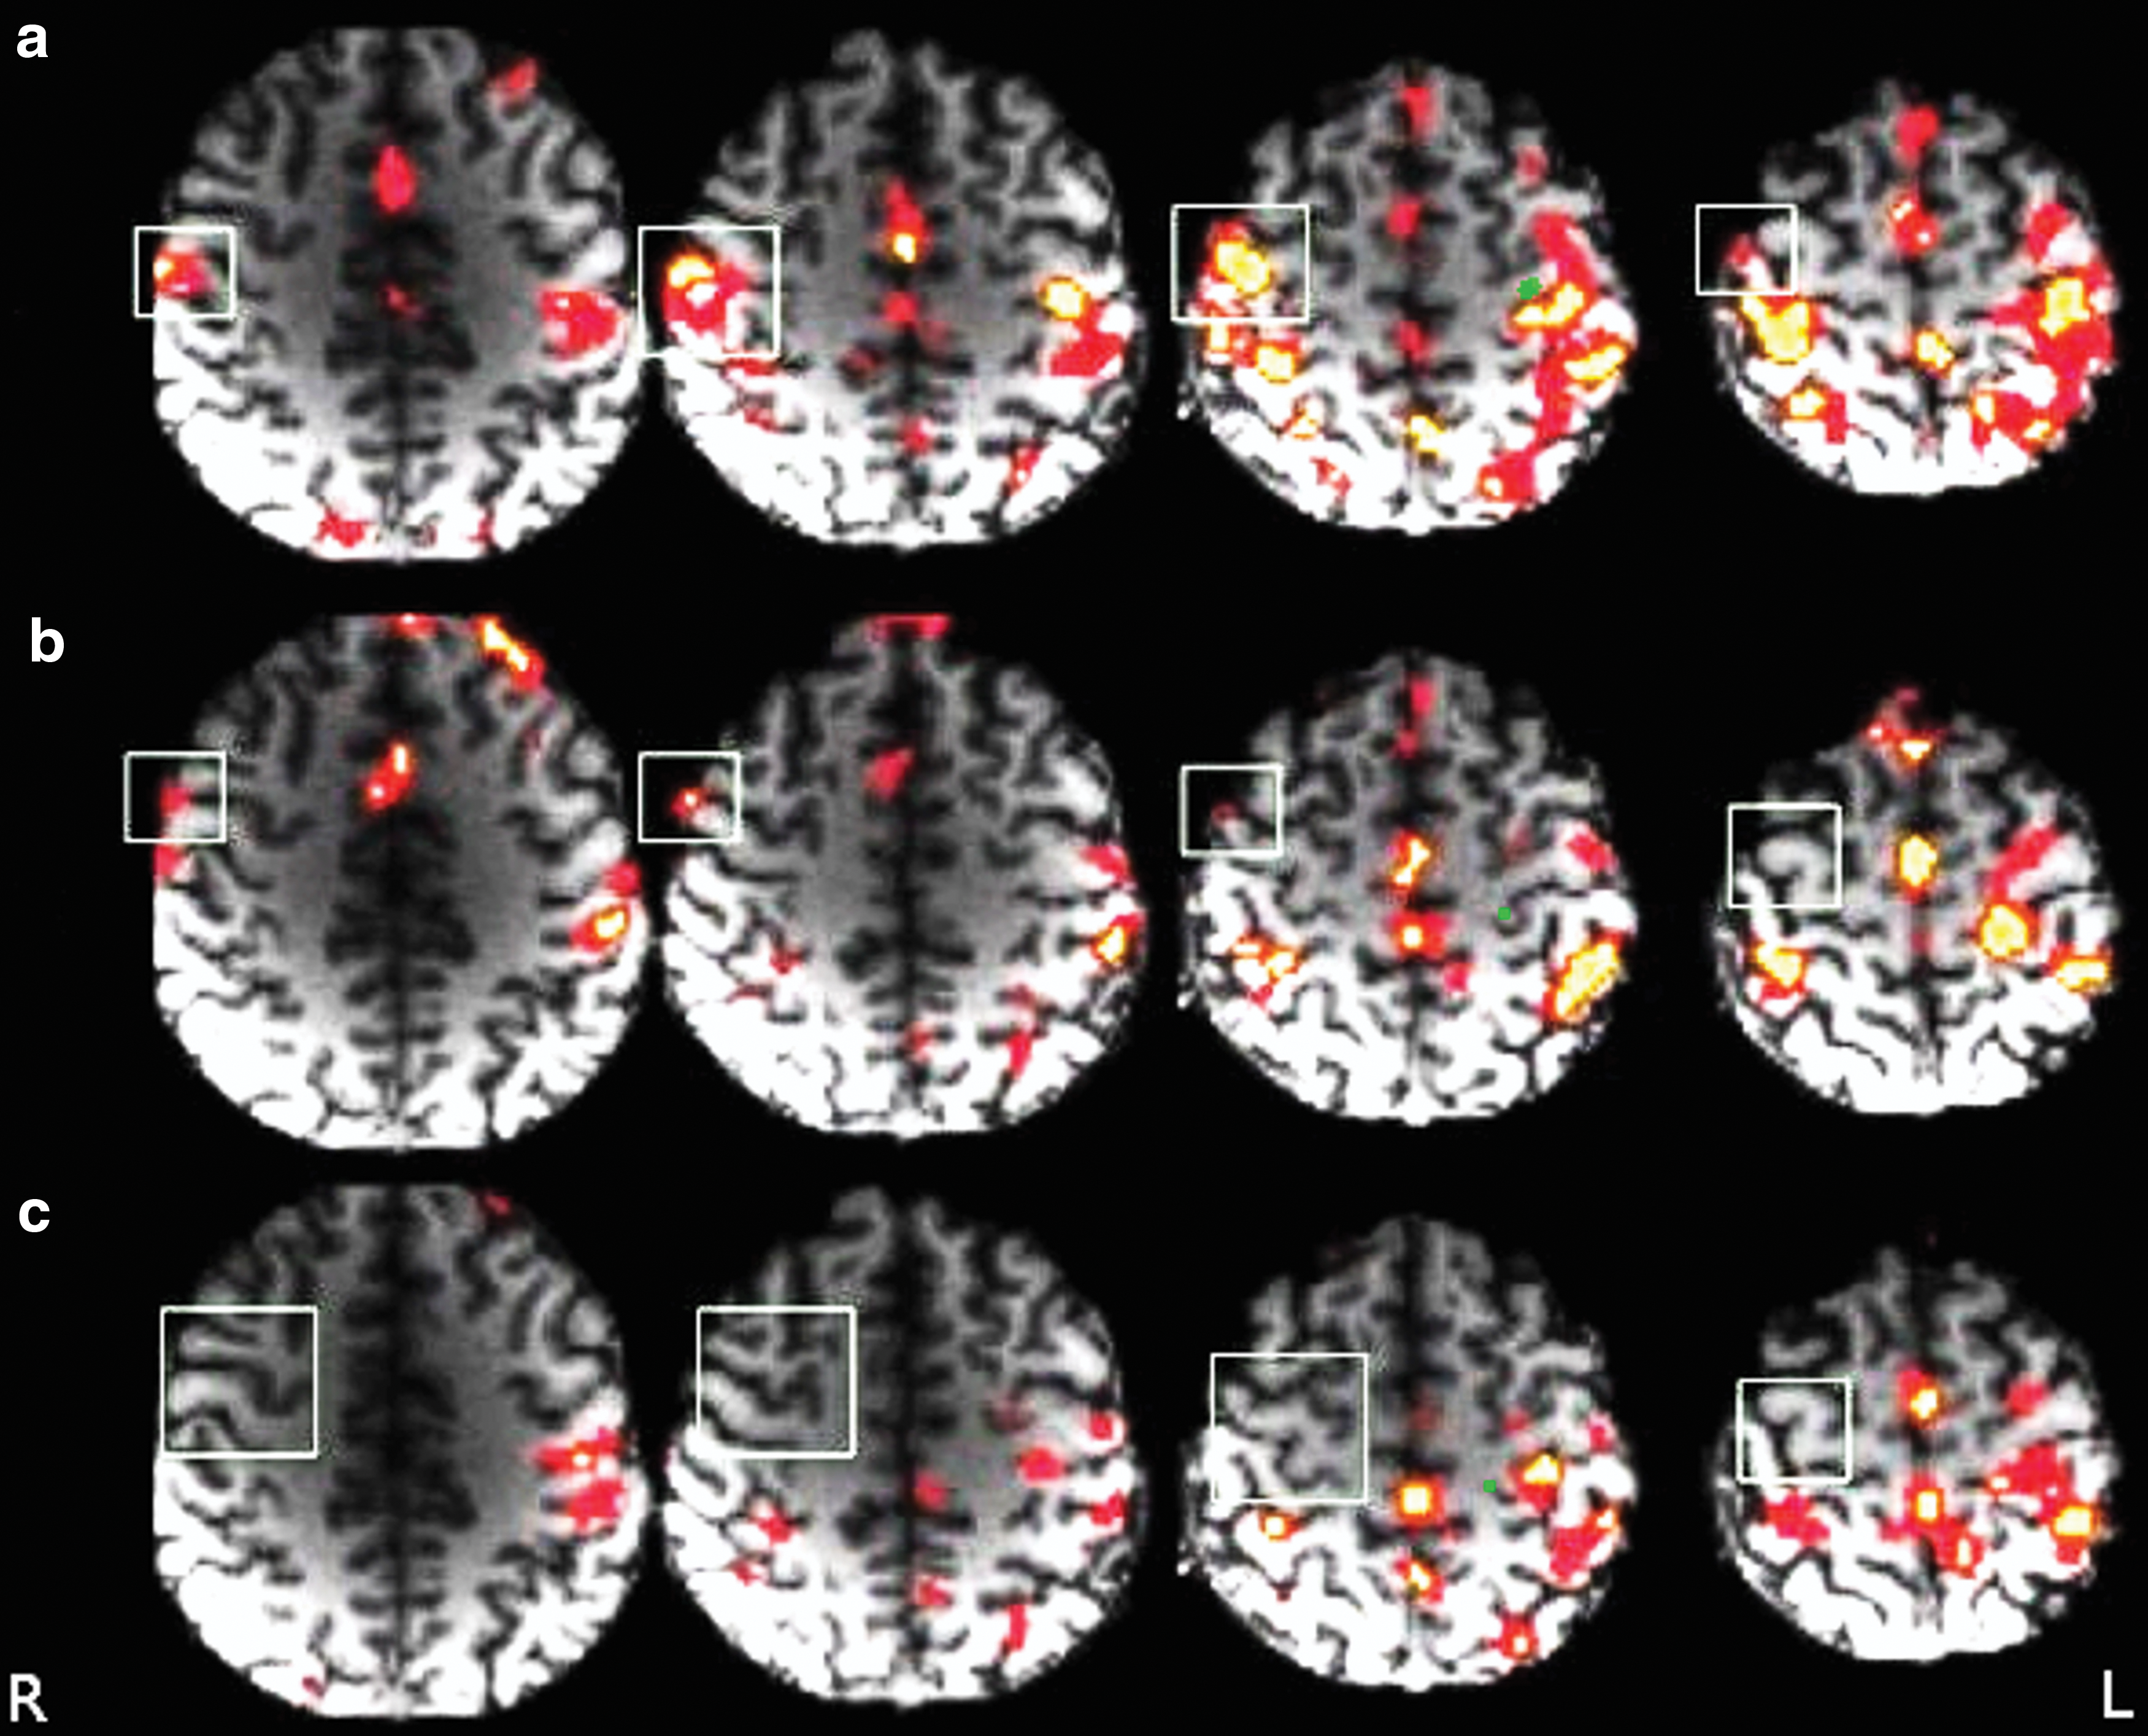
Group functional connectivity maps on the axial view. Top, middle, and bottom images are connectivity maps generated using lateral, hand knob, and medial ROIs (green spheres). Significantly connected voxels in the PCG of right hemisphere (box, MNI: 44, −12, 46 to 58) were detected at t > 4 (p < 0.0021, q < 0.05%). Within these boxes, the lateral map
Figure 3 shows a box-and-whisker plot of correlation values between the cluster of the most connected voxels in the PCG of the right hemisphere and the lateral, hand knob, and medial maps of the left hemisphere, respectively. The lateral map showed a significantly higher correlation value with the contralateral PCG than the hand knob map (p < 0.012) or medial map (p < 0.011), while the differences between the hand knob and medial maps were not significant (p < 0.16). The conjunction map (on the right side) represents the voxel variability among 12 subjects. The color overlay on structural image shows voxels that are commonly connected among all 12 subjects. The color bar (red to yellow, light to dark blue, and light to dark green) shows the frequency of activated voxels.
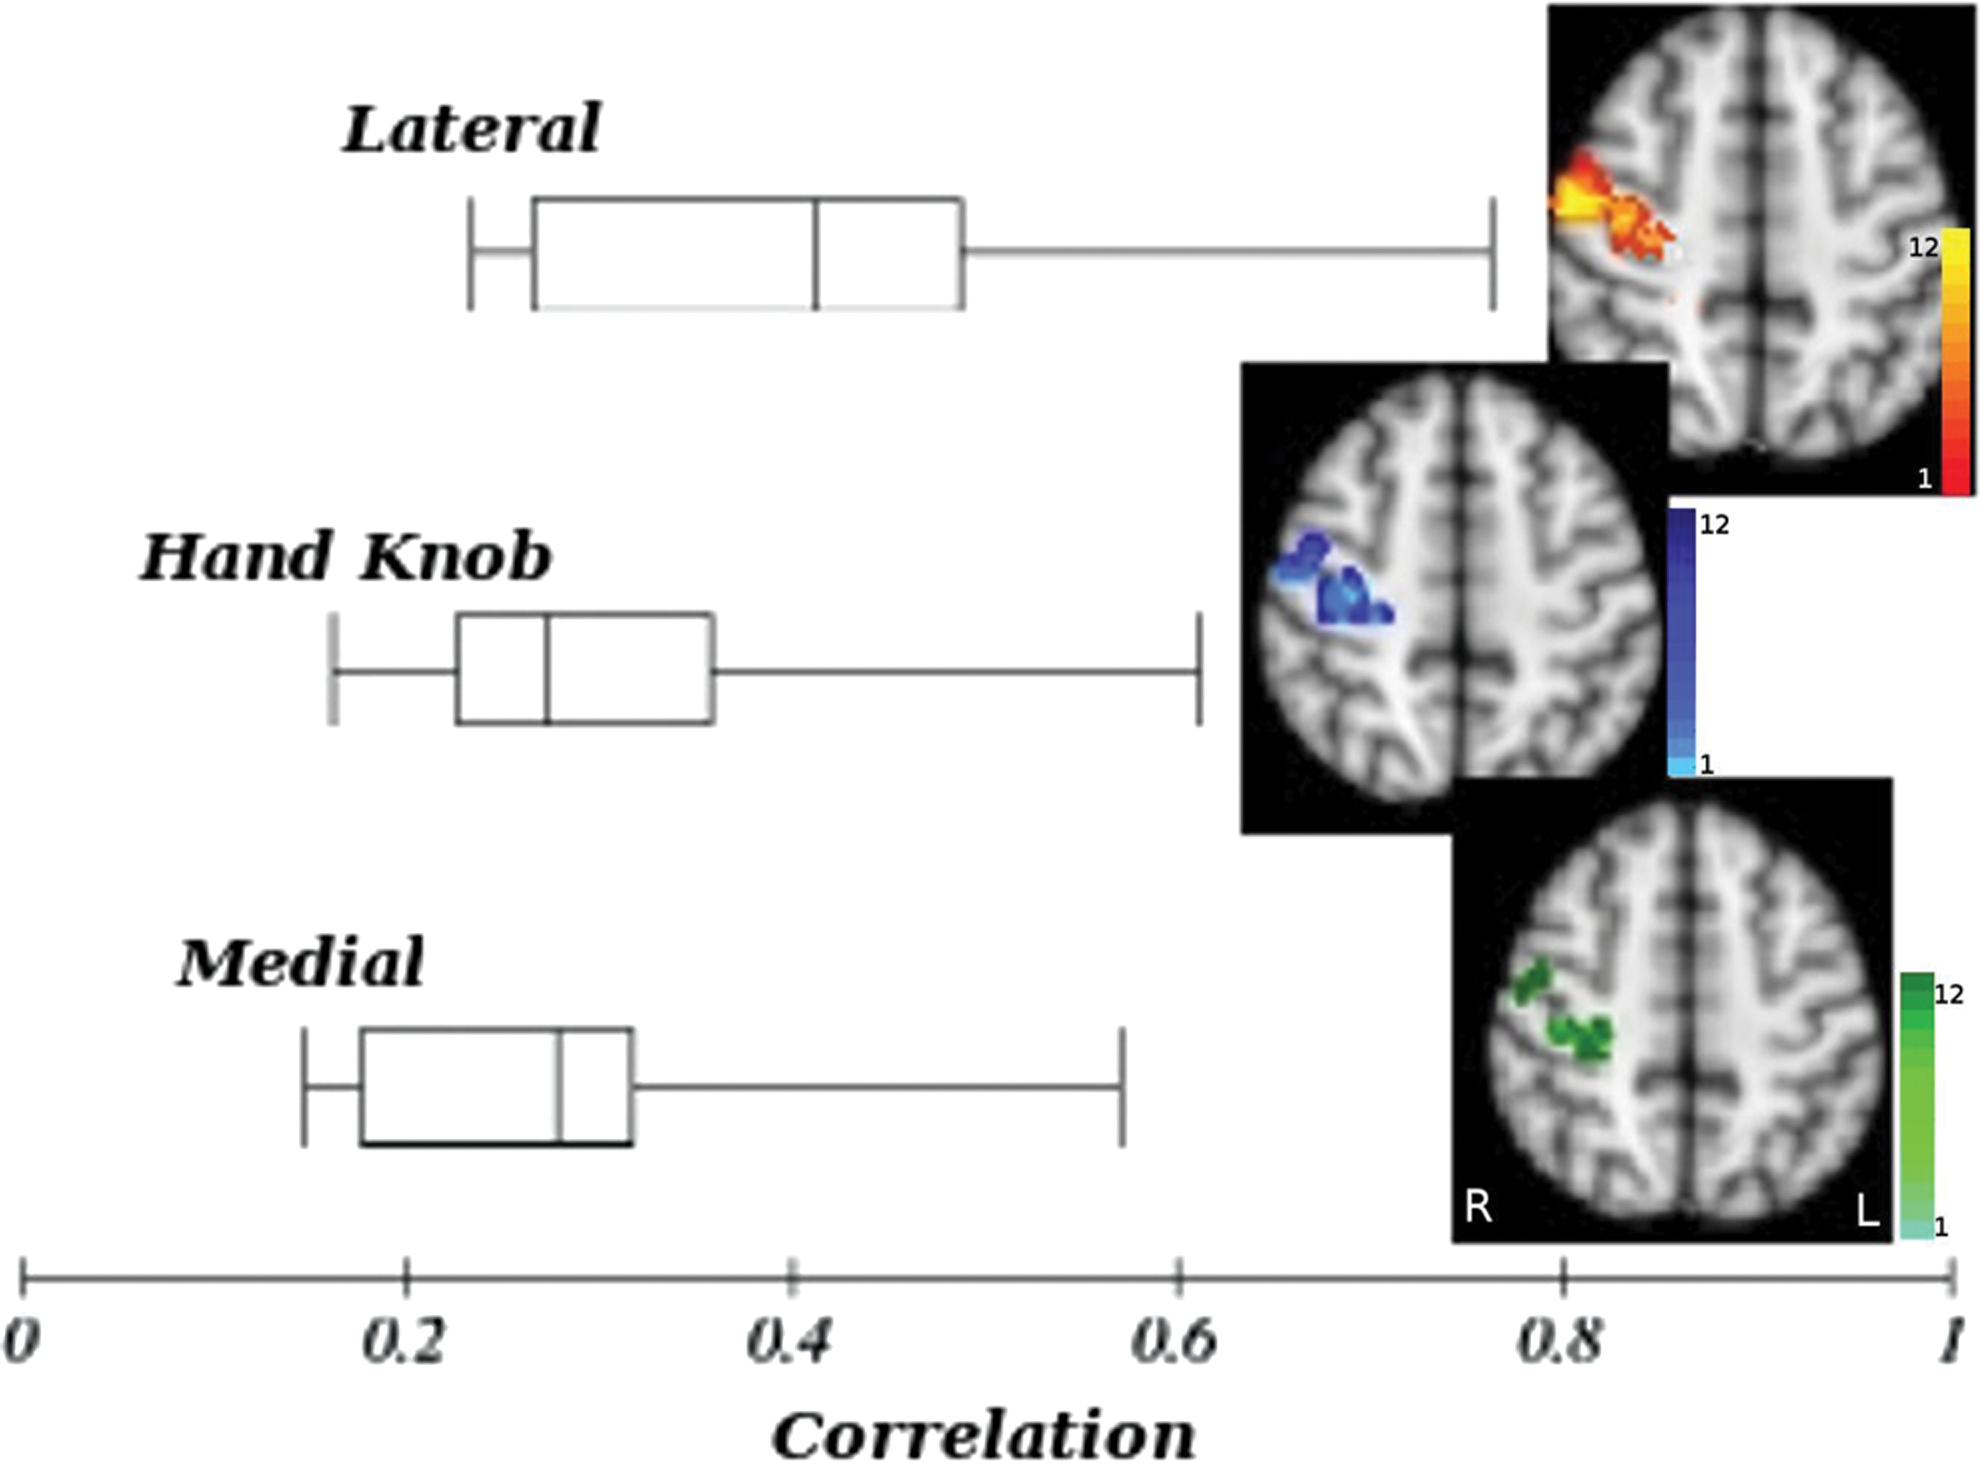
Box-and-whisker plot representing the averaged correlation value in the cluster with the maximum activity in the right PCG, generated by lateral, hand knob, and medial ROIs maps. The average correlation for the lateral, hand knob, and medial is 0.41, 0.31, and 0.27, respectively. The significant difference (at p < 0.05) between lateral and hand knob is p = 0.012 and for lateral and medial is p = 0.011. There is no significant difference for correlation between hand knob and medial maps to right PCG. The conjunction map representing the voxel variability among 12 subjects. The color overlay on structural image shows voxels that are commonly connected among all 12 subjects. The color bar (red to yellow, light to dark blue, and light to dark green) shows the frequency of activated voxels. Color images available online at
Probabilistic diffusion tensor imaging
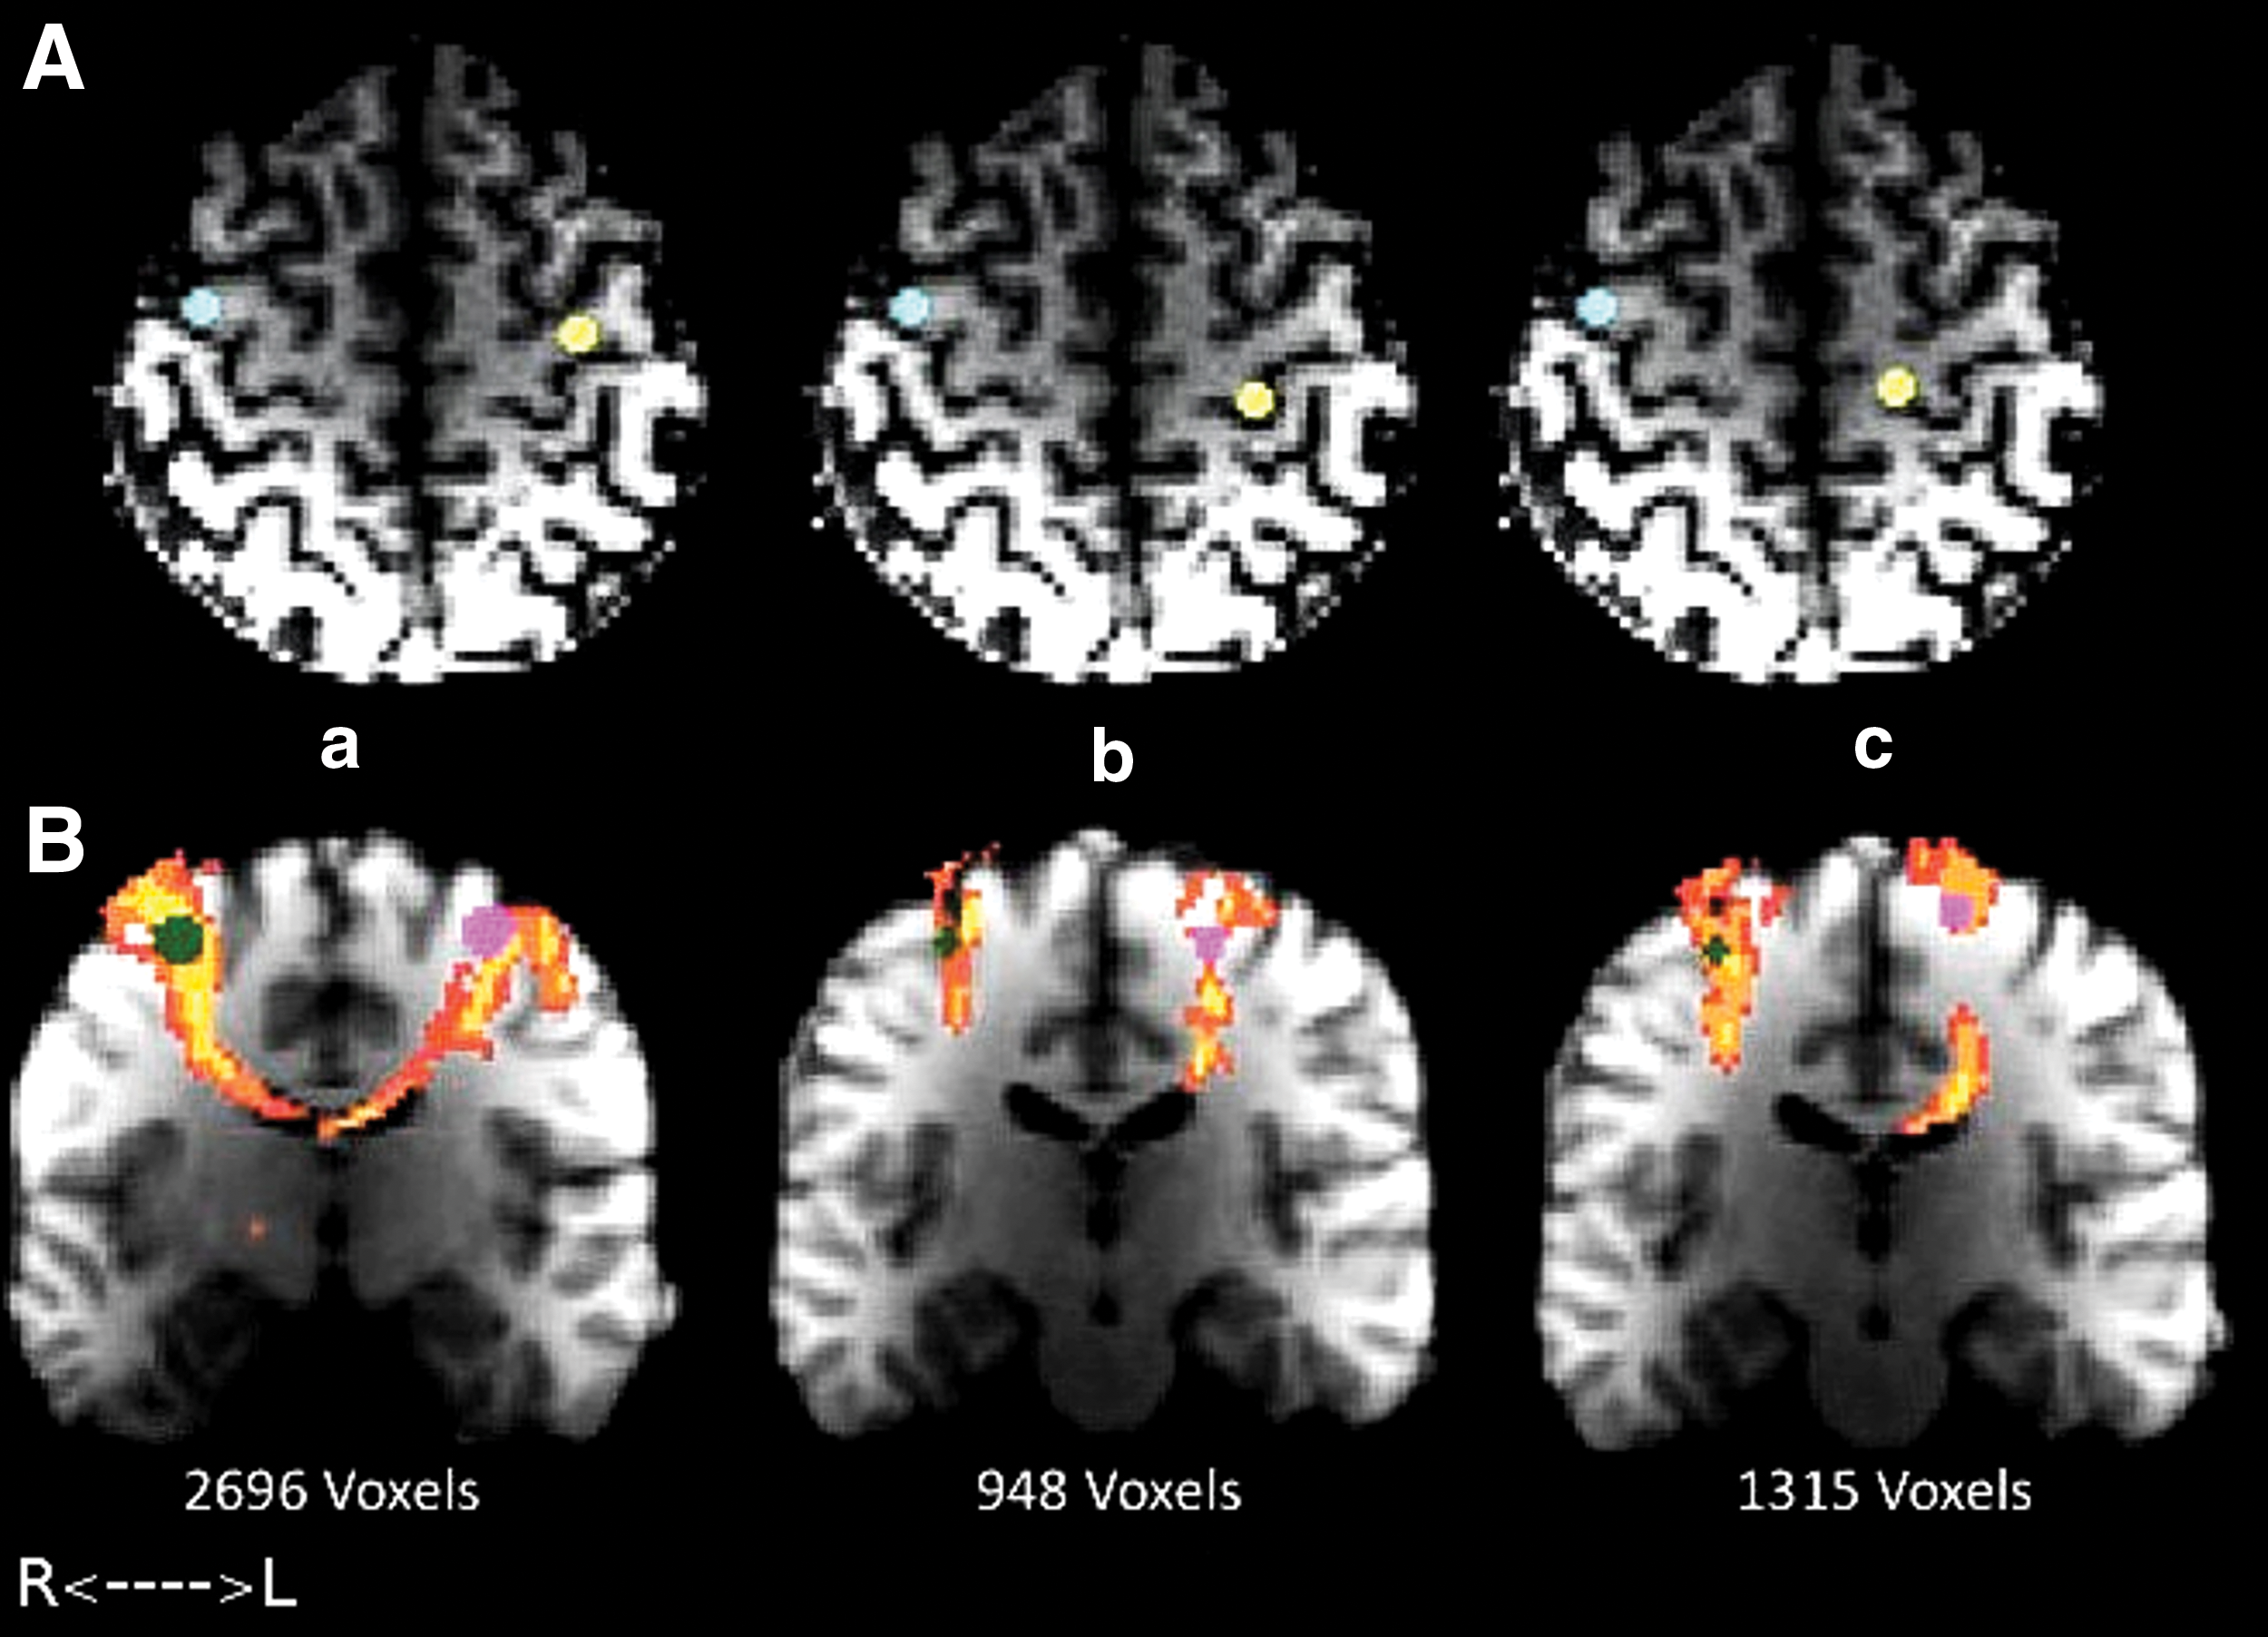
Using PDT, the highest white matter connectivity to the contralateral PCG at the level of hand motor resulted from an ROI placed in the lateral portion of PCG (530 connected voxels at mean probabilistic connectivity index of 0.95). The probabilistic connectivity voxels were 19 and 62 for hand knob and medial ROIs, respectively (Fig. 4). The number of connected voxels contralateral to the lateral ROI was significantly larger than those contralateral to the hand knob (p < 0.003) and medial ROIs (0.007), respectively. Shown in Figure 4, the hand motor tract is seen contralateral to the ROI in all four slices of the lateral image. The coronal view (left) shows more distinctive features in that respect, between the three ROI locations. The medial group image only depicts the whole tract on the fourth slice, while the hand knob group image depicts no hand motor tract in either slice. Therefore, the lateral ROI depicts the most convincing hand motor structural connectivity.
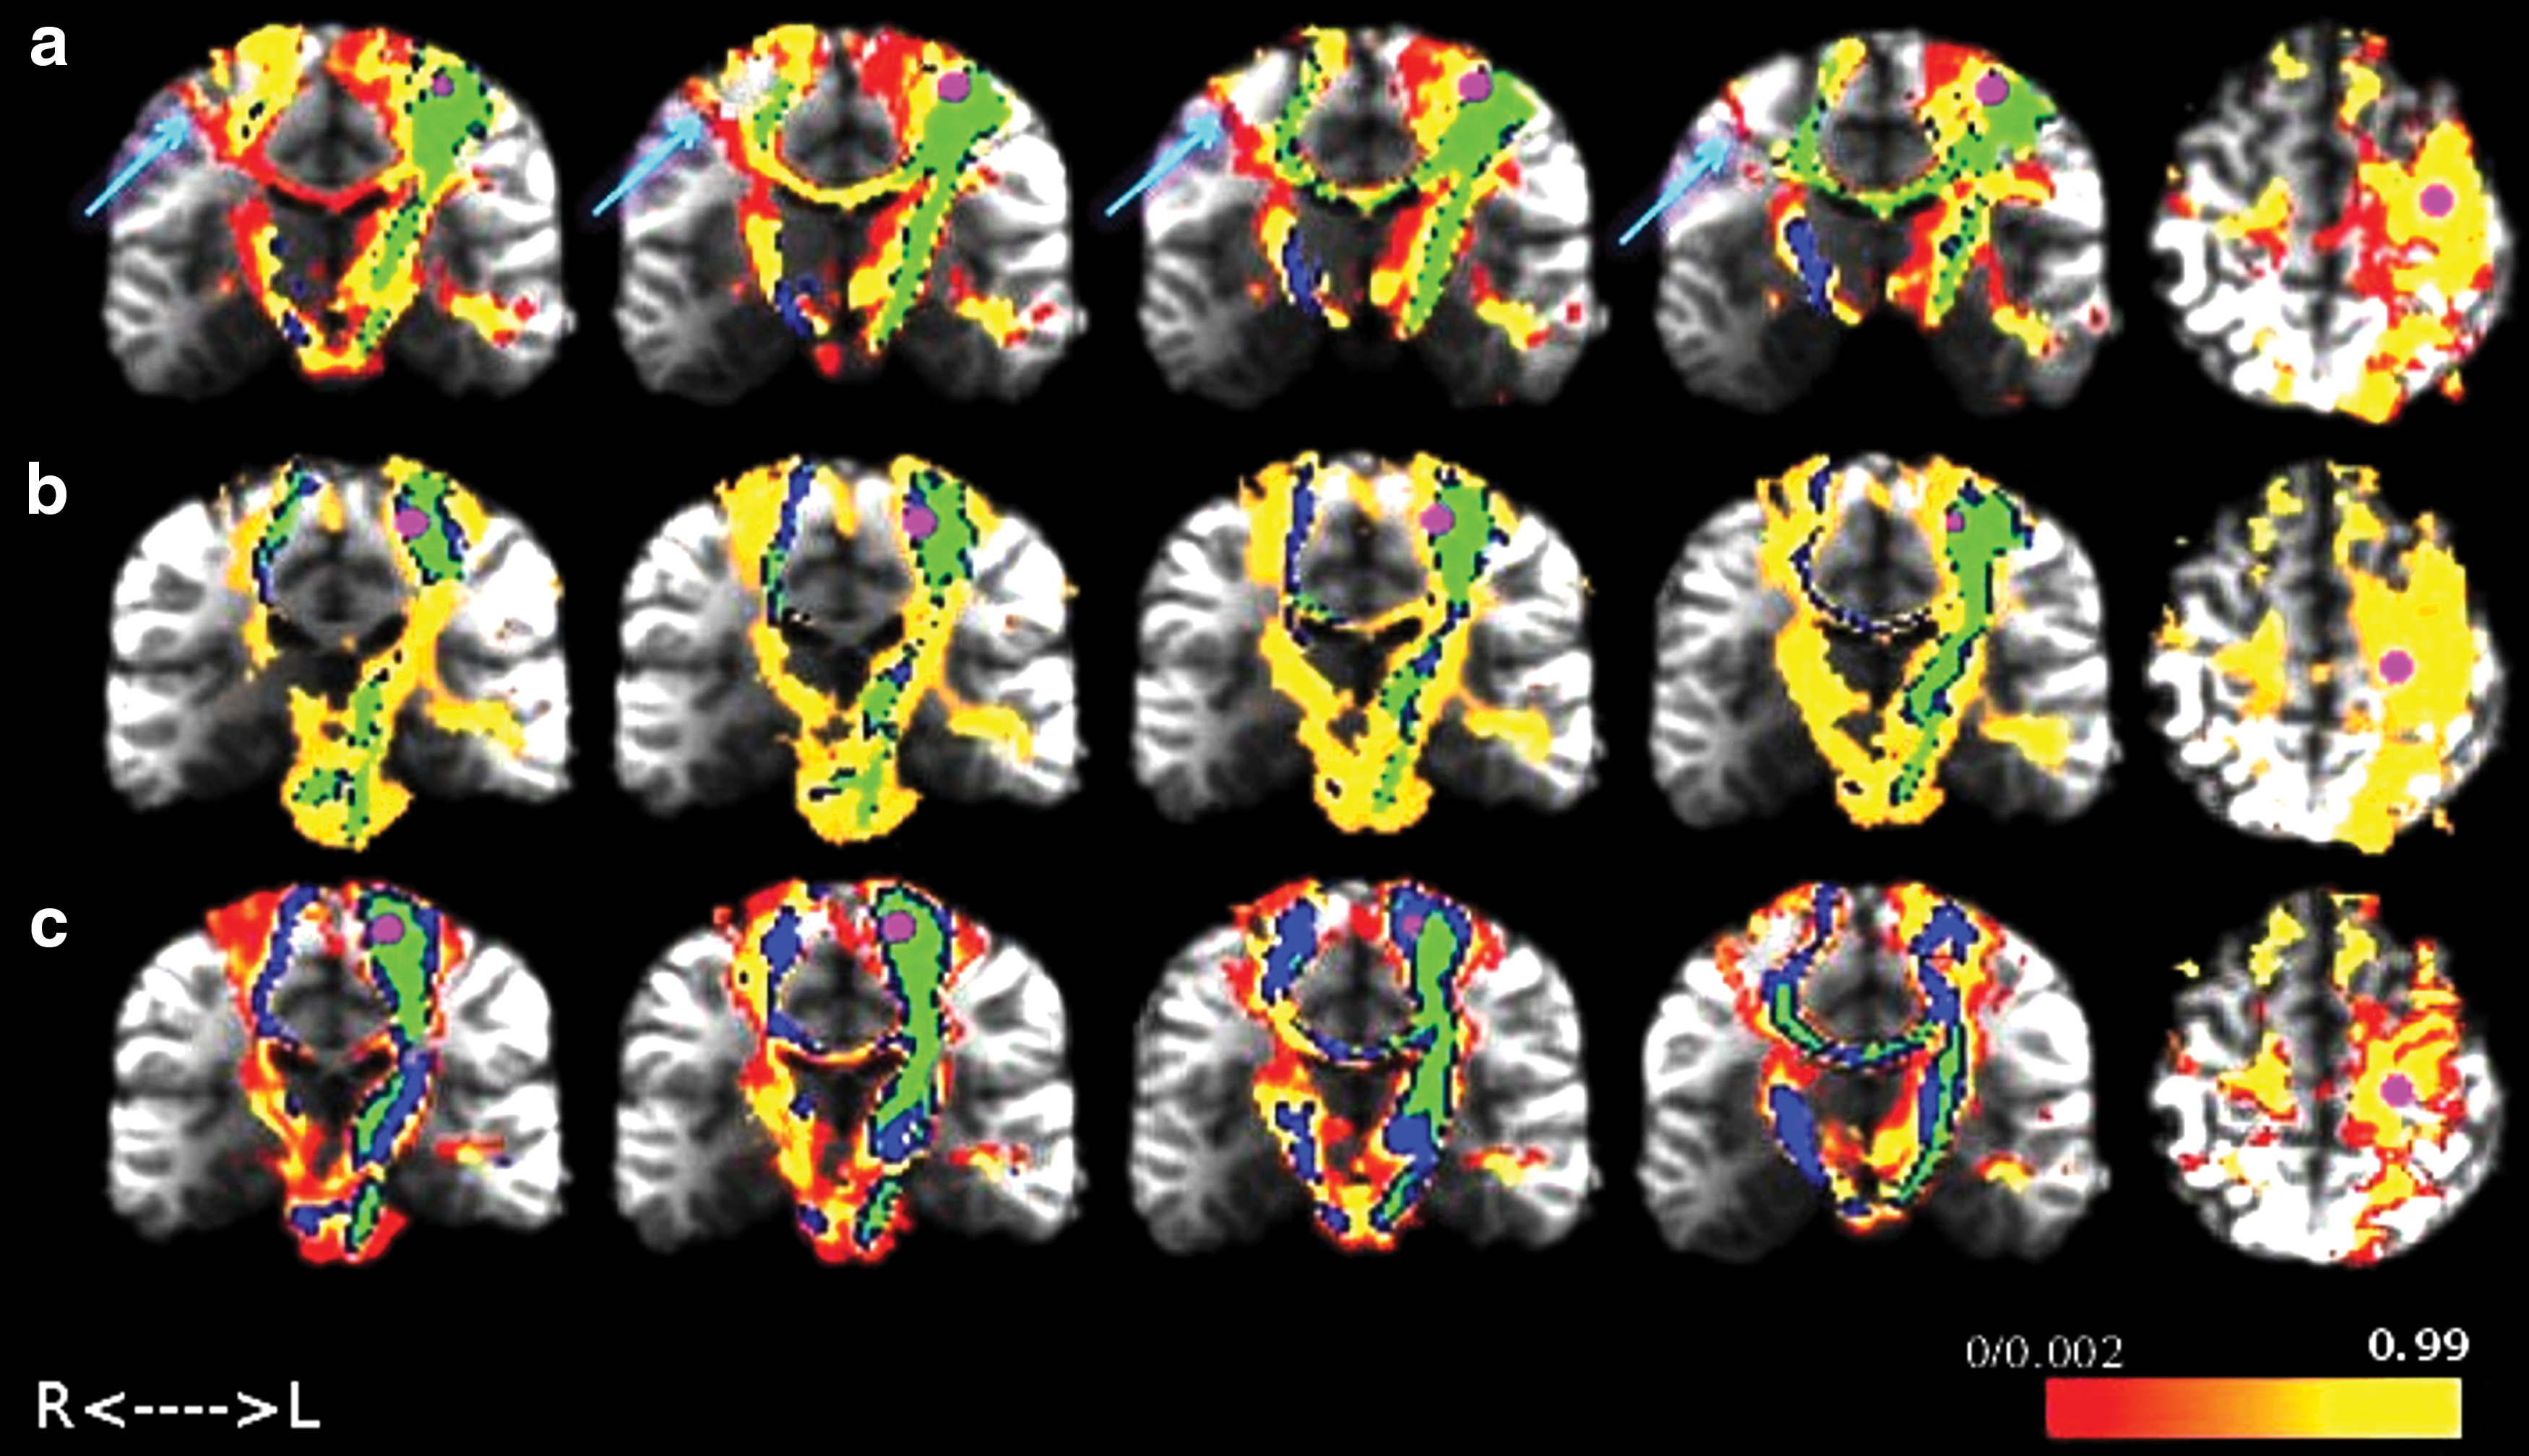
Group probabilistic tractography maps on the coronal view. ROIs (shown by the magenta sphere) were shown in lateral
To examine the results of this finding, a new ROI was placed on the lateral PCG of right hemisphere. The ROI was determined based on the location of the most connected voxels from lateral probabilistic connectivity map generated from the left lateral PCG ROI and with the same size of the left PCG ROI. The connectivity distribution from the lateral ROI in the right hemisphere to the each of the left ROIs was generated containing all possible voxels that connect the right lateral ROI to each of the left ROIs (Fig. 5A). In agreement with our left ROIs result, the right lateral ROI most strongly connected to the left lateral area of the “hand knob,” through which the voxel count was 2.84 (p < 0.05) times that of the hand knob and 2 times that of the medial left PCG (p < 0.05; Fig. 5B; Supplementary Figs. S1, S2; Supplementary Data are available online at
Discussion
Using both functional and structural connectivity imaging methods, our findings clearly indicate that the maximum network connectivity was achieved when an ROI was placed near the thumb finger representation area in the lateral PCG compared with the other location in the traditional “hand knob.” Our DTI probabilistic tractography results also show that the ROI placed at the thumb representation area in the PCG maximally projected a robust hand motor tract to the contralateral hemisphere, while both the center of hand knob and medially placed ROI from the hand knob showed connectivity to a lesser degree. Our resting-state functional connectivity data demonstrate that BOLD responses associated with an ROI placed laterally provide a higher correlation and stronger connectivity between the contralateral hemispheres compared with the other two ROIs. These findings clearly indicate that the greatest hand motor connectivity between hemispheres can be obtained from an ROI, associated with thumb movement, which is positioned laterally to the hand knob/omega area in the PCG.
Cortical activation in the human hand motor system has been extensively studied since the early 1990s. Studies from Porro et al. (1996), Yousry et al. (1997), using task-based fMRI, and Biswal and coworkers (1995) using resting-state fMRI were one of first to show an interest in the human hand motor gray matter network. Since then, it has been commonly accepted that inverse omega-shaped area (referred to as the “hand knob”) is associated with human hand motor function in the PCG.
However, several recent studies indicated that the functional hand motor activation area is located adjacent to but not inside the hand knob. As a very early study, Sutherling et al. (1992) compared locations and sizes of cortical regions among fingers and nerves using the model of a current dipole in a sphere applied to ECoG method, and found that cortical representation was most strongly displayed by the thumb finger. A study using fMRI and ECoG (Hlustík et al., 2001; Siero et al., 2014) showed specific finger-associated activation areas and displayed a topographical medial to lateral layout for the little finger to index to thumb, which reflects that specific finger-oriented activation is not controlled by the hand knob. More recently, another study using TMS further supports the possibility, demonstrating that the “hotspot” for hand motor activation is not always located in the hand knob of the PCG for all subjects (Ahdab et al., 2016). Our findings demonstrated different degrees of bilateral connectivity associated with little, index, and thumb finger activation areas. The results are in good concordance with the aforementioned studies. Others also looked into the change of the hand motor activation center: an fMRI study demonstrated that the probability that the hand motor activation center is located within 7 to 11 mm from the left Brodmann area of 3 and 4 is more than 94% (Drobyshevsky et al., 2006). In other fMRI studies (Hanakawa et al., 2005; Tozakidou et al., 2013), the contralateral PCG activity and also the change in location of motor activity during bilateral hand motor function in brain tumor patients were reported.
The legitimacy of results showing maximum connectivity using the laterally positioned ROI has been further evaluated by placing the same-sized ROI in the right lateral PCG. The transcallosal connection between the two ROIs was displayed by generating a probabilistic connectivity map. The map showed clear connectivity to all three finger areas along the left PCG. Based on the above results, hand motor areas between both hemispheres are functionally and structurally connected via transcallosal connection.
The relationship between functional connectivity and structural connectivity is complicated. The interhemispheric functional connectivity of primary motor cortex has been previously investigated. In one study with functional imaging, inter- and intrahemispheric connectivity, when subjects were grasping objects, was measured using the dynamic causal modeling technique (Begliomini et al., 2015). In other functional studies, the involvement of M1 in the healthy brain during rest and unimanual hand movement with different rates was evaluated. According to these studies, there is symmetrical frequency-dependent activation of the contralateral M1. In addition, during the resting state, interhemispheric neural activity in the human motor networks is functionally connected mainly through inhibitory feedback to maintain equal balance on both sides (Bucci et al., 2011; Hayashi et al., 2008; Hervé et al., 2013).
In fact, localized functional activity in a cortical region is not able to fully explain the nature of anatomical connectivity and show how correlated regions bond together (Greicius et al., 2008; Grefkes and Fink, 2011). For this reason, it was important to understand whether this distinct connectivity is based on direct or indirect structural connections. Previously, in an anatomical study with monkeys (Rouiller et al., 1994), a limited homotopic callosal projection of the hand representation of M1 in the contralateral hemisphere was demonstrated. In a study using high angular resolution, diffusion MRI and PDT in humans (Bucci et al., 2011) were able to map the connectivity of M1 to ipsilateral premotor and sensory areas in all of their subjects and to the contralateral M1 and premotor area in 50% of cases. Furthermore, our study using rfMRI and PDT demonstrates the interhemispheric bilateral connectivity among the three finger representation areas, and that the greatest connectivity was obtained when an ROI was placed in thumb finger representation area.
Our study has several limitations. First, a large number of subjects will be required to derive more significant findings. Even with healthy subjects, there is a person-to-person variation in the topographical shape of the hand motor area in the PCG. Results produced with high spatial resolution at higher field strength would be ideal for providing more specific spatial identification.
Second, looking into the wide range of finger representation would be necessary to fully understand the hand motor network. There is an ambiguity about why the maximum connectivity was obtained with thumb representation ROI. This result could ultimately be attributed to the natural frequent use of the thumb finger in our daily life than any other finger or due to more structurally allocated nerve connection; therefore, although one has a whole set of five fingers, the primary reliance is on the thumb. Since this is only a prediction, further study using topographical representation of each finger on high-resolution intracranial recordings is warranted.
Conclusions
In conclusion, maximal bilateral functional and structural connectivity was not achieved by selecting an ROI in the traditionally defined hand knob but by the ROI placed laterally from the hand knob. Our routine presurgical planning fMRI experience in brain tumor patients noticed that task-based functional activation of hand motor is not always inside the hand knob. As previously reported (Holodny et al., 2013), the effects of brain tumor on tissue such as degeneration and compression might lead to the displacement of white mater tracts and subsequently the relocation of functional activity within brain networks. These tumor-related white matter changes may act in concert with individual variability to impact the presentation of the eloquent cortices, further affecting the accuracy of ROI position. Since this study only included healthy subjects, future studies that include brain tumor patients are necessary to investigate the adequate location of eloquent cortices such as the hand motor area under the influence of tumor mass.
Footnotes
Acknowledgments
Data were provided (in part) by the Human Connectome Database, WU-Minn Consortium (principal investigators: David Van Essen and Kamil Ugurbil; 1 U54MH091657) funded by the 16 NIH Institutes and Centers that support the NIH Blueprint for Neuroscience Research; and by the McDonnell Center for Systems Neuroscience at Washington University. The authors thank Joanne Chin for her editing assistance. This research was funded, in part, through the National Institutes of Health/National Cancer Institute Cancer Center Support Grant P30 CA008748. Authors would like to acknowledge the following grant support for AH and KKP: NIH-NIBIB 1R01EB022720-01 (PI's Makse and Holodny), NIH-NCI U54 CA 137788 (PI Ahles) and NIH-NCI 1 R21 CA220144-01(PI's Holodny and Peck).
Author Disclosure Statement
No competing financial interests exist.
References
Supplementary Material
Please find the following supplemental material available below.
For Open Access articles published under a Creative Commons License, all supplemental material carries the same license as the article it is associated with.
For non-Open Access articles published, all supplemental material carries a non-exclusive license, and permission requests for re-use of supplemental material or any part of supplemental material shall be sent directly to the copyright owner as specified in the copyright notice associated with the article.