
Abstract
Characterizing Alzheimer's disease (AD) at pre-clinical stages is crucial for initiating early treatment strategies. It is widely accepted that amyloid accumulation is a primary pathological event in AD. Also, loss of connectivity between brain regions is suspected of contributing to cognitive decline, but studies that test these associations using either local (i.e., individual edges) or global (i.e., modularity) connectivity measures may be limited. In this study, we utilized data acquired from 139 cognitively unimpaired participants. Sixteen gray matter (GM) regions known to be affected by AD were selected for analysis. For each of the 16 regions, the effect of amyloid burden, measured using Pittsburgh Compound B (PiB) positron emission tomography, on each of the 1761 brain network connections derived from diffusion tensor imaging (DTI) connecting 162 GM regions, was investigated. Applying our unique multiresolution statistical analysis called the Wavelet Connectivity Signature (WaCS), this study demonstrates the relationship between amyloid burden and structural brain connectivity as assessed with DTI. Our statistical analysis using WaCS shows that in 15 of 16 GM regions, statistically significant relationships between amyloid burden in those regions and structural connectivity networks were observed. After applying multiple testing correction, 10 unique structural brain connections were found to be significantly associated with amyloid accumulation. For 7 of those 10 network connections, the decrease in their network connection strength indexed by fractional anisotropy was, in turn, associated with lower cognitive function, providing evidence that AD-related structural connectivity loss is a correlate of cognitive decline.
Introduction
Development of amyloid pathology is a primary pathological event and defining feature of Alzheimer's disease (AD), eventually leading to cognitive decline and dementia (Hardy and Higgins, 1992; Jack et al., 2018). Individuals with increased cortical amyloid burden as measured in vivo with Pittsburgh Compound B (PiB) are at a higher risk of AD (Pike et al., 2007), and show greater cognitive decline over time. Determining the impact of amyloid on neurodegeneration and cognitive decline is a field of active study, given that antiamyloid therapies remain a key focus of the AD therapeutic strategy (Liu et al., 2015).
In addition to amyloid, AD involves the development of tau pathology, as well as neurodegeneration. Common measures of neurodegeneration include markers derived from cerebrospinal fluid, as well as volumetric measures derived from T1-weighted magnetic resonance imaging (MRI). Additional informative information may be obtained by examining alterations of white matter (WM) tracts. WM abnormalities have been detected among individuals with AD, those within the mild cognitive impairment (MCI) group (Zhuang et al., 2013), as well as among individuals presumed to be at risk or in the cognitively asymptomatic stage of disease. Diffusion tensor imaging (DTI) has been applied in several studies to determine whether microstructure is altered. Fractional anisotropy (FA), one of the most commonly investigated DTI measure, is commonly interpreted as a marker of axonal degeneration, and has been shown to be lower among individuals with higher amyloid burden (Bendlin et al., 2010b; Varentsova et al., 2014), especially in the presence of other markers of neurodegeneration. The correlation between decreased FA and disease progression also suggests that FA is a marker of disease progression (Acosta-Cabronero et al., 2012). Brain regions altered in AD include the splenium of the corpus callosum, superior longitudinal fasciculus, cingulum (Rose et al., 2000), fornix, parahippocampal cingulum, and uncinate fasciculus (Zhuang et al., 2013). Furthermore, DTI measures are associated with cognitive performance across a number of studies (Bendlin et al., 2010a; Mielke et al., 2012), suggesting that markers of WM microstructure will show utility for tracking decline to dementia.
Although amyloid accumulation has been associated with greater risk for cognitive decline and lifetime risk for dementia, it is not clear whether amyloid itself is the primary cause of this decline, or may be associated with other neuropathological features that underlie cognitive dysfunction. Other features, for example, atrophy and axonal degeneration, are phenotypic of dementia and may be better predictors of cognitive status. Given these findings, several studies have shown promise in determining the extent to which structural connectivity changes are observed in AD (Lee et al., 2015; Lo et al., 2010; Shao et al., 2012). Indeed, it is thought that a greater methodological understanding of WM integrity using a connectivity/network framework through a graph theoretic approach could help set the stage for a better understanding of both healthy networks and the alterations that are characteristic of disease (Guye et al., 2010).
Thus, the goal of this study was to determine the association between amyloid and structural brain connectivity networks in a cohort of cognitively unimpaired individuals who vary on amyloid burden (Clark et al., 2016; Sprecher et al., 2015). A multiresolution analysis method called Wavelet Connectivity Signature (WaCS), which has previously been shown to be sensitive to small signal differences (Kim et al., 2015), was used in our study. In contrast to prior approaches, this framework enables the detection of associations at the level of both (1) brain networks and (2) regionally. Secondarily, we determined the directionality of the associations to infer whether amyloid burden was positively or negatively associated with the structural connections. Finally, we determined the extent to which WM tracts affected by amyloid burden were associated with cognitive function as measured by the Mini Mental State Examination (MMSE).
Materials and Methods
Participants
Participant data were acquired from the Wisconsin Registry for Alzheimer's Prevention (Johnson et al., 2017), a cohort of middle-aged adults who are followed longitudinally, and many of whom underwent multiple sessions of MRI as part of linked studies. The subset of participants included in this analysis comprised cognitively unimpaired adults, specifically 97 men and 42 women with a mean age of 60.23 years (standard deviation 5.99) as shown in Table 1. A subset of the cohort (97 of 139) was positive for parental history of Alzheimer's dementia (Sager et al., 2005). For the cross-sectional analysis reported in this article, DTI and PiB positron emission tomography (PET) images were used.
Wisconsin Registry for Alzheimer's Prevention Demographics
APOE, apolipoprotein E; MMSE, Mini Mental State Examination.
DTI acquisition
DTI data were acquired using a spin-echo single-shot echo planar imaging pulse sequence (40 encoding directions with b = 1300 s/mm2) and eight nondiffusion weighted (b = 0) reference images on two identical MRI systems: General Electric 3.0 Tesla Discovery MR750 with eight channel head coils and parallel imaging (ASSET). The images were acquired at isotropic 2.5 mm3 resolution using continuous 2.5 mm thick axial slices, field of view 24 cm with repetition time = 8000 ms, echo time = 67.8 ms, and matrix size = 96 × 96.
Brain connectivity networks construction from DTI
The population average of all the individual DTI data was estimated using Diffusion Tensor Imaging Toolkit (DTI-TK) (Adluru et al., 2012; Zhang et al., 2007). The lower and upper thresholds of the seed mask obtained by binarizing the trace map of the population template were 0.01 and 100, respectively, which are commonly used in DTI-TK (Zhang et al., 2006). We used the track command in Camino (Cook et al., 2006) with the following parameters: curvature angle threshold of 45° and the curvature length threshold of 10 mm. Tractography was performed on the population average using deterministic streamline tractography and bootstrapping 20 times (i.e., 20 tracts were generated per seed voxel) to make sure the WM pathways between the nodes were consistent. Note that this step was only to define the mask of the tracts connecting the region of interests (ROIs). We then take the mean FA values along the tracts, so that our calculations are stable and not influenced by the bootstrapping method. For each pair of the 162 gray matter (GM) regions from Illinois Institute of Technology (IIT) template (Varentsova et al., 2014) after excluding two regions with unknown labels, tracts passing through both of those regions were filtered out and binarized into an edge mask. For each edge, representing the WM tract connecting its corresponding pair of regions, the spatially normalized FA in its mask was computed as the edge weight to compensate for the varying ROI sizes with the conmat tool in Camino. This procedure results in a brain connectivity network interpreted as a graph of 162 nodes (GM ROIs) and undirected edges (WM tracts) represented in a 162 by 162 symmetric adjacency matrix for each subject. More details are also presented in a previous study (Kim et al., 2015).
PET imaging and processing
[C-11] PiB PET scans acquired from participants were used to reconstruct the PET data using a filtered back-projection algorithm direct Fourier transform (DIFT) with random event correction, attenuation of annihilation radiation, dead time, scanner normalization, and scatter radiation. They were then realigned and coregistered in SPM8 and transformed into voxel-wise distribution volume ratio (DVR) maps using the time activity curve of the cerebellum GM as the reference region. Further details on the processing were described previously (Johnson et al., 2014). To derive region-wise PiB DVR measures, 16 (8 bilateral) of the 116 Automated Anatomical Labeling atlas regions (Tzourio-Mazoyer et al., 2002) that are implicated as important in AD (Clark et al., 2016) based on the global amyloid burden (Sprecher et al., 2015) were used and are shown in Figure 1.
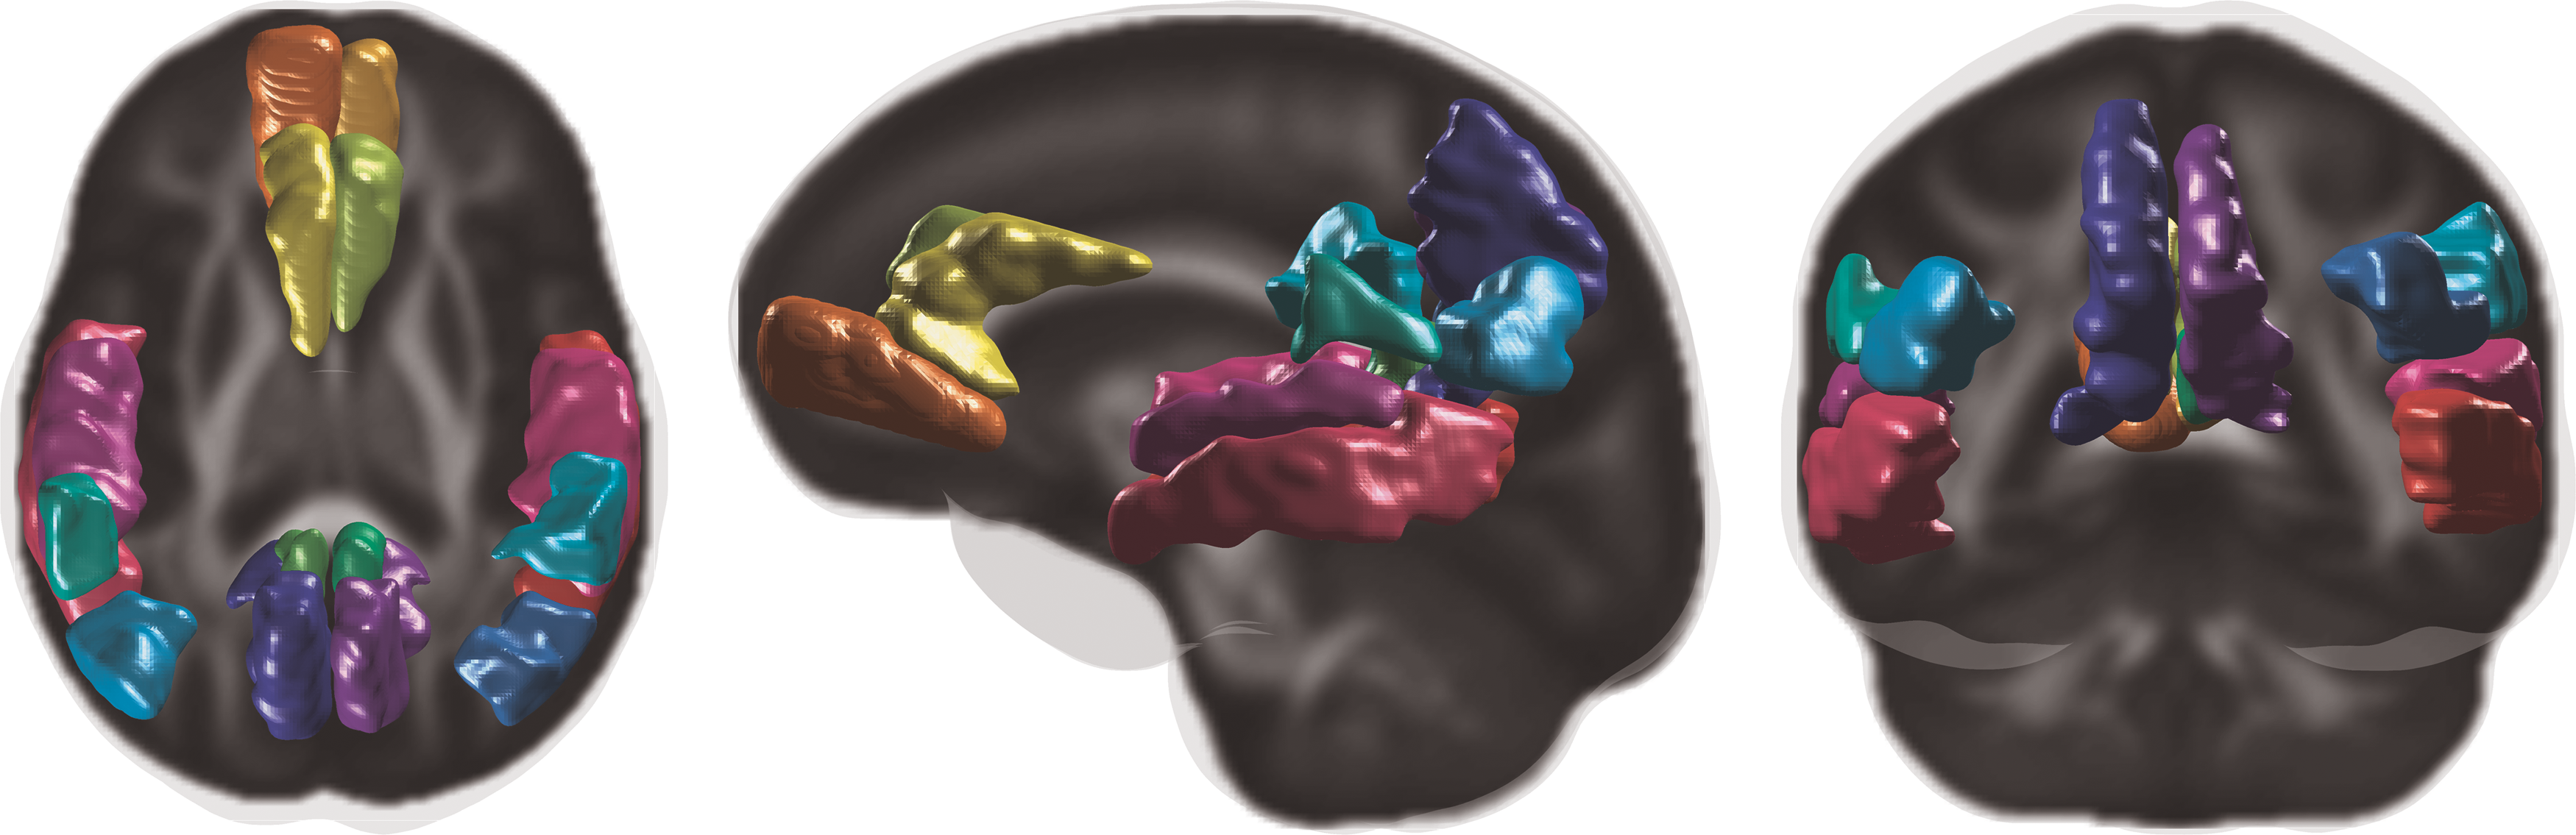
Overlays of 16 PiB DVR ROIs on the FA template. DVR, distribution volume ratio; FA, fractional anisotropy; ROI, region of interest. Color images are available online.
Multiresolution wavelet descriptor on brain connectivity
Analogous to the well-known Fourier transform for filtering the signal frequencies, the wavelet transform has often been used to capture multiresolution characteristics of the data at different scales or resolutions. In the literature, the wavelet transform has been adapted to graphs using spectral graph theory (Hammond et al., 2011), and, therefore, can also be used to process the graph structure of the connectivity network from DTI that does not live in Euclidean space as described previously (Kim et al., 2015). In a graph sense, the connectivity network consists of nodes representing ROIs and edges representing the connected ROIs with edge weights denoting the tract strengths. To use the wavelet transform on the edges of the connectivity network graph, we first need to transform the graphs into their corresponding line graphs on which the wavelet transform will be performed. Next, we briefly describe each step of the wavelet descriptor derivation from line graph to wavelet transform as it pertains to this study.
Line graph formulation
A graph
Then, the graph G is converted to its dual form called the line graph by “exchanging” the roles of nodes and edges: (1) the line graph nodes VL
encode the graph edges and (2) the line graph edges EL
connect the line graph nodes that are derived from the graph nodes. For instance, two graph edges
From the analysis perspective, it is worth noting that the number of line graph nodes
The importance of the line graph construction comes from the fact that we need to apply the wavelet transform on the edges (i.e., connectivities) to derive the multiresolution signals while the wavelet transform traditionally operates on the nodes of a graph. Without modifying the wavelet transformation at all, we can perform the transformation on the connectivity graph edges by applying the wavelet transform on the line graph nodes after the line graph transformation. Then, we reconstruct the original graph G from the line graph with wavelet representations on the line graph nodes. Rather than reformulating the wavelet transform to operate on edges, constructing the dual form (i.e., line graph) of a given graph that preserves the structure and applying the wavelet transform while preserving its graph theoretic properties are a more plausible approach.
Wavelet connectivity signature
The advantage of the wavelet transform is that, unlike the sine wave function of Fourier bases, they have finite support because they are derived from the mother wavelet functions that are specifically constructed to have such properties. More formally, we define
For the set of chosen wavelets, the set of wavelet coefficients forms an alternative representation of original signal with respect to the chosen wavelets. The key advantage of this wavelet coefficient representation is the following: the scales of the wavelets represent various “distances” or resolutions, then their respective wavelet coefficients provide the multiresolution representation of the original signal. Throughout this study, the standard piecewise spline function provided by the Spectral Graph Wavelets Toolbox (Hammond et al., 2011) was used that possesses desirable localization property.
Now, recall that the signal f comes from the edges of the graphs that was transformed into the signal on the nodes of their line graphs. Thus, for each node n, the wavelet coefficients at
where f is the original signal, e is the edge of the original graph, and s is a scale from the set of scales S. In this study,
Experimental setup
WaCS transformation
The FA map of each subject was used to construct the connectivity network between the 162 GM ROIs (IIT atlas) as a 162 by 162 adjacency matrix representation of the graph where the entry at the ith row and the jth row indicates the connectivity strength of the ith ROI and the jth ROI. Then, we selected the connectivities/edges that have nonzero values across all the subjects. This ensured that although the subjects may have different connectivity structures (i.e., different sets of edges), the final connectivity structure (the IIT GM nodes and 1761 common edges) is standardized across the subjects. Then, the line graphs were constructed that are also identical in that the line graph nodes and edges are correspondent across all the subjects. Next, for each line graph, the WaCS was derived using the mother wavelet and the scales already described. Then, the line graph was transformed back to the original graph structure where each edge then encoded the multiscale WaCS descriptor. As a result, each subject had a total of 1761 unique edges where each edge contained WaCS descriptor at three different scales.
Relationship between amyloid burden and connectivity
The effects of PiB DVR of 16 GM ROIs on brain connectivity network while controlling for age and gender were investigated. In other words, with respect to each of the 16 PiB ROIs, its PiB DVR effect on each of the 1761 unique connections was examined using the following linear model
Its significance was tested under three statistical analysis setups corresponding to three different representations of Connectivity.
Original connectivity strength. Univariate general linear model (GLM) was used to observe the effects of each PiB DVR measure as the predicting variable on the original connectivity strengths measured in mean FA as the predicted variables.
Each scale of WaCS. Univariate GLM was used to observe the effects of each PiB DVR measure as the predicting variable on each of the three scale WaCS values individually. Thus, there are three separate analyses corresponding to three different scales.
All three scales of WaCS. Multivariate general linear model (MGLM) was used to observe effects of each PiB DVR measure as the predicting variable on all three scales of WaCS descriptor simultaneously.
In all the three setups, age and gender effects were controlled as nuisance variables. The F-stats and the corresponding p value were used to test the significance of the effects of PiB DVR. The significance level was set at
Relationship between connectivity and cognition
For the edges that were found to be statistically significant based on their relationship with amyloid burden, the associations between their FA values to a cognitive function measured as MMSE were examined. Specifically, the linear model controlling for age and gender,
was tested on each of the significant edge to examine whether the FA is positively (
Results
Throughout the presentation of the results, connections, connectivities, and edges are used interchangeably. Note that the PiB ROIs are indexed by numbers consistently throughout Table 2 and Figure 2, and the connections are indexed by alphabetical letters consistently throughout Table 3, Figures 4 and 5.
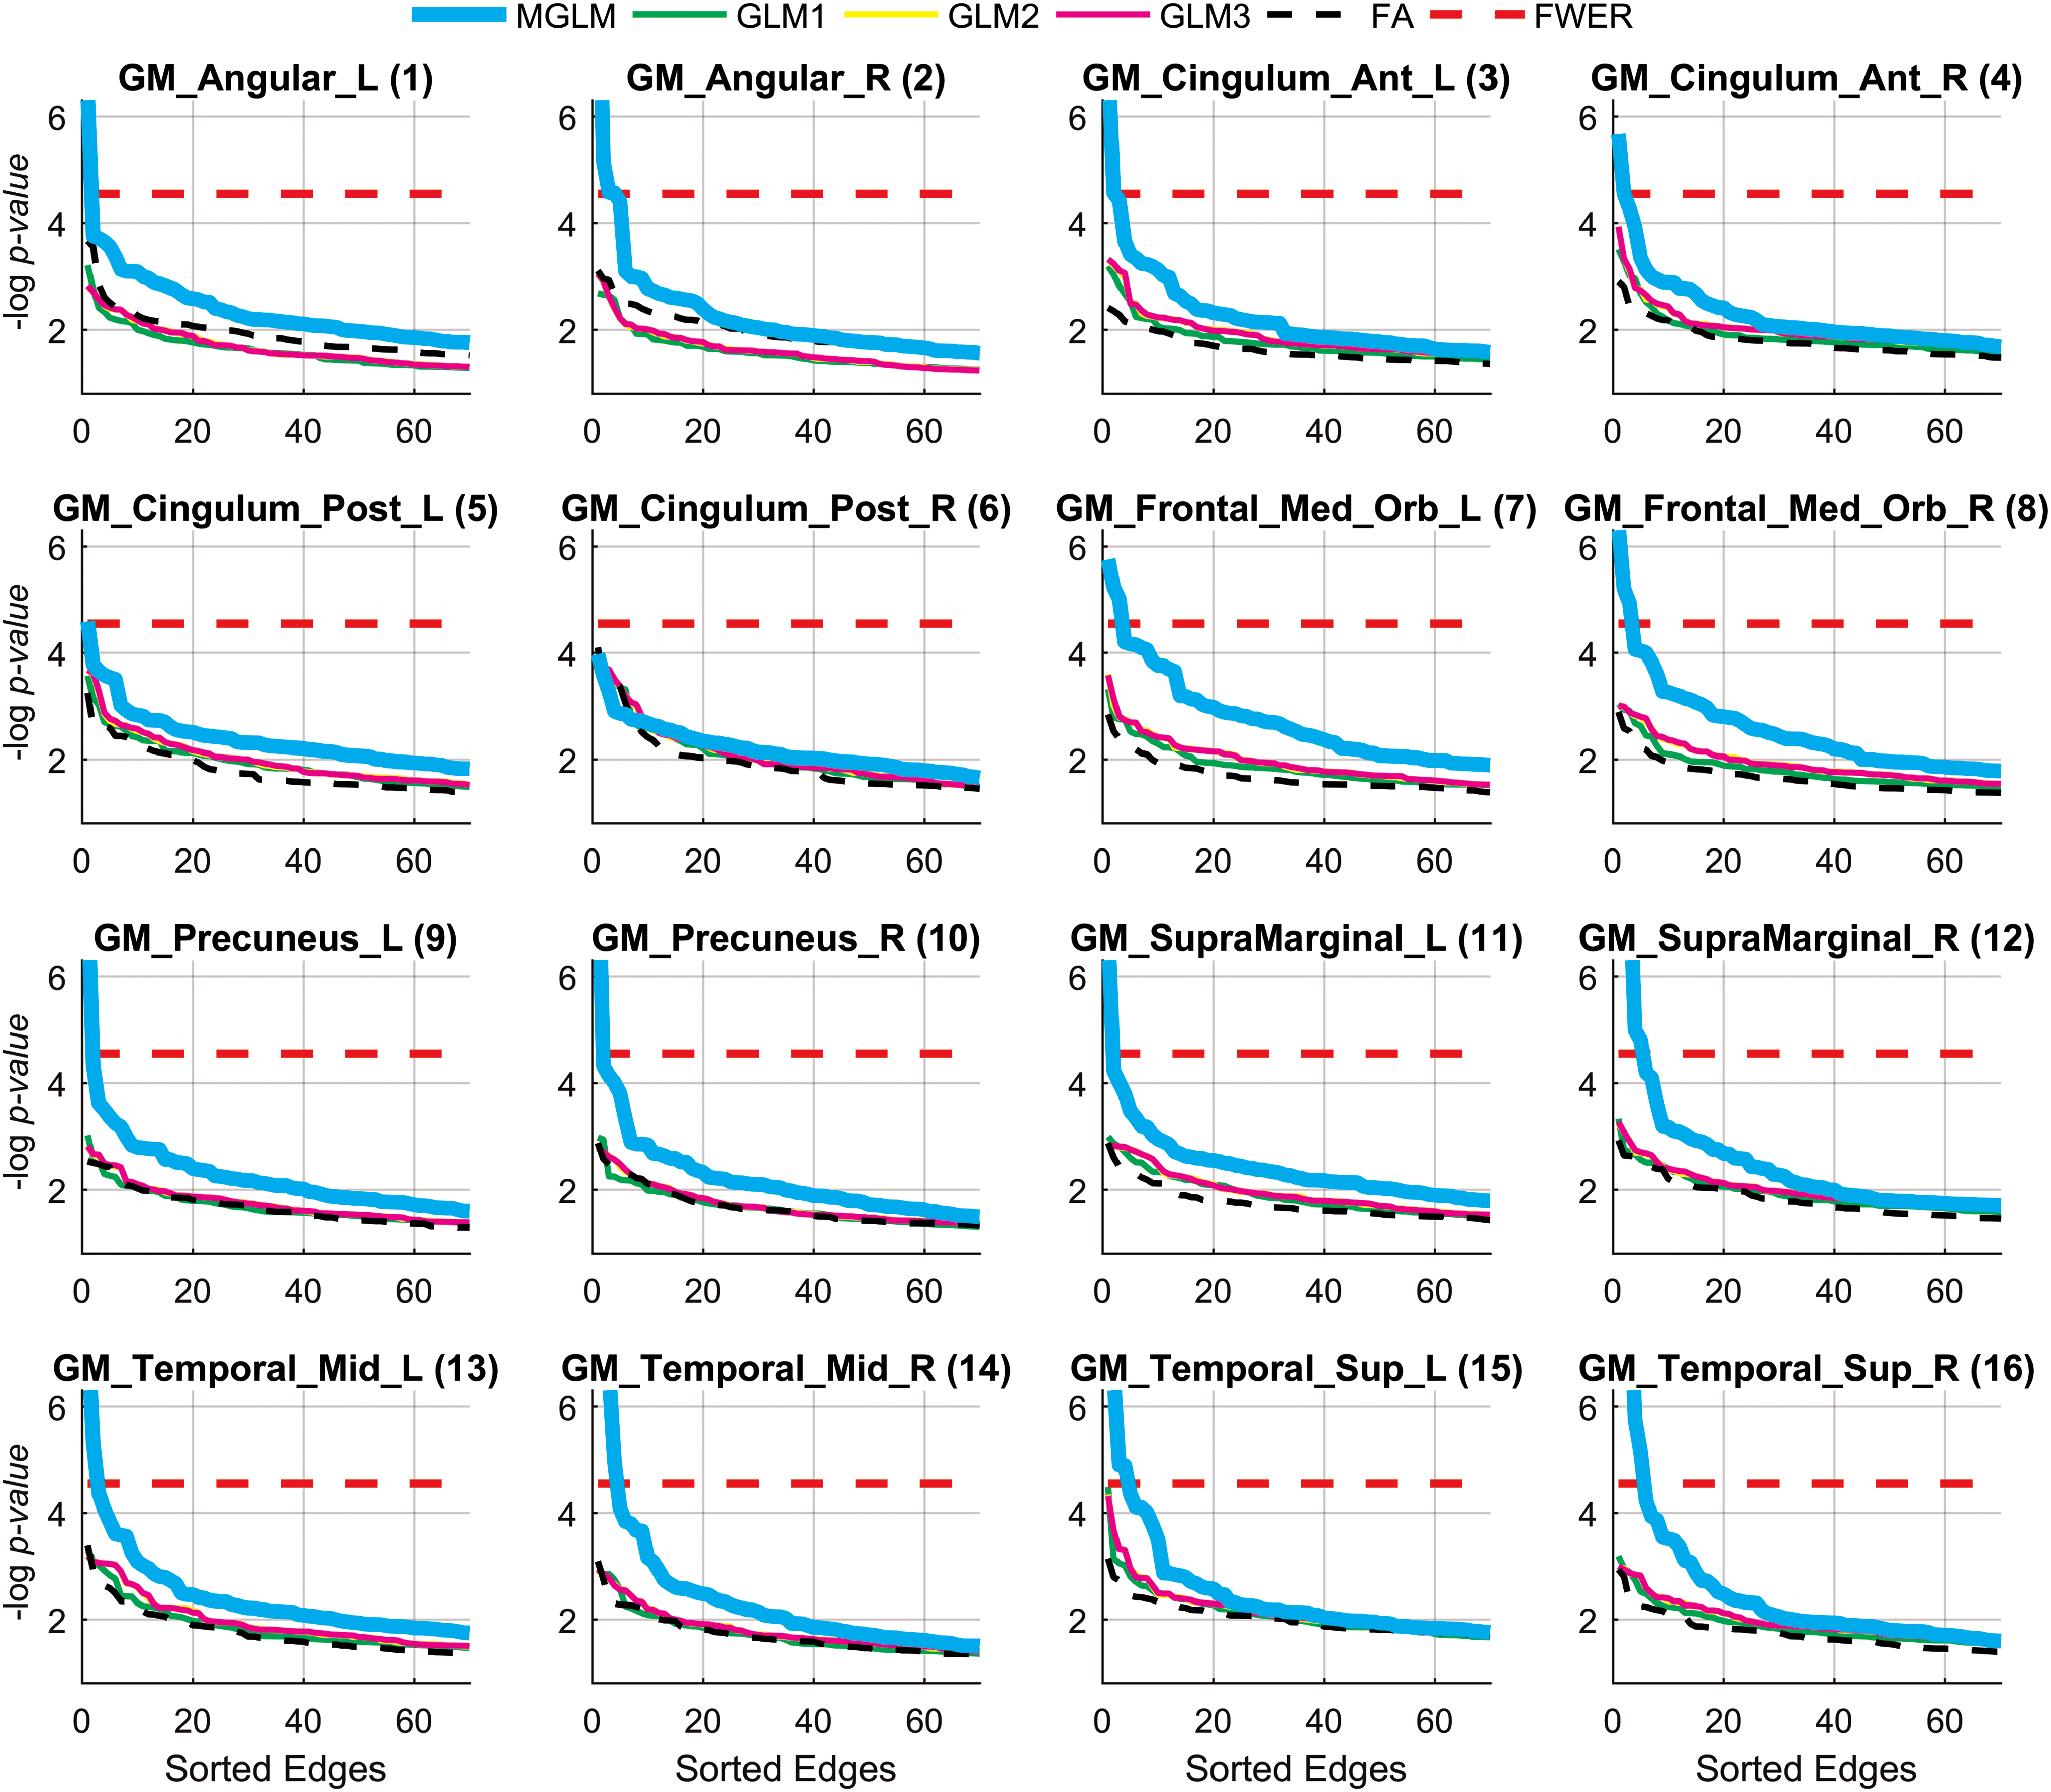
Sorted negative log-scaled p values of the top 70 connections in multiresolution WaCS with respect to 16 PiB DVR ROIs. The connections above the Bonferroni correction threshold (red dashed) are statistically significant. The indices of the PiB ROIs follow Table 1. WaCS, wavelet connectivity signature. Color images are available online.
Association Between Amyloid Burden and Brain Connectivity
ctx, cortex; G, gyrus; inf, inferior; lat, lateral; lh, left hemisphere; med, medial; oc, occipital; rh, right hemisphere; ROI, region of interest; S, sulcal; sup, superior; temp, temporal.
Significant Brain Connections and Their Associated Amyloid Regions
Effects of amyloid burden on structural brain connectivity
In Figure 2,
The baseline setup of testing for the effects on the FA edge weights was not able to reveal statistically significant edges using any of the 16 PiB DVR measures, which can be seen as having no dashed black lines above the FWER lines (dashed red lines) in Figure 2. The individual scales of WaCS (GLM1, GLM2, and GLM3 in Fig. 2) failed to show any significant edges. The multivariate analysis using MGLM considering all the three scales of WaCS (MGLM in Fig. 2) revealed a total of 39 connectivity-to-PiB association pairs showing statistically significant association between PiB and WaCS throughout the 15 of 16 PiB DVR ROIs. The complete set of the PiB ROIs and their significantly related connections are shown in Table 2, where each row block corresponds to a PiB ROI (column 1) and its associated edges connecting GM ROI pairs (columns 2–3) with the Bonferroni corrected p values (column 4). The fiber bundle representations (reconstructed using tractography) of these significantly affected connections are shown in Figure 3.
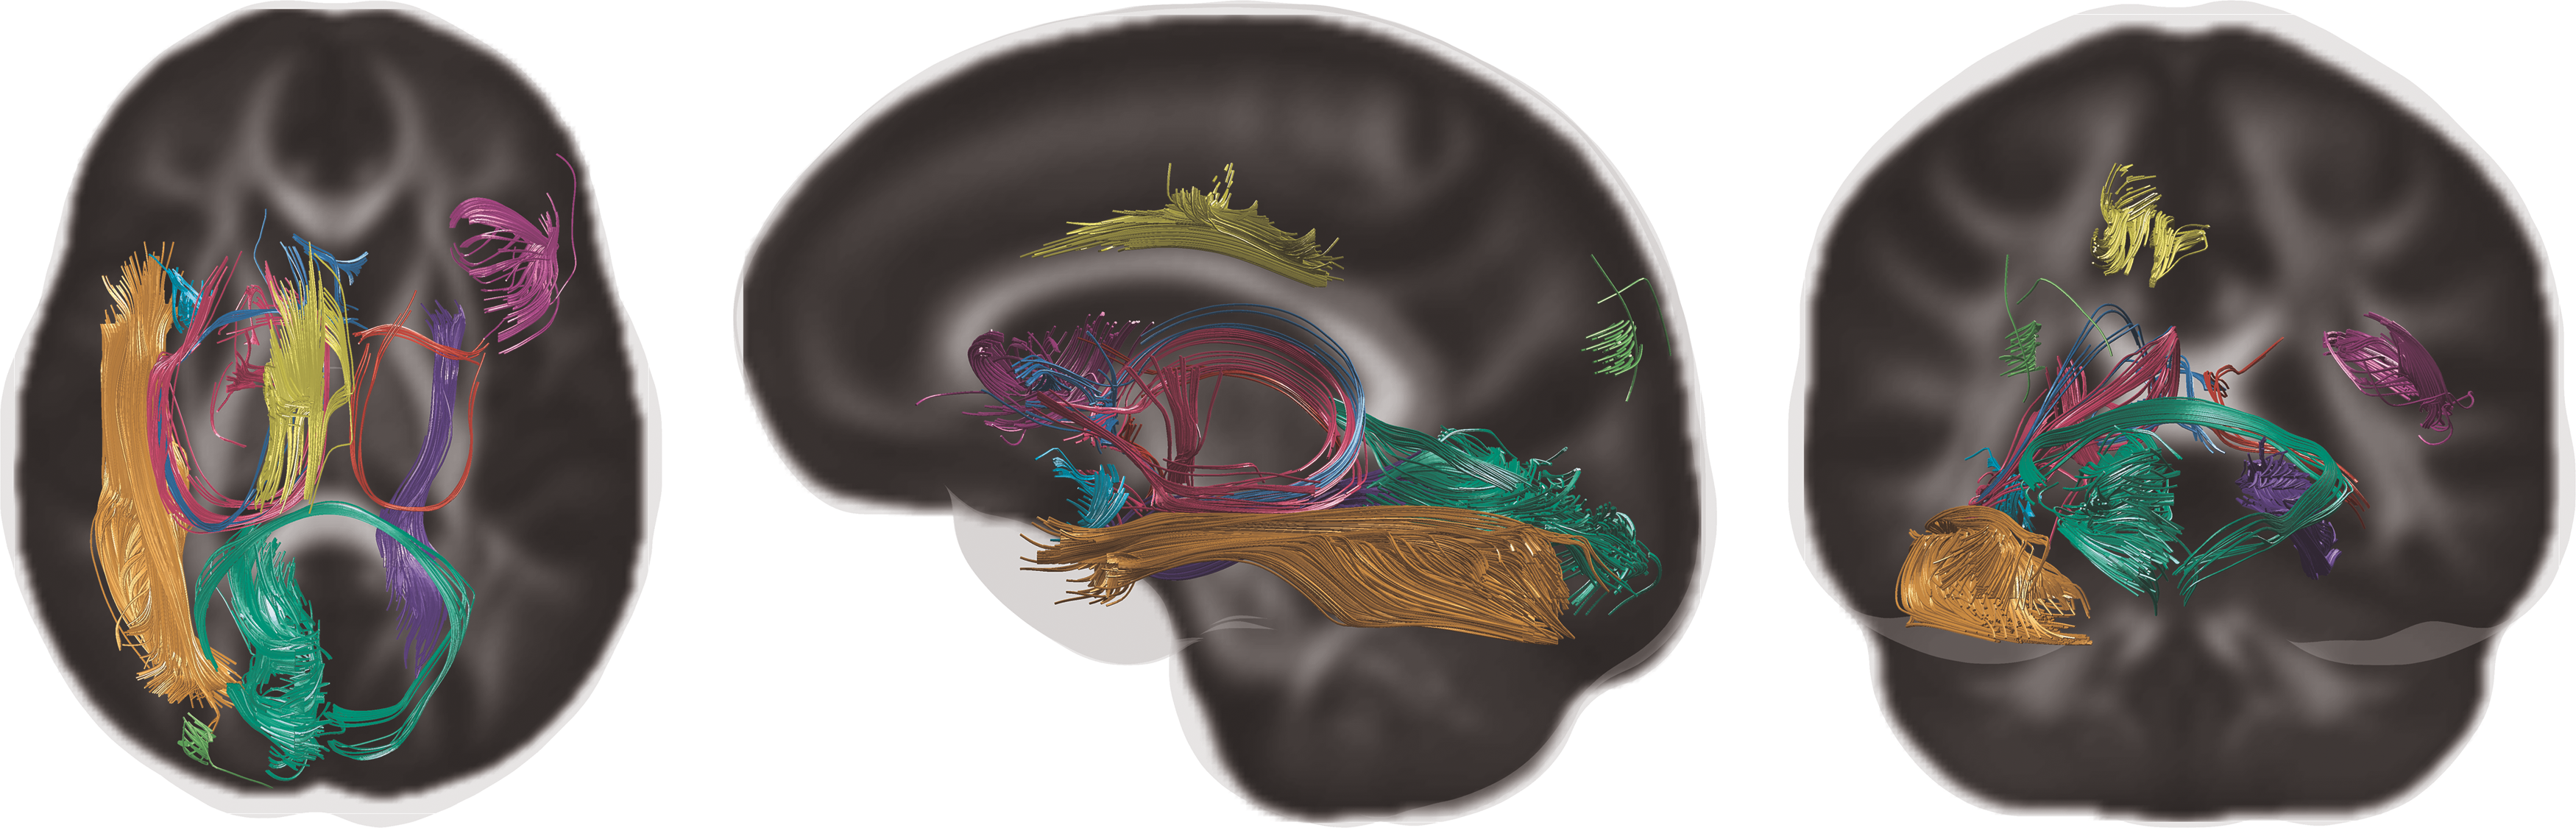
Fiber tracts of the 10 unique connections without their corresponding node ROIs. Color images are available online.
Directionality of the effects of amyloid burden on connectivity
For each of the detected edges, the directionality of the associations between its connectivity strength indexed by FA and the corresponding PiB DVR was inferred from the slope
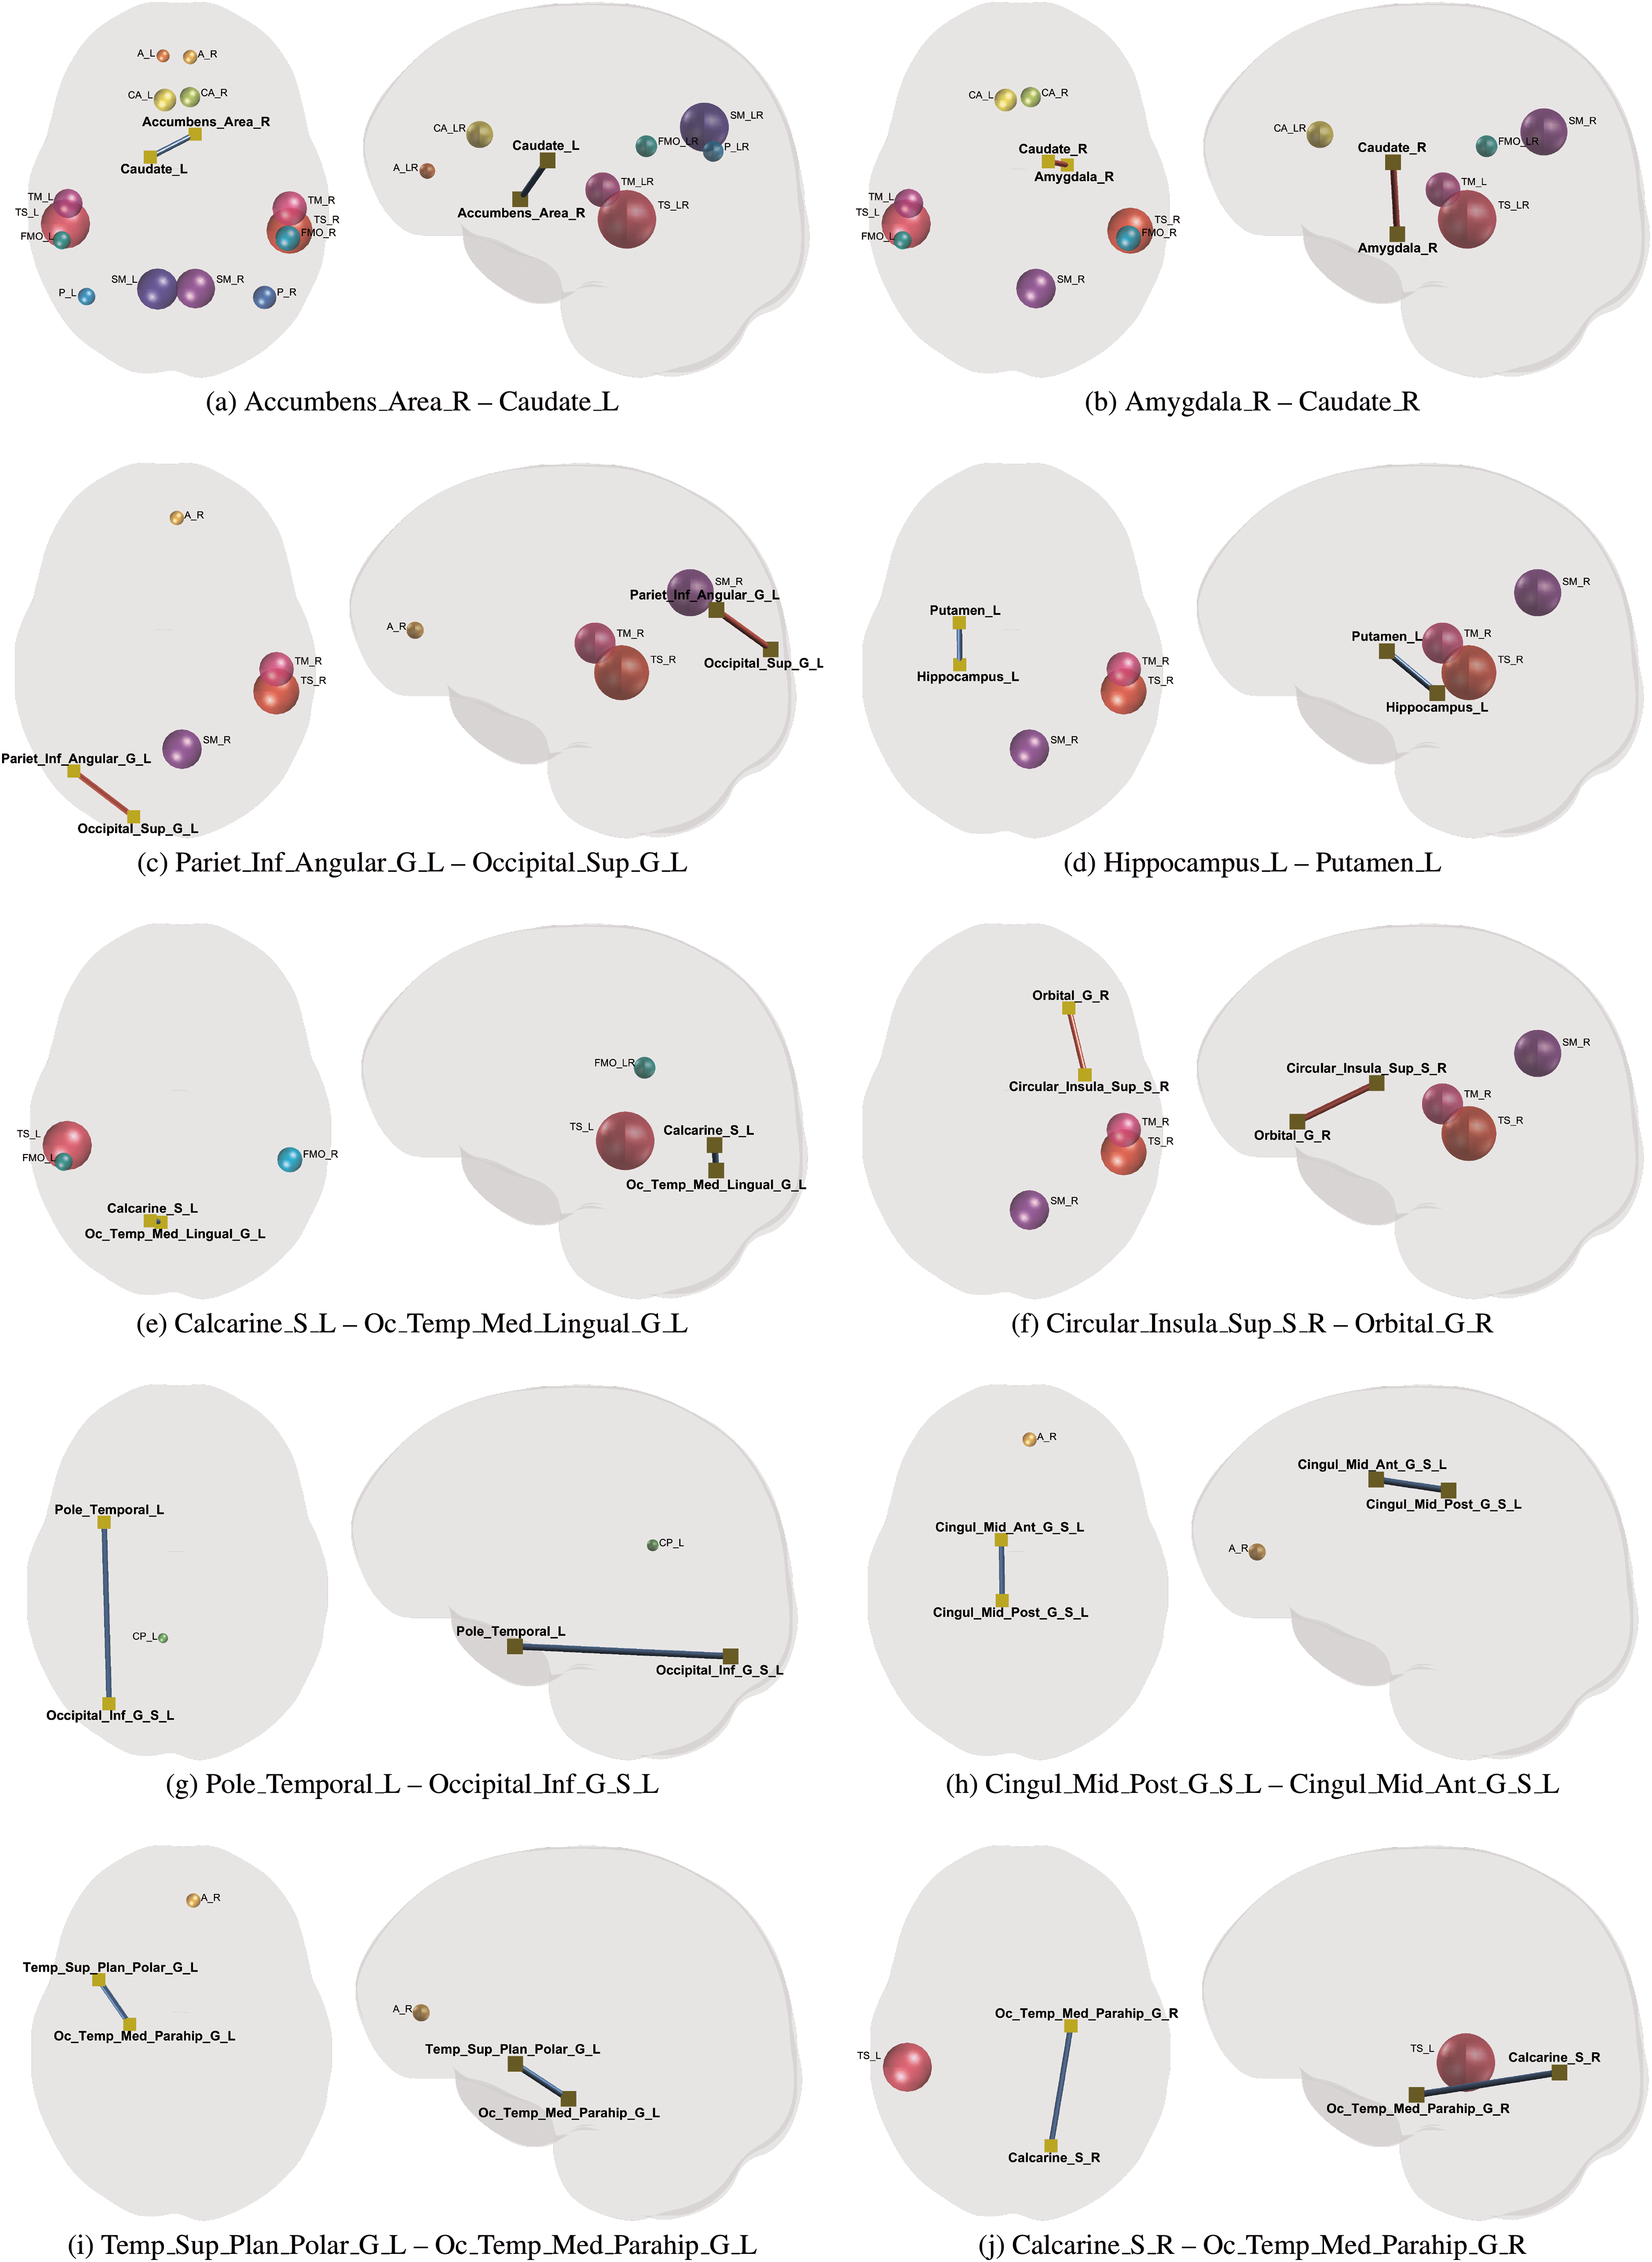
Ten significant edges and their corresponding PiB DVR ROIs (spheres) where blue and red edges indicate positive and negative directions, respectively. The edge labels correspond to those in Table 3. Color images are available online.
Relationship between the affected edges and MMSE
We found that 7 of those 10 pathology-affected edges had positive correlations between their connectivity strengths indexed by FA and MMSE. As shown in Table 2, a positive correlation is indicated by “1”and an inverse correlation is indicated by “−1.” The corresponding linear fits (separated by gender and controlled for age) along with the FA and MMSE scatter plots are shown in Figure 5.
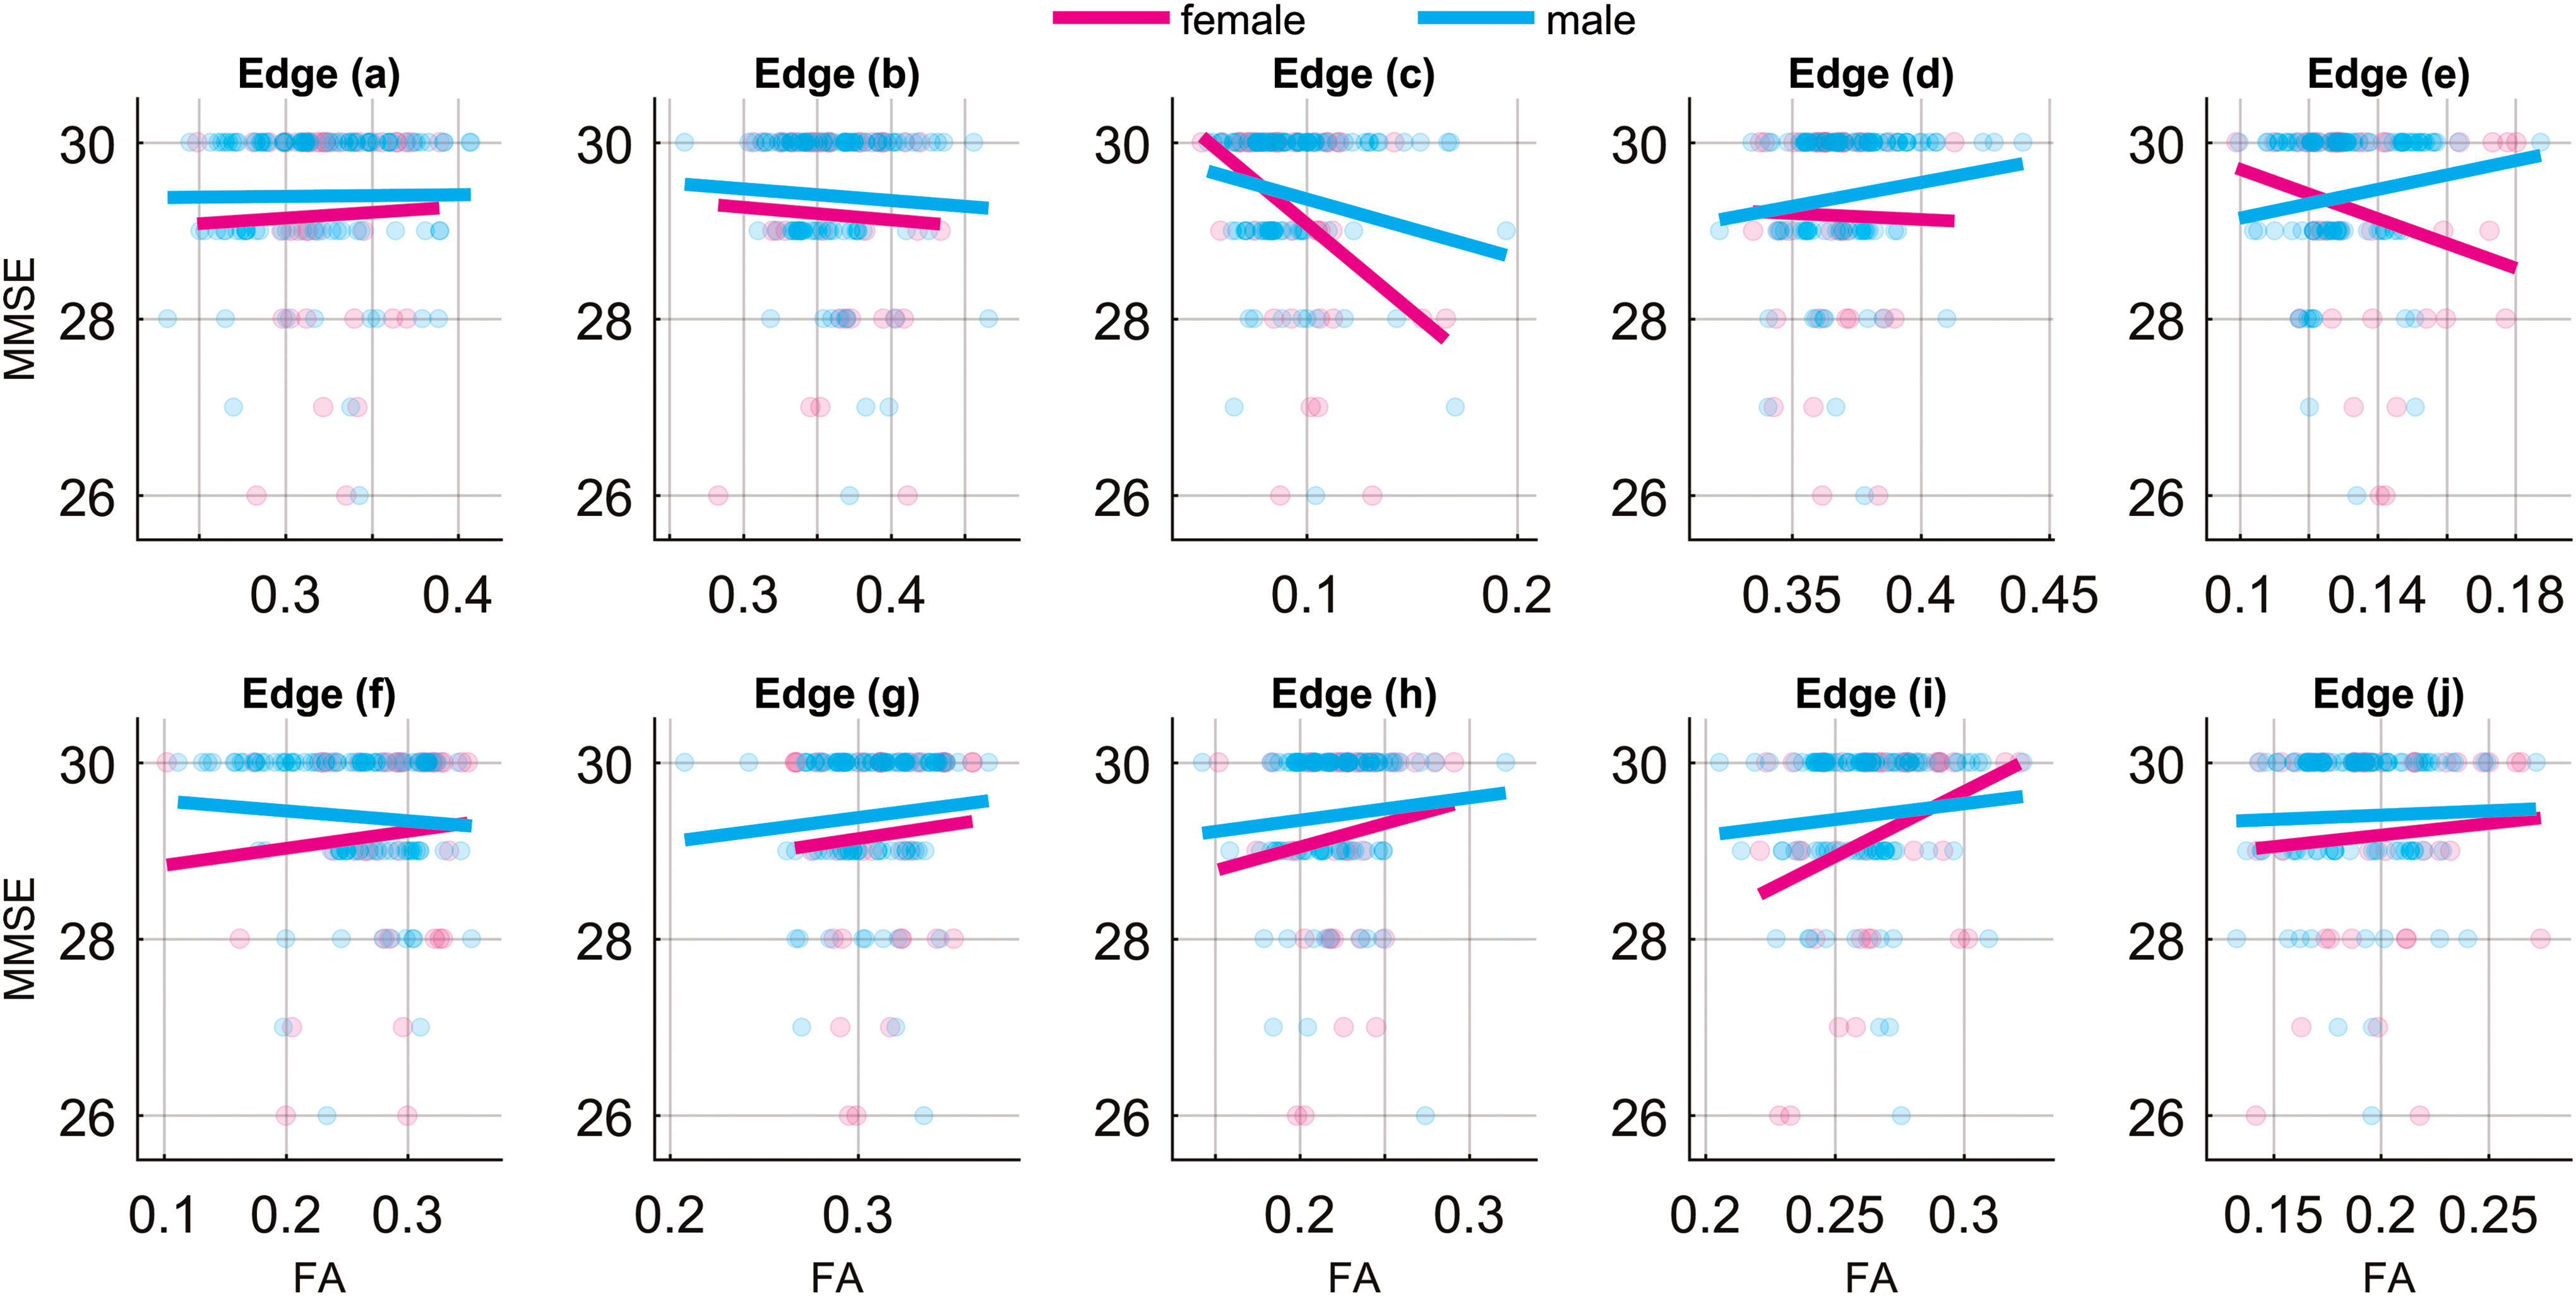
Associations between MMSE and FA of 10 significant connections listed in Table 3 for men and women. The linear fits are adjusted for age. MMSE, Mini Mental State Examination. Color images are available online.
Discussion
AD is characterized by pathological accumulation of amyloid plaques and neurofibrillary tangles, a process, which progresses over years in a presumed stereotypic manner, affecting an increasing number of brain regions. How plaque and tangle accumulation occurs is incompletely known, although an emerging theory is that both beta amyloid and tau propagate through a self-seeding process along structural connectivity networks (Gandy, 2014; Gandy and DeKosky, 2013; Jacobs et al., 2018). Eventually, accumulation of neuropathology leads to dementia, although some individuals may harbor significant plaque and tangle pathology with relatively preserved cognitive function for several years, as shown by postmortem (Andrade-Moraes et al., 2013; Perez-Nievas et al., 2013) and in vivo amyloid and tau PET studies (Jansen et al., 2015). Postmortem and in vivo evidence suggests that in addition to plaque and tangle burden, dementia involves degradation of structural connectivity, including loss of synapses and axonal degeneration.
Growing evidence indicates that brain connectivity changes, including those identified through graph analysis of WM tracts, can explain cognitive symptoms in AD and predict conversion to dementia (Alexander et al., 2011; Filippi and Agosta, 2011; Hampson et al., 2006; Li et al., 2002; Petrella et al., 2011; Shao et al., 2012). Despite differences in connectivity at the dementia and even in MCI stages (Ma et al., 2017; Teipel et al., 2015), AD-related connectivity changes in pre-clinical disease remain relatively poorly characterized. Connectivity degradation in early disease stages are subtle, and classical statistical tools are insufficient in identifying weak disease-related signals with a meaningful level of statistical confidence (Adluru et al., 2014; Racine et al., 2014).
Based on this set of works in the literature, in this study, we investigated the interplay between pathology and structural connectivity, as well as cognitive function among nondemented individuals. Currently, structural connectivity analysis is dominated by two strategies. (1) The first derives “global” measures to characterize connectivity graphs by making use of summaries such as modularity, girth, and diameter of the graph (Sporns et al., 2005). (2) Alternatively, we can analyze individual fiber bundles (Hagmann et al., 2007), where statistical tests are performed for each fiber bundle, one by one, to assess group differences (e.g., between groups of individuals with/without amyloid pathology). Although graph analysis is gaining increased use, both approaches have limitations, especially when applied to a pre-clinical cohort. When differences in connectivity patterns are weak, any summary of the graph will be too global, few connections show meaningful differences. In contrast, we find that statistical tests performed edge-by-edge on the graph indeed reveal potentially meaningful connections at uncorrected levels of Type I (false positive) error thresholds, but after multiple comparisons correction, few edges approach a sensible statistical threshold (Kim et al., 2015).
Since the relationships between neuropathology can be subtle at early disease stages, simple statistical tests performed on edgewise connectivity markers may be insufficient for detecting an effect; in this study, we adopted a multiresolutional approach for identifying these relationships. The “wavelets on graphs” approach provides an attractive solution to these problems by making the edge-wise statistical tests far more sensitive using novel higher dimensional latent representations (Kim et al., 2013, 2014a)—a hybrid global/local scheme.
In this study, we found that amyloid accumulation was associated with several altered connections. Regional amyloid accumulation appeared to be associated with unilaterally altered structural connectivity, for example, amyloid indexed in PiB ROIs from the left hemisphere was largely associated with altered connectivity also in the left hemisphere. Although we are unable to determine causal relationships, this may suggest that amyloid has a local toxic effect on spatially adjacent tracts. Alternatively, it may be possible that unmeasured tau pathology could be playing a role. A recent study indicates that among individuals who are amyloid positive, tau pathology is associated with WM degeneration and further spread of tau through synaptically linked regions.
We did not find that edges linked with greater amyloid accumulation were uniformly associated with lower FA. Indeed, no obvious patterns in the directionality of the associations were observed. These results are consistent with previously reported findings on the relationship between DTI metrics and amyloid and suggest that further study of the relationship between amyloid and DWI metrics is needed (Racine et al., 2014). One possibility is to utilize more specific microstructural models such as neurite orientation dispersion and density imaging (Zhang et al., 2012) and diffusion kurtosis imaging (Steven et al., 2014), which capture more of the microstructural complexity of WM. In the analysis of cognitive function in relation to FA, we found that of 10 unique connections, 7 slopes were positive, suggesting that higher FA is typically associated with better cognitive function. It is important to note, however, that the associations between MMSE and edges affected by amyloid were not statistically significant. We may have been underpowered to find a relationship with cognitive function given that this is a cognitively impaired sample.
An important outcome of this study is that WaCS was shown to be sensitive. WaCS is derived based on a wavelet transformation of edge signals in multiple scales. Such a transformation embeds the original edge signal (univariate) to a higher dimensional space (multivariate), which, in turn, has the effect of substantially improving statistical power. From a machine learning perspective, deriving a novel representation in higher dimensional spaces follows recent trends in deep learning, which aim to construct new representations of the given original signals. In fact, well-constructed representations tend to better capture the characteristics of the signals than the information found in their original domains and the information extends beyond a specific analysis. Such new representations often generalize effectively and provide benefits to various subsequent downstream applications or analyses. WaCS acts similarly in that it is based on a wavelet transform that is a relatively generic spectral analysis technique not specific to the brain connectivity analysis, and thus can be utilized for a number of applications where improved sensitivity is needed. Convolutional neural networks in deep learning algorithms are increasingly used in a variety of settings. Convolutional layers in a deep network derive latent representations of the features or predictors, and the weights of the convolutional filters are learned using training data. Wavelets, as used in this study, accomplish a similar goal, although with fixed bases. In fact, Mallat (Bruna and Mallat, 2013; Mallat, 2016) showed a relationship between a deep convolutional network and a cascade of wavelet expansions with nonlinear operations in between. Simply put, WaCS can be thought of as a latent representation of the structural connectivity at each fiber bundle. Although the filters are not learned, the latent representations are powerful and offer high sensitivity.
Wavelet-based information aggregation is also similar to the idea of using clustering to improve statistical power as shown in Dahl (2006) and Dahl and Newton (2007) for microarray analysis (Newton et al., 2006). A more detailed description is given in Kim (2017). In simulations when the true group differences are known, we have previously shown that wavelets-based analysis of the type shown here compares very favorably with both hierarchical grouping and spherical harmonics smoothing in several articles from our group (Hwa Kim et al., 2015; Kim, 2017; Kim et al., 2012, 2014b, 2015), and importantly, facilitating reduced sample sizes in neuroimaging studies.
Limitations
A few limitations in WaCS analysis deserve note. As with other typical spectral analysis techniques such as principal component analysis, the computational effort increases with respect to the size of the graph. Specifically, the computational effort of the wavelet transform is quadratic in a number of edges in the brain connectivity network, which we focus on in the line graph domain. However, this is a relatively minor drawback given that brain networks are often sparse (i.e., valid edges are much fewer than the possible edges), and operating on several thousands of edges has become more efficient with increased processing power. The final outcome of the statistical analysis using WaCS could vary depending on the choice of parameters (i.e., number of scales and the type of mother wavelet). In practice, however, we observed that the improvement was consistent in general without a rigorous parameter searching. A remaining challenge is how to choose those parameters in an unbiased way, since the parameters for wavelet transform are often user defined. Also, although the WaCS method determined significant associations between structural connectivity and amyloid, analyses utilizing WaCS need to be further queried to determine the direction of the relationships. Optimizing WaCS to facilitate direct interpretation remains a future goal of this work.
Conclusion
This study applied a multiresolution approach to the study of amyloid effects on structural brain connectivity. Amyloid burden was associated with we identified 10 out of the 1761 possible connections, a result that was observed across several of brain regions studied. Across several of note, these relationships were not detectable using simple measures of connectivity such as individual edge weights. Thus, multiresolution analysis of structural connectivity was more effective in detecting the correlations between amyloid pathology and structural alteration among cognitively asymptomatic individuals. Furthermore, for 7 of those 10 network connections, the loss in their connectivity strength was correlated with lower score in MMSE, supporting the association between connectivity loss and cognitive decline.
Footnotes
Acknowledgments
This study was funded by a University of Wisconsin CIBM fellowship 5T15LM007359-14, the BRAIN Initiative R01-EB022883-01, the Waisman Intellectual and Developmental Disabilities Research Center U54-HD090256-01, the Center for Predictive and Computational Phenotyping (CPCP) U54-AI117924-03, and the Alzheimer's Disease Connectome Project (ADCP) UF1-AG051216, R01-AG037639, R01-AG027161, and P50-AG033514.
Author Disclosure Statement
No competing financial interests exist.