
Abstract
Although a large body of research has identified discrete neuroanatomical regions involved in social cognition and behavior (the “social brain”), the existing findings are based largely on studies of specific brain structures defined within the context of particular tasks or for specific types of social behavior. The objective of the current work was to view these regions as nodes of a larger collective network and to quantitatively characterize both the topology of that network and the relative criticality of its many nodes. Large-scale data mining was performed to generate seed regions of the social brain. High-quality diffusion MRI data of typical adults were used to map anatomical networks of the social brain. Network topology and nodal centrality were analyzed using graph theory. The structural social brain network demonstrates a high degree of global functional integration with strong local segregation. Bilateral dorsomedial prefrontal cortices and amygdala play the most central roles in the network. Strong probabilistic evidence supports modular divisions of the social brain into subnetworks bearing good resemblance to functionally classified clusters. The present network-driven approach quantifies the structural topology of the social brain as a whole. This work can serve as a critical benchmark against which to compare (1) developmental change in social brain topology over time (from infancy through adolescence and beyond) and (2) atypical network topologies that may be a sign or symptom of disorder (as in conditions such as autism, Williams syndrome, schizophrenia, and others).
Introduction
The “social brain” refers to a collection of brain regions that are commonly identified as playing a functional role in a range of social behaviors and cognitive processes that include processing social stimuli; understanding and acting upon other people's beliefs and intentions; judging and responding to interpersonal norms; and efficiently navigating the intersubjective social world as a whole (Brothers, 2002; Brothers et al., 1990). Single-cell recording studies, animal lesion studies, as well as human clinical lesions have helped to identify a number of brain regions—including the amygdala (AMG), orbitofrontal cortex, superior temporal gyrus, and superior temporal sulcus—that are commonly involved in social behavior (Brothers, 2002; Brothers et al., 1990). Results from many functional neuroimaging studies have added to this large and growing body of research to support the inclusion of a long list of brain areas now identified as playing a role in social behavior and forming a social brain network, including the fusiform gyrus (FG) in face perception (Kanwisher and Yovel, 2006); the precuneus and adjacent posterior cingulate in tasks related to “mentalizing” (Fletcher et al., 1995); and the inferior parietal lobe (IPL) and premotor cortex (PMC) when relating our own actions to the perception of other people's actions (the “mirror” system; Rizzolatti and Craighero, 2004). There is also now a large corpus of functional MRI and positron emission tomography (PET) studies examining the function of these brain regions in the context of both typical and impaired social functioning (Adolphs, 2010; Kennedy and Adolphs, 2012).
However, to the best of our knowledge, no study has yet quantified the structural topology of the comprehensive network (or networks) formed by the majority of brain regions commonly recruited in social behavior. Such work is urgently needed: The study of network topology as a whole (in brain and other phenomena) has consistently affirmed that, for networks, the whole can nearly always be considered to be more than the sum of its parts: networks of interconnected nodes behave in ways that are often strikingly different from how those nodes could or would behave in isolation (Hagmann et al., 2008). Specifically, studies on anatomical connectivity patterns of the social brain can (1) provide organizational information about relatively invariant brain characteristics, which constrain cortical dynamics and cognitive processes, (2) increase our understanding of how relevant social functions emerge from underlying structural substrates, and (3) provide mechanistic insights into the neuroanatomical basis of psychiatric disorders (Sporns et al., 2005).
These studies, in and of themselves, also tell us something quite profound about network topology and how that topology emerges at the intersection of structure/function and of brain/behavior (Fair et al., 2009; Hagmann et al., 2008). Behaviors utilize and depend on whatever resources are available: landmark studies in model systems reveal how the function of certain regions can be developmentally reprogrammed, with still functional results for the animal (Merzenich et al., 1983). These results may suggest that diverse functions can be subserved by a variety of network configurations, but that evolutionary pressures have strongly shaped the most probable network topology over time. If a brain region exhibits altered activation, it could imply that the network topology—the manner in which that region is topologically integrated with other brain regions, and how that topology likely developed over time—is also likely to be atypical (Belmonte et al., 2004; Kleinhans et al., 2008; Pierce, 2001). Many psychiatric and neurological disorders disrupt typical social behavior (see Kennedy and Adolphs for a review; Kennedy and Adolphs, 2012). As a result, understanding these brain disorders will require detailed knowledge of the topological organization of the normative social brain network as a whole, as well as knowledge of the criticality of specific nodes and pathways within that network (Achard and Bullmore, 2007; Lewis et al., 2014).
In the current study, we map the anatomical pathways of the social brain network in typical adults using diffusion tractography. Specifically, we derive the most probable white matter pathways connecting regions commonly implicated as having a role in social behavior. We then focus on identifying and quantifying the centrality of each brain region, its primary connections, as well as the modular structure of the larger network using a full range of tested network densities and centrality measures (Hagmann et al., 2008; Rubinov and Sporns, 2010). Finally, we discuss our findings in the context of network theory and psychiatric disorder.
Methods
Participants
In this study, T1-weighted structural and diffusion MRI data from 39 healthy, right-handed human adult participants (age range: 22–35 years, 21 females) were acquired from the Human Connectome Project (HCP) database. Due to computational processing constraints for analysis of probabilistic tractography (with >27,000 tracts identified with the current sample size), 39 participants were randomly chosen from the release of 80 participants. Participants had no history of neurological or psychiatric disorder and had no familial biological relationship to one another.
MRI data acquisition and preprocessing
The HCP diffusion MRI data were collected on a 3T Skyra scanner using a customized 100 mT/m gradient and multiband techniques (Uğurbil et al., 2013). These state-of-the-art hardware and pulse sequences made it possible to acquire diffusion data with high spatial resolution (1.25 mm isotropic), high angular resolution (270 diffusion directions), and high diffusion contrasts (b values of 1000, 2000, and 3000 sec/mm2) on a 3T scanner. The total scan time for diffusion MRI data was 1 h per participant. Additional details on the data acquisition and preprocessing of the HCP structural and diffusion MRI data can be found elsewhere (Glasser et al., 2013; Uğurbil et al., 2013;
Defining social brain regions of interest using NeuroSynth
Regions of interest (ROIs) in the social brain can be defined on the basis of prior research and existing literature regarding brain regions commonly recruited in social behavior (Li et al., 2015; Van Overwalle, 2009). Although this approach provides a reasonable starting point for defining locations of brain regions commonly recruited in socially relevant tasks, the regions studied in this manner will necessarily be limited by the number of studies considered.
To make ROIs in the current study more representative of findings from as broad a body of literature as possible, we used NeuroSynth, a large-scale database of functional neuroimaging studies—encompassing more than 10,000 studies—to identify social brain ROIs (Yarkoni et al., 2011). NeuroSynth is an automated brain-mapping framework that utilizes text-mining and meta-analysis to create a large database of mappings between neural and cognitive states. Compared with other available meta-analysis software, such as BrainMap (Eickhoff et al., 2009), it includes a larger number of studies (11,406 studies in NeuroSynth vs. 2823 studies in BrainMap) and can also perform reverse inference analyses. When attempting to focus analyses more narrowly on regions specifically associated with social behavior, as opposed to those regions commonly recruited in domain-general cognitive processes, the reverse-inference functionality can be a useful technique (e.g., by identifying patterns of activation repeatedly found in nonsocial and social tasks separately; Yarkoni et al., 2011). Upon review of the existing social brain literature and terms in the NeuroSynth database, we used 34 search terms that drew upon more than 1000 different prior studies. The terms can be conceptually clustered into six categories (Fig. 1A), five of which are social cognitive processes/behaviors: empathy (de Vignemont and Singer, 2006; Lamm et al., 2011), face processing (Kanwisher and Yovel, 2006; Saxe and Kanwisher, 2003), mentalizing (Dodell-Feder et al., 2011; Saxe, 2006; Spunt et al., 2010), action perception/mirror neuron activity (Molenberghs et al., 2012; Rizzolatti and Craighero, 2004), and emotion (Murphy et al., 2003; Phan et al., 2002; Supplementary Table S1; Supplementary Data are available online at
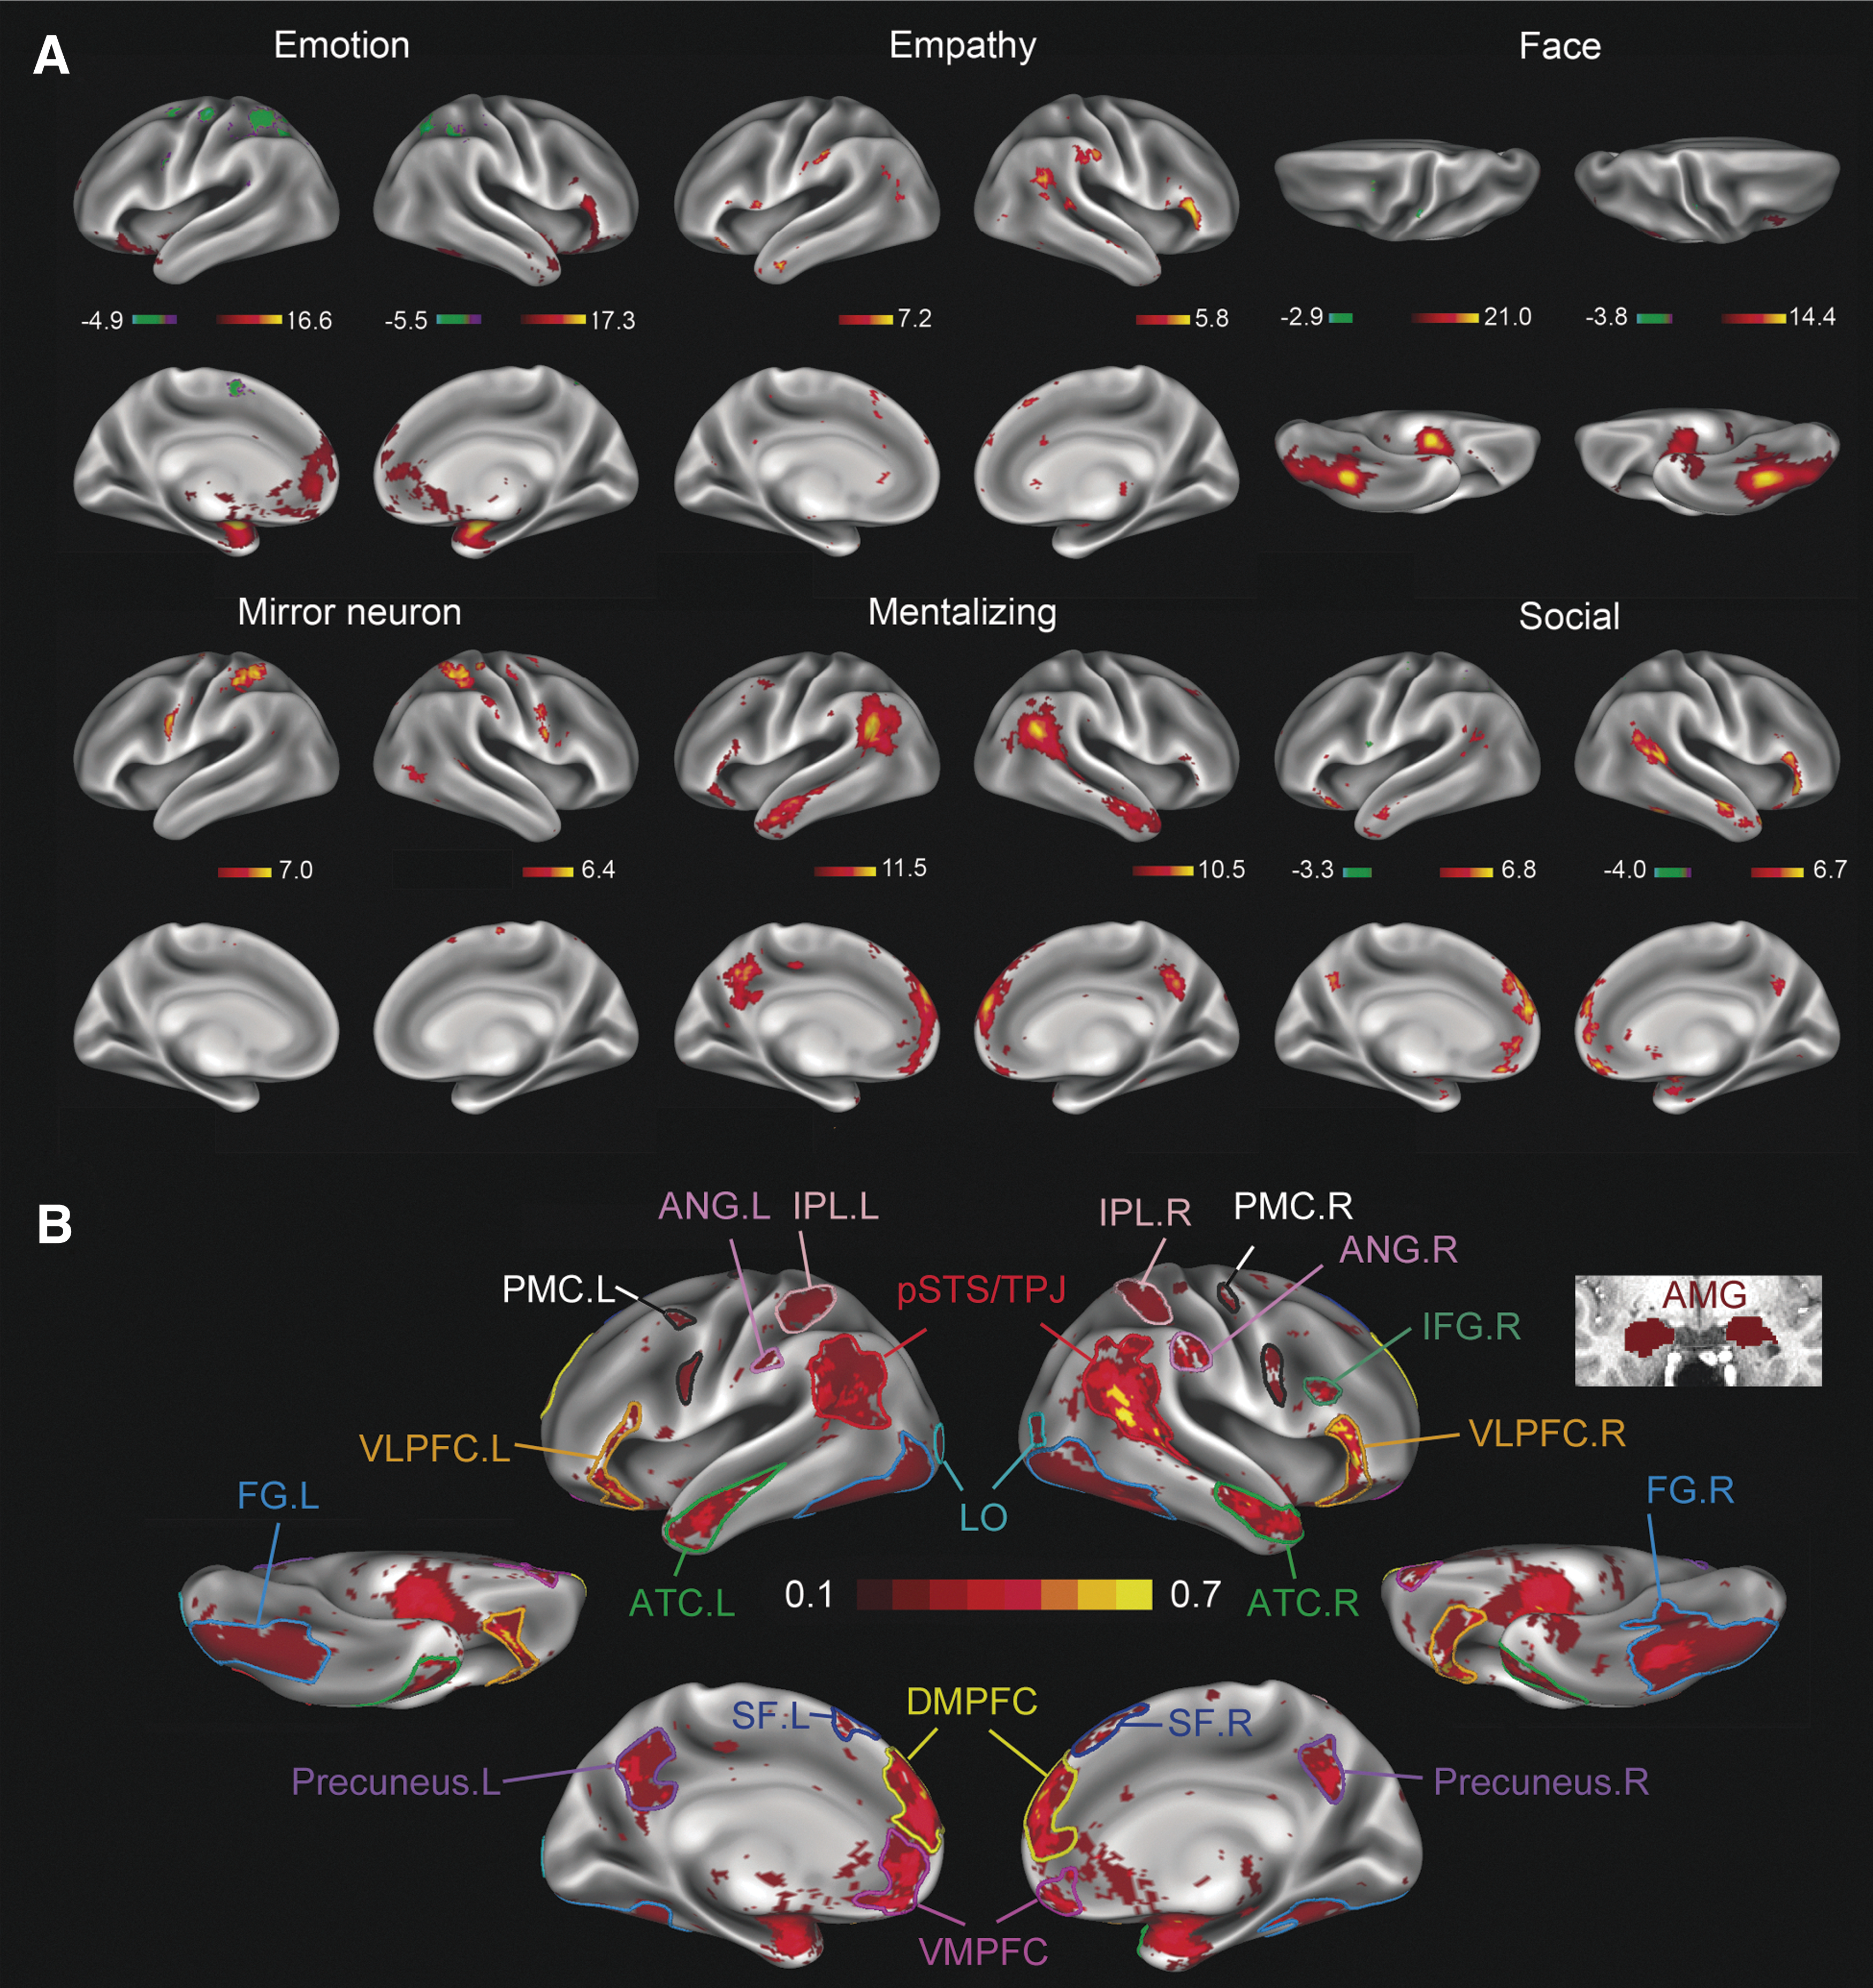
Meta-analysis results for identifying social brain regions. Thirty-four terms related to five primary social brain activation maps were used in meta-analyses conducted on the NeuroSynth platform. An average of 205 studies were identified per term (Supplementary Table S1). Terms more generally related to “social” were also included in the analyses as they were found to identify the majority of brain regions frequently reported in the existing literature (Adolphs, 2009; Stanley and Adolphs, 2013).
The activation maps identified through this automated meta-analysis are consistent with regions identified through selective literature review (Brothers, 2002; Brothers et al., 1990; Kennedy and Adolphs, 2012) but offer the complement of drawing upon a larger body of prior studies. Intuitively, the regions identified can be thought of as regions showing differential activation in studies that included the relevant keyword versus those that did not include that keyword, with correction for false discovery using false discovery rate at p < 0.01. After thresholding (Z > 2), binarizing, and averaging the activated maps corresponding to the different social brain activation maps, we were left with 27 social brain ROIs for use in the subsequent network analyses (Fig. 1B). The center of gravity and surface areas/volumes of the 27 ROIs, as well as the social networks in which they are implicated are listed in Supplementary Table S2.
Deriving anatomical connections of the social brain network
As detailed in a previous study (Li et al., 2012), we used probabilistic diffusion tractography implemented in the FMRIB Software Library diffusion toolbox to track anatomical connections linking all ROIs. Twenty-five of the 27 social brain ROIs were identified as surface meshes located at the boundaries between gray and white matter, with the pial surface serving as a stop mask. Methodologically, such surface-based ROIs do not protrude into the white matter, reducing false-positive connections. Moreover, the stop masks enforced by the pial surface prevent fiber tracks from “leaking” into adjacent gyri, further improving the accuracy of tractography. We used a partial volume model with automatic relevance detection (ARD) for delineating the dominant and two subsidiary fibers in each voxel (Behrens et al., 2007). After the tracts between each ROI pair were obtained, tracts were normalized by the total number of streamlines sent from the ROI pair and then thresholded at 1 × 10⁻⁷ (multiple thresholds at 5 × 10⁻⁶ and 1 × 10⁻⁶ were tested with consistent findings at each). This particular method, using thresholded tract volume to quantify connectivity strength between each ROI pair, was selected because it has been shown previously to be less confounded by effects of distance between ROI pairs (the “distance effect”; Li et al., 2012); although we prefer this method for this reason, the measures are well correlated with other commonly used metrics of connectivity strength (see Discussion section for more details).
Finally, to avoid possible biases introduced by arbitrary selection of a single network density (a well-known challenge in probabilistic tractography; Gong et al., 2009; Li et al., 2012), all graph theory measures were computed across a broad range of network densities (summed as the area under the curve across network densities ranging from 10% to 50%). We also closely examined the courses and terminations of each pathway obtained using diffusion tractography by generating probability maps of the tracts. Detailed description of the procedure for generating these probability maps can be found in our previous work (Li et al., 2010).
Analyzing topology of the social brain network using graph theory
In the present study, we were interested in the organizational architecture of the social brain network as a whole, which can be studied using graph theory. Graph theory is a powerful mathematical tool that is designed to uncover hidden regularities and organizational principles of complex networks and that can also quantify the role of individual nodes within such networks (Hagmann et al., 2008; Rubinov and Sporns, 2010). This method not only allows us to quantify the role of nodes in a data-driven manner but also enables the analysis of the network for evidence of modular organization (or “subnetworks”) for comparison with other modular groupings identified by task-based functional MRI studies (Kennedy and Adolphs, 2012). Definitions of all graph theoretic metrics used in the current analyses can be found in work by Rubinov and Sporns (2010), and all the graph theoretic functions used in the study were derived using the Brain Connectivity Toolbox (BCT;
To quantify the role of individual nodes in the social brain network, we utilized four complementary measures (Li et al., 2013): closeness centrality, betweenness centrality, vulnerability, and dynamic importance. Closeness centrality and betweenness centrality focus on topological distance within the network, whereas vulnerability and dynamic importance focus on the effects of network perturbation:
Closeness centrality of node i of the weighted network with the distance between node i and j:
Betweenness centrality of node i of the weighted network:
where
Vulnerability of node i of the weighted network (Kaiser and Hilgetag, 2004; Rubinov and Sporns, 2010):
where Ew
is the global efficiency of the weighted network:
with
Dynamic importance of node i of the weighted network (Restrepo et al., 2006):
where
For each of these measures, regions can be ranked according to their observed values, and from these rankings, putative “hubs” can be defined as regions that consistently rank more highly than other regions. In the current study, hubs of the social brain network were identified as regions having top-ranked values in at least three of the four centrality measures. To again avoid biases introduced by selecting any single arbitrary threshold, we analyzed results over a range of varying thresholds: “top-ranking” was systematically varied across all thresholds from the third percentile (i.e., a putative hub would have to have higher ranking values than all 26 other regions in 3 of 4 measures) to the sixth percentile (higher ranking in 3 of 4 measures than at least 25 of the remaining 27 nodes) and so on until the 100th percentile with all 27 nodes included. This approach can be understood as a nonbiased iterative approach to quantifying the roles of nodes within a network.
Depending on how the internal nonlinks in each cluster are penalized, nodes in the social brain network can be hierarchically grouped into different modules (Reichardt and Bornholdt, 2006; Rubinov and Sporns, 2010). We thus examined layouts of modules in the social brain network under varying hierarchical resolutions. Specifically,
where
Finally, to identify evidence of modular organization of the network, we generated 50,000 random matched networks and then compared the modularity of the actual averaged social brain network with those of the matched random networks using permutation testing (p < 0.05, two-tailed).
The relationship between nodal graph theoretic measures and nodal surface areas was also examined by correlating the average of the four graph theoretic metrics (CC, BC, Vl, and Dy) across network densities with the average surface areas of the ROIs using Pearson's correlations. To investigate whether nodes participating in a broader set of social processing networks tend to be more critical in network topology, we also correlated the mean of each node's graph theoretic metrics with the number of social processing networks in which the node was involved using Spearman's correlations. The number of networks in which each node was involved was derived based on Figure 1 and Supplementary Table S2.
Results
The globally integrated and locally segregated social brain network
When the density of the network is relatively low (10% ≤ D ≤ 50%), the structural social brain network has a short characteristic path length, similar to those of degree-matched random networks (1.05 ≤ λnorm ≤ 1.18) but with a much higher clustering coefficient (1.06 ≤ ϒnorm ≤ 1.90). This evidence is consistent with a defining characteristic of small-world networks (1.02 ≤ δnorm ≤ 1.79; Rubinov and Sporns, 2010; Watts and Strogatz, 1998) and constitutes robust evidence that the structural social brain network adheres to small-world organizational principles.
Region centrality and connectivity in the social brain network
Rankings of closeness centrality, betweenness centrality, vulnerability, and dynamic importance for nodes in the social brain are shown in Figure 2. As described above in the Methods section, putative hubs of the social brain network were identified by finding nodes that consistently ranked highly in at least three of four centrality measures for each individual run (Fig. 3). The top four most frequently identified hubs (across all thresholds for identification) were bilateral dorsomedial prefrontal cortex (DMPFC) and AMG. This evidence reinforces the notion that these nodes play a critical role in the organizational architecture of the social brain network. No significant correlations were observed between nodal surface area and three of the four graph theoretic measures (R's < 0.34; p's > 0.107); a significant positive correlation was observed between nodal surface area and closeness centrality (R = 0.5, p < 0.008; Supplementary Fig. S1). These results indicate that nodal importance within social brain networks is not primarily driven by the size of ROIs. We also examined the relationship between nodal graph theoretic metrics and the number of social processing networks that a node participates in (i.e., network membership), to test the hypothesis that brain regions involved in broader sets of social processing networks tend to have higher criticality in the social brain network. Our results demonstrated moderate evidence for the hypothesis, that is, we found positive correlations between number of network memberships and closeness centrality (R = 0.56, p < 0.02) and vulnerability (R = 0.44, p < 0.02), a trend toward a positive correlation between number of network memberships and dynamic importance (R = 0.37, p < 0.056; Supplementary Fig. S2). The highest nodal network measures were frequently associated with nodes with three, instead of four, network memberships.
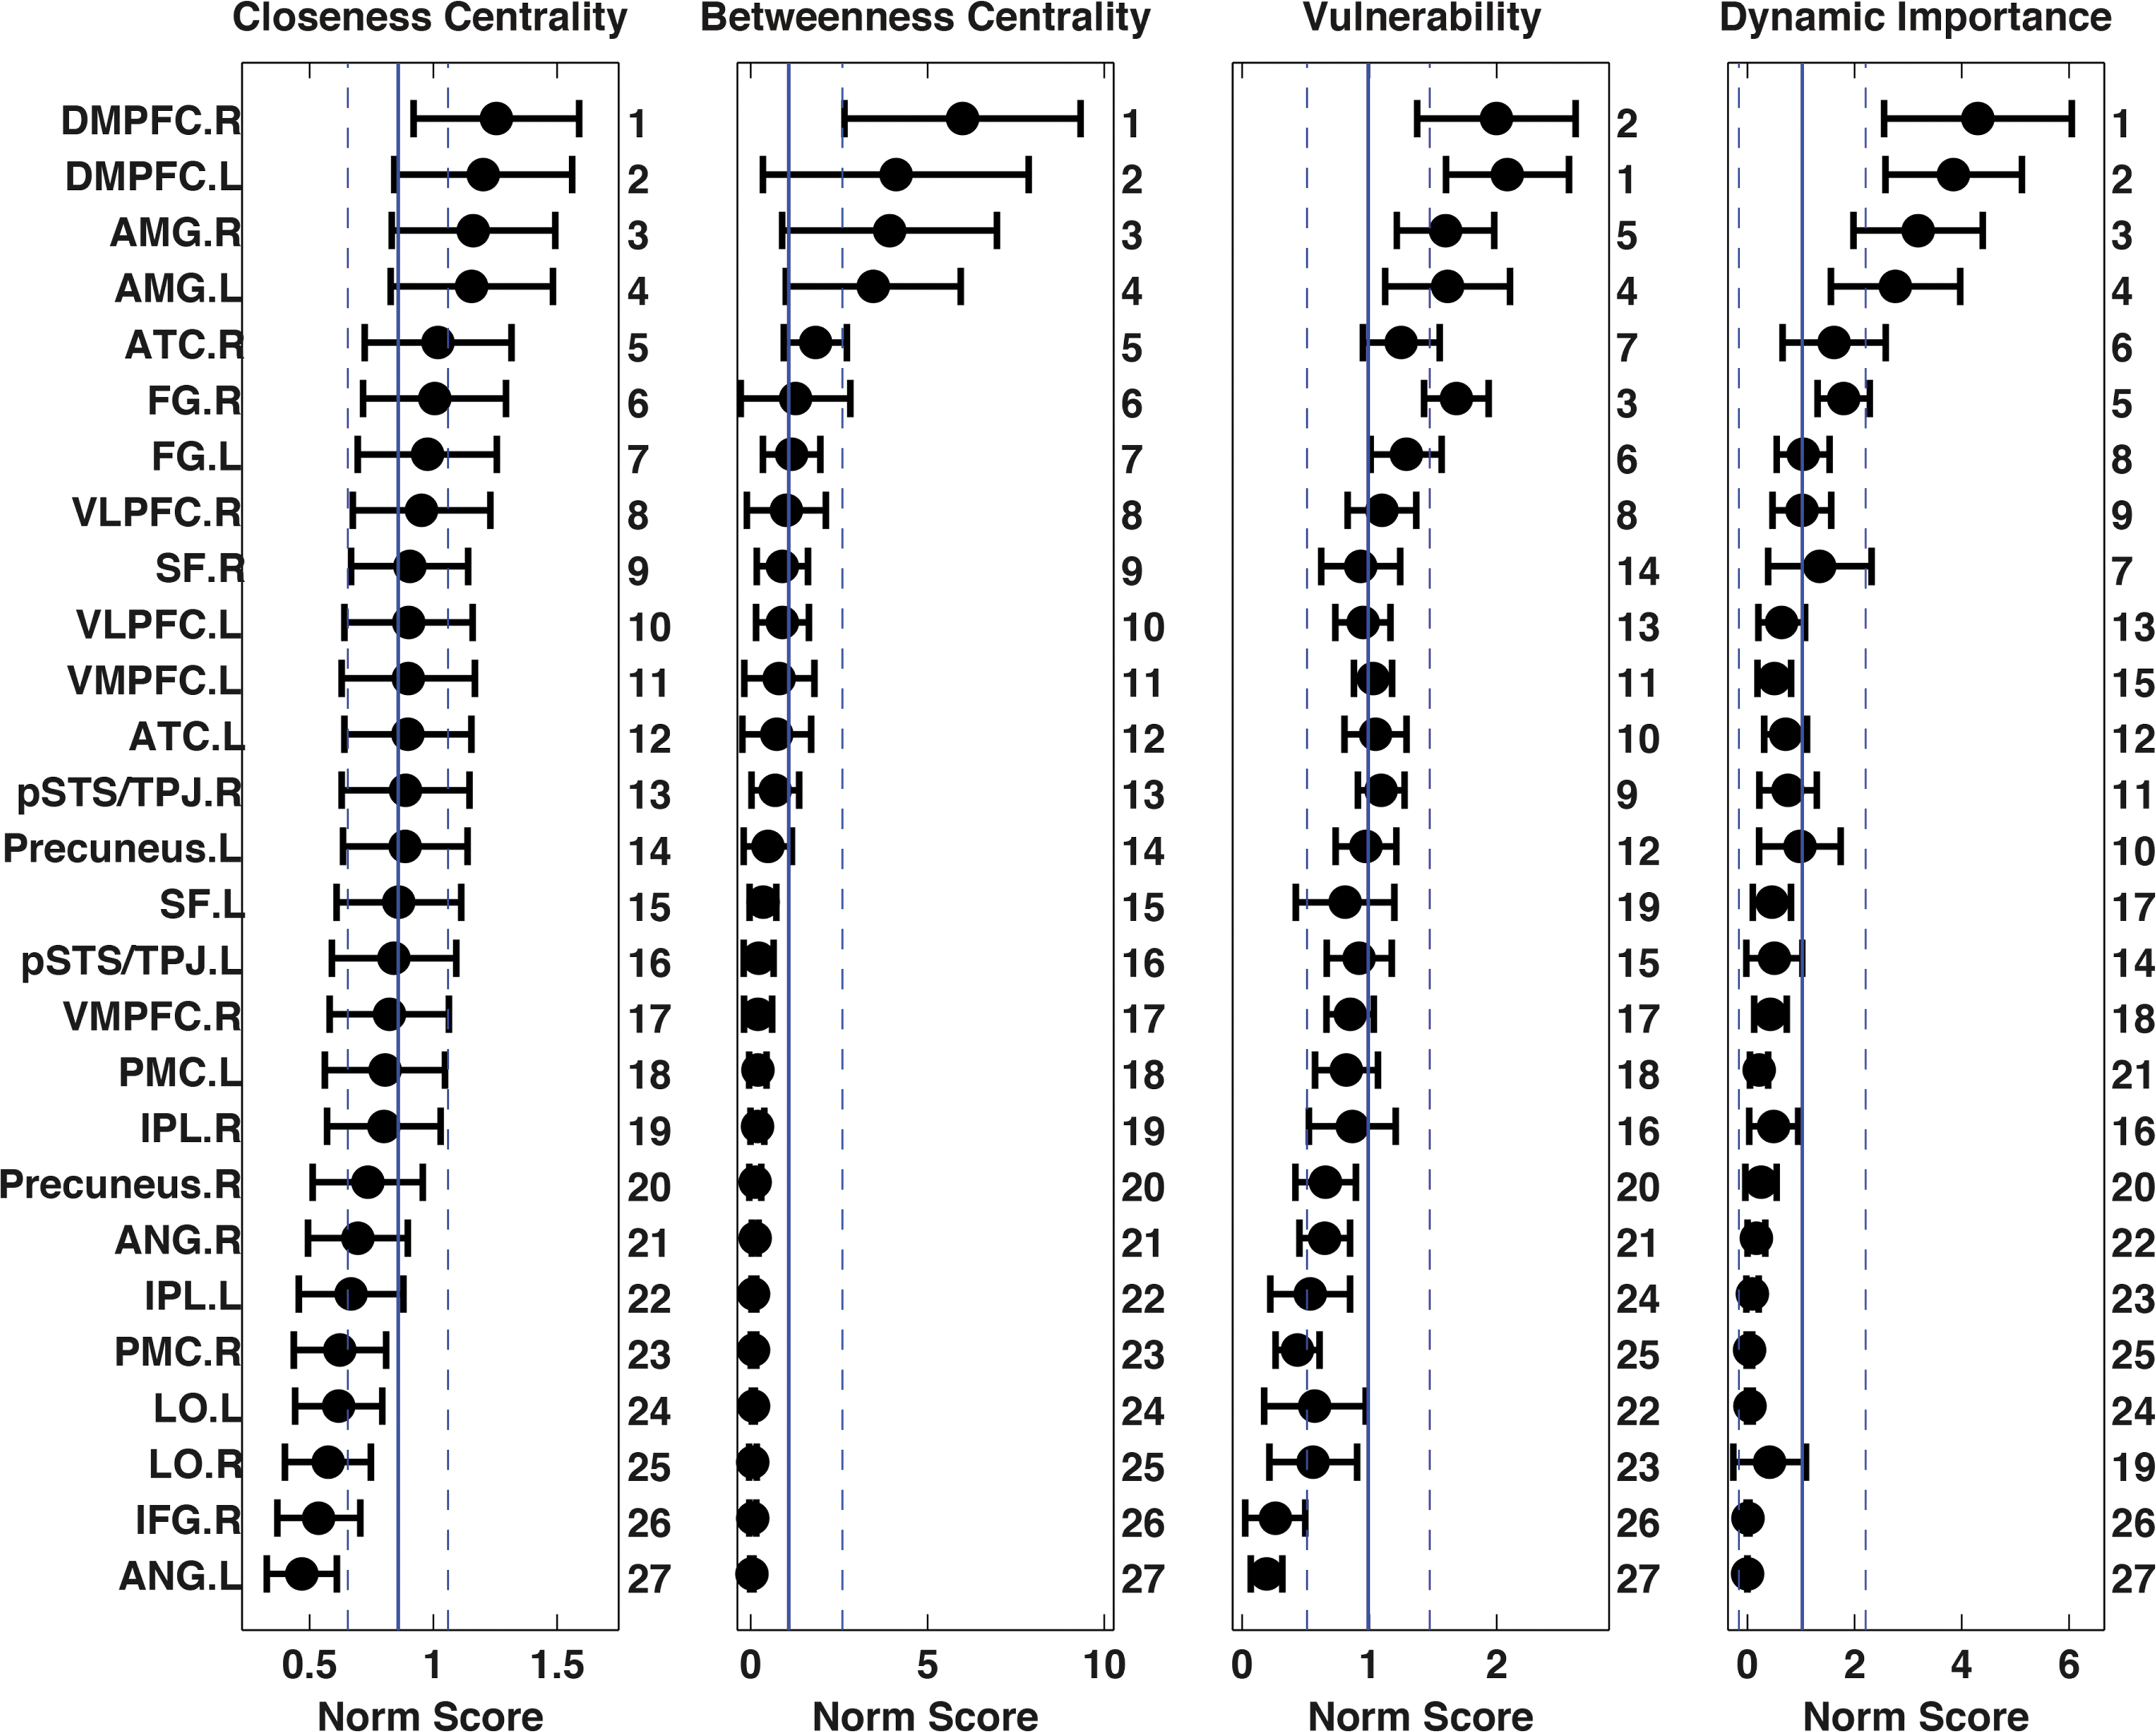
Quantifying network importance of nodes in the social brain. Normalized nodal closeness centrality, betweenness centrality, vulnerability, and dynamic importance of each social brain region were calculated and summed across network densities ranging from 10% to 50% (avoiding possible biases introduced by arbitrary choice of a single network density). Results were normalized by the mean of 100 matched random networks. Plots show mean and standard deviation (error bars) across all subjects. Numeric labels on the right of each plot show the brain region's rank, for each graph-theoretic metric, based on group mean values. The solid vertical line and dashed vertical lines are the mean and standard deviation of each metric across all social brain regions.
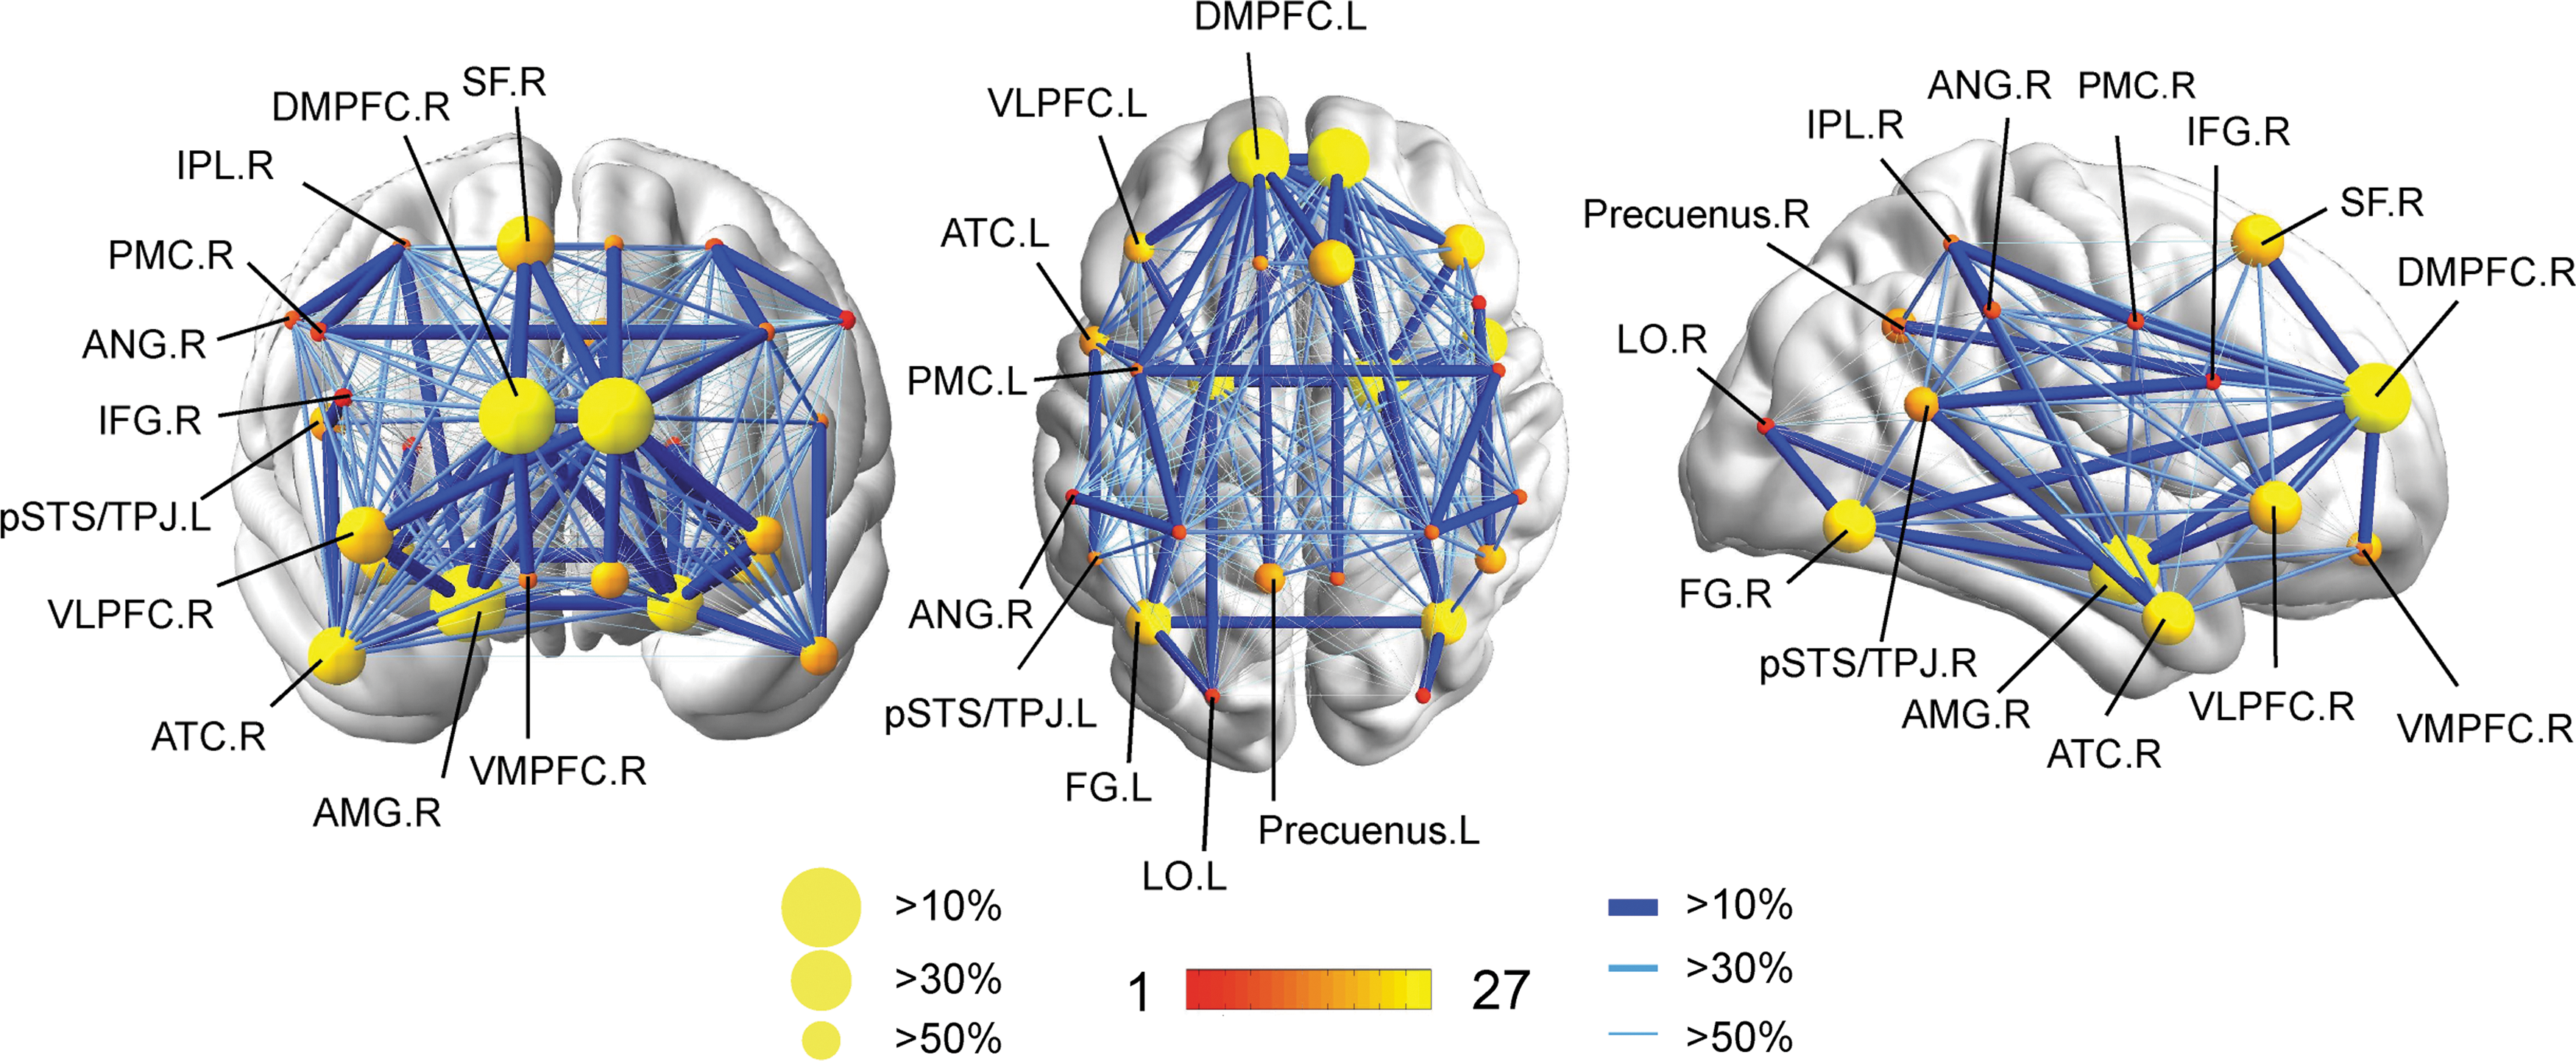
The most central nodes and connections of the social brain network. After the four centrality measures (closeness centrality, betweenness centrality, vulnerability, and dynamic importance) were calculated and ranked for each node, a hub was defined as a node with at least three of four centrality measures ranked at the highest percentile; again, to avoid arbitrary selection of a single percentile threshold, “highest” was systematically varied from 3% (with only one highest-ranking node passing the threshold) to 100% (with all nodes passing the threshold). After identifying hubs in this manner across all percentile thresholds, the frequency of hub occurrence was counted and ranked. Nodes that passed the threshold for inclusion as a high-ranking hub more frequently are plotted with larger spheres and brighter yellow color. The most frequently identified putative hubs are bilateral DMPFC and AMG, suggesting the critical roles of these nodes in the structural social brain network. The most central connections in the social brain network were identified using edge betweenness centrality; their relative centrality is plotted proportionally to the width of each connection line in the figure.
The modular structure of the social brain network
Efficient information processing in brain networks benefits from locally specialized processing within modules in which nodes are more densely interconnected with one another. Because of this, it is interesting to examine the organization of these modular clusters compared to modules identified by other techniques (Adolphs, 2009; Bickart et al., 2014; Kennedy and Adolphs, 2012). Our results show that the structural social brain network can be hierarchically divided into two, three, or four clusters, depending on the how internal nonlinks in modules are penalized as controlled by parameter γ (Fig. 4; Reichardt and Bornholdt, 2006). In the two-module case (Fig. 4A, γ < 1), two modules are largely located in the two hemispheres, suggesting that social brain regions in the same hemisphere are more densely interconnected. For the case of natural parcellation (Fig. 4B, γ = 1), the social brain network forms two lateral clusters with the main nodes including AMG, anterior temporal cortex (ATC), ventrolateral prefrontal cortex (VLPFC), angular gyrus (ANG), FG, and posterior superior temporal sulcus (pSTS)/temporoparietal junction (TPJ; red and green) and a medial cluster including bilateral ventromedial prefrontal cortex (VMPFC), DMPFC, SF, and precuneus (yellow). These lateral clusters closely resemble the AMG network proposed elsewhere in the literature (Adolphs, 2009; Kennedy and Adolphs, 2012), whereas the medial cluster is reminiscent of the medial components of the mentalizing network (Adolphs, 2009; Kennedy and Adolphs, 2012). In the four-cluster case (Fig. 4C, γ > 1), the bilateral IPL, PMC, and ANG (blue) form an independent cluster spanning the two hemispheres, resembling the mirror neuron system. Although the comparison of overlap between our classification results and those in literature and meta-analyses is qualitative, we demonstrated that the identified modules of the social brain network, as classified here by inter-regional structural connectivity via data-driven analyses, may reveal intrinsic organizations that resemble those proposed previously using functional neuroimaging methods (Kennedy and Adolphs, 2012). To statistically test the evidence for whether or not the social brain network demonstrates modularity under varying resolutions, we generated 50,000 random networks, keeping the degree distribution of nodes identical in each random network (Maslov and Sneppen, 2002). The modularity of the observed social brain network was then compared with the modularity observed in each of the random networks, with the null hypothesis stating that there would be no observed difference in the modularity between the observed social brain network and the random networks. Results clearly demonstrate that the modularity of the actual network (Fig. 4 insets, red vertical line) is significantly greater than that of the random networks (Fig. 4 insets, blue histogram) under all three hierarchical parcellation resolutions, confirming intrinsic modularity in the organization of the social brain network. To ensure that our findings regarding the modularity of social brain networks are replicable, we re-ran the analyses on 15 randomly selected participants from an independent cohort and the layout of modules in the social brain network was found to be highly similar (Supplementary Fig. S3).
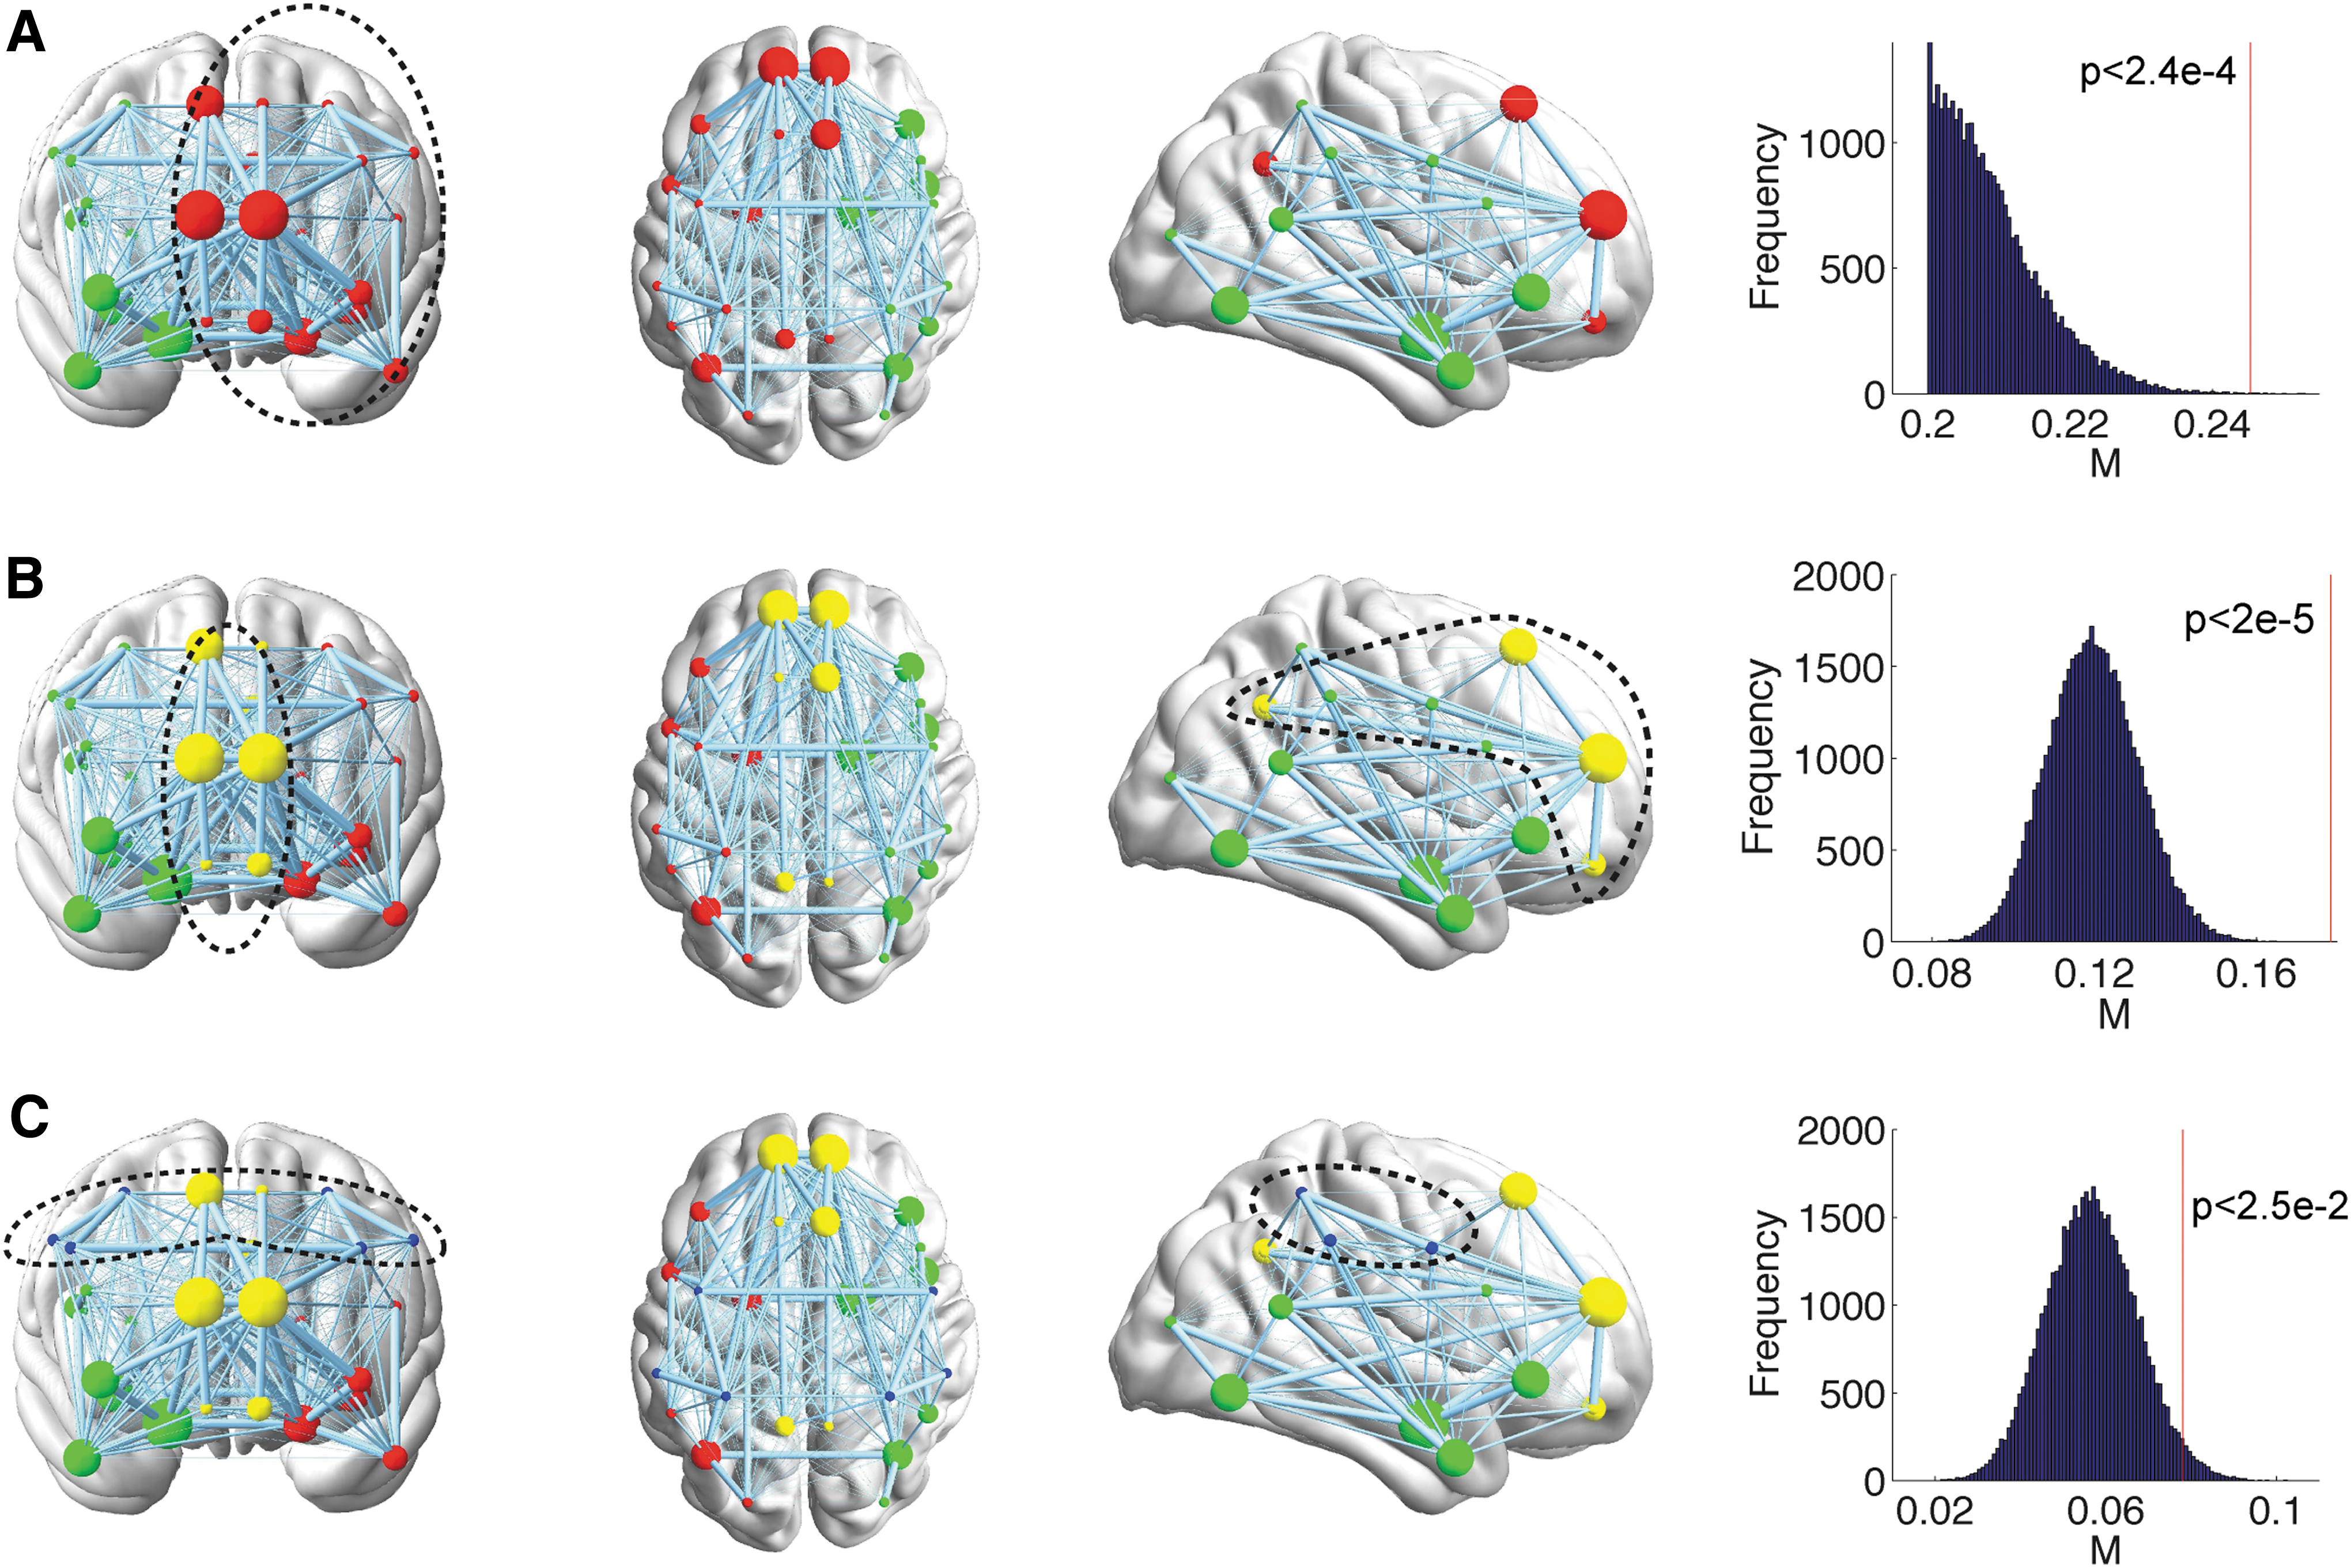
The hierarchical parcellation and modularity of the social brain network. Depending on how the internal nonlinks are penalized as controlled by γ, the social brain network can be divided into hierarchical modules (Newman, 2006; Reichardt and Bornholdt, 2006). In the two-cluster case (
Examining the validity of tractography-derived pathways in the social brain
Although diffusion tractography has provided researchers with a remarkable tool for measuring in vivo connectivity, technological challenges with the method have at times resulted in findings that are at odds with neuroanatomical studies using invasive techniques (Donahue et al., 2016; Li et al., 2012). Tractography-derived pathways measuring connectivity in the social brain may provide a critical tool for understanding the social brain network, but these pathways first need to be closely examined and compared with findings obtained from other techniques. Here, we examined pathways related to AMG, as the region is considered an important node for social processing and its related pathways are usually nondominant. The most probable pathways between the AMG-FG pair and the AMG-VMPFC pair are plotted in Figure 5, in which three of the four connections are ranked among the top 10% with strongest average connectivity strength across participants. Consistent with the prior literature using invasive tracing studies in monkeys (Lehman et al., 2011; Petrides and Pandya, 2007), the present methods identified all three possible routes connecting the AMG and VMPFC: the ventromedial route via the ventral amygdalofugal pathway, the ventrolateral route that largely overlaps with the uncinate fasciculus, and a dorsocaudal route via the stria terminalis. Our results also strongly support evidence of connections between FG and AMG, which have been implicated in prior studies using invasive tracers in animals (Aggleton et al., 1980), diffusion tractography (Catani et al., 2003), and functional MRI in humans (Breiter et al., 1996).
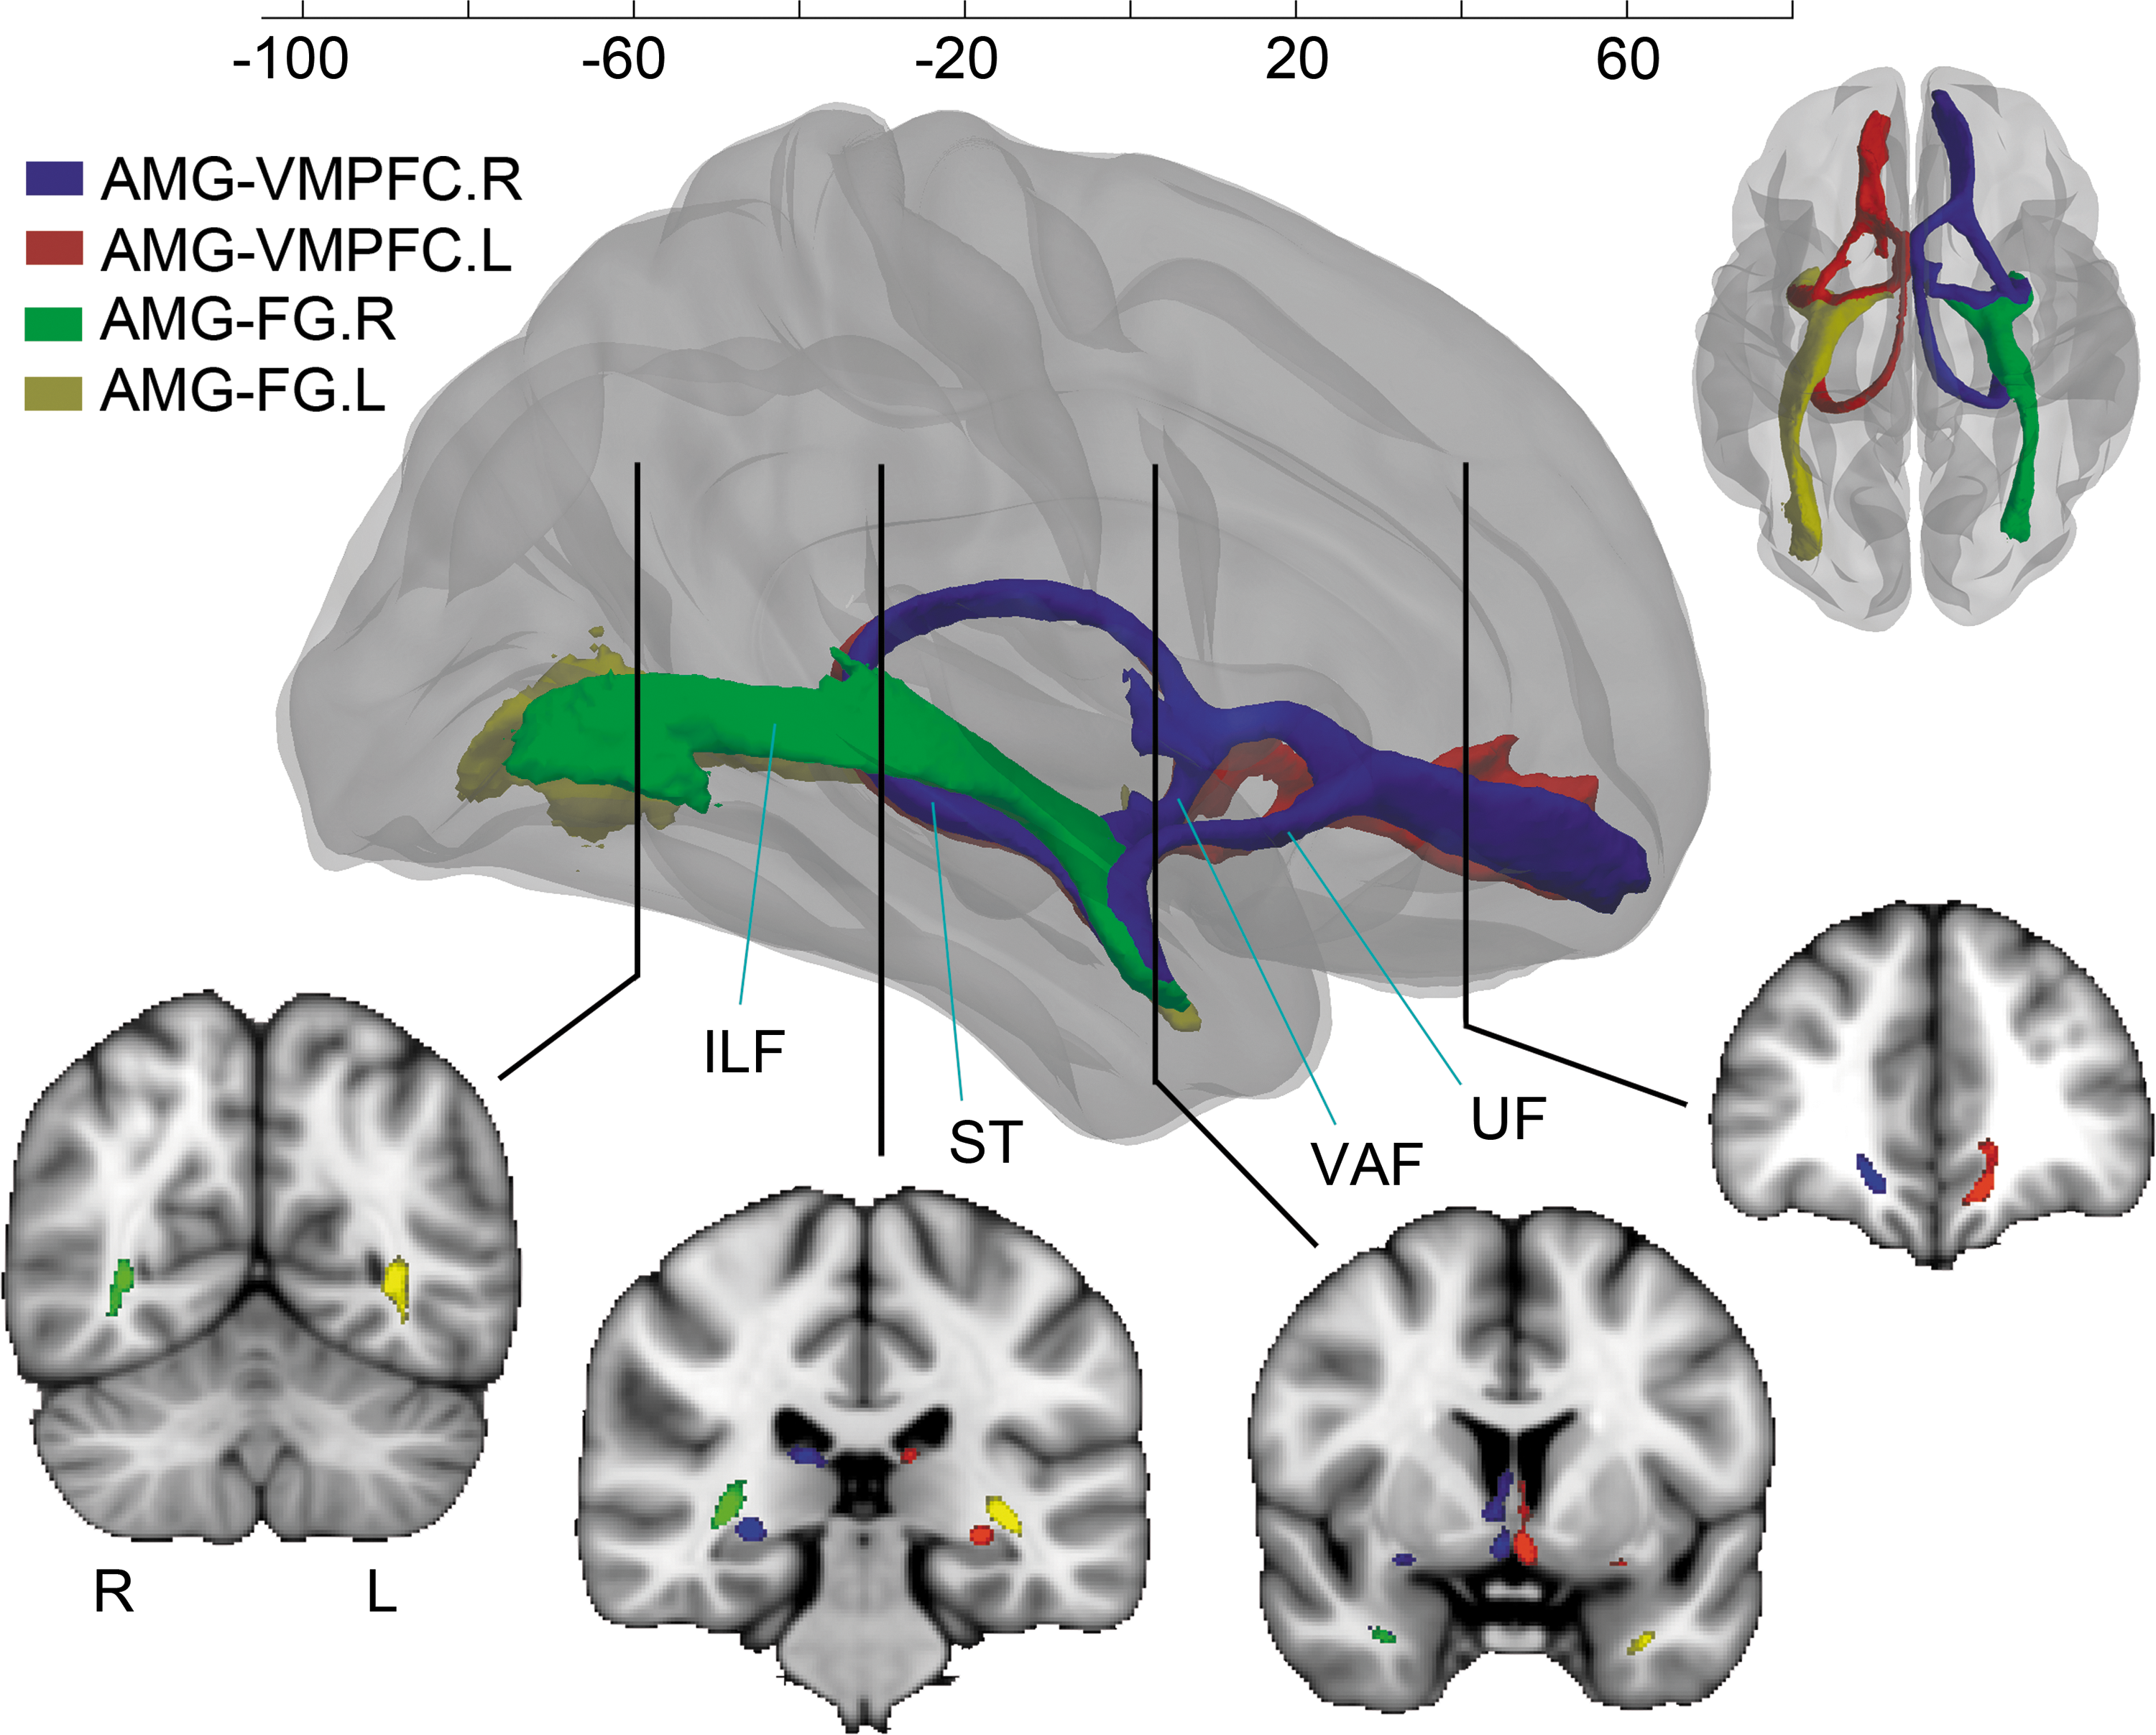
Examining tractography-derived pathways among social brain regions. The connections between AMG-FG pair and the AMG-VMPFC pair were examined and plotted in three-dimensional views. After connections in each subject were derived, they were first normalized by the total number of streamlines connecting the two ROIs to obtain a probability map for each individual pathway. Then, the probability map was transformed to MNI152 space and thresholded at 0.5%. Brain voxels in each subject that survived the threshold (0.5%) were given a weight value of 1, indicating the existence of the pathway in these voxels. The results from all subjects were then averaged to obtain the probability map of tracts for the entire population (ranging from 0 to 1). To visualize the probability map of the tract in each dimension, only voxels where the majority (>60%) of subjects demonstrated the existence of the pathway were plotted. For AMG-VMPFC connections, three probable routes are shown: the ventromedial pathway via the VAF, the ventrolateral pathway via the UF, and the dorsocaudal pathway via the ST. The AMG and FG were connected via the ST and the ILF. ILF, inferior longitudinal fasciculus; ST, stria terminalias; UF, uncinate fasciculus; VAF, ventral amygdalofugal pathway.
Discussion
DMPFC and AMG serve as critical hubs in the social brain network
The DMPFC ROI in our connectivity analysis mainly encompasses the anterior rostral medial prefrontal cortex (Brodmann areas 32 and 9). Animal studies show that this region is highly connected with neighboring prefrontal cortices (Barbas et al., 1999; Carmichael and Price, 1996). More distal afferents come from dorsolateral prefrontal cortex, TPJ, the anterior superior temporal sulcus (Barbas et al., 1999), temporal pole, posterior cingulate, AMG, and orbital part of the PFC (Amaral and Price, 1984), many of which are also commonly thought to be involved in social processing (Kennedy and Adolphs, 2012). Handling multiple neural inputs from other social brain areas may contribute to the DMPFCs functional role in integrating social information for abstract meta-representations, such as trait inferences about unfamiliar others, distinguishing and decoding others' perspectives from one's own, and mentalizing (Amodio and Frith, 2006; Van Overwalle and Baetens, 2009). In our analyses, we found bilateral DMPFC to be ranked highly in all four graph theoretic metrics (Figs. 2 and 3), reiterating its criticality in the structural topology of the social brain network. Moreover, DMPFC is not homogenously connected to other nodes in the network: when the social brain network is parcellated according to interconnections of nodes at varying resolutions, bilateral DMPFC forms a module along the midline of the brain (Fig. 4B, C), together with the bilateral SF, VMPFC, and precuneus. This module resembles the medial components of the mentalizing network (Greicius et al., 2004; Kennedy and Adolphs, 2012). Our findings demonstrate the criticality of connectivity between DMPFC and other brain regions involved in social behavior and may also assist in guiding specific hypotheses about typical and atypical social behaviors that arise due to progressive reorganization of the connectivity patterns associated with adaptations or disruptions thereof.
Similarly, the current results underscore the prominent role of the AMG in the structural social brain network, with important implications for social perception and cognition. Anatomical and physiological studies performed in the past half-century have demonstrated that the functions of the AMG include the following: (1) aiding in the attribution of reward value or relative salience of stimuli by integrating somatosensory, visual, auditory, and visceral inputs from visceral, olfactory, and sensory cortices (Gottfried et al., 2003; McDonald, 1998; Murray, 2007); (2) regulating emotional behavior and mood via connections to the hypothalamus, brainstem, rostral insular, rostral temporal, and orbital and medial prefrontal cortices (LeDoux, 1993; Murray, 2007); and (3) modulating attention via connections to the basal forebrain and via feedback from sensory cortices (Gallagher and Holland, 1994; McDonald, 1998). The AMG has connectivity with cortical areas associated with social information processing and has long been given a central role in major theories of social perception and cognition (Bachevalier, 1994; Schultz, 2005). In the present study, the centrality measures of bilateral AMG were frequently ranked highly among all social brain regions (Fig. 2). It is also interesting to note that atypical or impaired AMG function has been hypothesized to play a critical role in autism spectrum disorder (ASD), a neurodevelopmental disorder characterized by deficits in social interaction and communication (Bachevalier, 1994; Baron-Cohen et al., 2000; Schultz, 2005). Given the high nodal importance of the AMG in the typical structural social brain network—as identified in our results—it seems likely that atypical functioning of the AMG, or atypical integration of the AMG within the larger social brain network, especially early in life, could have a significant negative impact on the functioning of the social brain. As others have noted, atypical AMG function could be cause or consequence (or both) of social disability observed in ASD (Baron-Cohen et al., 2000; Schultz, 2005).
The modular structure of the social brain network
Many biological and physical networks, including structural and functional brain networks, are found to divide naturally into subcomponents or modules (Newman, 2006; Reichardt and Bornholdt, 2006). Detection and characterization of such modularity in brain networks is of significant practical importance for studying behaviors, as these efforts may provide evidence for a modular view of the network's dynamics, with different clusters of nodes performing specialized brain functions with varying degrees of independence (Van Overwalle and Baetens, 2009). A number of functional neuroimaging studies on social perception and cognition seem to support this modular view of social processing (Kennedy and Adolphs, 2012; Van Overwalle, 2009; Van Overwalle and Baetens, 2009). A few examples include the premotor and inferior parietal cortex circuit for imitation learning (Rizzolatti and Craighero, 2004) and the network consisting of the posterior cingulate/precuneus, medial prefrontal cortex, anterior temporal cortex, and TPJ/posterior superior temporal sulcus for mentalizing (Fair et al., 2008; Fletcher et al., 1995).
However, to the best of our knowledge, no prior study has characterized the structural social brain network as a whole or tested its modular organization and compared the (dis)similarities with results derived with other techniques. Based on the average connectivity strength among social brain regions, we iteratively classified nodes in the network into nonoverlapping clusters and derived stable consensus partitions (Fig. 4). Comparing these with subnetworks of the social brain divided by other techniques, we observed clusters that have qualitative correspondence with the AMG network, the mentalizing network, and the mirror neuron network (Kennedy and Adolphs, 2012; Rizzolatti and Craighero, 2004; Fig. 4).
This consistency between our data-driven analyses of the structural social brain network and analyses based on functional studies validates the present methodological approach and supports the notion of continuity between brain structure and function (Honey et al., 2009): in the domain of social behavior, functional specializations (probed elsewhere in the literature using task-based functional MRI) appear to be facilitated by underlying structural connectivity observed in the current results. More interestingly, we found that measures of modularity, a statistic quantifying the degree to which networks may be divided into clearly delineated subgroups, are consistently higher in the social brain network than those from degree-matched random networks, suggesting the unique optimization of structural subcomponents of the social brain network in typical adults. In turn, the existence of such subcomponents suggests that modules may play important roles in typical and pathological social behavior.
Several methodological considerations in the present analyses are worth noting. First, as there is no gold standard for defining brain regions that play a role in social behavior, the ROIs included in the current analyses necessarily represent a selective list, with some regions that have been implicated in other studies not included in the current study (e.g., insular cortex; Adolphs, 2009; Kennedy and Adolphs, 2012). Furthermore, the reverse inference technique enabled by the NeuroSynth meta-analysis algorithm excludes brain ROIs that may participate in domain-general cognitive tasks but that may not be specific to a psychological state of interest (e.g., anterior cingulate; Yarkoni et al., 2011). Given the necessary tradeoffs in selecting or not selecting certain regions, the present study offers an approach that can be repeated and extended in studies of the social brain, and as such, hopefully provides a framework for future studies to investigate the effects of these and other theoretical experimental decisions. Additionally, we only analyzed networks comprising brain areas that are frequently associated with social behaviors for two reasons. First, incorporating identified social brain areas into different existing brain parcellation schemes will lead to different findings, as graph theoretic metrics are known to be sensitive to parcellation schemes (Bassett et al., 2011). Second, as most brain parcellations were delineated based on anatomical or histological evidence (i.e., AAL), merging our brain areas identified based on the meta-analysis of brain functional activations with these parcellation schemes needs to be justified.
`Several useful methodological features of the current framework are as follows. First, diffusion MRI data with high spatial, angular, and diffusion contrasts to minimize the impact of data quality on tractography results were used (Glasser et al., 2013; Li et al., 2013). Surface-based diffusion tractography that enables the initiation and termination of streamlines at exact boundaries of white matter/gray matter and that prevents fibers leaking across gyri via CSF further improves accuracy. For the measure of connectivity strength, we used thresholded tract volume as the measure of connectivity, specifically because it has previously been shown to be less sensitive to the intrinsic distance problem in diffusion tractography (Li et al., 2012); although we feel that this is an important methodological advance, the measure is strongly correlated with the more commonly used connectivity strength (Supplementary Fig. S4). Finally, given that the true network density of the social brain network is unknown, we adopted a comprehensive approach to examining graph theoretic metrics across a wide range of possible network densities (10–50%), avoiding arbitrary selection of thresholds. We believe that each of these methodological considerations will increase the accuracy and specificity of our findings on the structural topology of the social brain network.
It is interesting to see that the TPJ, a functional area that has been proposed to support both social functions and nonspecific cognitive processes such as memory and attention (Carter and Huettel, 2013), was not identified as a hub in our study using diffusion tractography. Although several resting-state functional MRI studies have identified the TPJ as a hub in whole-brain functional networks (Buckner et al., 2009; Liao et al., 2013), no network study using diffusion MRI data, including our own (Li et al., 2012), has reported similar levels of topological importance for the TPJ (Gong et al., 2009; Hagmann et al., 2008; Iturria-Medina et al., 2008; Shu et al., 2009). Therefore, our negative findings on TPJ being a hub region in structural social brain networks could be due to different sensitivity between diffusion and resting-state functional MRI techniques in probing structural and functional connectomes (Honey et al., 2009).
In summary, we mapped the anatomical connections among social brain areas using high-quality diffusion MRI data, quantifying network topology and nodal criticality using graph theory. The social brain network was found to strongly adhere to small-world network principles, with high functional integration and segregation. We also identified bilateral DMPFC and AMG as putative hubs of the social brain network, given their consistently high ranks in graph theoretic measures. Modularity analyses offered strong evidence of modular substructures within the social brain, and the identified structural modules bear strong resemblance to subnetworks identified using other techniques. The present study provides normative benchmarks for nodal importance within the social brain network as well as a first glimpse of the organizational architecture of the structural social brain. We hope that this will provide new avenues by which to study the interplay of social brain structure, function, and behavior, and their unfolding throughout development.
Footnotes
Author Disclosure Statement
No competing financial interests exist.
References
Supplementary Material
Please find the following supplemental material available below.
For Open Access articles published under a Creative Commons License, all supplemental material carries the same license as the article it is associated with.
For non-Open Access articles published, all supplemental material carries a non-exclusive license, and permission requests for re-use of supplemental material or any part of supplemental material shall be sent directly to the copyright owner as specified in the copyright notice associated with the article.