
Abstract
The posterior cingulate cortex (PCC) is often used as a seed region for probing default-mode network (DMN) connectivity. However, there is evidence for a functional segregation between its dorsal (dPCC) and ventral (vPCC) subregions, which suggests differential involvements of d-/vPCC in regulating cognitive demands. Our paradigm included functional magnetic resonance imaging measures for baseline resting state, affective or cognitive tasks, and post-task resting states. We investigated the effect of task demands on intra-PCC coupling and d-/vPCC network assignment to major intrinsic connectivity networks (ICNs), which was estimated via edge weights of a graph network encompassing DMN, dorsal-attention network, and central-executive network (CEN). Although PCC subregions were functionally coupled during both resting-state conditions and cognitive tasks, they decoupled during affective stimulation. For dPCC, functional connectivity strength (FCS) to CEN was higher than to the other two ICNs; whereas for vPCC, FCS to DMN was the highest. We, hence, defined CEN and DMN as the canonical networks at rest for dPCC and vPCC, respectively. Switching from rest to affective stimulation, however, induced the strongest effects to relative network assignments between non-canonical networks of dPCC and vPCC. Although vPCC showed a durable functional connectivity (FC) to DMN, dPCC played a crucial role during switches of between-network FC depending on cognitive versus affective task requirements. Our results underline that it is crucial for future seed-based FC studies to consider these two subregions separately in terms of seed location and discussion of findings. Finally, our findings highlight the functional importance of connectivity changes toward regions outside the canonical networks.
Introduction
Posterior cingulate cortex and intrinsic connectivity networks
T
ICNs are sets of brain regions that show temporally synchronized activation during resting state and tasks, which enable flexible adaptation of the brain's response to fast-changing environmental stimuli and demands. The PCC is traditionally considered to be part of the default-mode network (DMN), together with the ventromedial prefrontal cortex, lateral inferior parietal lobes, and medial temporal structures (Raichle et al., 2001). DMN regions exhibit high temporal coherence in activity patterns during absence of an explicit task or during internal self-referential processes such as autobiographical memory or planning for the future.
Unlike the DMN, the dorsal-attention network (DAN) and the central-executive network (CEN) are characterized by higher activations during goal-directed tasks (Fox et al., 2005). The DAN consists of frontal eye fields, superior occipital gyrus, middle temporal motion complex, inferior precentral sulcus, superior parietal lobule, and dorsolateral prefrontal cortex. These brain areas show functional coupling during externally directed cognition and are involved in top-down attentional control. The CEN includes lateral prefrontal cortex, precuneus, the anterior extent of the inferior parietal lobule, medial superior prefrontal cortex, and the anterior insula. It is engaged in executive control and higher cognition via flexible coupling with either the DMN or DAN.
PCC and inter-ICN connectivity changes as a function of task demand
These network definitions are similar across different conceptualizations/parcellation schemes, but they differ to some extent (e.g., Fox et al., 2005 conceptualized both DAN and CEN as task-positive networks). It was found that the three major ICNs (DMN, DAN, and CEN) are highly reproducible across datasets and individuals (Biswal et al., 2010). Thus, it has been assumed that the network assignment of different ICNs remains static during resting state and different task demands. However, Vatansever et al. (2015) recently investigated ICN network assignment both at resting state and during n-back working memory task at different loads (stepwise from 0-back to 3-back), and they demonstrated flexible crosstalk between different ICNs as cognitive task demand increased from rest to 3-back condition. Together with other recent studies probing flexible inter-ICN connectivities (Fornito et al., 2012; Gao and Lin, 2012; Spreng et al., 2010), it has been suggested that functional integration among regions of DMN, CEN, and DAN increases during cognitively demanding states (Dixon et al., 2017, 2018; Liang et al., 2016), which has also been associated with increased cognitive flexibility (Douw et al., 2016).
As a core region of the DMN, the PCC exhibits strong functional coherence with other DMN regions (Andrews-Hanna et al., 2010). Meanwhile the PCC also exhibits highly variable connectivity with regions in other ICNs in response to dynamic shifts in cognitive task demands (Barnes et al., 2009; Grigg and Grady, 2010; Krieger-Redwood et al., 2016). For this reason, it has been proposed that the PCC acts as a functional hub during shifts in cognitive demand. The PCC facilitates transfer and integration of information from other DMN regions, and it coordinates crosstalk between DMN, DAN, and CEN (Andrews-Hanna et al., 2010, 2014; Leech and Sharp, 2014). However, the underlying mechanisms of the interplay between PCC and major ICNs during shifts in environmental demands are still unclear.
Compared with an increasing number of studies probing the PCC connectivity pattern during cognitive challenges (mainly testing working memory), relatively few studies investigated the effects of affective challenges on the interplay between PCC and major ICNs. Activity in the PCC is also modulated by affective challenge, such as viewing sad movie scenes (Schlochtermeier et al., 2017). Connectivity changes in the DMN and CEN have been observed during passive viewing of affective movies (Hyett et al., 2015) and after listening to auditory stimuli with affective content (Borchardt et al., 2015). However, the role of PCC in inter-ICN crosstalk during affective challenge remains less studied, and it is unclear whether cognitive and affective tasks induce differential functional connectivity (FC) changes between PCC and major ICNs.
PCC heterogeneity and the ICNs
Further, accumulating evidence from human and monkey studies have suggested that PCC is a heterogeneous brain structure. The PCC can be broadly divided into ventral and dorsal subregions (Leech and Sharp, 2014), which are characterized by distinct cytoarchitectonics (Palomero-Gallagher et al., 2009; Vogt and Laureys, 2005; Vogt et al., 2006) and FC patterns (Bzdok et al., 2015; Leech et al., 2012; Lord et al., 2017; Margulies et al., 2009). They also differ in terms of (de)activation level and co-activation pattern during cognitive tasks (Leech et al., 2011; Liang et al., 2016). For this reason, it is crucial to understand the interaction between these PCC subregions and the major ICNs during different cognitive and affective states.
The series of work by Leech et al. (Leech and Sharp 2014; Leech et al., 2011, 2012) has suggested that dorsal (dPCC) and ventral PCC (vPCC) show distinct patterns of activity modulation during cognitively demanding tasks. The vPCC shows increased coupling with the DMN at low task demands and is involved in supporting internally directed thoughts. In contrast, task-dependent increases in connectivity between the dPCC and the CEN support the role of the dPCC in modulating the dynamic interaction between DMN and CEN controlling the efficient allocation of attention (Leech et al., 2011). It has been suggested that the dPCC interacts with CEN and DAN to regulate the balance between internally and externally directed cognition (Leech et al., 2012). Considering this evidence, it has been suggested that the dPCC links networks that are functionally distinct but require coordinated changes in activity to allow for efficient cognitive functioning (Leech and Sharp, 2014). Moreover, there is strong anatomical connectivity between the vPCC and dPCC (Parvizi et al., 2006), despite their functional segregation. Given that the two subdivisions exhibit dissociable connectivity patterns and play differential roles in coordinating inter-ICN crosstalk during shifts in environmental demand, it is reasonable to expect that intra-PCC coupling will also change as a function of environmental demand.
Aim
This study aimed at investigating the differential FC pattern of vPCC and dPCC with the DMN, CEN, and DAN during resting state, affective and cognitive tasks in the same subjects. We designed a paradigm to study rest-task interactions combining cognitive tasks and affective challenge at two levels of difficulty/intensity with interleaved resting periods.
Methods
Subjects
Twenty-two right-handed, healthy female subjects (aged 20–49 years, mean age 28.1 ± 6.5) completed the study. Subjects were recruited via local campus flyers and mailing lists. In addition to standard safety exclusion criteria for magnetic resonance imaging, subjects were screened for absence of any neurological or psychiatric disorders by using the short version of the Structured Clinical Interview for DSM-IV (Wittchen et al., 1997). All subjects gave written informed consent and were reimbursed for participation. Study protocols were in accordance with the Declaration of Helsinki and have been approved by the institutional review board of the Charité Berlin, Germany.
Experimental paradigm
This article is part of a project probing dynamic FC interplays between ICNs during rest and tasks. The experimental paradigm has been described in detail in Bochardt et al. (2018). In the current work, we focused on the task-general effect on couplings between vPCC and dPCC and their interplays with major ICNs, whereas the valence-specific effect of affective stimulation on post-task resting states has been reported in Bochardt et al. (2018).
Functional magnetic resonance imaging (fMRI) scans of a rest-task-rest design were performed on two consecutive days, each including either a cognitive or an affective task with two different loads (Fig. 1). As a general procedure on each day, the subjects first underwent a 10-min resting-state fMRI (rs-fMRI) scan, which served as a baseline. They then completed the task with one load, followed by another 15-min rs-fMRI scan. Finally, they completed the task with the other load, followed by a last 15-min rs-fMRI scan. The sequence of the two task loads was counterbalanced across subjects. During all rs-fMRI scans, subjects were instructed to keep their eyes closed, lie still, remain awake, and let their mind wander without explicitly engaging in any goal-directed tasks.

Schematic illustration of the experimental paradigms.
On the day of the cognitive task, subjects completed digital n-back working memory tasks (Gartner et al., 2014) with two different loads (0-back and 2-back), each lasting 5 min (for details see Borchardt et al., 2017). Subjects were asked to respond as quickly and as accurately as possible by pressing a button using the right index finger. Each n-back task was followed by a 15-min resting-state scan.
At the affective day, subjects were presented with two movie clips that had two different loads of affective content, each lasting 5 min (for details see Borchardt et al., 2017). The sad movie clip was an excerpt from the film “21 Grams” directed by Alejandro González Iñárritu. The neutral clip was an excerpt from the film “The Son's Room” directed by Nanni Morett. The movies scenes were presented in dubbed German version and had been excerpted with different length and used in previous mood induction studies (Hanich et al., 2014; Shiota and Levenson, 2009). The subjects were instructed to watch the movie clip passively and refer themselves to the main character. Each movie was followed by a 15-min resting-state scan.
The order of the affective and cognitive days was counterbalanced between subjects. During the baseline resting state, the subject's thoughts were directed internally and unconstrained. We assume that during the cognitive task, subjects pay attention to fulfill the task demands, whereas the affective task broadens the subject's thoughts. The resting sessions after a task served to capture changes in intrinsic brain network connectivity patterns induced by the preceding task and we presume that the subject's thoughts are constrained and narrowed due to carry-over effects.
Image acquisition
Functional MRI images were acquired on a Siemens Trio 3T scanner (Siemens, Erlangen, Germany) with a 12-channel radio-frequency head coil, using a T2*-weighted Echo planar imaging sequence (37 axial slices of 3 mm thickness covering the whole brain, TR = 2000 msec, TE = 30 msec, flip angle = 70°, 64 × 64 matrix, field of view = 192 × 192 mm2, in-plane resolution = 3 × 3 mm2). The baseline resting-state session consisted of 300 volumes, the resting-state sessions after task consisted of 450 volumes, and the task sessions consisted of 147 volumes.
T1-weighted anatomical reference images were acquired by using 3D MPRAGE sequence (176 sagittal slices covering the whole brain, 1 × 1 × 1 mm3 isotropic resolution, TR = 1900 msec, TE = 2.52 msec, flip angle 9°, 256 × 256 matrix). Participants were provided with earplugs, and head motion was minimized by using soft pads fitted between head and coil.
Physiological recordings and preprocessing
Electrocardiogram (ECG) was recorded via an electrode placed at the base of the back. The positioning at the base of the back is recommended to maximize the signal to noise of the R-peak in the ECG trace as well as for subject comfort (Mullinger et al., 2013). Respiratory rhythm and volume were monitored by using a pneumatic belt (Respiration Belt MR; Brain Products, Munich) strapped around the upper abdomen. Both ECG and respiratory data were recorded at 5 kHz sampling rate with a low-pass filter at 100 Hz, and they were amplified with an MR-compatible amplifier (BrainAmp ExG MR; Brain Products). ECG data were corrected for gradient artifacts by using average artifact subtraction (Allen et al., 2000) implemented in Vision Analyzer (Brain Products). The respiratory signal was low-pass filtered at 10 Hz to remove MR artifacts.
Image preprocessing
Data were preprocessed by using Matlab 2012b, and the toolboxes SPM12, DPABI_V2.0, and DPARSFA_V4.0 (Yan and Zang, 2010). The first 5 volumes were removed to account for signal equilibrium. To subtract the portion of cardiac pulsations and respiration from the global signal, RETROICOR and RVHRCOR were applied (Glover et al., 2000; Chang et al., 2009; see review in Power et al., 2017). “RETROICOR” refers to the image-based method for retrospective correction of physiological motion effects in fMRI, which is developed by (Glover et al., 2000). "RVHRCOR" refers to the method to deconvolve the effects of respiratory variation and heart rate from resting-state fMRI, which is developed by (Chang et al., 2009). Time-locked cardiac and respiratory artifacts were reduced via RETROICOR (Glover et al., 2000), which performs slice-specific correction by using a second-order Fourier expansion for both cardiac and respiratory regressors. RVHRCOR was applied to reduce low-frequency respiratory volume and heart rate artifacts (Chang and Glover, 2009). Slice-time correction was performed, and data were realigned. The anatomical T1 images were coregistered to match the functional images, segmented, and normalized by using T1 unified segmentation. Nuisance covariates from white matter and cerebrospinal fluid as well as six-rigid body realignment parameters and a first-order polynomial trend were regressed out before bandpass filtering (0.01–0.1 Hz). Regression of the global signal has not been performed, because its omission leads to higher test-retest reliability in graph metrics derived from rs-fMRI (Braun et al., 2012; Guo et al., 2012), which is particularly important for repeated measures in the context of cognitive or affective challenges. Data were scrubbed by using Power's frame-wise displacement (FD) index with 0.5 as threshold (Power et al., 2017). Volumes exceeding this threshold were deleted together with one preceding and two following timepoints, because the blood oxygen-level dependent (BOLD) signal change created by motion is most likely not restricted to one TR. Values of these affected timepoints were interpolated by using the cubic spline method to maintain the number of timepoints. 1 Unsmoothed data were used for timeseries extraction. Two subjects were excluded for the cognitive day due to incomplete data in the rest after task session. Three subjects were excluded for the affective day due to excessive head motion (i.e., they either exceeded maximal head motion by 3.0 mm and 3.0°, or more than 50% of their timeseries were interpolated during scrubbing). As a result, data of 17 subjects (age: 28.4 ± 6.8) were included for analysis of rest baseline across both experimental days.
Data analysis
Spherical seeds with a diameter of 10 mm were placed in the dPCC and vPCC in both hemispheres at the Montreal Neurologic Institute coordinates: right dPCC: [2, −34, 40], left dPCC [−2, −34, 40], right vPCC [2, −58, 28], and left vPCC [−2, −58, 28] [coordinates obtained from Leech and coworkers (2011); see also Fig. 2A]. Timecourses of these four seeds have been extracted. As a measure of FC, these timecourses have been pair-wise correlated by using Pearson correlation and Fisher-Z transformation.
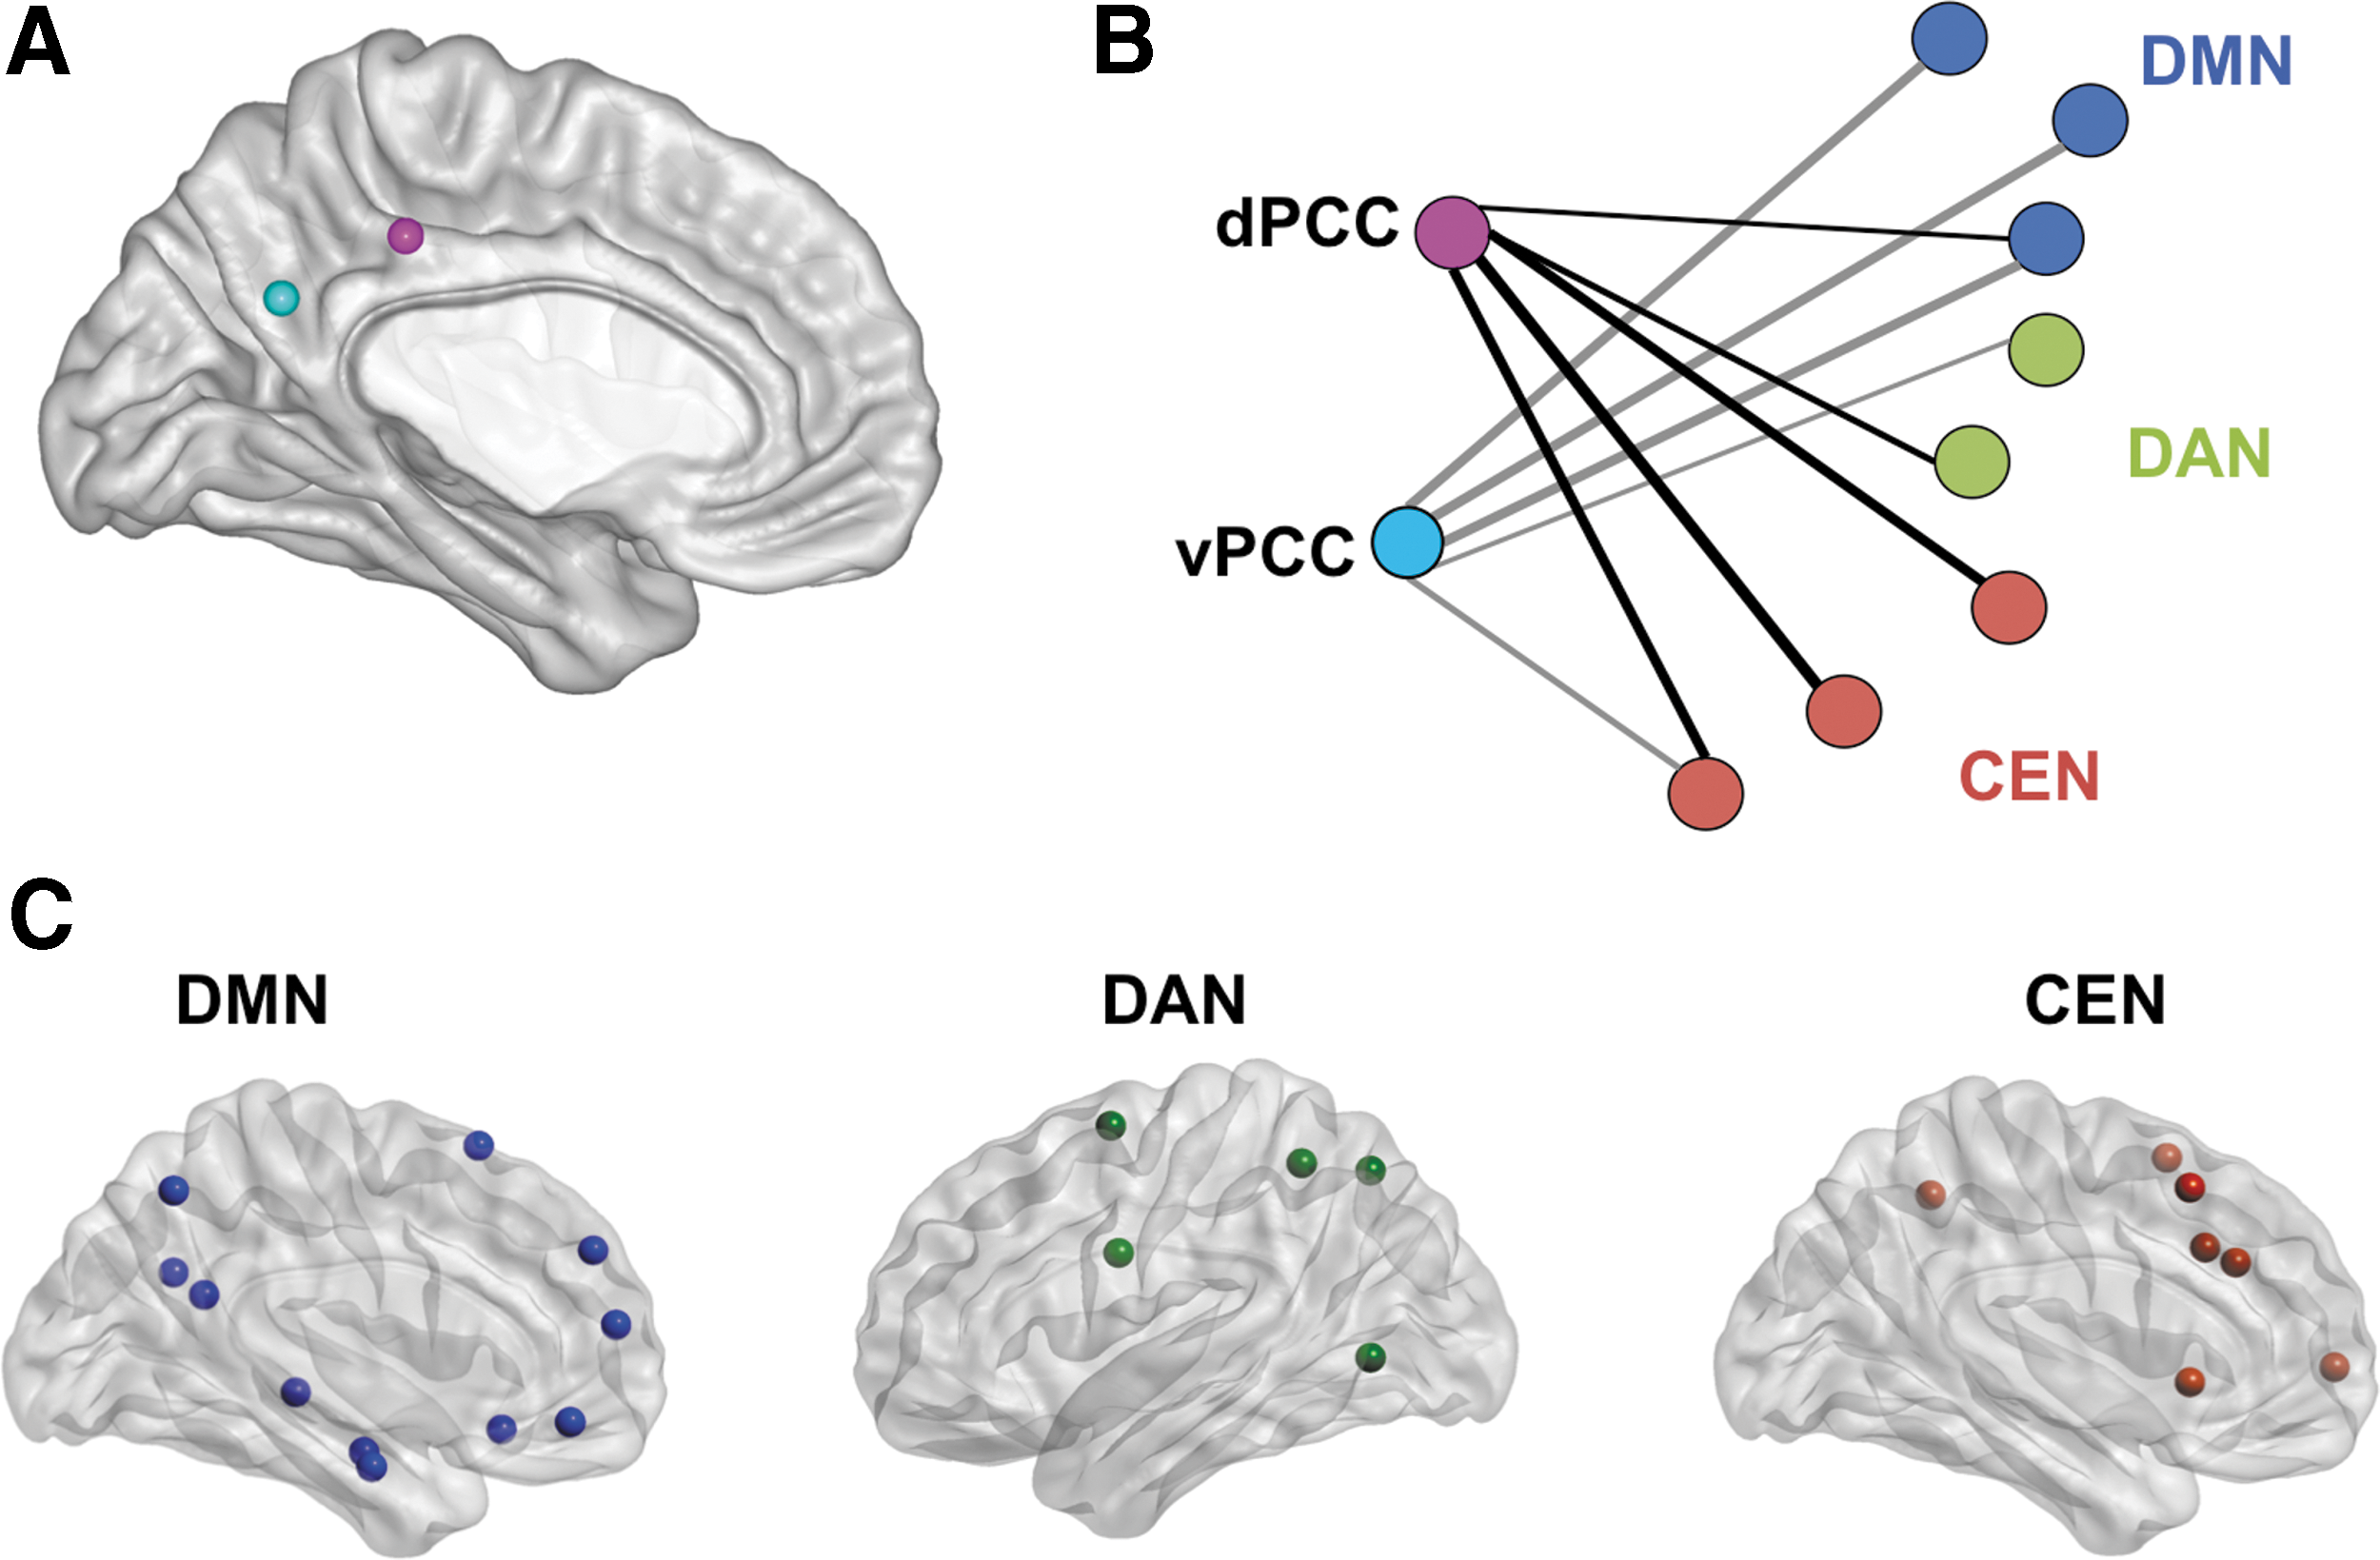
To describe the FC pattern of the PCC subregions in relation to major ICNs in the brain, 42 nodes were placed in the DMN, DAN, and CEN. This parcellation has been developed by Spreng et al. (2013) using datasets from three independent studies that included autobiographical planning, visuospatial planning, and counting tasks with the aim of obtaining a functional parcellation defined by significant and reliable task-based regional activations. Therefore, network maps were derived from statistically significant activation maps for each ICN from a group analysis of each of the three independent studies using multivariate spatiotemporal partial least-squares technique, which identified whole-brain patterns of covariance. Network maps representing the spatial overlap of significant activity within these networks were computed. Each network node comprised a 10 mm diameter sphere centered on the mean peak maxima from the network map. Nodes were further refined to ensure spatial demarcation and to preserve integrity of anatomical boundaries (Spreng et al., 2013). A list of nodes, coordinates, and network affiliation is provided in Appendix Table A1. This parcellation consisted of 17 DMN nodes (11 left, 6 right), 10 DAN nodes (5 left, 5 right), 15 CEN nodes (7 left, 8 right), and 4 PCC nodes (Fig. 2C). The 46 spherical nodes had a diameter of 10 mm each.
To measure connectedness of the PCC subregions to each of these three major networks, a weighted, undirected network consisting of positive edges (Pearson correlation coefficient >0) between these 46 nodes was constructed for all conditions, including baseline and post-task resting states, as well as the cognitive and affective tasks. The BOLD signal during both tasks was analyzed in a similar manner to resting-state scans as in a previous study (Vatansever et al., 2015). The strength of the functional connectivity (FCS) to one of the major networks was calculated by a slightly modified version of the commonly used nodal graph metric strength. For example, the FC strength of the right dPCC to the DMN was calculated by dividing the sum of edges connecting the dPCC to DMN nodes by the number of DMN nodes (refer to Fig. 2B for a graphical representation of this method). Because FC is defined as the positive correlation of the temporal fluctuation of two brain areas and hence graph theoretic analyses of brain networks are commonly done based on positive correlations only, negative correlations were excluded. To analyze changes in relative differences in FCS of a PCC subregion between two ICN, differential FCS (ΔFCS) was calculated by subtracting FCS of one ICN from the other.
Statistical tests
First, we examined the connectivity patterns of vPCC and dPCC to the major ICNs, and we tested whether these are stable across experimental days. Repeated-measure analysis of variance (rmANOVA) was performed on baseline resting-state sessions from both experimental days. Subregion (dPCC and vPCC), network (DMN, CEN, DAN), and day (cognitive and affective) were taken as within-subject factors and calculation was done separately for each hemisphere. Post hoc rmANOVA with the within-subject factor network (DMN, CEN, DAN) and subregion (dPCC and vPCC), as well as respective post hoc paired sample t-tests, were performed separately for each day to assess robustness of effects.
Second, we examined the modulatory effect of environmental demands on intra-PCC coupling via rmANOVA with within-subject factors state (rest at baseline), low load task (neutral movie/0-back), high load task (sad movie/2-back), rest after low load task (rest after neutral movie/rest after 0-back), rest after high load task (rest after sad movie/rest after 2-back), and day (cognitive, affective) separately for each hemisphere. Post hoc rmANOVAs were performed with the within-subject factor state for each day and hemisphere separately. Post hoc paired sample t-tests were used to assess differences between conditions.
Third, we hypothesized that differential connectivity patterns of PCC subregions to the major ICNs differ as a function of environmental demand (baseline rest, task, rest after task). Moreover, we expected that cognitive and affective tasks show distinct modulatory effects on d-/vPCC connectivity patterns. To examine these hypotheses, we performed rmANOVA on FCS from dPCC and vPCC to three major ICNs, using within-subject factors day (cognitive, affective), state (rest at baseline), low load task (neutral movie/0-back), high load task (sad movie/2-back), rest after low load task (rest after neutral movie/rest after 0-back), rest after high load task (rest after sad movie/rest after 2-back), and network (DMN, CEN, DAN). Interaction effects were tested for pair-wise combinations of all three factors, and for the three-way interaction day × state × network.
To further dissect this three-way interaction, rmANOVA was performed on d-/vPCC FCS for affective and cognitive days separately, with state (five levels), network (three levels), and state × network interaction as within-subject factors.
Because we assumed that right and left hemispheres might potentially show differences, they were analyzed separately in all analyses. To contrast main effects of affective stimulation versus cognitive tasks and their respective effects on subsequent resting states, independent of the load of the respective condition, their averages across high and low load were calculated and, thus, statistical tests were calculated between movies/n-back tasks and resting states after movies/tasks.
Generally, calculations were done in SPSS, sphericity tests were done using the Mauchly's test, and Greenhouse-Geisser correction was used when appropriate. Results were reported on a significance level of alpha <0.05, and effect size was indicated as partial eta squared (η2 p). Post hoc parametric comparisons of estimated marginal means with Bonferroni correction were calculated, and results of post hoc tests were reported with Bonferroni-corrected p-value (pB ).
To confirm specificity of dPCC and vPCC connectivity profiles on whole-brain level, one-sample t-tests were performed on seed-based FC maps with both dPCC and vPCC as seed regions.
Results
Canonical network connection of dPCC and vPCC at baseline
First, we examined the FCS from vPCC and dPCC to the major ICNs at baseline. rmANOVA revealed a significant subregion × network interaction effect (right hemisphere: F(2, 32) = 71.28, p < 0.001, η2 p = 0.82; left hemisphere: F(2, 32) = 55.38, p < 0.001, η2 p = 0.78), but the interaction subregion × network × day was not significant.
Post hoc rmANOVA yielded a significant effect of network, reflecting differential connectivity patterns for dPCC and vPCC to the major ICNs for each experimental day (Appendix Table A2, right hemisphere: Fig. 3; left hemisphere: Appendix Fig. A1). For dPCC, FCS to CEN was significantly higher than to DAN and DMN; whereas for vPCC, FCS to DMN was significantly higher than to DAN and CEN. Therefore, we define CEN and DMN as the canonical networks for dPCC and vPCC, respectively.
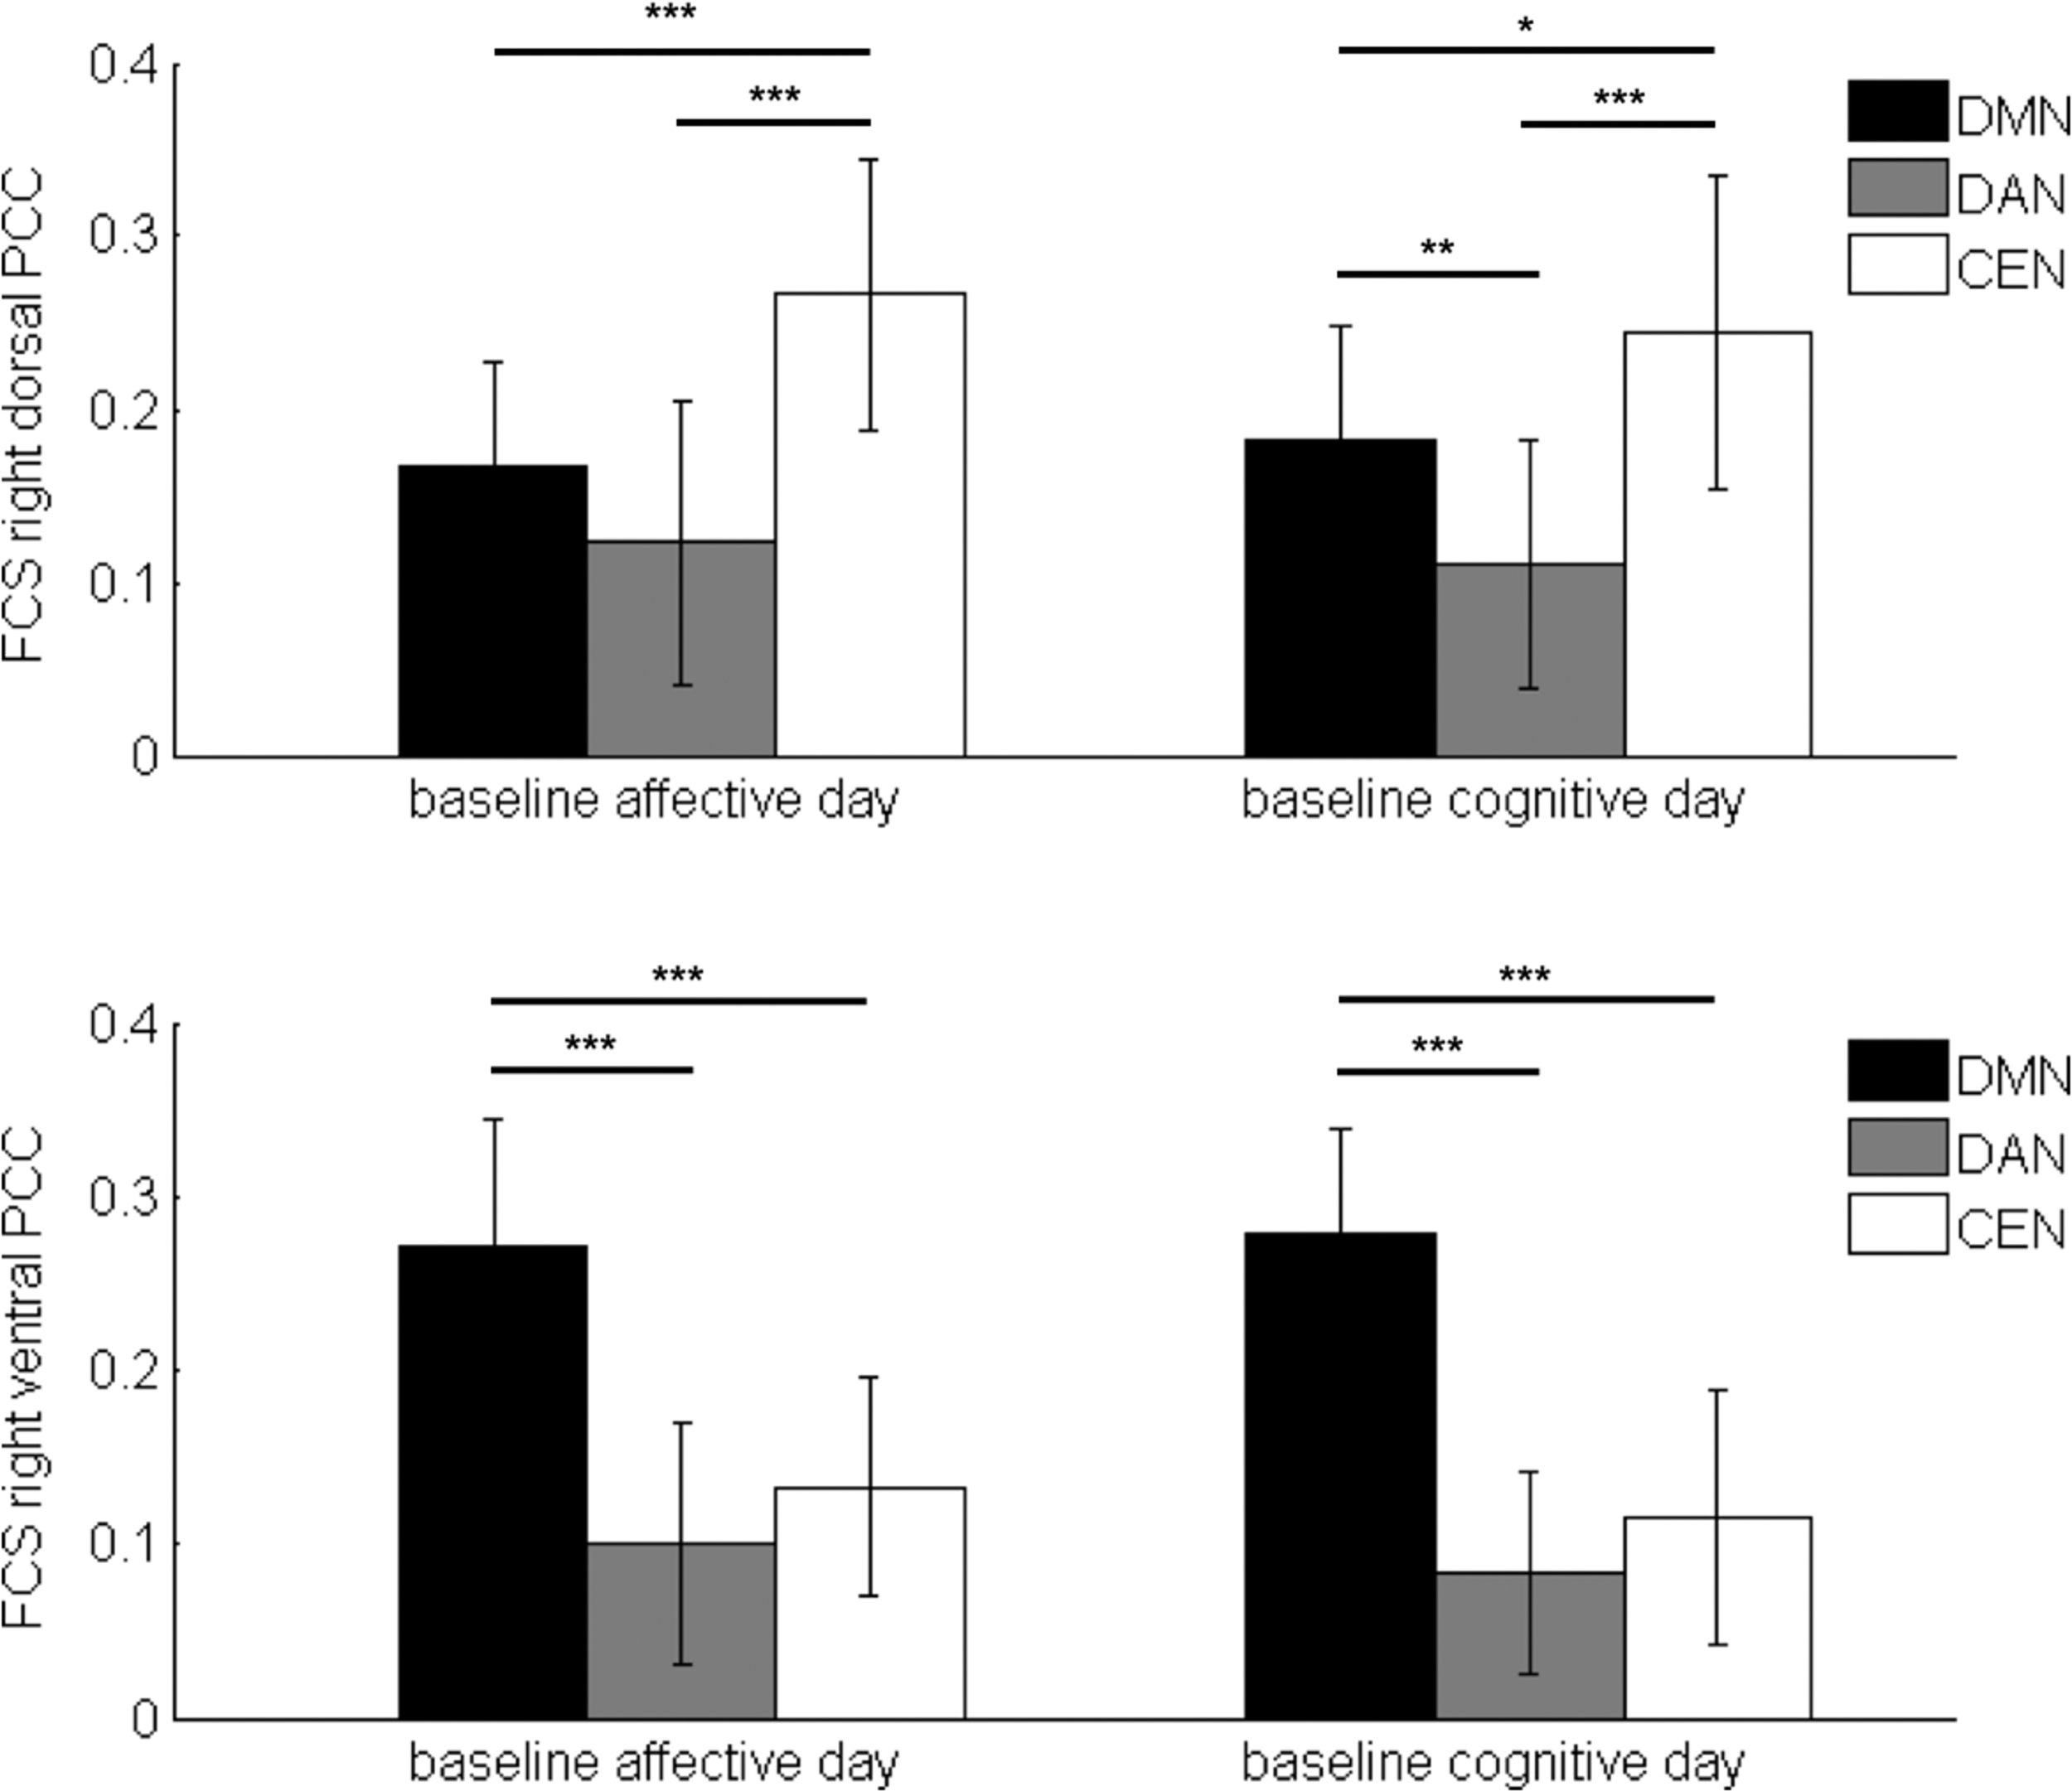
FCS of right dPCC (upper panel) and right vPCC (lower panel) to DMN, DAN, and CEN at baseline (unconstrained rest) on both experimental days. CEN and DMN are the “canonical networks” for dPCC and vPCC, respectively. Error bars represent standard deviation. Significance stars indicate results of post hoc rmANOVA pairwise comparisons with Bonferroni correction (for six multiple comparisons in dPCC and vPCC on two experimental days, respectively): ***pB < 0.001, **pB < 0.01, *pB < 0.05. DAN, dorsal-attention network; rmANOVA, repeated-measure analysis of variance.
Effects of environmental demand on intra-PCC functional coupling
Second, we tested whether intra-vPCC-dPCC functional coupling was modulated by environmental demand. rmANOVA showed a significant day × state interaction (right hemisphere: F(2.6, 41.7) = 6.86, p = 0.001, η2 p = 0.30; left hemisphere: F(4, 64) = 8.88, p < 0.001, η2 p = 0.36). Post hoc analyses showed that intra-PCC coupling was modulated by state on the affective day, but not on the cognitive day. For the affective day, rmANOVA revealed a main effect of state (right hemisphere: F(4, 64) = 14.93, p < 0.001, η2 p = 0.48; left hemisphere: F(4, 64) = 9.45, p < 0.001, η2 p = 0.37). Intra-PCC coupling was lower during movie viewing compared with that during baseline and post-task resting state (Appendix Table A3, Fig. 4). There was no evidence for ventral-dorsal decoupling during cognitive tasks.
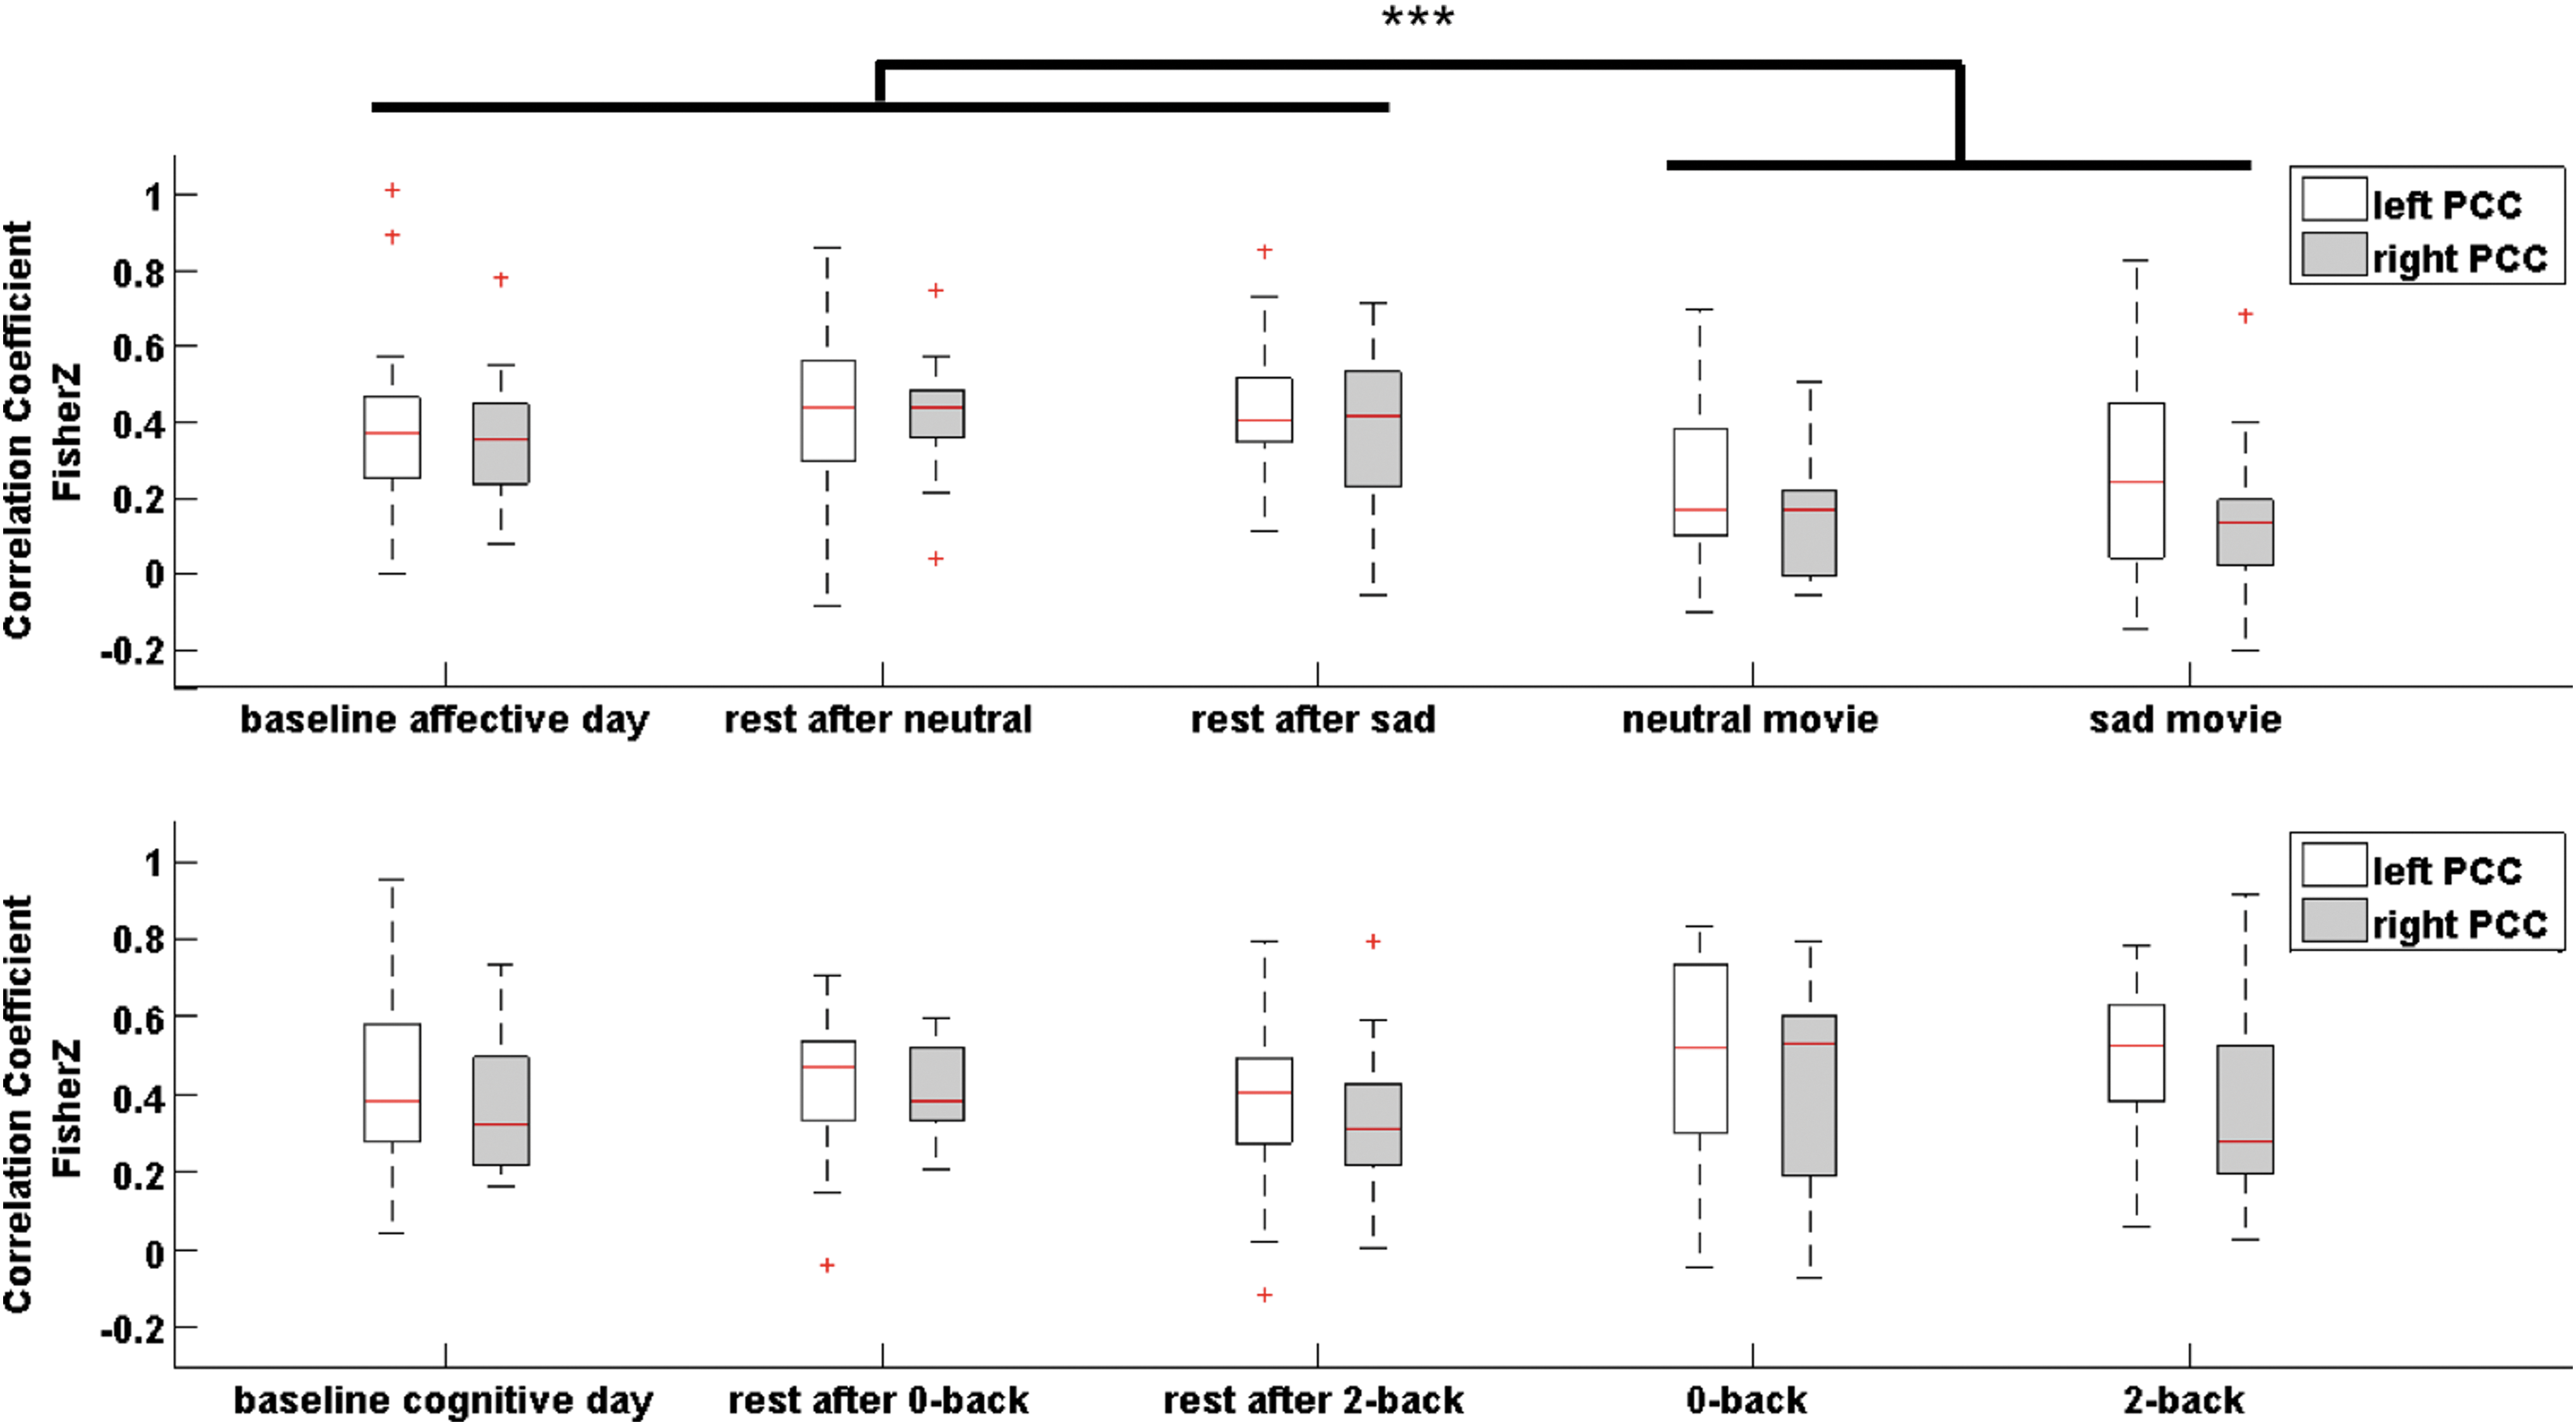
Correlation of dPCC and vPCC during all conditions of the affective day (upper panel) and cognitive day (lower panel) for right and left hemispheres. On each box, the central mark is the median, the edges of the box are the 25th and 75th percentiles, the whiskers extend to the most extreme data points not considered outliers, and outliers are plotted as crosses. Significance bar indicates significant differences in post hoc comparisons between resting-state and task conditions with Bonferroni correction (for two multiple comparisons): ***pB < 0.0001.
Network Connectivity of PCC subregions as a function of cognitive and affective environmental demands
Third, we investigated the modulatory effect of environmental demands on the FCS from vPCC and dPCC to the major ICNs. rmANOVA showed significant day × state × network interaction for dPCC (right hemisphere: F(8, 128) = 12.07, p < 0.001, η2 p = 0.43; left hemisphere: F(8, 128) = 13.79, p < 0.001, η2 p = 0.46) and vPCC (right hemisphere: F(8, 128) = 2.64, p = 0.010, η2 p = 0.14; left hemisphere: F(8, 128) = 4.65, p < 0.001, η2 p = 0.23). To further dissect this three-way interaction, rmANOVA was performed on d-/vPCC FCS for affective and cognitive days separately, with state (5), network (3) and state × network interaction as within-subject factors.
Affective day
FCS from vPCC and dPCC to major ICNs
The main effect of network replicated the patterns of canonical networks for dPCC and vPCC independent of state (Appendix Table A4).
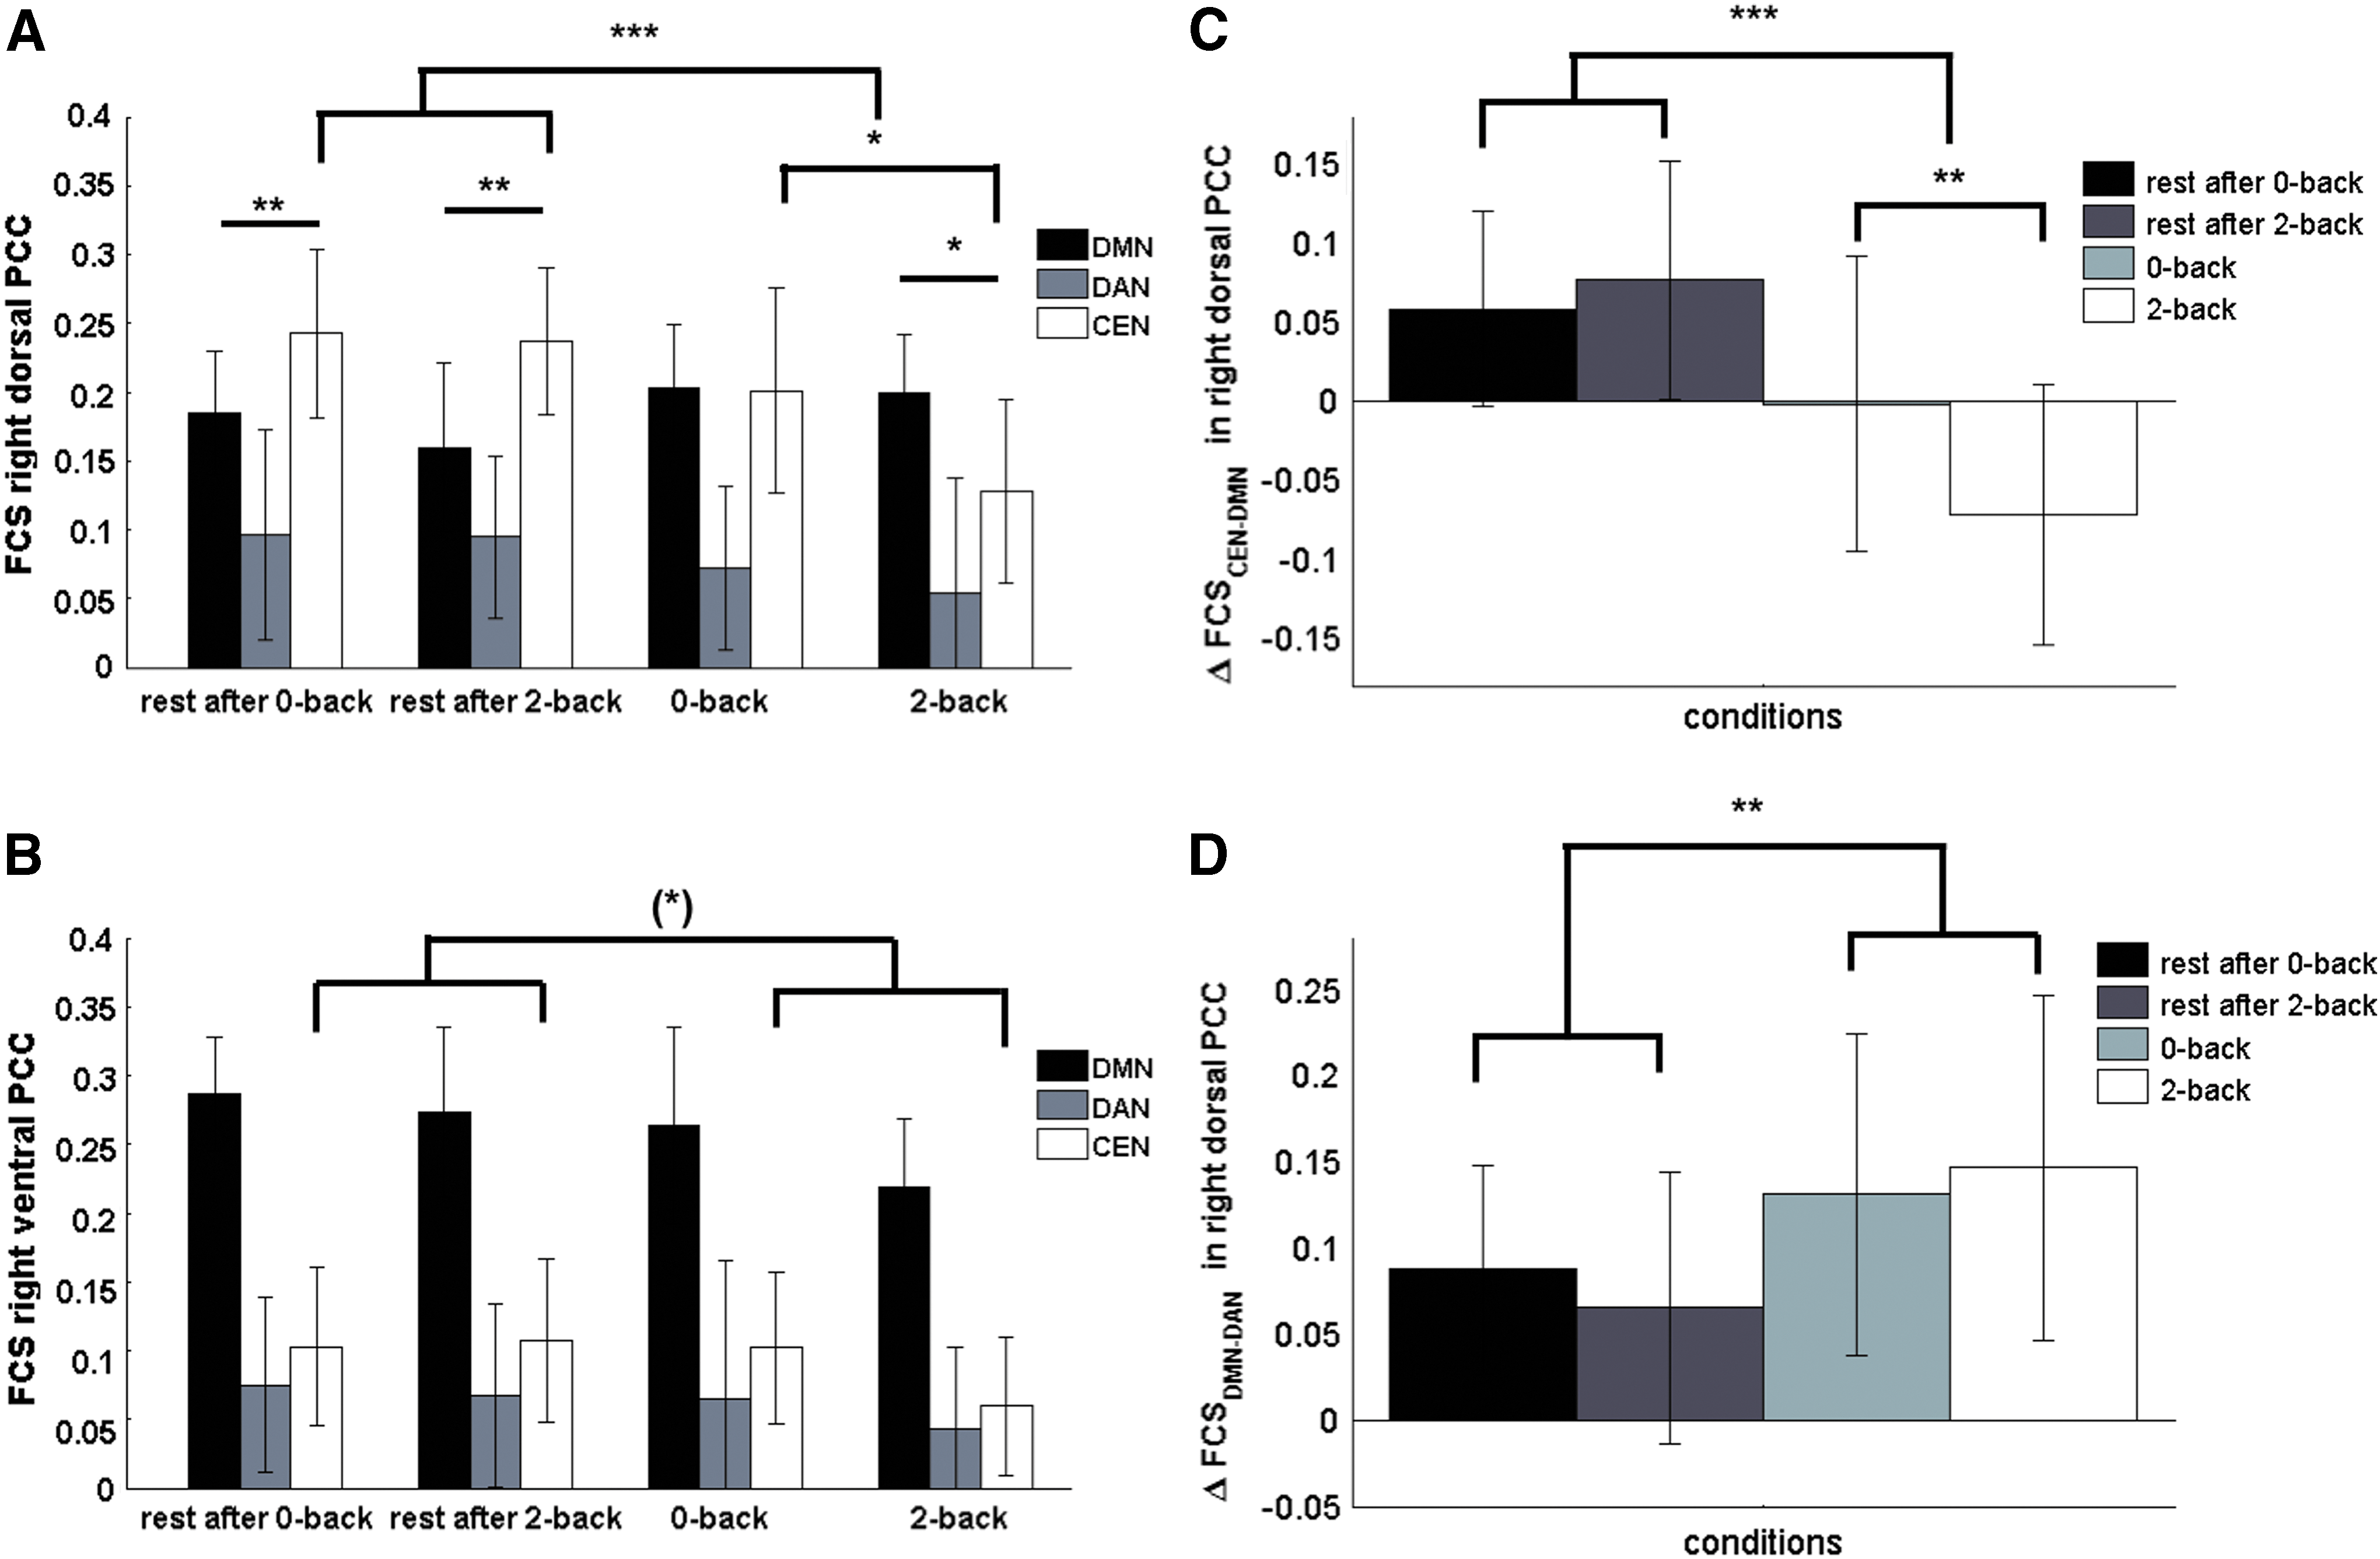
Significant interaction effects between network and state were found for right dPCC (F(3.7, 58.8) = 6.64, p < 0.001, η2 p = 0.29) and right vPCC (F(4.6, 73.9) = 6.12, p < 0.001, η2 p = 0.28). Post hoc tests showed that for both subregions, DMN FCS decreased during movies (dPCC: t(16) = 8.01, pB < 0.001; vPCC: t(16) = 5.25, pB < 0.001), whereas FCS to DAN and CEN did not change between rest and movies for either subregion (Fig. 5A, B).

FCS of right dPCC (
For both subregions, changes further affected relative FCS between the respective non-canonical networks: dPCC-DMN FCS was significantly stronger than dPCC-DAN FCS during resting states after movie (rest after neutral: t(16) = 4.52, pB < 0.001; rest after sad: t(16) = 4.581 pB < 0.001, Fig. 5A), but not during movies. vPCC-CEN FCS was significantly stronger than vPCC-DAN FCS during resting states after a sad movie (t(16) = 4.31, pB = 0.002, Fig. 5B), but not during movies.
ΔFCS between two ICNs
Further, we explored the modulatory effect of environmental demands on relative differences in FCS of a PCC subregion between two ICNs (ΔFCS). Follow up rmANOVA (5 states) on the differences between respective non-canonical network connectivities of each PCC subregion showed a significant main effect of state for right dPCC: ΔFCSDMN-DAN (F(4, 64) = 16.53, p < 0.001, η2 p = 0.51). Post hoc tests revealed that ΔFCSDMN-DAN decreased significantly during neutral and sad movies compared with that during resting states (t(16) = 8.43, p < 0.001) (Fig. 5C).
In right vPCC, rmANOVA on ΔFCS between the two non-canonical networks CEN and DAN (ΔFCSCEN-DAN) showed a significant main effect of state (F(2.5, 40.4) = 5.83, p = 0.003, η2 p = 0.27). Post hoc tests revealed that ΔFCSCEN-DAN decreased significantly during neutral and sad movies compared with that during resting states (t(16) = 4.18, p = 0.001; Fig. 5D).
In contrast, for ΔFCS between canonical and non-canonical networks, the effect of state was not consistently found for dPCC and vPCC:
There was a main effect of state on ΔFCSCEN-DMN for right dPCC (F(4, 64) = 3.95 p = 0.006, η2 p = 0.20), which is driven by smaller ΔFCSCEN-DMN during rest conditions than during movie conditions (t(16) = 2.67, p = 0.017). In right vPCC, rmANOVA revealed no significant main effect of state on ΔFCSCEN-DMN.
There was also a significant main effect of state on ΔFCS between the canonical network and DAN, which is non-canonical for both subregions: A significant effect on ΔFCSDMN-DAN in right vPCC (F(4, 64) = 10.88, p < 0.001, η2 p = 0.41) was driven by larger ΔFCSDMN-DAN in vPCC during rest conditions than during movie conditions (t(16) = 4.78, p < 0.001), as revealed by post hoc tests. Also, right dPCC showed a significant main effect of state on ΔFCSCEN-DAN (F(2.3, 36.4) = 3.77, p = 0.028, η2 p = 0.19) in that ΔFCSCEN-DAN was larger during rest conditions than during movies (t(16) = 3.46, p = 0.003).
Results for the left hemisphere are similar to those of the right hemisphere (Appendix Fig. A2); for detailed statistics, please see Appendix Table A4.
Cognitive day
FCS from vPCC and dPCC to major ICNs
A separate rmANOVA was performed on data from the cognitive day to examine the effect of environmental demands on the FCS from vPCC and dPCC to the major ICNs.
The main effect of network replicated the patterns of canonical networks found in baseline rest (Fig. 3) and also in the rest after cognitive task conditions (Appendix Table A4, Fig. 6A, B).
FCS of right dPCC (
Significant interaction effects between network and state were found for dPCC (F(8, 128) = 10.69, p < 0.001, η2 p = 0.40), but not for vPCC.
For both subregions, FCS to CEN decreased during cognitive tasks compared with subsequent resting states (right dPCC: t(16) = 5.99, pB < 0.001; right vPCC: t(16) = 2.49, pB = 0.072, Appendix Table A4), whereas this effect was stronger in the 2-back than in the 0-back condition (Fig. 6A, B).
Moreover, effects of state on FCS of canonical and non-canonical networks were different for dPCC and vPCC:
In dPCC, the canonical network (CEN) had no longer the strongest FCS during n-back compared with rest after cognitive task conditions (Fig. 6A). In contrast, in vPCC, its canonical network (DMN) had the strongest FCS across both after and during n-back task conditions (Fig. 6B). More specifically, in right dPCC, FCS to its canonical network CEN was weaker than that to the DMN (t(16) = −3.48, pB = 0.003) in the 2-back condition; whereas they were equal during the 0-back condition (Fig. 6A).
ΔFCS between two ICNs
Similar to analysis on data from the affective day, we also explored the modulatory effect of environmental demands on relative differences in FCS of a PCC subregion between two ICNs (ΔFCS) on cognitive day. rmANOVA showed a significant main effect of state on ΔFCSCEN-DMN in right dPCC (F(4, 64) = 18.90, p < 0.001, η2 p = 0.54, Fig. 6C). Post hoc tests revealed that ΔFCSCEN-DMN decreased during n-back tasks compared with that during rests (t(16) = −6.50, pB < 0.001), and it reversed during the 2-back condition compared with all rest conditions and 0-back (DMN FCS stronger than CEN; t(16) = 3.41, pB = 0.007, Figs. 6C and 7).

Fingerprint of right dPCC's switching behavior in difference of FCS (ΔFCS) of ICNs between dimensions of internally versus externally directed thoughts
For right dPCC, there was a significant effect of state on ΔFCS between the two non-canonical networks (i.e., ΔFCSDMN-DAN; F(4, 64) = 6.11, p < 0.001, η2 p = 0.28, Fig. 6D). There was no change in sign of ΔFCS, whereas post hoc tests revealed that ΔFCSDMN-DAN increased during n-back tasks compared with that during resting states (t(16) = 3.76, p = 0.002, Figs. 6D and 7). Also, rmANOVA revealed a significant main effect of state on ΔFCSCEN-DAN in right dPCC (F(4, 64) = 5.84, p < 0.001, η2 p = 0.27). ΔFCSCEN-DAN decreased during the 2-back task compared with resting state after 2-back (t(16) = −3.93, p = 0.001).
In contrast, for vPCC, there was no change in relative FCS between any two networks.
Results for the left hemisphere are similar to those of the right hemisphere (Appendix Fig. A3); for detailed statistics see Appendix Table A4. The specificity of dPCC and vPCC connectivity profiles was confirmed confirmed by one-sample t-tests at whole-brain level (for details please see Appendix Fig. A4).
Discussion
Summary
The first major finding is that CEN and DMN were identified to be the “canonical networks” for dPCC and vPCC, respectively, because of their consistently highest FCS during rest (Figs. 3, 5, and 6).
Although PCC subregions were coupled during rest and cognitive tasks, they decoupled only during affective tasks (Fig. 4). PCC subregions' connectivity patterns were modulated by experimental condition as a function of their canonical network: Compared with rest, FCS of both PCC subregions to DMN decreased during affective tasks (Fig. 5A, B). FCS of both subregions to CEN decreased during cognitive tasks (Fig. 6A, B). Shifting from rest after task to affective tasks, we further observed a switch in differential connectivity between the non-canonical networks for dPCC and vPCC (non-canonical switch) (Fig. 5C, D). In contrast, when switching from constrained rest to cognitive tasks, there was a switch in canonical network for dPCC (Fig. 6C), whereas vPCC did not show any change in ΔFCS (Fig. 6B).
Switching network connectivity patterns as a function of environmental demand
In our design, we revealed differential response patterns of network FC for vPCC and dPCC driven by an intricate pattern of between-network interaction patterns when switching between affective and cognitive tasks. There was a specific trajectory of relative network connections for dPCC, where ΔFCSDMN-DAN and ΔFCSCEN-DMN were at comparable levels during resting states, but their specific fingerprints discriminate between cognitive and affective environmental demands (Fig. 7). Although ΔFCSCEN-DMN increased during affective tasks, it decreased during cognitive tasks compared with rest (Fig. 7). The reverse pattern was observed for dPCC's ΔFCSDMN-DAN: ΔFCS increased during cognitive tasks, but it decreased during affective tasks (Fig. 7). In contrast to observations in the dPCC, connectivity pattern of vPCC showed a significant specification for modulating neither internally nor externally directed thoughts (Fig. 7).
Relation to previous findings regarding between-network interactions during rest and task
Functional interactions between the DMN and CEN modulated by four cognitive load levels in an n-back working memory task were investigated by Liang et al., and it was shown that within-network connectivity of the vPCC and dPCC (both were part of the DMN module) was differentially modulated by cognitive load: Within-module degree (a graph metric closely related to FCS) in vPCC decreased when working memory load increased, whereas it increased in dPCC (Liang et al., 2016). Despite differences in methodological approaches, both this study and work by Liang et al. presented evidence for a decrease in FC of vPCC to DMN when task load increases. Further, it is also suggested that dPCC and vPCC subregions could be distinguished by the different patterns of their connectivity change with the CEN module (Liang et al., 2016).
Between-network interaction of ICN has also been investigated by Gao and Lin (2012) during unconstrained rest, finger tapping (engaging DAN), and natural movie watching (engaging DMN). It is hypothesized that the CEN will selectively augment/suppress DAN and DMN depending on how the tasks target the networks (Gao and Lin, 2012). CEN exhibited a significantly higher positive correlation with DAN and significantly more negative correlation with DMN during finger tapping when compared with rest. In contrast, during movie watching, CEN was significantly anti-correlated with DAN, whereas it was positively correlated with DMN. Granger causality analysis revealed extensive forward influences initiated from CEN to both the DMN and DAN across all three experimental conditions, supporting the regulatory role of the CEN over these two networks. The CEN was shown to exert a stronger regulatory role during finger tapping than movie watching, which might be explained by the fact that CEN upregulates DAN during finger tapping more than it upregulates DMN during movie watching. The authors concluded that the CEN has a dominant regulating role over DMN and DAN in switching between activation and deactivation to facilitate the performance in certain tasks. Comparing evidence from this with the study by Gao and Lin, while focusing on movie watching conditions (affective stimulation) and grouping finger tapping and n-back working memory tasks (cognitive tasks), an agreement in that switching between affective and cognitive tasks is modulated by changes in interplay between CEN with DMN and DAN was evident.
As changes in attentional focus evoked regional alterations of between-network connectivity patterns of subregions of the PCC, the PCC has been suggested to influence whole-brain metastability and rapid transitions between neural states (Leech and Sharp, 2014). Since especially the dPCC has strong canonic FC to CEN, its role in switching between brain states was further corroborated by evidence of this study.
In addition to its involvement in cognitive tasks, there is also evidence for the role of PCC in affective tasks (Lindquist et al., 2012; Maddock et al., 2003). Activity and connectivity of the PCC are modulated by states of arousal (Boly et al., 2008) and emotional content (Maddock et al., 2003). It is suggested that PCC mediates the link between emotional and memory-related processes, and it helps to make meaning of affective inputs either from oneself or from observing affective responses of others (Lindquist et al., 2012). Our study has the advantage by probing PCC-ICN connectivity patterns in the same subjects during both cognitive and affective tasks. Corroborating with Gao and Lin (2012), our results support that the interplay between PCC and major ICNs is modulated differentially by cognitive and affective tasks.
Limitations
Since this investigation focused on task-general effects between different experimental conditions, analysis of task-specific effects between emotional valence of affective stimulation and difficulty level of cognitive tasks was not deepened, as they have been investigated in Borchardt, et al. (2017). Nevertheless, we observed that the differences in FCS between the two difficulty levels of the cognitive task were small (Fig. 6A, B), which may suggest that the 0-back condition was too easy and instead 1-back and 3-back versions of the task should have been implemented. However, we observed that ΔFCSCEN-DMN in dPCC generally decreased during cognitive tasks, but at a high cognitive load (2-back) it even reversed (Figs. 6C and 7). Presuming a linear trend, ΔFCSCEN-DMN at 1-back would be a negative value as well.
Inclusion of only female subjects may be seen as a weakness, since generalizability of results to both sexes is impossible. Importantly, the PCC has been shown to activate differently between men and women during emotional processing (Fine et al., 2009; Schulte-Ruther et al., 2008). It has been reported that women showed greater PCC activation for negative and positive emotional picture stimuli as compared with men, and reported a stronger negative impact on mood during stimulation with negative valence (Hofer et al., 2007). Based on these results, we expected greater effects of affective stimulation in women.
An aspect that was not addressed in this study is anticorrelations between networks, due to choice of metrics derived from graph networks that typically only regard positive correlation coefficients as a measure of FC. The duration of the baseline resting-state scan was 5-min shorter than that of post-task resting state. Nevertheless, our approach allowed us to directly compare rest after task scans by using a sufficient number of timepoints, which is important for probing dynamic FC changes as the general project aim (Borchardt et al., 2017).
Regarding analytical approaches, we have introduced a network-based analysis of relative proportion of FC strength of a seed region to major ICNs, which goes beyond classical seed-based FC analysis by combining advantages of graph-theoretical network probing with specific a priori research questions about involved nodes.
Speculating about the reasons as to why potentially existing fingerprints of vPCC's functionality during internally directed thoughts have not been revealed in context of the experimental design, it is conceivable that the generally high inter-subject variability in mood-induction paradigms may disguise switching of between-network interaction patterns mediated by vPCC. Therefore, it would be worthwhile to replicate the functional dissociation of vPCC and dPCC observed in this study in independent datasets investigating switches between tasks and rest states.
Implications
We showed that dorsal and ventral subregions of the PCC have different canonical networks, thereby providing another proof for their functional heterogeneity. This is further corroborated by their functional segregation and the differential network FCS changes during switches of internally and externally directed thoughts. Although PCC's ventral subregion might be considered a key node orchestrating DMN, dPCC plays a crucial role during switches of network pattern according to the nature of constraint by environmental demands. This makes it crucial to consider both regions separately in terms of seed location and discussion of FC findings during seed-based resting state connectivity studies. Our study particularly strengthens the idea that the dPCC is involved in tuning the distinct brain states between affective and cognitive tasks demanding attention, whereas the vPCC in its canonical FCS to DMN is less variable during these different states.
We further demonstrate that the relative network FCS is a sensitive marker for state changes in the context of environmental demands and that information on canonical network assignment of ventral and dorsal subregions explains the presence or absence of FCS changes after the switch to externally directed thoughts.
Conclusion
By applying a rest-task-rest paradigm to study resting states, affective and cognitive tasks in the same subjects, we have demonstrated evidence for involvement of the dPCC in selectively modulating between-network interaction while balancing external task demands. In conclusion, this study adds insight on how brain networks encompassing PCC subregions interact differently to purposely shift attention according to requirements of environmental circumstances. Canonical network assignment of dPCC and vPCC was preserved across differentially directed thoughts. In contrast, relevant changes were observed in relative network strength between non-canonical networks. This gives rise to important implications for coining hypotheses and choosing methods for future studies.
Footnotes
Acknowledgments
This work was supported by the German Research Foundation (DFG, Cluster of Excellence “Languages of Emotion”). The authors thank Dr. Julian Hanich and his team for their help during preparation of the movie clips, and the team at The Center for Cognitive Neuroscience Berlin (CCNB) for their technical support during data acquisition. Lastly, they thank all the participants for their contribution to this study.
Author Disclosure Statement
No competing financial interests exist.
Appendix
Repeated-Measure Analysis of Variance Results for Functional Connectivity Strength and Differential Functional Connectivity Strength
| Right dorsal PCC | Left dorsal PCC | Right ventral PCC | Left ventral PCC | |||||||||
|---|---|---|---|---|---|---|---|---|---|---|---|---|
| F(df1, df2) | p | η2 p | F(df1, df2) | p | η2 p | F(df1, df2) | p | η2 p | F(df1, df2) | p | η2 p | |
| Functional connectivity strength | ||||||||||||
| Affective day | ||||||||||||
| Network | 40.94 (2, 32) | <0.001 | 0.72 | 27.49 (2, 32) | <0.001 | 0.63 | 89.75 (2, 32) | <0.001 | 0.85 | 75.50 (2, 32) | <0.001 | 0.83 |
| Task load | 4.39 (4, 64) | 0.003 | 0.22 | 5.85 (2.4, 39.2) | <0.001 | 0.27 | 1.97 (4, 64) | 0.11 | 0.11 | 2.03 (4, 64) | 0.10 | 0.11 |
| Network × task load | 6.64 (3.7, 58.8) | <0.001 | 0.29 | 5.91 (8, 128) | <0.001 | 0.27 | 6.12 (4.6, 73.9) | <0.001 | 0.28 | 7.83 (8, 128) | <0.001 | 0.33 |
| Cognitive day | ||||||||||||
| Network | 42.70 (2, 32) | <0.001 | 0.73 | 34.31 (2, 32) | <0.001 | 0.68 | 158.87 (2, 32) | <0.001 | 0.91 | 162.60 (2, 32) | <0.001 | 0.91 |
| Task load | 3.83 (4, 64) | 0.007 | 0.19 | 3.86 (4, 64) | 0.007 | 0.19 | 5.25 (4, 64) | 0.001 | 0.25 | 3.81 (4, 64) | 0.008 | 0.19 |
| Network × task load | 10.69 (8, 128) | <0.001 | 0.40 | 10.97 (8, 128) | <0.001 | 0.41 | 0.73 (8, 128) | 0.67 | 0.04 | 0.58 (8, 128) | 0.80 | 0.04 |
| Effects of task load on ΔFCS | ||||||||||||
| Affective day | ||||||||||||
| ΔFCSCEN-DMN | 3.95 (4, 64) | 0.006 | 0.20 | 4.61 (4, 64) | 0.002 | 0.22 | 1.34 (4, 64) | 0.27 | 0.08 | 5.01 (4, 64) | 0.001 | 0.24 |
| ΔFCSCEN-DAN | 3.77 (2.3, 36.4) | 0.028 | 0.19 | 1.67 (2.6, 41.8) | 0.19 | 0.10 | 5.83 (2.5, 40.4) | 0.003 | 0.27 | 3.31 (4, 64) | 0.016 | 0.17 |
| ΔFCSDMN-DAN | 16.53 (4, 64) | <0.001 | 0.51 | 12.10 (4, 64) | <0.001 | 0.43 | 10.88 (4, 64) | <0.001 | 0.41 | 16.87 (4, 64) | <0.001 | 0.51 |
| Cognitive day | ||||||||||||
| ΔFCSCEN-DMN | 18.90 (4, 64) | <0.001 | 0.54 | 16.28 (2.3, 37.5) | <0.001 | 0.50 | 0.62 (4, 64) | 0.65 | 0.04 | 0.60 (4, 64) | 0.67 | 0.04 |
| ΔFCSCEN-DAN | 5.84 (4, 76) | <0.001 | 0.27 | 5.44 (4, 64) | 0.001 | 0.25 | 0.84 (4, 64) | 0.51 | 0.05 | 0.35 (4, 64) | 0.84 | 0.02 |
| ΔFCSDMN-DAN | 6.11 (4, 64) | <0.001 | 0.28 | 8.29 (2.6, 40.8) | <0.001 | 0.34 | 0.75 (4, 64) | 0.56 | 0.05 | 0.76 (4, 64) | 0.55 | 0.05 |
Dark gray background: 0.01 < p < 0.05; light gray background: 0.001 < p < 0.01; gray background: p < 0.001.
FCS, functional connectivity strength; ΔFCS, differential FCS.