
Abstract
In resting-state functional MRI (rs-fMRI), functional networks are assessed utilizing the temporal correlation between spontaneous blood oxygen level-dependent signal fluctuations of spatially remote brain regions. Recently, several groups have shown that temporal shifts are present in rs-fMRI maps in patients with cerebrovascular disease due to spatial differences in arterial arrival times, and that this can be exploited to map arrival times in the brain. This suggests that rs-fMRI connectivity mapping may be similarly sensitive to such temporal shifts, and that standard rs-fMRI analysis methods may fail to identify functional connectivity networks. To investigate this, we studied the default mode network (DMN) in Moyamoya disease patients and compared it with normal healthy volunteers. Our results show that using standard independent component analysis (ICA) and seed-based approaches, arterial arrival delays lead to inaccurate incomplete characterization of functional connectivity within the DMN in Moyamoya disease patients. Furthermore, we propose two techniques to correct these errors, for seed-based and ICA methods, respectively. Using these methods, we demonstrate that it is possible to mitigate the deleterious effects of arterial arrival time on the assessment of functional connectivity of the DMN. As these corrections have not been applied to the vast majority of >200 prior rs-fMRI studies in patients with cerebrovascular disease, we suggest that they be interpreted with great caution. Correction methods should be applied in any rs-fMRI connectivity study of subjects expected to have abnormally delayed arterial arrival times.
Introduction
Resting-state functional MRI (rs-fMRI) connectivity mapping is based on identifying spatially distributed regions that exhibit temporally correlated blood oxygen level-dependent (BOLD) signal fluctuations (Biswal et al., 1995). rs-fMRI has been increasingly used to explore the brain's functional organization and to probe alterations in neurological or psychiatric diseases (Greicius et al., 2004, 2007; Seeley et al., 2009). Because functional connectivity networks are identified utilizing the temporal correlation between signal fluctuations of spatially remote areas of the brain using seed-based (Biswal et al., 1995) or independent component analysis (ICA) (McKeown et al., 1998) approach, rs-fMRI analyses are inherently sensitive to delays in signal time series. Since the BOLD signal originates from the changes in local blood flow, blood volume, and oxygenation, regional differences in the arterial arrival times can potentially affect the results of rs-fMRI connectivity analysis.
Typical variations in the arterial arrival times are insignificant in healthy subjects and are neglected in rs-fMRI connectivity analysis. However, arterial arrival time delays have been identified in many neurological conditions, including acute and chronic ischemia (MacIntosh et al., 2010), Parkinson's disease (Al-Bachari et al., 2014), Alzheimer's dementia (Alsop et al., 2010), and normal aging (Liu et al., 2012). Time shifts in rs-fMRI time series have recently been identified in cerebrovascular disease patients and have been shown to correlate with arterial arrival delays as measured by conventional dynamic susceptibility contrast (DSC) perfusion imaging (Christen et al., 2015; Donahue et al., 2016; Lv et al., 2013; Ni et al., 2017; Tong and Frederick, 2014). These transient delays would be expected to affect the outcome of the rs-fMRI analysis. In particular, spatially varying arterial arrival delays will considerably alter cross-correlation coefficients and could cause errors in the depiction of functional connectivity network.
As an example of these pathological situations, we studied the effects of the transit delays on rs-fMRI in a cohort of Moyamoya patients. Moyamoya disease is characterized by a chronic steno-occlusive vasculopathy affecting the terminal internal carotid arteries that can cause considerable increase in transit delays in the affected areas of the brain (Christen et al., 2015; Scott and Smith, 2009). Despite this, the majority of patients without ischemic stroke based on MRI findings have relatively preserved cognition (Karzmark et al., 2012), such that significant connectivity defects would not be expected. Focusing on the default mode network (DMN) (Greicius et al., 2004), we analyzed rs-fMRI data using both seed-based and ICA approaches to evaluate the impact of arterial arrival delays. Then, we propose and test two potential strategies to mitigate these errors. By comparing the corrected functional connectivity maps to the original maps, we believe such errors are significant and that the proposed methods should be considered in any patients in whom significant arterial arrival delays are present.
Methods
Patient population
After local ethics board review and written informed consent, 19 preoperative Moyamoya patients (39 ± 10 years; range 25–61 years; M/F 4/15) and 10 healthy volunteers (30 ± 6 years; range 24–45 years, M/F 6/4) were included in this retrospective study. Demographics of the Moyamoya patients are given in Table 1.
Demographics of the Moyamoya Patients
Imaging procedures
Subjects were scanned using a whole-body 3T scanner (MR750; GE Healthcare Systems, Milwaukee, WI) and an eight-channel receive-only head coil. For all subjects, rs-fMRI data were collected using a 2D gradient echo EPI sequence (field of view [FOV] = 22 cm, matrix = 64 × 64, slice thickness = 3.5 mm, number of slices = 35, repetition time [TR]/ echo time [TE] = 1.8–2 sec/30–40 ms, number of volumes = 120–180, scan duration 4–6 min). A high-order shimming procedure was used to reduce B0 inhomogeneity before the functional scans (Kim et al., 2002).
In patients, a gradient-echo planar imaging sequence (TE = 40 ms, TR = 1800 ms, 20 slices, FOV = 24 cm, matrix = 128 × 128, slice thickness = 5 mm, 120 repetitions, scan duration 1:48 min) was used to acquire DSC-based perfusion maps during injection of 10 mL (body weight independent) of gadobenate dimeglumine (Gd-BOPTA; Bracco, Milan, Italy) delivered using a power injector at 4 mL/s and followed by a 20 mL saline chaser. Hemodynamic maps (cerebral blood flow, cerebral blood volume, mean transit time, and Tmax) were created using automatic arterial input function/venous output function detection and delay-insensitive deconvolution with block circulant singular value decomposition with a regularization threshold of 15% using RAPID software (Straka et al., 2010).
For spatial normalization and anatomic reference, a high-resolution 3D T1-weighted image was acquired, using an inversion-recovery spoiled gradient echo (IR-SPGR) sequence (TR/TE/TI = 8.18/3.2/900 ms, FOV = 24 cm, matrix = 256 × 256, in-plane resolution = 0.94 × 0.94 mm, slice thickness/slice spacing = 1/0 mm, 176 sagittal slices).
Analysis methods
A summary of the analysis approaches carried out in this study is shown in Figure 1.
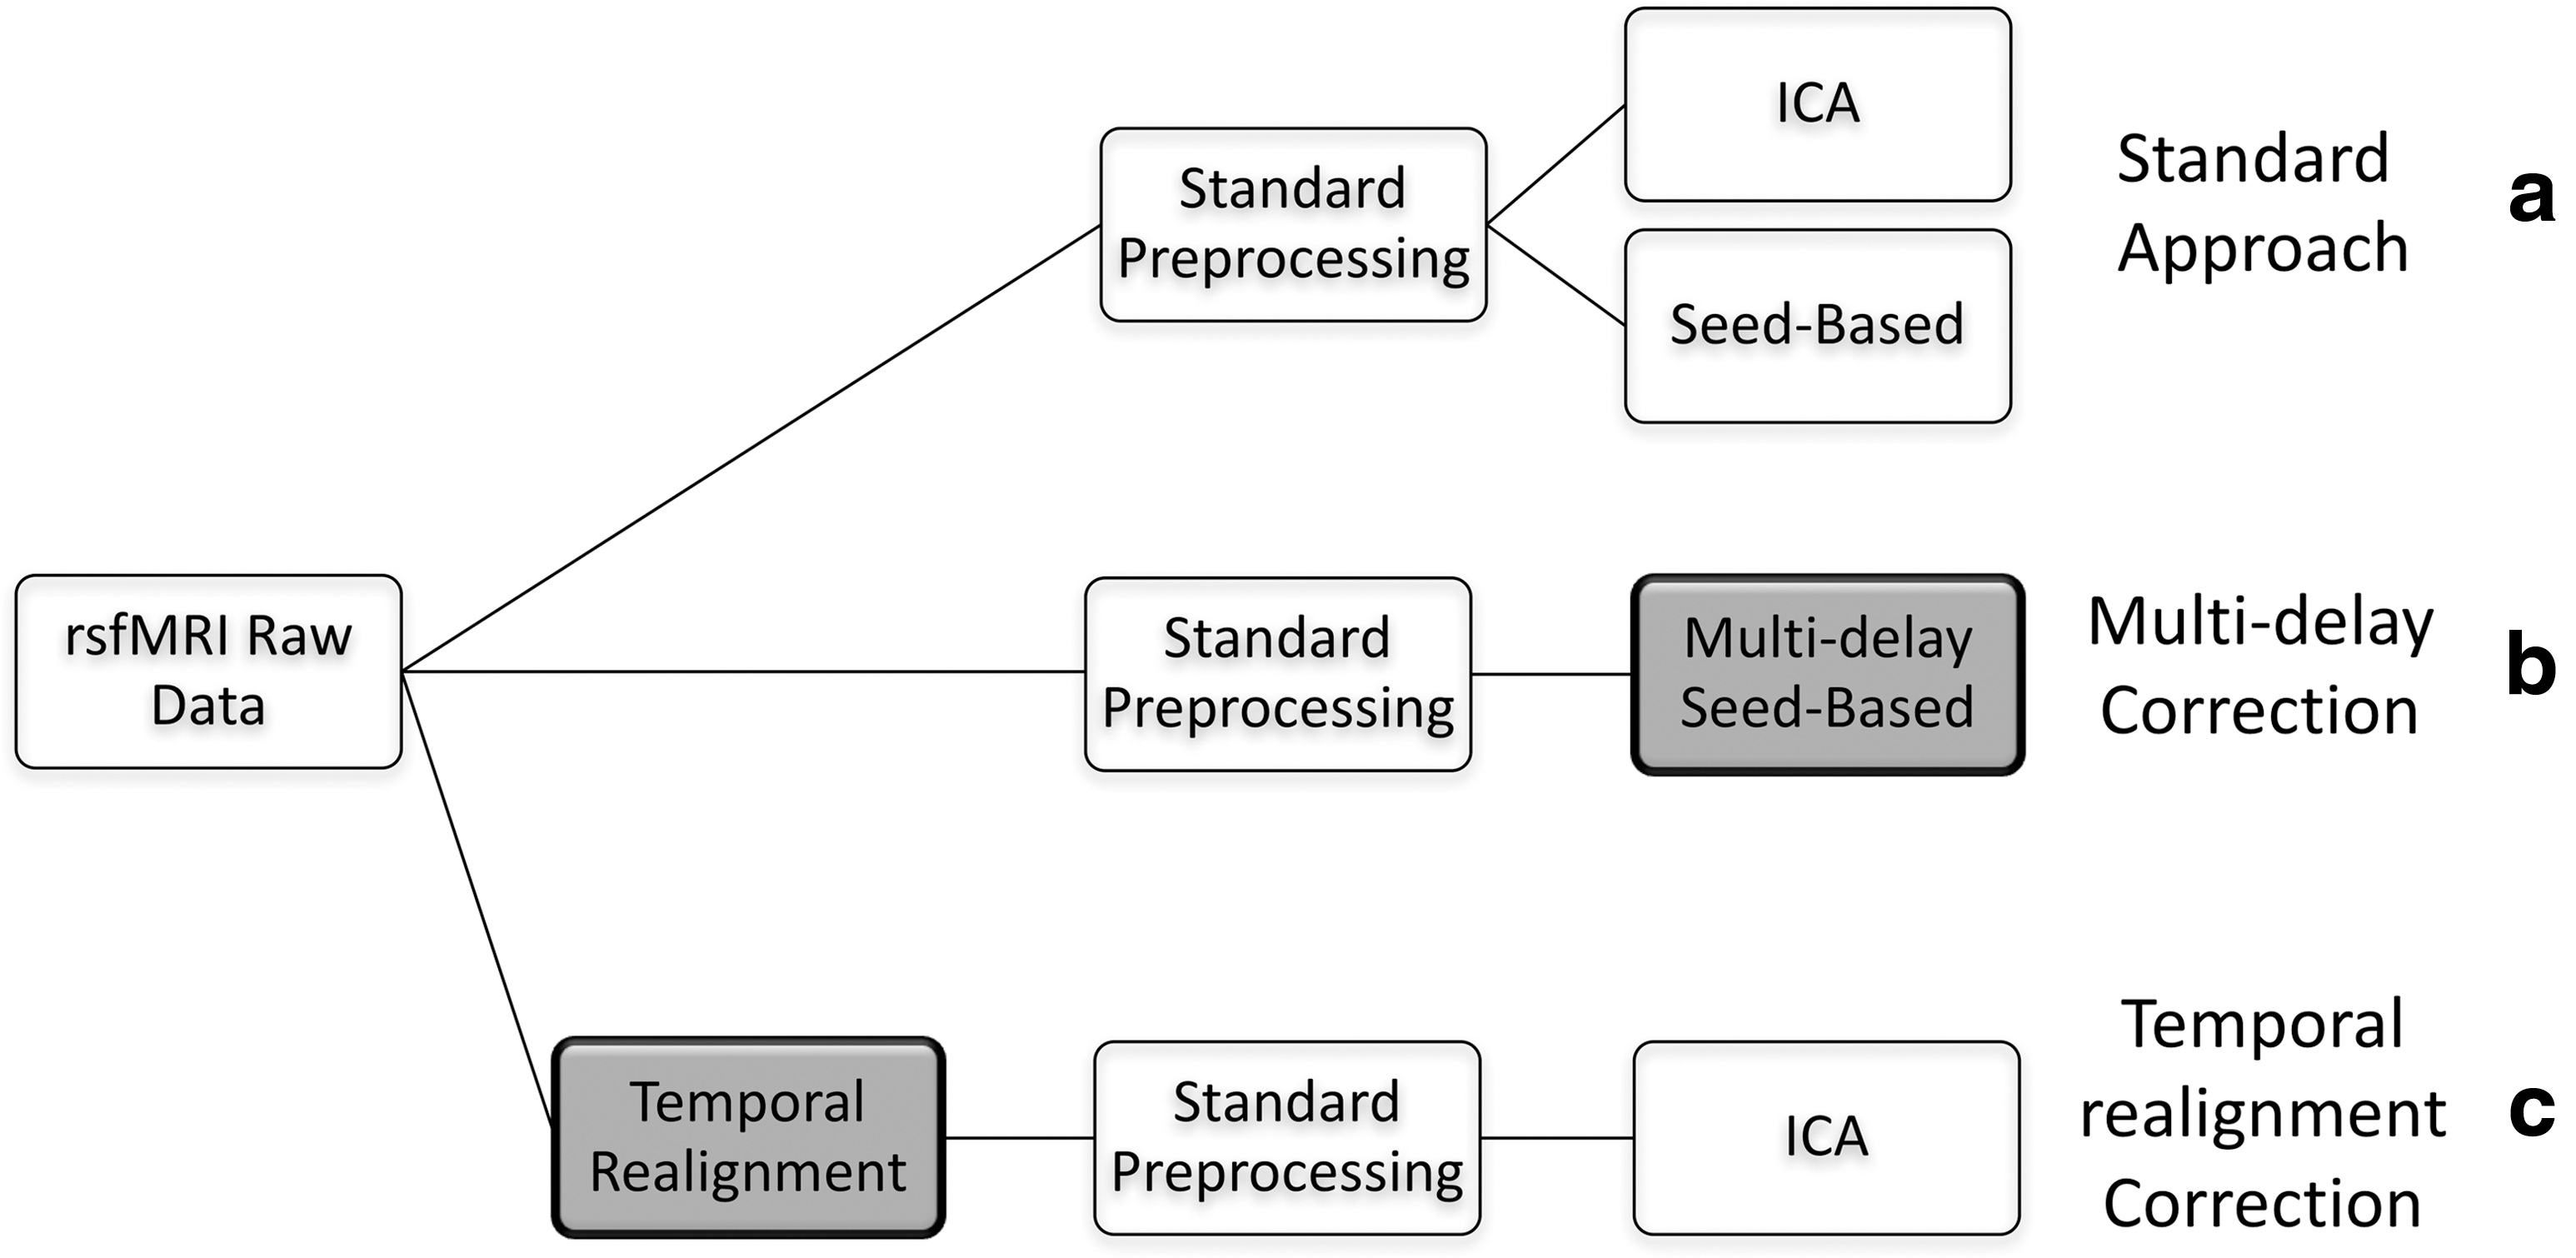
Summary of analysis approaches employed. Non-shaded boxes represent standard preprocessing/analysis approaches, whereas boxes shaded gray represent the methods proposed in this article to correct for arterial delays.
We first preprocess and analyze our rs-fMRI data using standard preprocessing and analysis approaches (Fig. 1a). Then we propose two correction strategies for seed-based (Fig. 1b) and ICA (Fig. 1c) techniques to account for transit delays. These steps are described in detail hereunder.
Standard preprocessing
rs-fMRI images were preprocessed and analyzed using tools from the FMRIB Software Library (FSL:
Standard analysis methods: seed-based and ICA
After preprocessing, we analyzed connectivity within the DMN using two commonly used approaches: seed-based whole brain functional connectivity (Biswal et al., 1995) and ICA (McKeown et al., 1998). For the seed-based method, we used a predefined DMN seed ROI created by Shirer and coworkers (2012) centered in the precuneus/posterior cingulate cortex (PCC; Fig. 2). The DMN reference time series was generated by extracting the mean time series within the seed ROI and was correlated against all brain voxels. ICA was carried out using FSL's MELODIC with the DMN identified by manual inspection of 30 independent components.
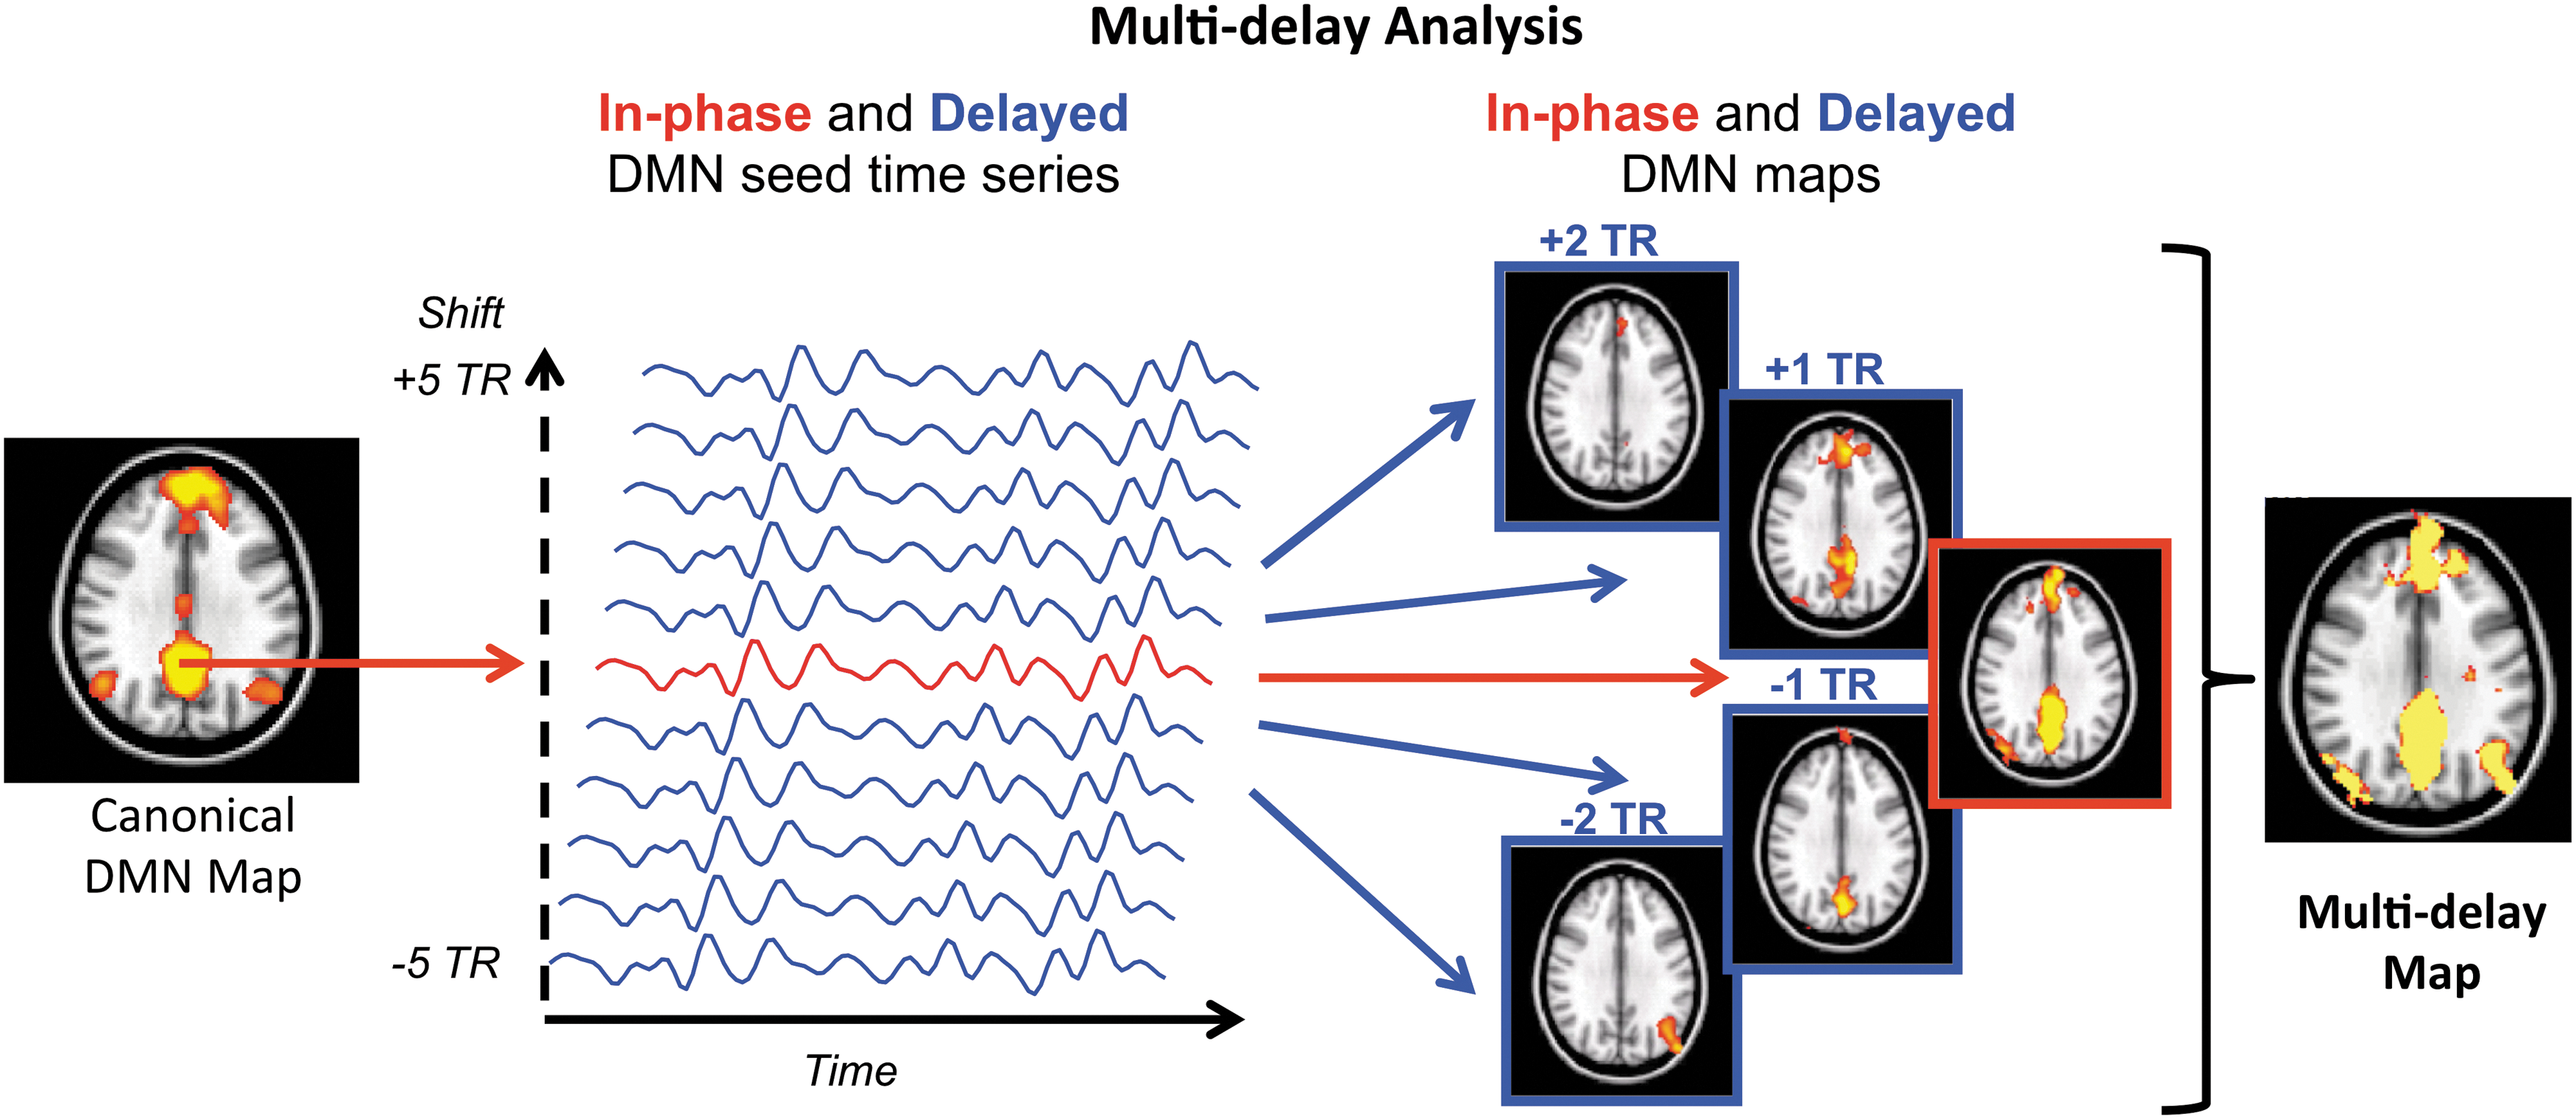
Proposed multi-delay seed-based analysis approach to account for arterial arrival delays. Color images available online at
Multi-delay seed-based correction method
Similar to a standard seed-based method, we first extract the DMN seed time series and correlated against all brain voxels to obtain the “in phase” functional connectivity map. We then obtained delayed DMN seed time series by shifting the in-phase DMN seed time series by multiples of a single TR ranging from −5 to +5. For each shift, we derived the corresponding 10 “delayed” functional connectivity maps. We then combined all connectivity maps (in phase and delayed) voxel-wise by choosing the maximum positive correlation for each voxel; using these values, we formed the final multi-delay connectivity map (Fig. 2).
Temporal realignment correction method
The multi-delay approach cannot be applied to an ICA. Therefore, we describe a preprocessing approach to correct for the temporal delays when using the ICA approach. In this preprocessing step, called temporal realignment, we create temporal shift maps from the rs-fMRI time series using the method proposed in Christen et al. (2015). The reference time series is determined from the average signal of the 10 central slices as an approximation of whole brain mean signal time course. We then perform a cross-correlation analysis between the reference time series and each individual brain voxel by shifting the time series of each voxel between −5 TR and +5 TR to determine the offset associated with the highest correlation coefficient with the reference signal. The voxel value for the temporal shift is defined by the offset time that yields the highest correlation coefficient, provided that the latter is higher than a confidence bound (>95% confidence interval). Then we shift the time series of each voxel according to the corresponding estimated delay to obtain a temporally realigned 4D rs-fMRI time series (e.g., blue voxel in Fig. 3a). The times series of the voxels with the shift confidence level <95% remain intact (e.g., green voxel in Fig. 3a). An example of the estimated temporal shift maps before and after the temporal realignment is shown in Figure 3b.
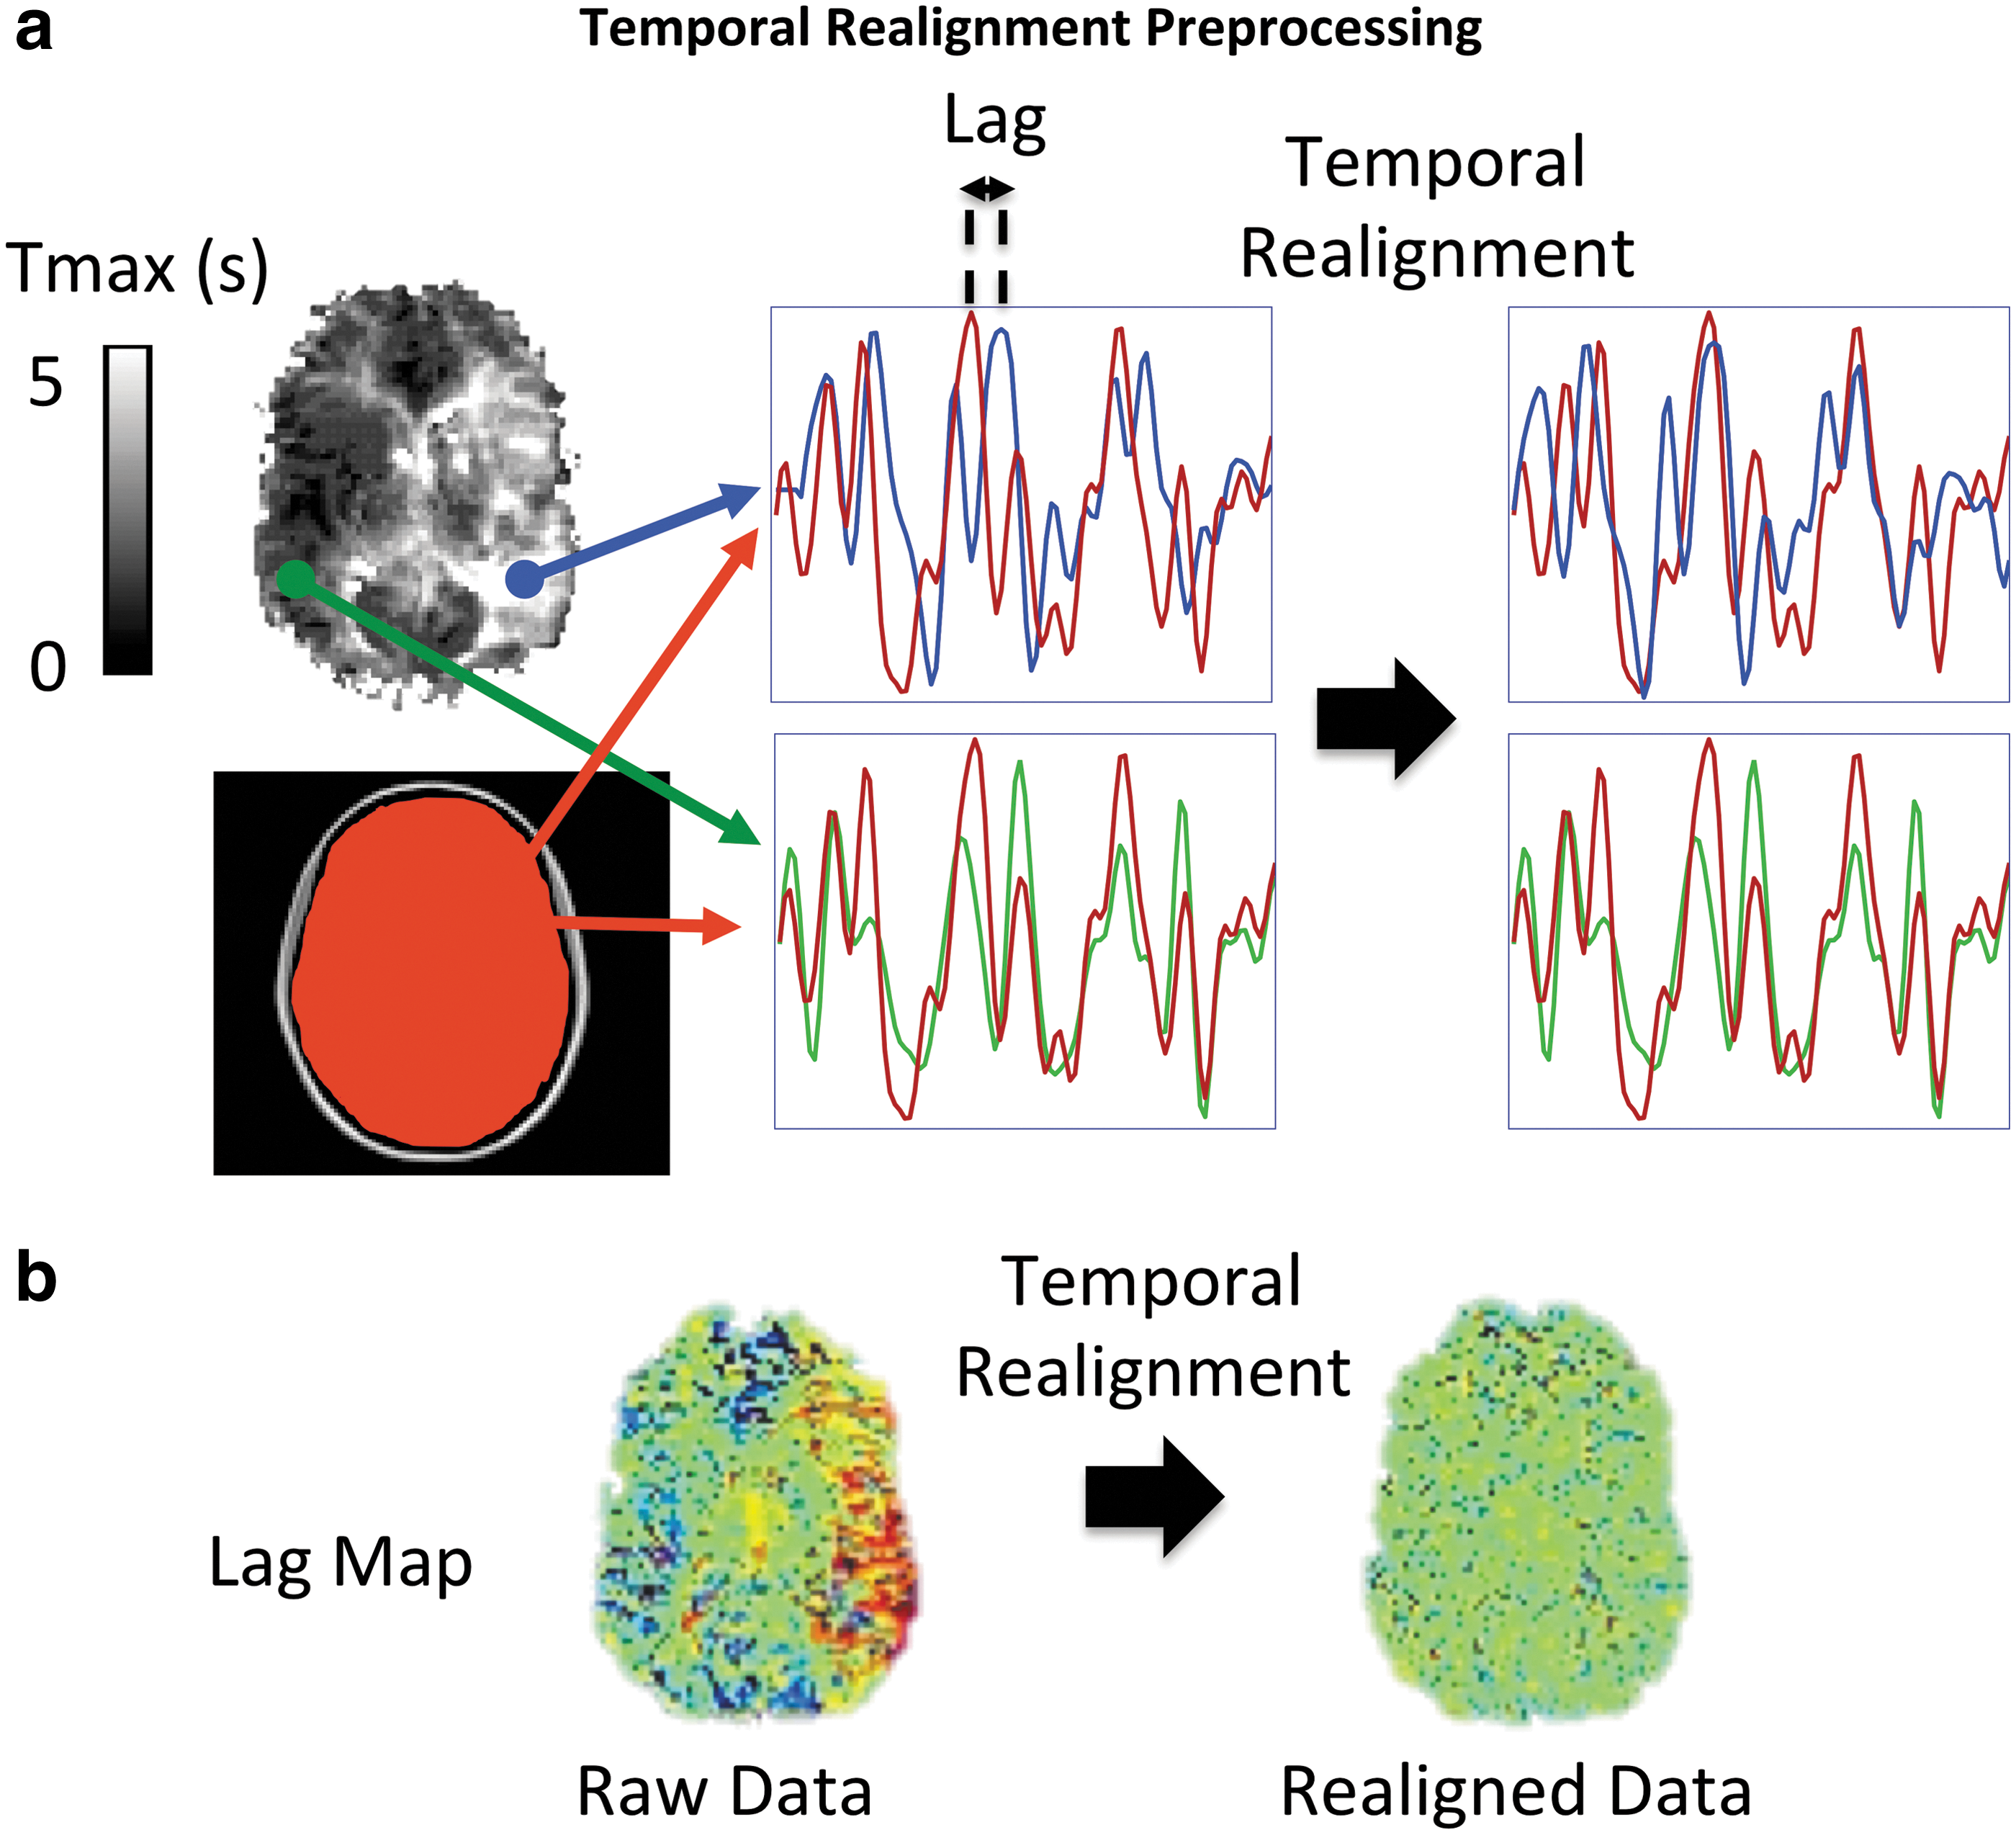
Schematic of the temporal realignment preprocessing approach for ICA.
Comparison metrics
To evaluate the sensitivity of each method in detecting functional connectivity networks, we compared the DMN connectivity maps obtained before and after each correction approach using two metrics: (1) Z-score method: the average Z-score of the DMN connectivity map within a predefined DMN mask (Shirer et al., 2012) was calculated. (2) Signal noise separation (SNS) (Shirer et al., 2015) method: given a connectivity map, signal was defined as the Z-score values of all voxels within the predefined DMN mask (Shirer et al., 2012). Noise was defined as the Z-score values of all nonzero, nongray matter voxels outside the DMN mask. SNS was estimated as the t-statistic resulting from a two-sample t-test comparing signal (5257 “signal” voxels) and noise (5257 voxels randomly sampled from all “noise” voxels in white matter and CSF).
To further understand the relationship between arterial arrival delay and changes in apparent connectivity, we used two tests. First, we checked whether the temporal shift analysis was performing as expected, we determined the single shift that provided the highest average Z-score within the DMN mask for the seed-based multi-delay approach for each subject. We compared the difference in this value between the normal subjects and the Moyamoya disease patients, and we compared the distribution of these temporal shifts with the distribution of Tmax values within the DMN as measured by DSC perfusion imaging. Next, we made additional measurements of the mean Z-score and the SNS methods (as already described), specifically in the affected nodes to directly probe the effect of the proposed correction methods on regions with prolonged arterial arrival times. The affected nodes were defined by finding the overlap between the thresholded DSC Tmax maps (Tmax > 3 sec) and the predefined DMN mask in the MNI space. For this analysis, we broke the DMN mask into four major nodes corresponding to the left and right inferior parietal lobule (IPL), dorsomedial prefrontal cortex, and PCC (shown as the canonical DMN map in Fig. 2).
Statistical analysis
All comparisons between the uncorrected and corrected metrics were performed using a Student's t-test with a minimum threshold of p < 0.05 representing significance.
Results
Resting-state connectivity analyses in three Moyamoya disease patients with increased arterial arrival delays are shown in Figure 4. In all of them, the standard seed-based approach and ICA did not detect the connectivity of one of the major DMN nodes: right and left IPL in patients 1 and 2, respectively, and dorsomedial prefrontal cortex in patient 3; these were all ipsilateral to the prolonged arterial arrival delay region defined by the DSC Tmax map (white arrows). These “missing” nodes, pointed by the white arrows, were identified by accounting for the delays using the multi-delay seed-based (Fig. 4c) and the temporal realignment ICA approaches (Fig. 4d).
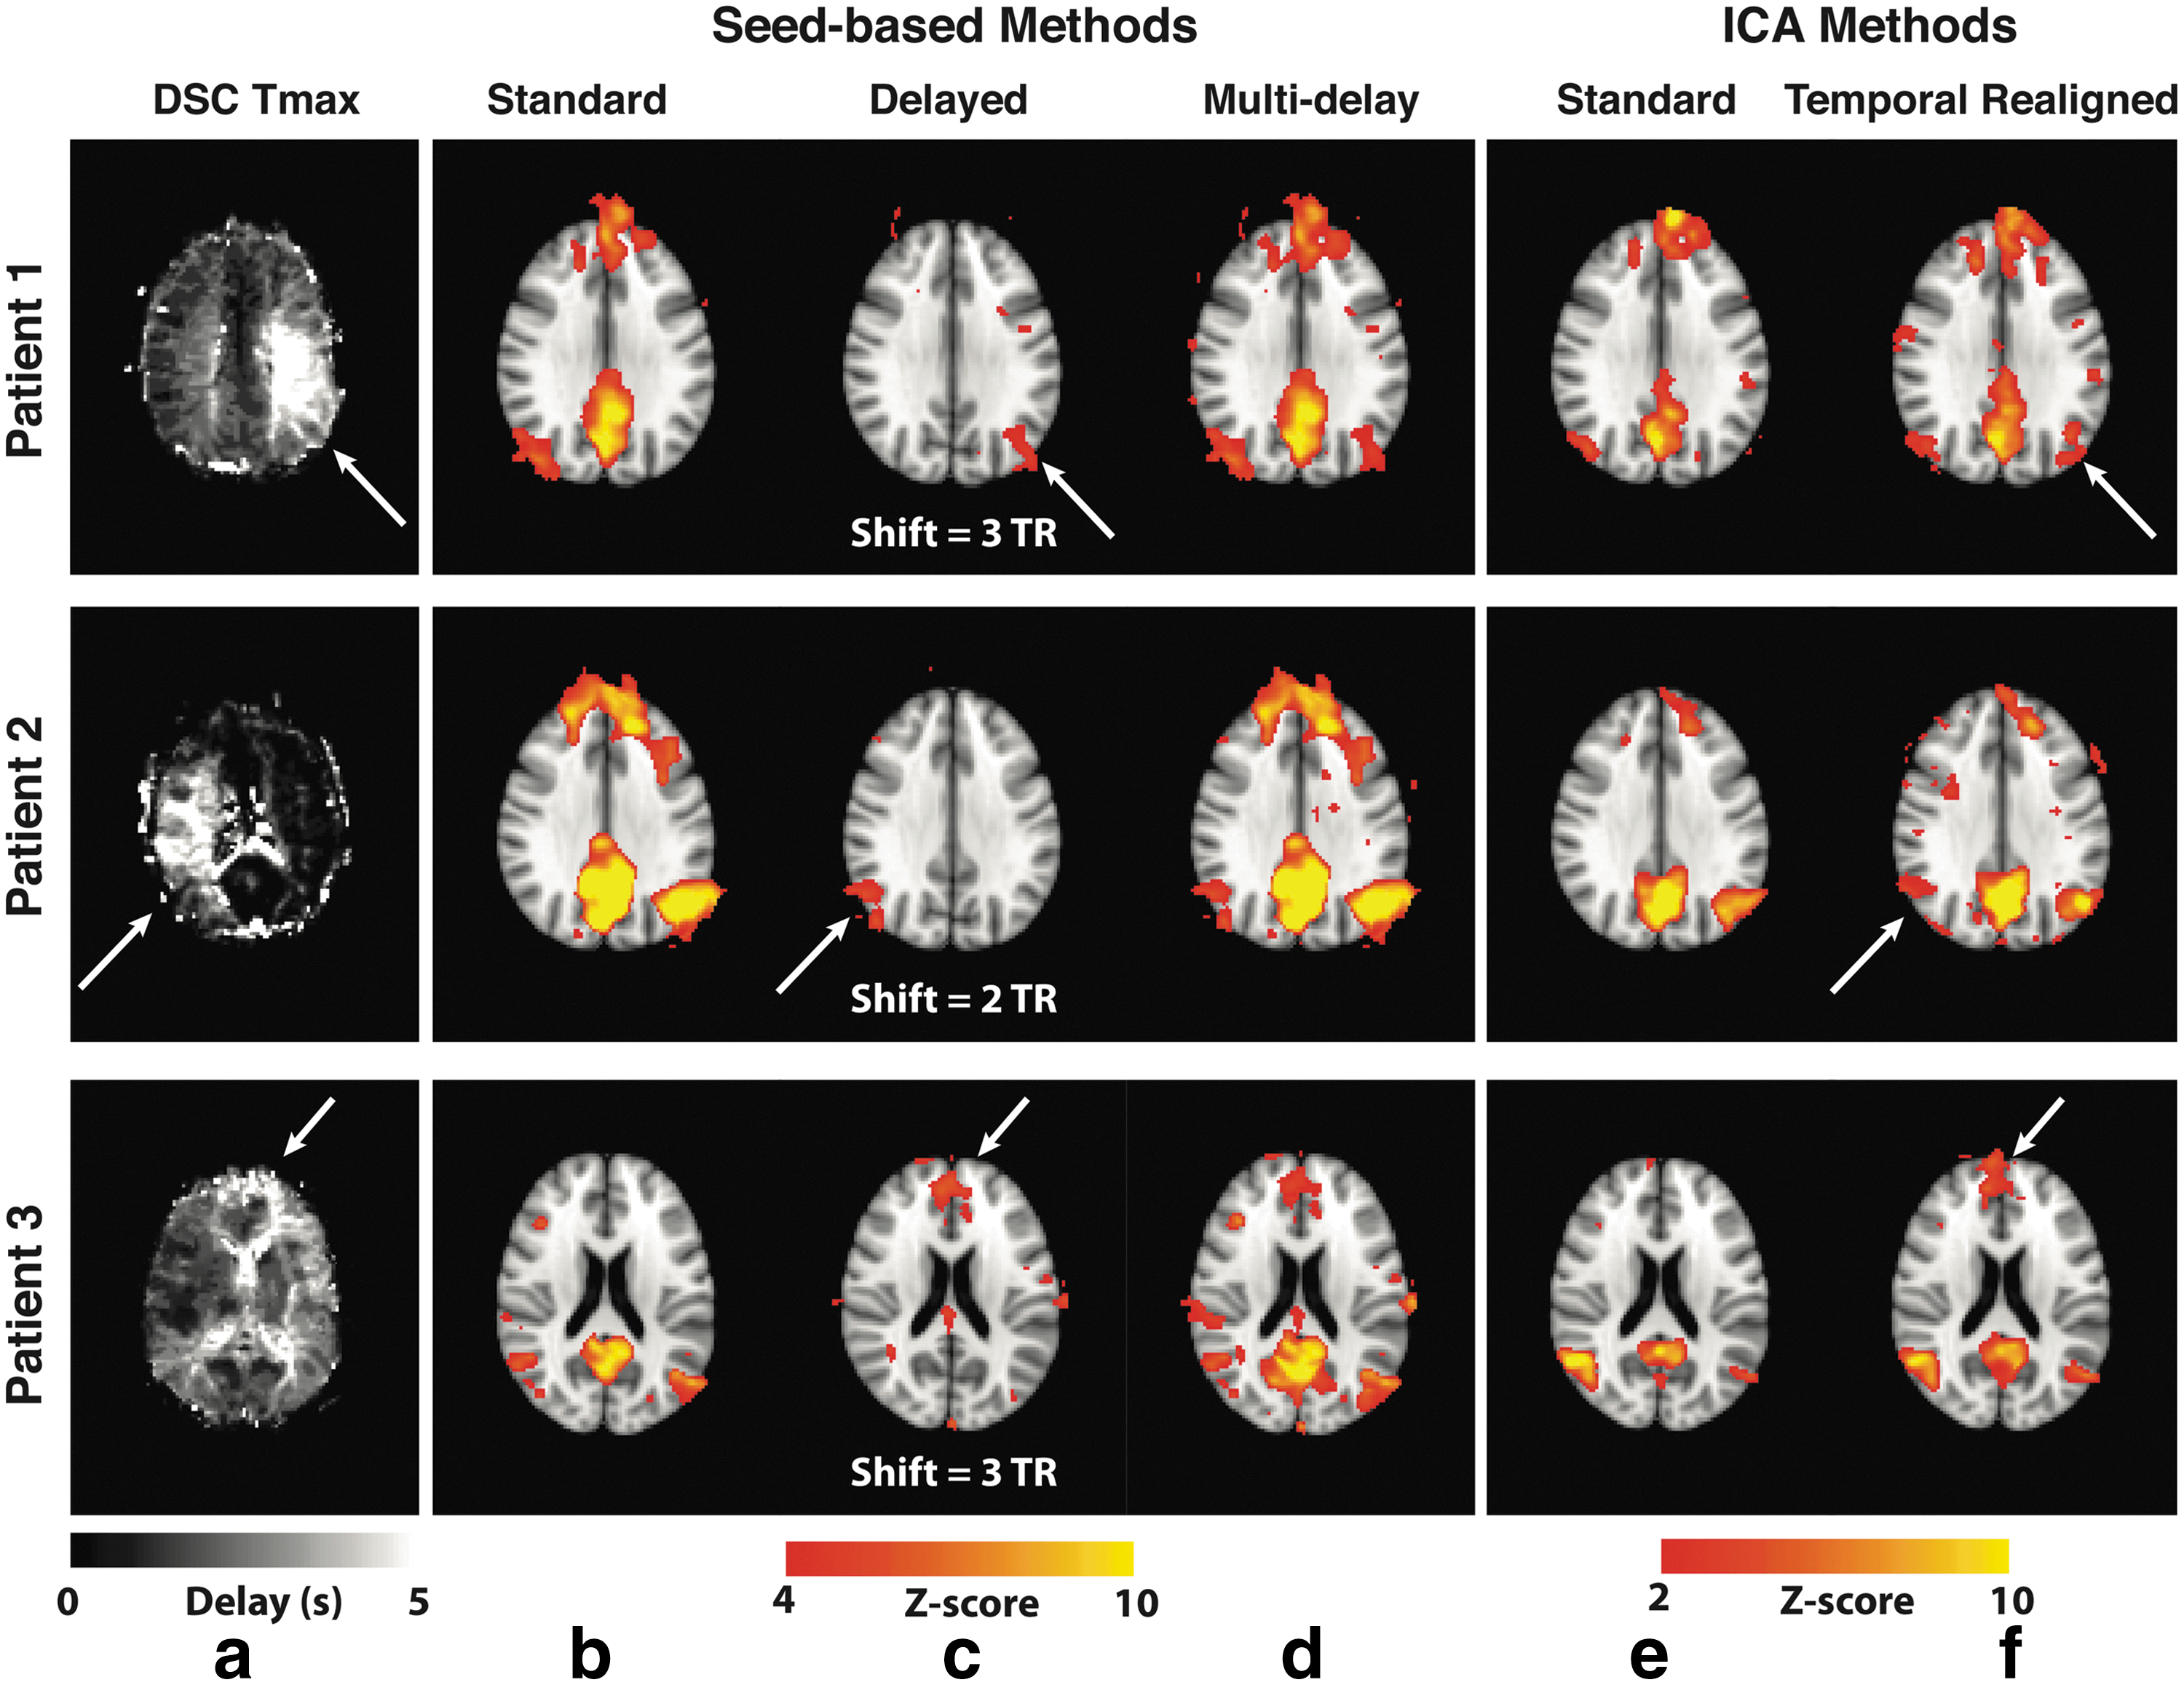
Errors in the DMN connectivity due to arterial arrival delays in three representative Moyamoya disease patients and the effects of the correction strategies for both seed-based analysis and ICA. Tmax map
Figure 5 shows the histogram of these temporal shifts in healthy (Fig. 5a) and Moyamoya (Fig. 5b) cohorts, as well as the average Tmax values within the DMN mask for Moyamoya patients (Fig. 5c), demonstrating no need for multi-delay or temporal realignment correction in normal subjects. The distribution of optimal time shifts in the delayed DMN nodes in the Moyamoya patients and the mean Tmax in these regions demonstrate a similar distribution.
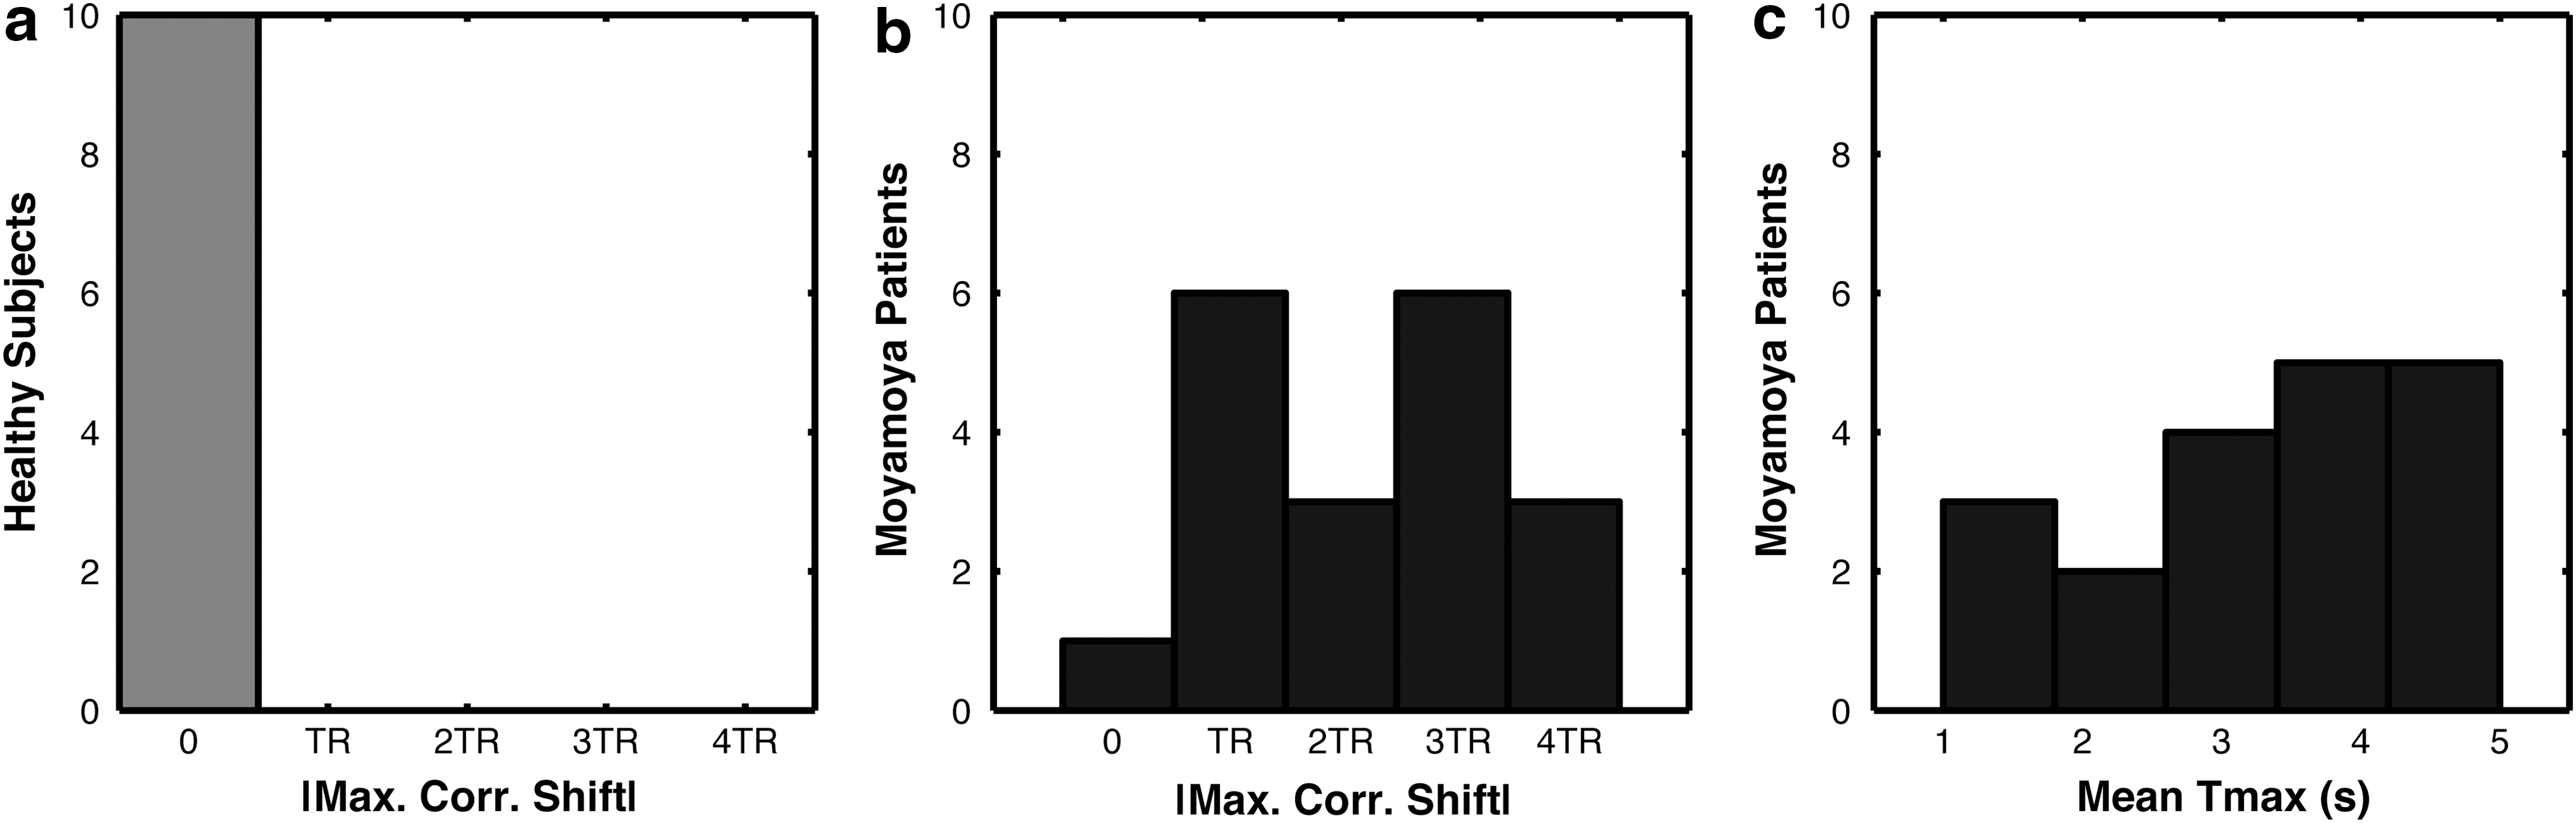
Histogram of absolute temporal shift values that provided the highest correlation in the DMN (max. corr. shift) for
For all Moyamoya patients, we calculated the mean Z-score inside the DMN mask and the SNS before and after correction using the proposed methods. Figure 6a and b shows the results for the standard and multi-delay seed-based approaches, whereas Figure 6c and d shows the results for standard preprocessing and temporal realignment used with the ICA method. Using both correction methods, we observed a significant improvement in both the mean Z-score and SNS in the DMN compared with the standard seed-based and ICA approaches, respectively (p < 0.01). To evaluate the effect of the proposed correction methods when there is no significant delay in the data, we applied the proposed correction methods to the healthy volunteer data and calculated the mean Z-score inside the DMN mask and the SNS before and after correction (Fig. 6e–h). In these subjects without significant delays, the multi-delay approach, similar to its effect on Moyamoya patients, increases the mean Z-score. However, unlike Moyamoya patients, the multi-delay approach reduces the SNS (p < 0.01). The temporal realignment approach does not lead to significant changes in either Z-score or SNS values in healthy volunteers.
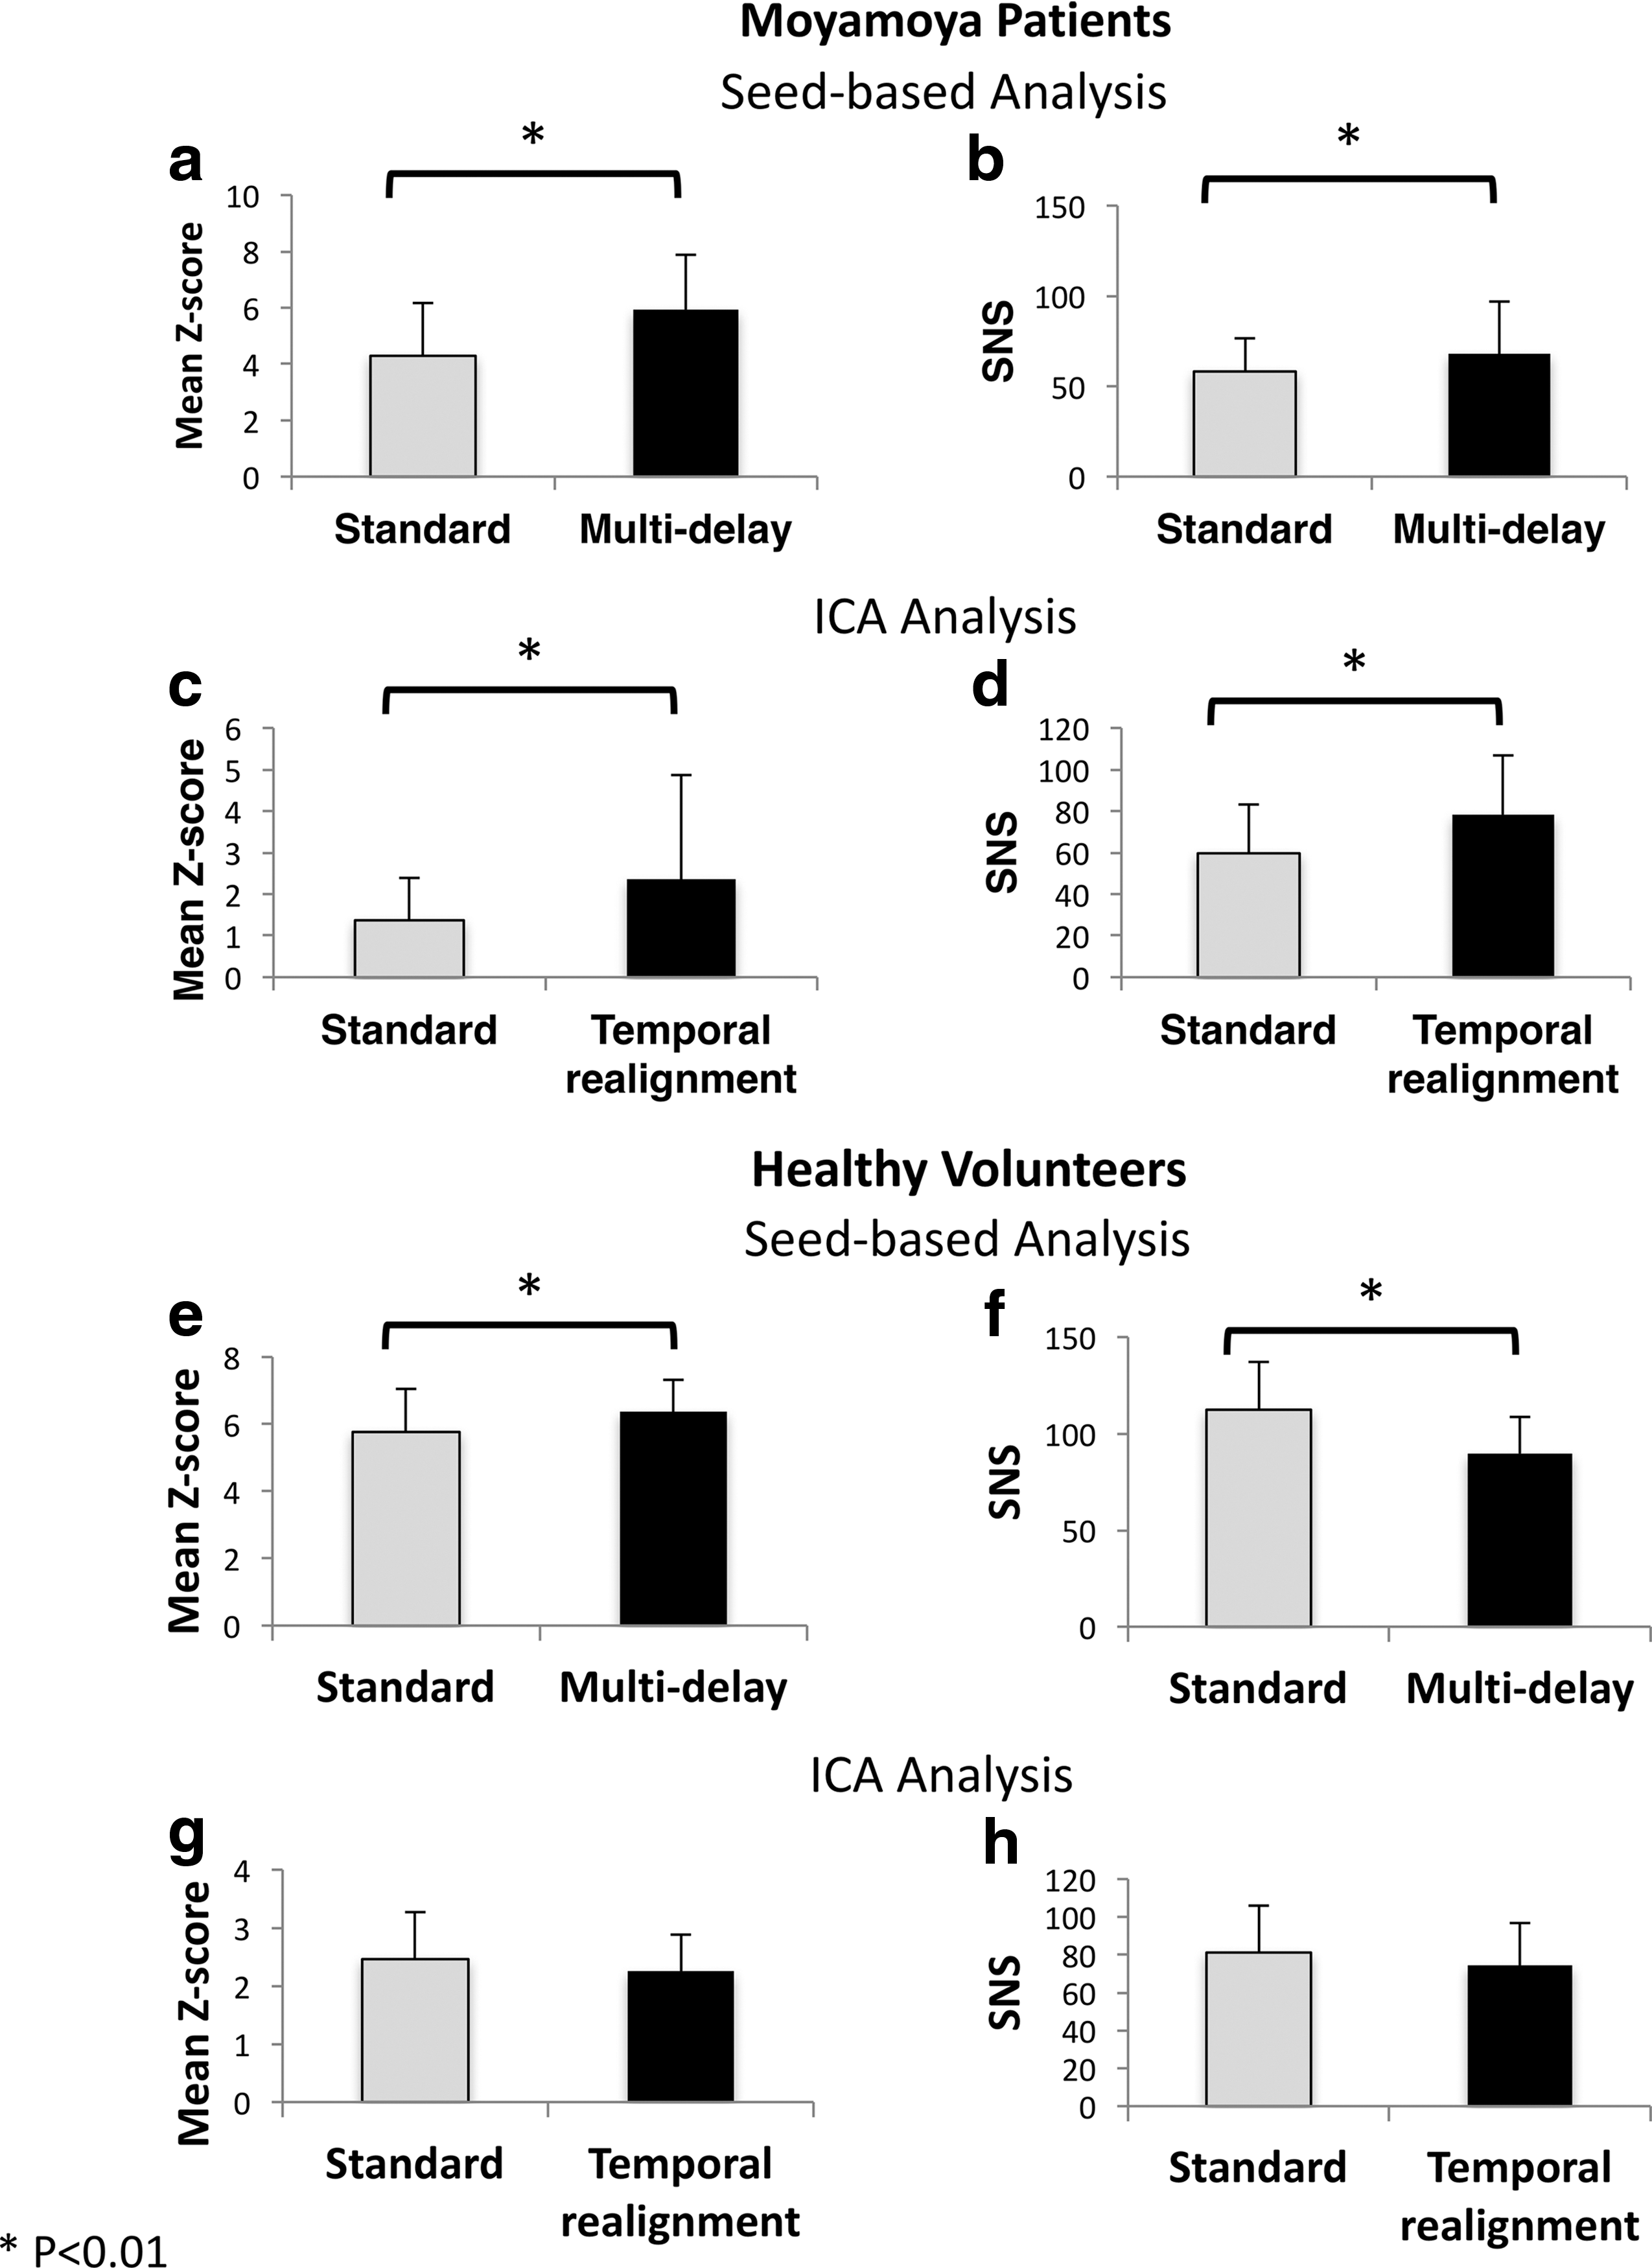
The effect of the proposed analysis methods on mean Z-score and SNS in Moyamoya patients
Since typically only some of the DMN nodes are affected by prolonged arterial arrival time, we also compared the mean Z-score only in the nodes with prolonged delay as defined by DSC Tmax > 3 sec (Fig. 7). As expected, the difference between the measured Z-scores before and after the correction was even more significant (p < 0.001).
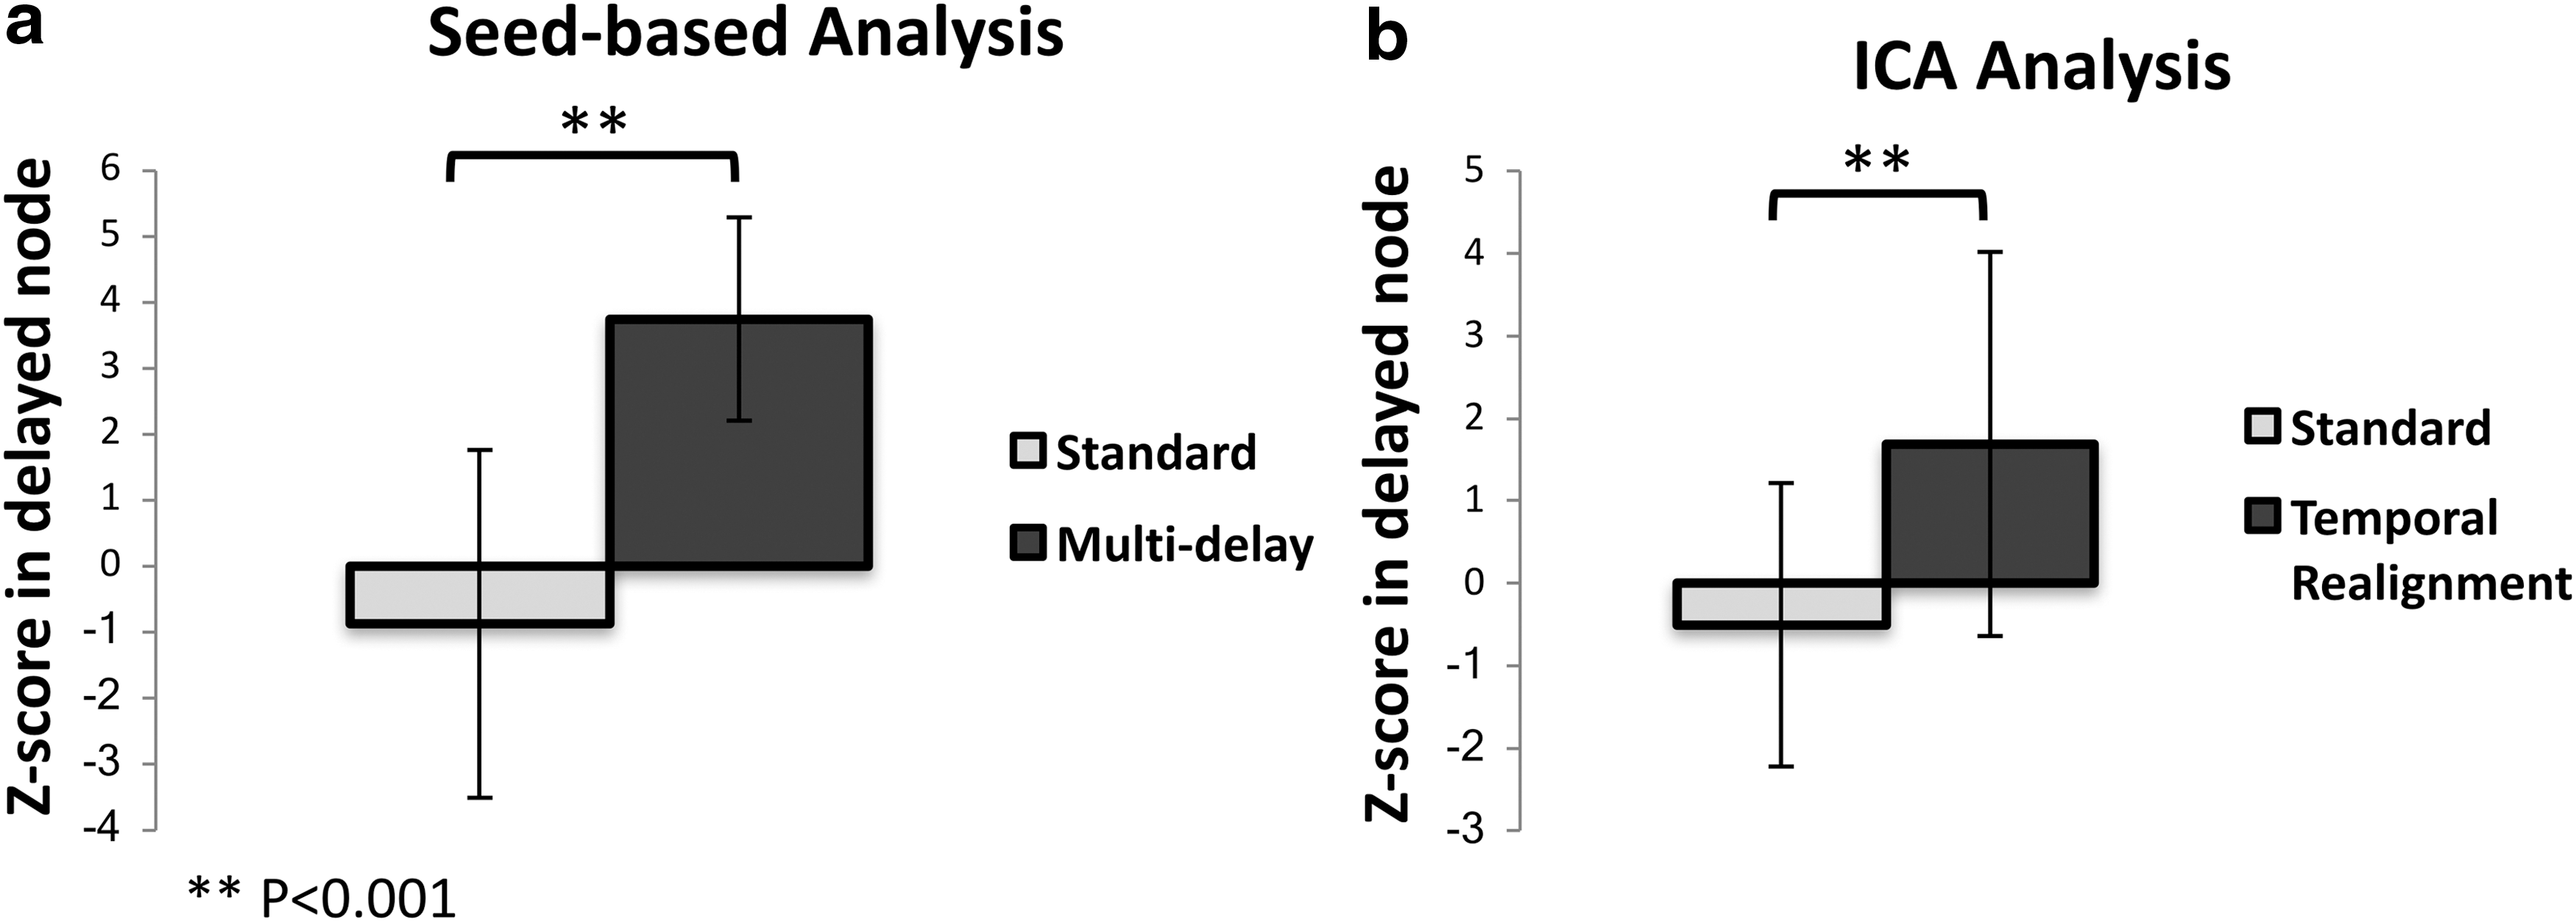
Mean Z-score inside the delayed DMN nodes (defined as nodes where the dynamic susceptibility contrast-based Tmax was ≥3 sec) before and after correction using
Discussion
We studied the DMN in a group of Moyamoya patients using different rs-fMRI analysis approaches and observed significantly weaker connectivity in regions with prolonged arterial arrival time using standard seed-based and ICA methods. Often, these did not pass the significance thresholds typically used and were, therefore, absent in the standard functional connectivity maps. We proposed two approaches to account for the effect of these arrival delays: (1) multi-delay analysis (useful for seed-based analysis) and (2) temporal realignment preprocessing (useful for ICA). When we accounted for the arterial arrival delays, we showed that these nodes exhibit significantly stronger connectivity to the DMN. The relationship between the delays observed in DSC Tmax maps and the shifts providing the maximum correlation in the affected maps strongly suggests that the apparent disruption in connectivity maps in these regions is due to spatial differences in arterial arrival delay rather than true disruptions in neuronal connectivity, in which case it would have been unlikely to be able to recover them with simple temporal shifting techniques.
Studying the origin of the observed “delayed functional connectivity” requires concurrent recording of electrophysiological signals such as EEG or MEG to precisely probe the neuronal coupling between the delayed nodes. However, given the speed of neuronal transmission, it is very unlikely that the delayed connectivity observed in Moyamoya patients to be originated from a “delayed neuronal coupling.” However, given the fact that we do not expect significant connectivity defects in Moyamoya patients (Karzmark et al., 2012), the more likely explanation is that the neuronal coupling between the functional connectivity nodes remains intact in these patients (i.e., neuronal activity in different nodes of DMN is synchronized), but due to the regional prolonged arterial arrival time, the corresponding increase in blood flow and volume, regulated by the hemodynamic response to neuronal activity, is delayed in the affected areas (e.g., some nodes in DMN). Therefore, we observe a temporal delay in the BOLD signal time series measured in the affected area that causes inaccurate functional connectivity measurements.
Tong and others have shown that a major component of the low-frequency fluctuations in the BOLD signal arises from the propagation of endogenous global blood flow and oxygenation fluctuations through the cerebral vasculature, and showed that these fluctuations and their timing differences at different areas of the brain have a confounding effect on resting-state functional connectivity measurements (Tong and Frederick, 2010; Tong et al., 2013, 2015). They have also proposed a method based on estimating and regressing out the delay in global signal on a voxel-wise basis and reported an increase in the specificity of neuronal activity-related functional connectivity measures in healthy volunteers using a seed-based analysis (Erdogan et al., 2016). This technique is similar to the temporal realignment method proposed in this article in terms of estimating the delays in each voxel. The difference is that, in the temporal realignment method, we correct for these delays by temporally shifting the delayed time series, where Erdogan et al. regress out the shifted global signal. Their technique can potentially account for the errors caused by prolonged regional arterial arrival time and be applied to patient populations as well. However, it requires the global signal regression, which could introduce confounds into between-group connectivity comparisons (Saad et al., 2012) and have raised concerns about its use (Chen et al., 2017). The temporal realignment method, however, is independent of other preprocessing steps and can be used with and without global signal regression.
Based on this, weakened connectivity of a node in functional connectivity maps in cerebrovascular disease patients obtained using the standard seed-based and ICA methods does not necessarily correspond to a “functional disconnectivity.” When studying patients with potential arterial arrival delays, it is crucial to account for this to be able to distinguish between true and apparent lack of functional connectivity. Almost all rs-fMRI studies in patients with delays, such as acute and subacute stroke, carotid or intracranial stenosis/occlusion, or Moyamoya disease, do not correct for these effects, and consequently the calculated connectivity maps probably underestimate true connectivity. Based on a brief PubMed search, it appears that at least 200 prior studies of rs-fMRI in patients with cerebrovascular disease would be affected by this error. Also, any changes seen over time in such studies could be related to changes in the underlying arterial arrival times, rather than to changes in actual functional connectivity. For these reasons, we believe all prior rs-fMRI studies in these cohorts should be viewed with caution, and possibly reanalyzed using these correction methods.
Although these correction methods are recommended for rs-fMRI studies in cerebrovascular disease patients, such as those with acute or chronic ischemia (such as Moyamoya disease), they may have even wider applicability as many older subjects, even in the absence of identifiable pathology, have such spatially distinct regions of long arrival delay, particularly in vascular border zone regions (Campbell and Beaulieu, 2006; MacIntosh et al., 2010).
We also emphasize that different correction techniques are required for seed-based analysis and ICA, and as demonstrated in the healthy volunteer data, each could potentially introduce errors. The multi-delay approach involves selecting the highest cross-correlation between the seed time series and time series of individual voxels and, therefore, will cause an overall increase in the connectivity of the voxels both within and outside networks. In the absence of significant arterial arrival delay (e.g., healthy volunteers), the multi-delay approach causes a decrease in SNS. It means that the increase in spurious connectivity (noise) outweighs the increase in within network connectivity (signal). However, the opposite is correct in the presence of arterial arrival delays (e.g., Moyamoya patients), which leads to a significant increase in SNS for these patients when multi-delay approach is used. The temporal realignment, due to the presence of noise in both the voxel time series and the reference time series, can potentially introduce additional noise. However, our measurements in healthy volunteers indicate that the temporal realignment does not affect the mean Z-score and SNS in the DMN. In Moyamoya patients, however, the temporal realignment leads to an increase in both mean Z-score and SNS. Therefore, although both correction methods can potentially introduce new sources of noise in the analysis, since they also provide significant signal gain in the area affected by prolonged arterial arrival time, they improve the accuracy and sensitivity of rs-fMRI measurements in Moyamoya patients.
The definition of SNS in this article is slightly different from the definition of Shirer and associates (2015) where the noise was defined as the value of voxels outside the brain. This definition only accounts for the effects of thermal noise. In this study, we have included the white matter and CSF voxels to account for the physiological noise as well.
Several potential ways exist to improve this study. First, our image acquisition was suboptimal for full functional connectivity analysis, as scan times in these clinical patients (4–6 min) were shorter than usually obtained in rs-fMRI studies in healthy subjects. Therefore, we focused on the DMN as it is one of the most stable networks in the brain that can be robustly detected using shorter scan times. Using longer scan times (∼10 min), it would be possible to more reliably detect other functional connectivity networks (Biswal et al., 2010); we suspect similar effects would be seen in networks other than the DMN, but our collected data are inadequate to prove this. Second, the temporal resolution of time shifts in both correction approaches can be improved beyond the image acquisition TR (∼2 sec in this study). Using interpolation techniques, sub-TR time delays can be measured and applied to the data. In addition, using advanced imaging techniques such as simultaneous multislice imaging (Setsompop et al., 2012) that can be used to reduce the TR (to <0.5 sec), it would be possible to improve the delay estimation precision by filtration of physiological noise (cardiac and respiratory components) and increasing the number of time points (Erdogan et al., 2016; Tong and Frederick, 2014).
Third, the repeatability of these results should be explored. Fourth, since Moyamoya patients without prior strokes have relatively preserved cognition and thus normal neural activity in the delayed regions, we have assumed that the major contribution to these delays arises from changes in the arterial arrival delay. However, these delays could also originate from neuronal impairment. We think this is unlikely given that they can be corrected using simple time shifting methods, but this cannot be proven with our results. Therefore, the origin of these delays in the rs-fMRI signal of Moyamoya patients should be further investigated (e.g., using concurrent EEG/rs-fMRI recording).
In conclusion, our results indicate that accounting for arterial arrival time delays is crucial for analyzing the rs-fMRI data in Moyamoya patients. We showed that these delays considerably change the cross-correlation coefficients and lead to erroneous elimination of affected brain regions from a functional connectivity network. We showed that using the proposed methods (multi-delay analysis and temporal realignment preprocessing), it is possible to solve this problem, whereas standard ICA and seed-based analysis failed. We expect similar effects in other neurological diseases with regional arterial arrival delays, including stroke, carotid occlusion, and even, perhaps, normal aging. These findings bring into question the validity of a large number of prior rs-fMRI studies in these cohorts. Imaging of functional connectivity networks could potentially provide insight into the brain network reorganization in these patient populations. Thus, it is crucial to develop, test, and apply methods to accurately define the functional connectivity networks accounting for temporal delays.
Footnotes
Author Disclosure Statement
No competing financial interests exist.