
Abstract
Accumulating evidence suggests that brain white matter (WM) abnormalities may be central to the pathophysiology of psychotic disorders. In addition, there is evidence that cannabis use and alcohol use each is associated with WM abnormalities. However, there are very limited data on the effects of these substances on WM microstructure in patients with psychosis, especially for those at the early phase of illness. This project aimed to examine the impact of cannabis use and alcohol use on WM tissue in early-phase psychosis (EPP). WM was investigated in 21 patients with EPP using diffusion tensor imaging (DTI) and transverse relaxation time of tissue water (T2), with the primary outcomes being mean fractional anisotropy (FA) and T2. DTI analyses were performed at the full-brain level using tract-based spatial statistics with both DTI and T2 analysis done within a WM volume of interest (VOI) implicated in psychosis (containing the left superior longitudinal fasciculus). Our findings revealed that younger age of onset of regular alcohol use (more than one drink per week) was associated with lower FA values in the left thalamic radiation and left parahippocampal and left amygdalar WM. More frequent lifetime cannabis use was correlated with increased mean full-brain FA. There was no significant relationship found between FA and alcohol or cannabis use within the VOI. Relaxometry analysis revealed trend-level evidence of shortened T2 with later onset of regular alcohol use and with more frequent cannabis use. This study provides novel data demonstrating cortical and subcortical WM findings related to alcohol use in EPP and is the first to combine DTI and relaxometry, relating to this patient population.
Introduction
There is a growing body of evidence suggesting that white matter (WM) pathological changes, especially with regard to myelin maintenance and repair, may be related to clinical symptoms and cognitive deficits observed in psychotic disorders—the disconnection hypothesis (Davis et al., 2003; Friston, 2002). Diffusion tensor imaging (DTI) can inform this hypothesis as it uniquely provides in vivo WM information at the microstructural level. The most widely reported diffusion variable is fractional anisotropy (FA), which, in general, is thought to reflect underlying WM integrity and a vulnerability to processes affecting myelination (Ruest et al., 2011). Other common diffusion measures include the following: mean diffusivity (MD), measuring average magnitude of diffusion in all directions; radial diffusivity (RaD), representing the average water diffusion perpendicular to axonal fibers; and axial diffusivity (AxD) representing the water diffusion parallel to axonal fibers (Basser, 1995; Song et al., 2002).
The majority of published DTI studies in psychotic disorders have focused on chronic psychosis. These studies report decreases in FA values in a number of WM tracts compared with healthy controls (Fitzsimmons et al., 2013). Significantly fewer DTI studies have focused on individuals within the early-phase psychosis (EPP, within the first 5 years of onset); however, recent reviews indicate widespread WM abnormalities similar to the chronic psychosis population but with variations in terms of WM tracts affected (Cookey et al., 2014; Peters et al., 2010). We completed a systematic review that examined the frequency with which each WM tract family was reported as being affected in DTI-EPP studies, with association fiber tracts (superior/inferior longitudinal fasciculi, superior/inferior fronto-occipital fasciculi, and uncinate fasciculi) most often implicated (Cookey et al., 2014). Specifically, the left superior longitudinal fasciculus (SLF), involved with higher order cognitive functioning (e.g., executive functioning), has consistently been found to be disrupted in EPP (Luck et al., 2011; Perez-Iglesias et al., 2010), with further evidence implicating abnormal SLF maturation in the development of psychotic disorders (Peters et al., 2012). However, further DTI-EPP studies reported since our review have not been consistent in their results (Hatton et al., 2014; Prasad et al., 2015; Sun et al., 2015). It thus remains important to (1) use methodology that may further inform DTI results (Wheeler and Voineskos, 2014) and (2) identify and examine potential confounding factors that may differentially affect WM integrity in this clinical cohort.
Measuring extracellular and intracellular transverse relaxation time of tissue water (T2) is one method to further complement DTI examination of WM. T2 reflects the microstructural density of brain tissue, underlying cell size, as well as intracellular molecular mobility, with longer T2 times reflecting less densely packed cells in the brain region of study (MacKay et al., 2006). T2 relaxation studies in chronic schizophrenia have reported prolonged T2 time constants in frontal WM (Du et al., 2012; Tunc-Skarka et al., 2009), and in the anterior corpus callosum (Aydin et al., 2007). Only one identified study previously used relaxometry in the EPP population examining WM, which demonstrated prolongation of T2 time constants in WM (Aydin et al., 2007).
In EPP, alcohol and cannabis are the two most commonly used substances with alcohol and cannabis use disorder rates estimated to be ∼19–33% and 21–43%, respectively, in this population (Abdel-Baki et al., 2017; Koskinen et al., 2009, 2010; Turkington et al., 2009). Therefore, alcohol and cannabis use may represent important confounding factors that may lead to the variability of findings reported in DTI studies in this population. Importantly, cannabis use has been implicated in the maturational process of WM in adolescents and young adults (Arnone et al., 2008; Zalesky et al., 2012). There are significant levels of endocannabinoid receptors found in WM tracts of the brain and on the glial cells responsible for the production and maintenance of WM (e.g., astrocytes and oligodendrocytes) (Molina-Holgado et al., 2002; Romero et al., 1997). It is postulated that early cannabis exposure interacts with these processes causing aberrant WM maturation, triggering psychosis in individuals who are vulnerable (Crocker et al., 2017). Likewise, alcohol use has been found to have neurotoxic effects, including volume reduction and reduced microstructural integrity in WM (Harper et al., 2003; de la Monte and Kril, 2014), and has been found to attenuate WM growth in adolescents (Squeglia et al., 2015). Alcohol consumption may also be associated with smaller WM volumes in patients with schizophrenia (Nesvåg et al., 2007).
In an otherwise healthy population, current evidence reveals that there may be WM deficits occurring related to alcohol and cannabis use, as measured by reduced FA values (Alhassoon et al., 2012; Bühler and Mann, 2011; Gruber et al., 2013; Zalesky et al., 2012). Alcohol users have been found to have reduced FA in a variety of widespread brain regions (Bühler and Mann, 2011); although of note, following a period of extended abstinence, some of these changes may be reversible (Alhassoon et al., 2012). Likewise, cannabis use has also been linked with reduced FA in otherwise healthy individuals, with more significant WM disruption associated with a younger age of onset of cannabis use (Gruber et al., 2013; Zalesky et al., 2012). We are not aware of any studies to date that have investigated alcohol- or cannabis-related WM changes using T2 relaxometry.
Despite the evidence of the detrimental impact that cannabis and alcohol use may have on WM, there is a paucity of studies investigating WM in cannabis/alcohol using patients with EPP. Furthermore, of the previous studies (Dekker et al., 2010; Haller et al., 2013; James et al., 2011; Nesvåg et al., 2007; Peters et al., 2009; Rigucci et al., 2016), only one has controlled for concomitant alcohol and substance use (James et al., 2011). That study focused on a young population (ages 13–18 years) below the peak age of psychosis onset (APA, 2013) and although recent substance use disorders were controlled for, lifetime substance use/exposure was not.
The work presented here aimed to further investigate the impact of alcohol use and cannabis use on brain WM while accounting for lifetime substance exposure, combining the use of DTI and T2 relaxation time constants of tissue water to aid in the interpretation of results. A WM volume of interest (VOI), including part of the left SLF, was selected, as most recent evidence points to WM abnormalities in this area (Hatton et al., 2014; Prasad et al., 2015; Sun et al., 2015; Szeszko et al., 2018). In addition, as per previous work from our group (Bernier et al., 2014), we have been able to confirm that this VOI consistently contains >95% WM, which allows for more accurate interpretation of T2 relaxation findings. We predicted that in the EPP population, greater cumulative lifetime cannabis and alcohol exposure would correlate with lower mean WM FA values and increased T2 times. We also hypothesized that mean FA values and T2 times would correlate with clinical measures and cognitive performance. In addition, we explored the impact of early alcohol use on age at illness onset as well as the effect of duration of illness on mean FA. We included three other diffusion measures (RaD, AxD, and MD) to help further interpret the findings.
Materials and Methods
Participants
Recruitment of EPP patients between 19 and 35 years of age was conducted at the Nova Scotia Early Psychosis Program (NSEPP). The term EPP for this study applied to patients followed at this clinic who are typically less than 5 years (although occasionally longer) from diagnosis of psychosis and initiation of appropriate medical treatment. DSM-IV-TR (fourth edition, text revision of DSM [Diagnostic and Statistical Manual of Mental Disorders]) diagnosis was provided by the treating psychiatrist and confirmed by PT, Director of NSEPP. Cannabis/substance use history was determined via interview using a questionnaire based on the Structured Clinical Interview for DSM-IV-TR Axis I Disorders (SCID-I) (First et al., 2002) as well as the Timeline Followback method to collect detailed information about lifetime history and current use of a large variety of illicit substances, alcohol, and nicotine (Robinson et al., 2014). Medication history was collected for all participants, including detailed history of all psychotropic medications. All participants met magnetic resonance imaging (MRI) inclusion criteria as per the MRI safety checklist.
Participants with tobacco, alcohol, and cannabis use disor ders were included, while participants were excluded for lifetime history of substance use disorder for any other substances; DSM-IV-TR criteria were used. Participants were also excluded for head injury with loss of consciousness or seizure; a BMI below normal range (less than 18.5), or above class I obesity (above 35); and participants had to be naive or have had minimal experimentation history with all other illicit substances (less than 20 lifetime occasions). In total, 21 participants were included in this study. This study was approved by the local institutional research ethics board and informed consent was obtained from all subjects.
Clinical measures
The SCID-I was administered to patients for diagnostic confirmation (First et al., 2002). Clinical rating scales collected included the following: the Positive and Negative Syndrome Scale (PANSS) (Kay et al., 1987; Van den Oord et al., 2006), the Personal and Social Performance Scale (Morosini et al., 2000), the Hamilton Anxiety Scale, and the Calgary Depression Scale for Schizophrenia (Addington et al., 1990; Maier et al., 1988). The Screen for Cognitive Impairment in Psychiatry (SCIP) was administered to all participants to assess five cognitive domains: working memory test, verbal learning test_immediate, verbal learning test_delayed, verbal fluency test, and psychomotor speed test (Purdon, 2005). The Edinburgh Handedness Inventory was administered as handedness (Oldfield, 1971) and has been reported to impact DTI measures of WM microstructure (Jang et al., 2017; Westerhausen et al., 2004).
MRI acquisition and analysis
Neuroimaging data were acquired with a GE HD 23.0 Twinspeed 1.5 Tesla scanner (GE Healthcare, Waukesha, WI) equipped with an eight-channel head coil. A longitudinal relaxation time (T1)-weighted spoiled gradient recalled (SPGR) structural scan was first acquired. Diffusion-weighted images were collected using the following parameters: 60 axial slices; repetition time (TR) = 8.5 sec; echo time (TE) = 80–90 msec; flip angle 90 degrees; 54 noncollinear diffusion weighting directions with a b-factor of 1000 sec/mm2; six acquisitions with a b-factor ∼0 sec/mm2; 256 × 256 acquisition matrix; 260 mm field of view, generating 1.02 × 1.02 × 3 mm3 voxels.
Postprocessing of DTI data was done with Functional MRI of the Brain (FMRIB) Software Library (FSL) (Smith et al., 2004). DTI data were processed and analyzed using FSL's Diffusion Toolbox (FDT). All data underwent an initial visual quality check, including scanning through all the volumes for any obvious artifacts and excessive head motion. The first 6 volumes (b = 0) were averaged and used for signal-to-noise ratio calculations (SNR). Eddy current correction and simple head motion correction were completed using affine registration to the reference volume. Any scan with visible artifacts, excessive head motion, or an SNR below 15, was excluded from the study (Smith et al., 2007). The diffusion tensor model was then fit to each anatomical voxel using DTIFIT.
The diffusion data were then analyzed using tract-based spatial statistics (TBSS) (Smith et al., 2006). All subjects' FA data were then aligned into a common space using the FMRIB's Nonlinear Image Registration Tool (FNIRT) (Andersson et al., 2007a, 2007b). The mean FA image was created and thinned to form a skeletonized mean FA image representing the center of the tracts common to the group. Each subject's data were projected onto this skeleton, which was then used in the statistical analysis. The original nonlinear registration was also applied to the non-FA diffusion data (i.e., MD, AxD, and RaD), was merged into a single four-dimensional data file, and was projected onto the mean FA skeleton before running the voxelwise statistics. The VOI mask was manually defined on the raw T1-weighted images (Fig. 1) and this was transformed into the DTI space. The VOI placement was done by one investigator (unblinded—J.C. or D.B.), then was cross checked for reliability by a second investigator (blinded—J.C. or D.B.). Mean FA was thus calculated for the full-brain WM as well as for the left SLF WM volume using the full-brain WM and VOI masks, respectively. This was completed using the fslmaths tool in FSL.
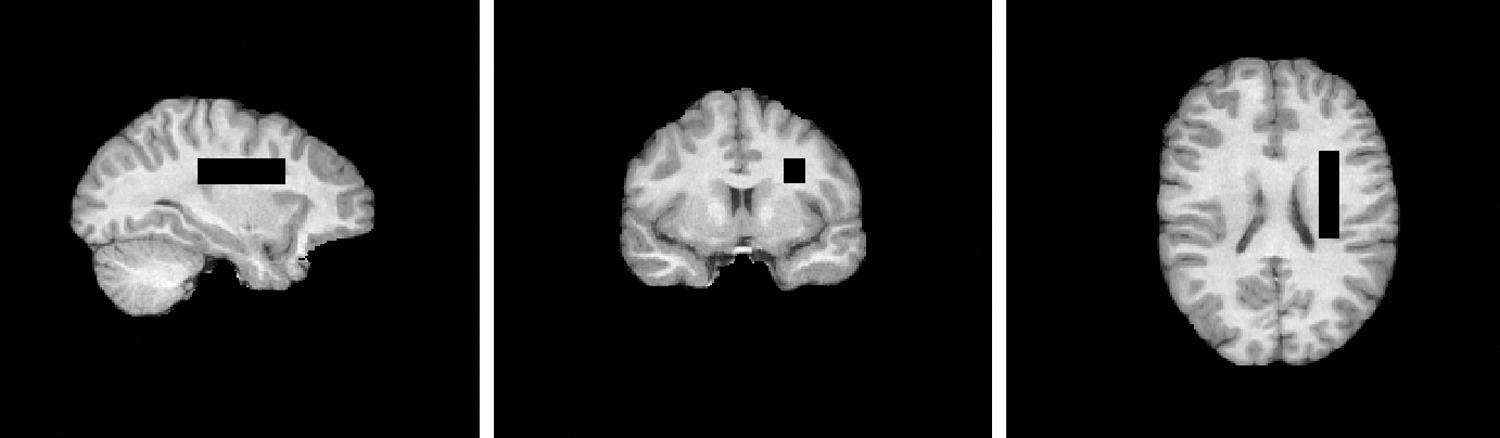
Region of interest—left superior longitudinal fasciculus dimensions: 11 mm (right/left), 45 mm (anterior/posterior), and 13 mm (superior/inferior). Landmarks used included 3 mm posterior to the posterior commissure (posterior border); the inferior boundary of the midbody region of corpus callosum (inferior edge); and the first slice lateral to the lateral edge of the caudate (medial border).
T2 relaxometry data were acquired in the VOI using the following parameters: TR = 10 sec; TEs = 50, 60, 80, 120, 180, 350, 600, 800, 1000 msec; number of excitations (NEX) = 4. This range of TEs was selected to minimize the influence of myelin water and cerebrospinal fluid in the estimates of tissue water constants (MacKay et al., 2006).
Water concentration was calculated as the area under the peak from the frequency domain of each TE using MATLAB script (Gilat, 2004). T2 time constants were estimated using the Curve Fitting Tool in MATLAB (version r2017a) (MathWorks, Inc., 2017.) based on the corresponding reduction in amplitude of the water concentration as a function of TE as a monoexponential decay. The decay curve of water can be divided into three components generally thought to correspond to three different tissue compartments: cerebrospinal fluid (>2 sec), intra/extracellular tissue (70–90 msec), and myelin water (<50 msec) (MacKay et al., 2006). The TE times selected for this study therefore primarily reflect intra/extracellular tissue water.
Statistical analyses
Visualization of data, normality testing, and correlation analysis were conducted using Statistical Package for the Social Sciences (SPSS; IBM corporation, version 22). Statistical analyses were two tailed with alpha set at 0.05, unless otherwise specified. Based on visual inspection of data histograms and normality testing, Spearman's rho was used to assess for potential relationships between mean full-brain WM FA values and duration of illness; cognition (SCIP); symptom severity (PANSS); cumulative measures of substance use (cannabis, alcohol, tobacco, and illicit substance use); and age of onset of regular use.
Voxelwise statistics was computed on the skeletonized DTI data using the randomize tool (FSL), using threshold-free cluster enhancement (TFCE) and fully corrected for multiple comparisons (Smith and Nichols, 2009). Exploratory analyses consisted of multiple bivariate correlations between mean full-brain WM FA values on the one hand, and measures of substance use (cannabis, alcohol, tobacco, and illicit substance use), duration of illness, cognition (SCIP), and symptom severity (PANSS) on the other hand. Importantly, multiple regression analysis was used to model the potential interaction between cannabis use and alcohol use on WM. Regression models included as covariates: age, age of illness onset, BMI, and gender. When multiple comparisons were involved, the alpha value was adjusted to correct for familywise error using Bonferroni's method.
Results
Demographic and clinical variables
A total of 23 participants completed the clinical measures as well as the MRI scanning, with the total number of participants retained in the DTI analysis being 21 (one participant excluded due to low SNR (14) and one excluded due to poor image quality). The analyses of T2 relaxation times had data available for 18 patients—with three participants excluded due to excessive head motion during relaxometry data collection (insufficient data quality). The demographic and clinical variables for the pool of 21 participants are presented in Table 1. Of the included participants, two had a tobacco use disorder, six had a cannabis use disorder, and one had an alcohol use disorder.
Demographic and Clinical Characteristics
Regular alcohol use defined as once a week or more.
BMI, body mass index; CPZ, chlorpromazine equivalents; M/F, male/female; PANSS, Positive and Negative Syndrome Scale (subscales: P, positive symptoms, N, negative symptoms, G, general psychopathology); R/L, right/left; SCIP, Screen for Cognitive Impairment in Psychiatry (subscales: VLT_I, verbal learning test_immediate; WMT, working memory test; VFT, verbal fluency test; VLT_D, verbal learning test_delayed; PST, psychomotor speed test); SD, standard deviation.
Diffusion data and substance use
There was a significant association between younger age at onset of regular alcohol use and lower full-brain mean FA values, r = 0.53, p = 0.030, accounting for 28% of the variance (Fig. 2). Following TBSS analysis assessing for correlations between age at onset of regular alcohol use and FA, this association remained significant after correcting for multiple comparisons, with the three primary areas affected being the left parahippocampal, left amygdalar, and left thalamic WM regions (Table 2; Fig. 3). Mean FA values within the VOI were not significantly correlated with age of onset of regular alcohol use. There were no significant findings from TBSS analysis with the other diffusion measures (RaD, AxD, and MD) in relation to age at onset of regular alcohol use. There were no significant relationships found between any of the diffusion measures and lifetime amount of alcohol use.

Correlation of age of onset of regular alcohol use with mean full-brain FA. FA, fractional anisotropy.
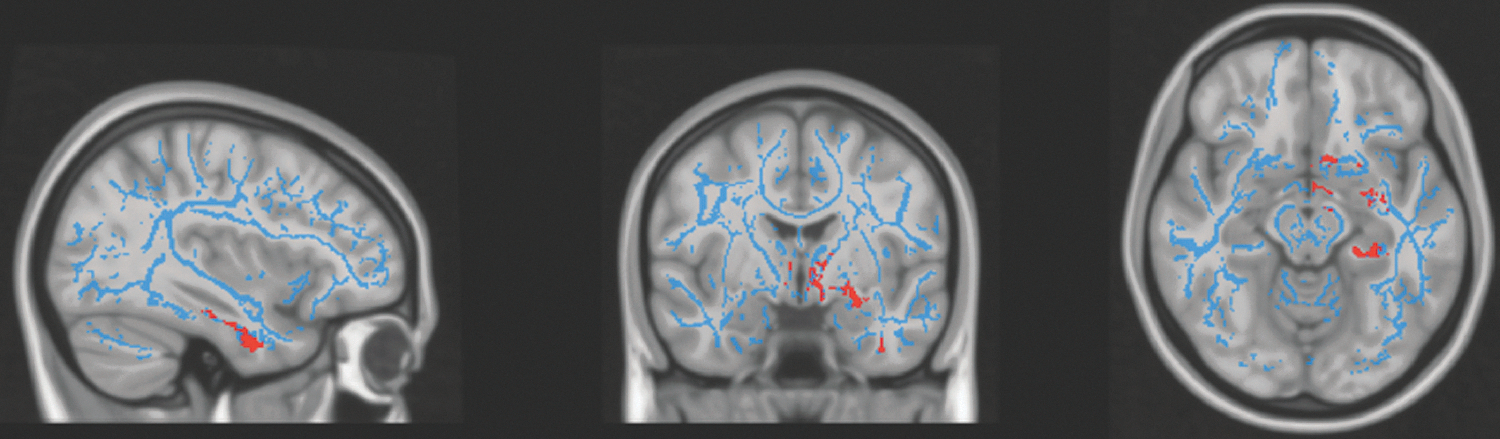
Areas demonstrating WM abnormalities (red). Largest effects/clusters: left parahippocampal, left amygdalar, and left thalamic WM regions. FA skeleton (blue) overlaid on MNI 152 T1 template. WM, white matter.
Clusters Showing Significant Correlations Between Age at Onset of Regular Alcohol Use and Reduced Fractional Anisotropy Values
Cluster size >50 contiguous voxels.
MNI coordinates of maximum value for each cluster.
Max value, maximum intensity within the cluster; MNI, Montreal Neurological Institute; JHU, Johns Hopkins University; L, left; R, right; WM, white matter.
Correlation analysis on the mean full-brain WM data revealed a significant positive relationship between lifetime cannabis exposure (occasions) and mean WM FA, r = 0.44, p = 0.046, which corresponds to 19% of the variance in mean FA accounted for. However, this relationship was not found to be statistically significant following TBSS analysis assessing for correlations between cannabis exposure and FA. There were no significant findings from TBSS analysis with the other diffusion measures (RaD, AxD, and MD) in relation to occasions of cannabis use. Furthermore, there was no significant relationship found between lifetime cannabis use occasions and mean FA within the specific VOI.
On regression analysis, there was no significant interaction effect on the outcome of mean FA values found between cannabis use and alcohol. There were no significant relationships between mean FA values and tobacco use or other substance use.
T2 relaxation data
There was trend-level evidence of a negative correlation between lifetime cannabis exposure (occasions) and T2 times, r = −0.43, p = 0.07, as well as age at onset of regular alcohol use and T2 times, r = −0.48, p = 0.08. On regression analysis, there was no significant interaction effect on the outcome of T2 relaxation times found between cannabis use and alcohol. Otherwise, there were no significant relationships found between T2 times and measures of other substance use (tobacco or illicit drug use), duration of illness, or clinical measures.
Clinical measures
Correlations between mean FA values (VOI and full brain) and symptom/cognitive scores revealed no significant relationships. However, it was found that longer duration of illness was associated with a lower mean FA value at the full-brain level, r = −0.57, p = 0.007, which accounted for 32% of the variance (Fig. 4). This correlation remained fairly strong following adjustment for age, r = −0.503, p = 0.024. There was no significant relationship between mean FA value and duration of illness within the VOI.
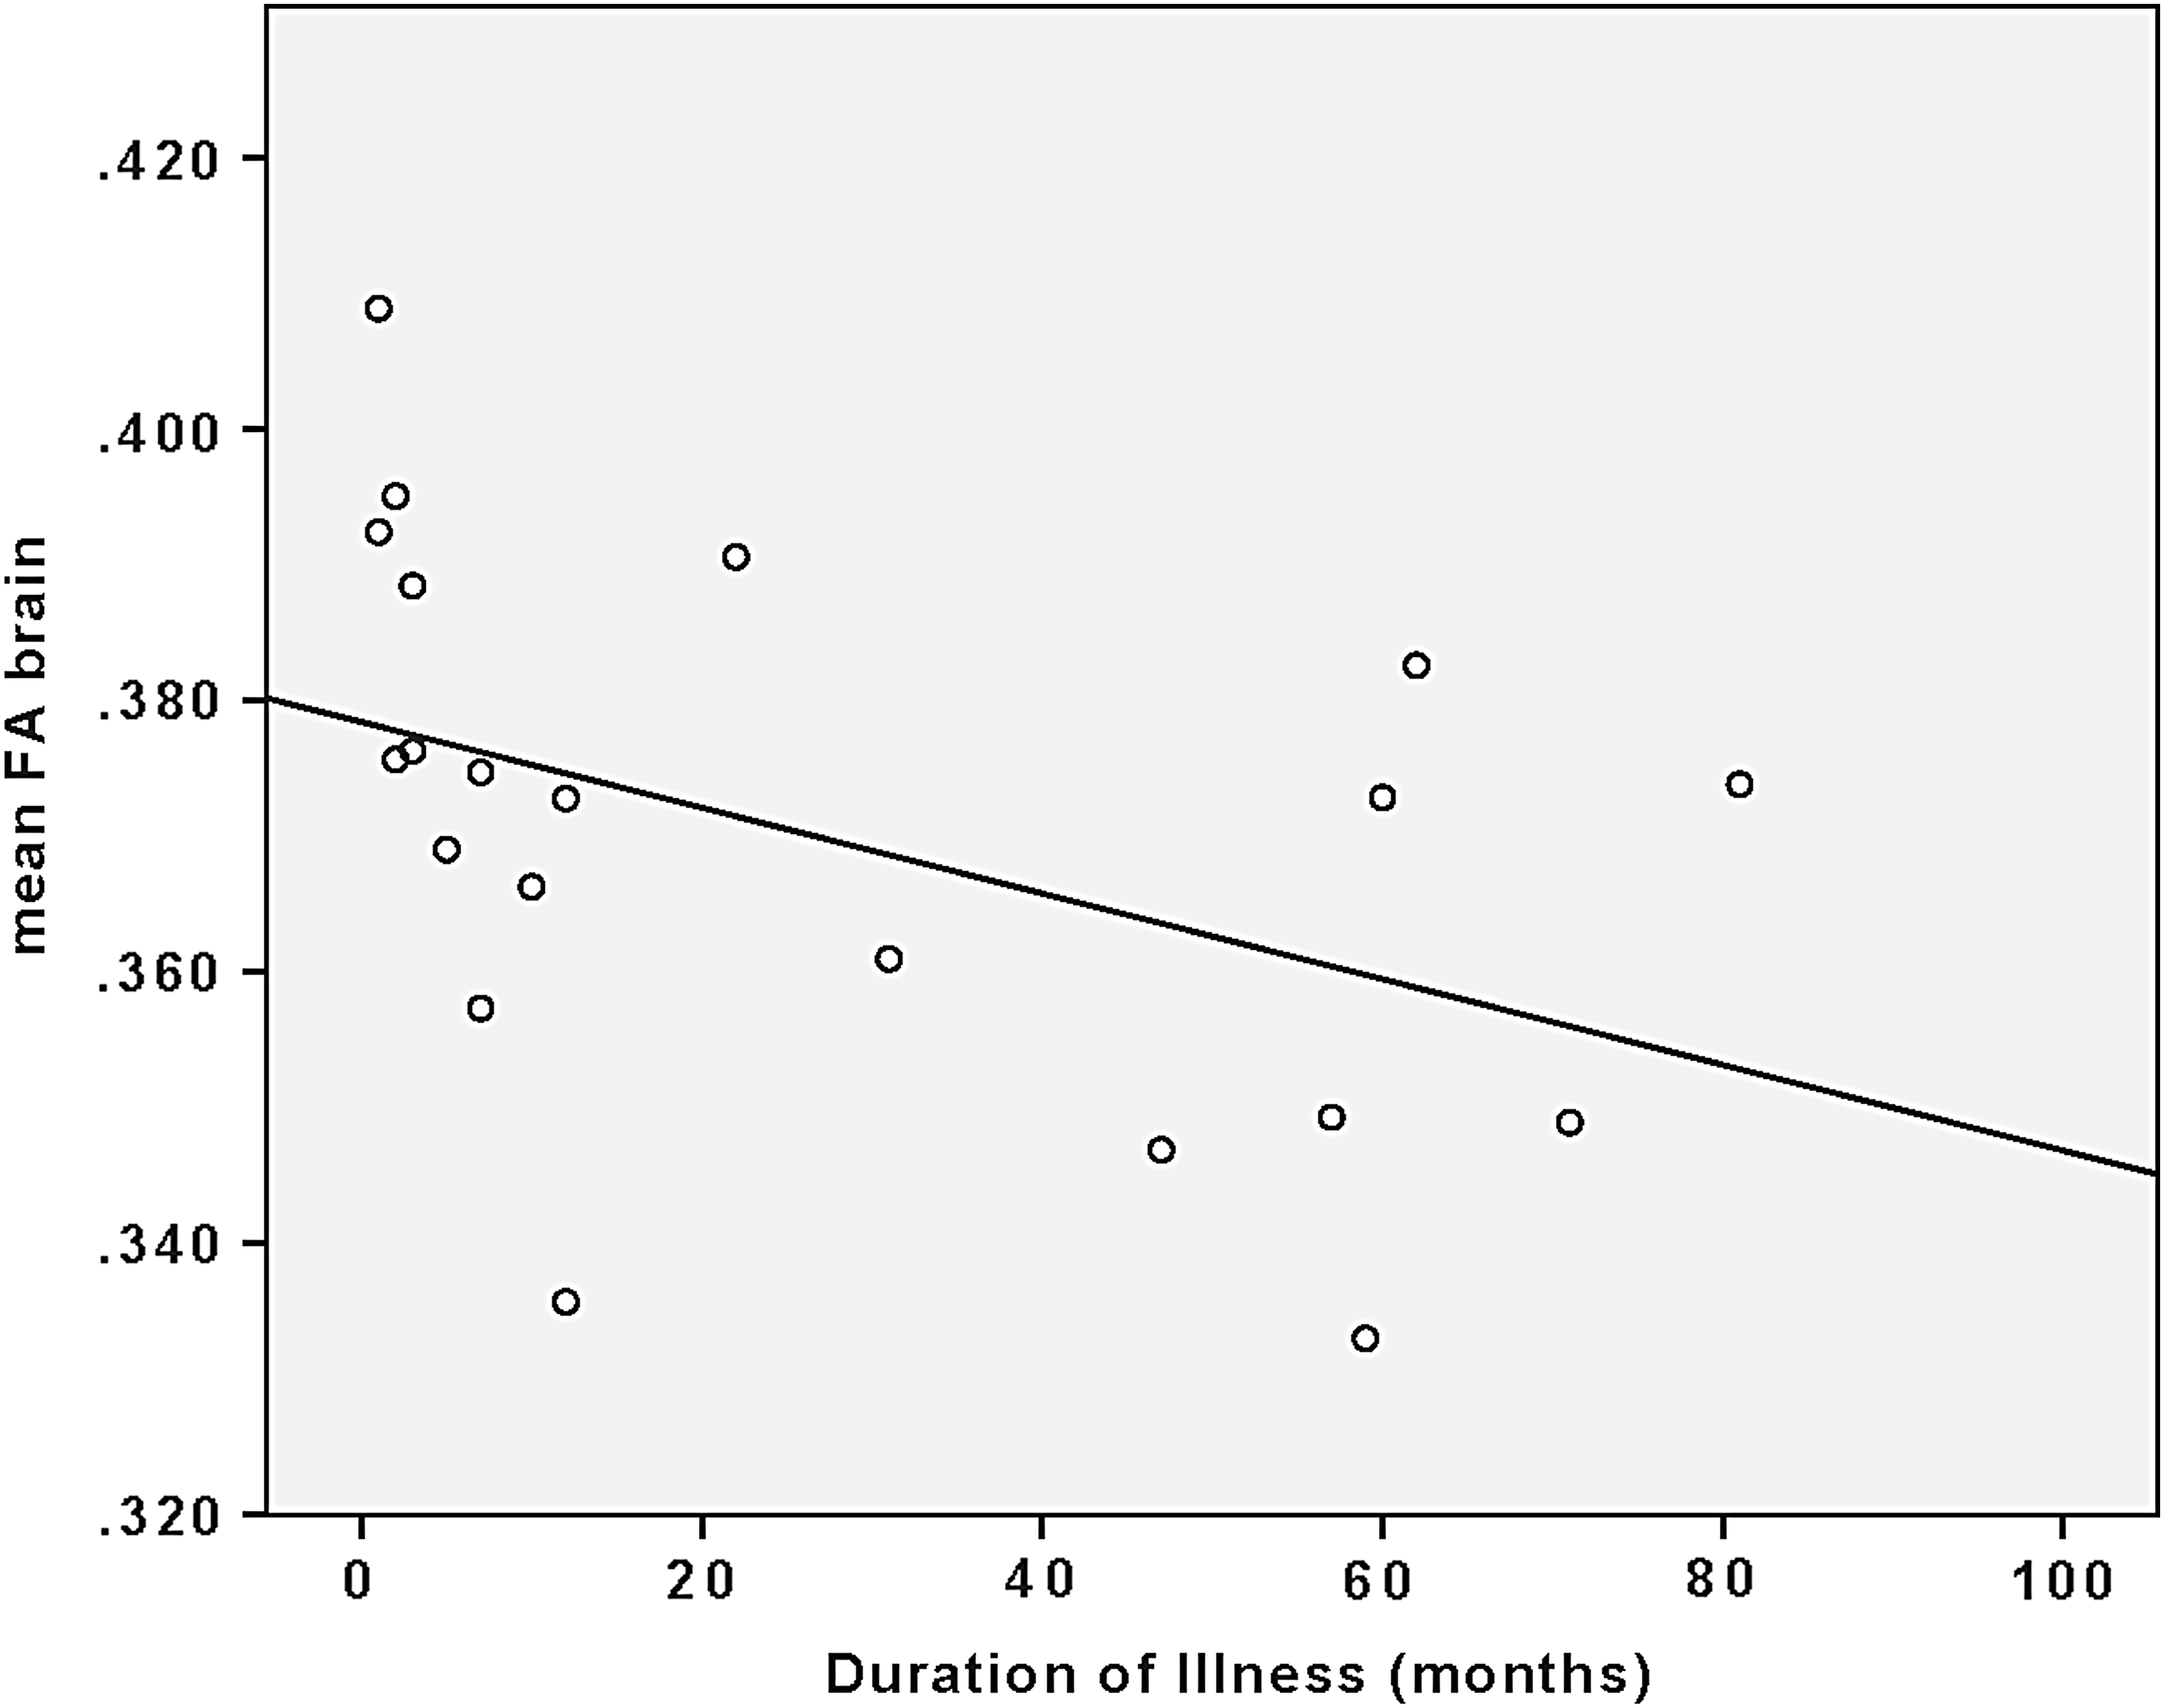
Correlation of duration of illness with mean full-brain FA.
Interestingly, age at onset of regular alcohol use was positively correlated with age of illness onset (r = 0.62, p = 0.008).
Discussion
The present study aimed at examining the impact of cannabis and alcohol use on WM in EPP patients. There is a paucity of EPP-DTI studies controlling for concomitant substance use disorders, which has limited the specificity and utility of existing data. In this study, we were able to account for these factors. Our results may reflect a detrimental effect of early alcohol use on the developing brain, or alternatively may represent a pre-existing biomarker of a propensity to use alcohol from an early age in this clinical population. Of note, the lifetime amount of alcohol use was not associated with measurable WM abnormalities, which indicates that age of onset of alcohol use, rather than quantity of use, may be the key factor driving this finding, suggesting that neurodevelopmental timing of exposure may be of primary importance. Alternatively, it could also indicate a more generalized dysregulated pattern of neurodevelopment in those with EPP who have earlier onset of alcohol use.
The three WM areas primarily found to be affected by earlier onset of alcohol use were the left parahippocampal, left amygdalar, and left thalamic WM regions. Medial temporal structures (including the parahippocampal gyrus and amygdala) have been implicated in schizophrenia (Shenton et al., 2001) as well as the thalamus and its adjacent WM (Andreasen et al., 1994). Decreases in the volumes of this region have also been associated with an earlier age of onset of alcohol consumption (De Bellis et al., 2000). In addition, previous findings have found abnormalities in these structures within the EPP population (Huang et al., 2017; Prasad et al., 2004; Watson et al., 2012). The parahippocampus is thought to be primarily involved in spatial and nonspatial memory, as well as in attention, working memory, and executive functioning (Burwell, 2000; Crespo-Facorro et al., 2007), found to be negatively affected in EPP (Bilder et al., 2000). The amygdala may be involved in the emotional processing of abnormalities in schizophrenia (Crespo-Facorro et al., 2007), while defects in sensory gating and filtering are thought to underlie the mechanism by which the thalamus may cause psychotic symptoms (Andreasen et al., 1994), and may be involved in the abnormal functioning of these processes in psychosis.
Regarding cannabis use, at the full-brain level, there may be a positive relationship between cannabis exposure and mean FA, which is contrary to our initial hypothesis. These findings, however, did not reach statistical significance using TBSS with TFCE, which may indicate widespread abnormalities related to cannabis use as opposed to being localized to any specific area.
Looking more broadly at the literature, the majority of DTI studies generally show lower FA values with cannabis use (Cookey et al., 2014), whereas here the trend was toward higher FA values. It remains unclear whether this is necessarily something that improves the function in these WM tracts, or causes dysfunction. For example, there have been findings of higher FA values in other clinical populations (e.g., mood disorders), which would suggest that higher FA values (like lower FA) can also reflect dysfunctional WM microstructure (Sexton et al., 2009). There were no significant changes found within the left SLF VOI for either alcohol use or cannabis use, indicating that the selected region may not necessarily be impacted by these substances.
The addition of relaxometry analysis within the VOI revealed a trend of greater cannabis exposure being associated with shorter T2 times. This finding would fit with the trend of increased FA with cannabis exposure and would possibly indicate more densely packed cells within the VOI in addition to increased WM integrity. There was also a trend for earlier alcohol use being associated with longer T2 times, suggesting a possible association with less densely packed cells. However, caution should be used in interpreting these findings as they are novel and only preliminary in nature.
Surprisingly, our findings show no significant correlations between cognitive function and mean FA values or T2 times. This may, in part, be due to the fact that changes in diffusion and relaxometry values can be very small, and so to detect WM changes related to specific cognitive functions, it may be necessary to use targeted, smaller regions corresponding to areas of the brain known to be involved in the specific cognitive domain being tested (Alexander et al., 2007). A similar logic may explain our negative findings in symptomology. Also, the PANSS scores in our sample were relatively low (Table 1) when compared with average PANSS scores in the literature, corresponding to low clinical severity in our EPP subjects (Kay et al., 1987; Leucht et al., 2005). The relationship between clinical symptomatology and WM may be more obvious in a clinically more symptomatic EPP sample.
We expected that patients with a longer duration of illness would likely have decreased mean FA values. In support of this hypothesis, there was in fact a significant negative correlation at the full-brain level, between the duration of illness and decreased FA values. This result supports the hypothesis that the duration of psychosis itself may have a neurotoxic impact on the brain (Anderson et al., 2014), which perhaps can be detected in WM even at an early stage in the illness.
Another notable finding in exploratory analysis was the correlation between earlier onset of regular alcohol use and earlier onset of psychosis. This would imply that early alcohol use may hasten the onset of psychosis in those predisposed to the illness. This is not unreasonable to suggest, given work by other groups showing that one of the predominant regions affected by adolescent alcohol use is the frontal cortex (Silveri et al., 2016). This finding, if replicated, would have significant clinical implications and would add more weight to the importance of educating youth about the deleterious effects of early alcohol use.
Although this study used commonly used and well-described data analysis methods, there remains significant heterogeneity between studies, and therefore, future studies should strive to use more consistent (and perhaps more clearly prescribed) DTI and relaxometry analysis methodology. Also, future studies should be sure to include clear explanations of how alcohol and illicit substance use is controlled for. This would help better distinguish the specific impacts of psychosis versus substances, on WM tissue. Limitations of this study include the fact that it was cross sectional in nature, as well as the small sample size that reduced the power to detect significant associations. Longitudinal designs with larger sample sizes would be ideal to clarify the relationship between the emergence of WM abnormalities and the onset of psychotic illness and cannabis use. Also, future use of multiple imaging modalities to assess WM microstructure would bring a more precise interpretation of findings.
Conclusion
The results of this study suggest that in EPP, there is a more deleterious effect of alcohol on WM with an earlier age of regular use, as well as an earlier onset of illness. There were also widespread WM changes related to cannabis use, with the direction of change opposite to what was expected. Although there was no evidence of WM changes in relation to cognitive or symptom measures, we found evidence that longer duration of illness is associated with global WM deficits. Overall, our data support the idea that in people with EPP, exposure to cannabis and alcohol may have a significant impact on WM tracts in the developing brain.
Footnotes
Acknowledgments
We thank the patients who agreed to participate in this study. We also thank the tremendous hard work of Carl Helmick with computer support for the imaging analysis. This work was supported by the Dalhousie Psychiatry Research Fund (March 14, 2013).
Author Disclosure Statement
Author P.G.T. has received honoraria for speaking and is on the advisory boards for Otsuka, Janssen, Inc., and Sunovion, however, not in the subject area of this article. The remaining authors have no competing financial interests.