
Abstract
This study aims to investigate the effects of individual differences in trait coping on brain networks at rest using electroencephalography (EEG) data. EEG recordings were processed using graph theory analysis. Active and passive coping styles were determined according to the factor structure of the Brief Coping Orientation to Problems Experienced questionnaire. A structural equation modeling analysis indicated that the influence of coping strategies on quality of life varies in strength and direction. In particular, active coping strategies were positively correlated with the psychological dimension. Graph measures, at both global and nodal levels, were used to identify the brain network properties in accordance with passive versus active coping styles. Preliminary evidence showed that both the global and nodal graph metrics were affected by the coping strategy in the delta band. During resting state, passive coping strategy participants had network topology characterized by a high global efficiency, indicating an important level of integration between distant brain areas and a high local efficiency and transitivity, suggesting a high local communication between adjacent regions. Various regions, such as the paracentral lobule, posterior cingulate, and other frontal or parietal areas, seemed to play a key role, suggesting that processes such as emotional load are highly solicited in passive coping individuals. In active coping participants, the superior temporal gyrus seemed to be of importance when neurons oscillated in the theta and alpha frequencies.
Introduction
Coping is a complex construct that is defined as the response used by an individual when he/she is exposed to circumstances considered stressful for himself/herself and the environment (Skinner et al., 2003). Two concepts of coping have been put forward: situational and dispositional coping. The former is related to what the person did in a specific coping episode (Folkman and Lazarus, 1985). Dispositional coping refers to usual ways of handling with stressors that are stable personality traits (Carver and Scheier, 1994). Focus is placed on dispositional coping, meaning that individuals often have a preferred coping style that is applied to different problematic situations, thus influencing the reactions to new stressful situations. Dispositional coping has been the topic of several research studies. Thus, Folkman and Lazarus (1985) described the two global coping models, which are problem focused and emotional coping. In 1997, Folkman (1997) included a new style named—meaningful-focused coping—which highlighted the high involvement of positive emotions in resolving stress. Other researchers proposed new models distinguishing active or adaptive and passive or maladaptive coping strategies (Brown and Nicassio, 1987; Carver et al., 1989; Holahan and Moos, 1987). As indicated by Folkman and Moskowitz (2004), coping styles are not easily classified as fundamentally good or bad; rather, they may have positive or negative repercussions depending on the situation or stressor with which the individual is coping. The questionnaire the most used in the literature to identify the nature of coping styles is the Coping Orientation to Problems Experienced (COPE) inventory (Carver et al., 1989). The COPE inventory was developed to assess the various coping styles. It is based on the coping model developed by Folkman and Lazarus (1985) and Carver et al. (1989). It has 60 items, consisting of 15 subscales. Good psychometric properties have been reported for this inventory. The Brief COPE is an abridged version of the COPE inventory (Carver, 1997). The 28-item Brief COPE (consisting of 14 subscales) has acceptable psychometric properties and has been widely used in coping research. Based on either exploratory factor analysis or principal component analysis, the Brief COPE has been suggested to consist of two (Nipp et al., 2016), three (Hamilton et al., 2011), and four (Baumstarck et al., 2017) factors. Higher order factors have also been proposed, namely seven- (Amoyal et al., 2011) and eight-order factors. According to that, the goal of the first part of this study was to assess the dimensionality of the French version of the Brief COPE in healthy adults, using an exploratory factor analysis to identify the coping strategy used by each of our participants.
Individual differences in coping strategies might be related to the heterogeneity in brain physiology (Corsi-Cabrera et al., 2007). The functional properties of an individual's brain can be evaluated by assessing cortical activity at rest; that is, when an individual is relaxing, and letting his mind wander. This can be accomplished using electroencephalography (EEG). In other words, one may assume that the electrical activity in the brain at rest is related in some way to personality style. Interestingly, Corsi-Cabrera et al. (2007) showed that the spectral power and coherence activity measured using resting-state EEG recordings have high intraindividual stability, and are reliable indicators of brain functional properties. Studies of the neuronal correlates of personality traits have mainly focalized on the five major traits: neuroticism, extraversion, openness, agreeableness, and conscientiousness. For example, significant associations were found between delta and theta activity across all cortical regions with extraversion and conscientiousness (Knyazev, 2012). Raz et al. (2013) showed that individuals with high emotional intelligence differed from those with low emotional intelligence in their mean amplitudes of early and late event-related potential components. To our knowledge, only a few studies have assessed the effects of coping interindividual differences on the resting state in the brain. Hence, Master et al. (2009) indicated that emotional coping was significantly associated with greater relative left-sided frontal EEG asymmetry. Vanneste et al. (2014) reported that, in tinnitus patients, the changes in the left dorsolateral prefrontal cortex and in the increased connectivity in the default mode (resting-state) network correlated primarily with maladaptive coping behaviors. Holz et al. (2016) showed that positive coping styles were associated with increased anterior cingulate cortex volume. More recently, Santarnecchi et al. (2018) identified significant links between the propensity to adopt different coping styles and the functional connectivity profiles of regions belonging to the default mode and anterior salience networks. The goal of this study was to identify brain network properties in healthy adults according to their ability to cope. To this aim, we have used graph theory analyses. Graph theory-based network is a powerful method describing the brain as a set of nodes interconnected by a set of edges (Bullmore and Bassett, 2011). Graph theory serves as a potent representation for characterizing the functional properties of brain networks through various graph-theoretical metrics, including global and nodal network levels. These graph theory measures reflect how well a region is connected to its neighboring areas and within brain modules, providing important information on the network's ability for specialized processing to occur within densely interconnected groups of brain regions (Pereira et al., 2016). They have been used to characterize network topology in healthy and patient populations (Achard et al., 2012; Allen et al., 2018; Hilger et al., 2017; Kabbara et al., 2017).
This study aims to investigate the effects of individual differences in trait coping on brain networks at rest, using graph theory analysis of EEG recordings. Although there is now good agreement that personality is generated through brain organization, it is much less clear what type of brain measure might be the best predictor of personality (for reviews, see Canli et al., 2001; Yarkoni, 2015). Therefore, the identification of the graph metrics specifically involved in coping strategies might be of importance. Coping strategies were first identified in our sample of healthy adults using an exploratory factor analysis on Brief COPE data.
Materials and Methods
Participants
A total of 250 healthy subjects, between 18 and 59 years of age (mean age of 28.3 ± 8.1 years; 161 women), took part in the experiment. All of them completed the questionnaires, and only 32 participated in a resting-state study while EEG data were acquired. Education ranged from 10 years of schooling to a PhD degree. None of the volunteers reported taking any medication or drugs, nor as suffering from any past or present neurological or psychiatric disease. After receiving approval from the local ethics committee according to the Declaration of Helsinki, participants filled out anonymous self-report questionnaires (the Brief COPE and The World Health Organization Quality of Life Instrument [WHOQOL-BREF]) at home ∼2 weeks before EEG experiment. Informed consent was obtained from all the individual participants included in the study.
Questionnaires
The Brief COPE is a 28-item tool measuring dispositional coping strategies, using a 4-point Likert scale. The scale consists of 14 domains/subscales: active coping, planning, use of instrumental support, positive reframing, acceptance, use of emotional support, denial, venting, self-blame, humor, religion, self-distraction, substance use, and behavioral disengagement. Higher scores reflect a higher tendency to implement the corresponding coping styles.
The WHOQOL-BREF contains a total of 26 questions on a 5-point Likert scale measuring the quality of life (QoL). Two items are examined separately: question 1 asks about an individual's overall perception of his/her QoL and question 2 asks about an individual's overall perception of his/her health; the remaining 24 items are part of one of the following four domains: physical QoL (7 items), psychological QoL (6 items), social relationships QoL (3 items), and environmental QoL (8 items). The domain scores are scaled in a positive direction (i.e., higher scores denote higher QoL). Mean scores are then transformed according to a 0–100 scale (see WHOQOL-BREF instruction, 1996, 1997).
The resting-state questionnaire (ReSQ) consists of 62 items organized by five main types of mental activity: visual mental imagery, inner language, somatosensory awareness, inner musical experience, and mental manipulation of numbers (Delamillieure et al., 2010). Participants started to complete the ReSQ within the 5 min after EEG completion. Using a 0–100% scale, each participant rated the percentage of time spent in each mental activity during the resting-state EEG acquisition, such that the total score for the five types of activities equaled 100%.
Questionnaires analysis
An exploratory analysis of the original Brief COPE with 14 subscales was carried out using the principal component analysis (PCA) method with a varimax rotation to test the loading strength of the subscales on the factors. To determine the number of factors to retain, only factors with eigenvalues of 1 were retained, and only subscale loading >0.30 was used. Internal consistency for the various factors was calculated using Cronbach's alpha. PCA allowed the classification of the original 14 subscales into 4 factors, which were grouped into 2 coping strategies, namely active and passive coping strategies. Subject scores on each factor were used to differentiate the sample into two groups, which differed in their coping behavior and active or passive coping styles.
Partial least-squares structural equation modeling (PLS-SEM) was used to study the correlations between coping styles and the four domains of the WHOQOL-BREF, namely physical QoL, psychological QoL, social relationships QoL, and environmental QoL. It is an advanced statistical method based on exploratory techniques (Bollen and Lennox, 1991). It performs adequately with small sample sizes (Hair, 2014). PLS-SEM first analyzes the measurement model elaborated from indicator variables, and then examines the structural model performed from latent variables (or constructs). The relationships between constructs are represented by a diagram, in which rounds represent constructs and arrows represent relationships. The path model is translated into a set of equations describing a measurement model and a structural model (Haenlein and Kaplan, 2004). The validity of the measurement model was assessed by internal consistency, convergent validity, and discriminant validity. Internal consistency was calculated using the composite reliability of the items. The average variance extracted (AVE) scores for each construct and the outer loading of each indicator were examined and represented the convergent validity. Discriminant validity was evaluated by assessing the cross-loading. Regarding the structural model, the quality of the relationships was measured by the R 2 metric, which reflects the level of the explained variance of the composites (Riou et al., 2016). Statistical comparisons of the correlations between the two groups of subjects, namely the passive and active coping style groups, were done using the XLSTAT (Addinsoft) statistical software, which offers multigroup comparison methods in the framework of PLS path modeling presented by Goles and Chin (2005). An adapted t-test based on bootstrap standard errors was used. Statistical significance was set at p ≤ 0.05.
For the ReSQ, Student's t-tests were carried out for each of the five types of mental activities (visual mental imagery, inner language, somatosensory awareness, inner musical experience, and mental manipulation of numbers) between the passive and active coping groups.
EEG recording and preprocessing
Among the 250 participants cited above, 32 subjects (aged 22–55 years, mean age = 32 years ±8.8 years; 13 women) took part in a resting-state study while EEG data were acquired. Thirteen subjects belong to the group of passive coping and 19 subjects belong to the group of active coping. Each EEG session consisted of a 10-min resting period with the participant's eyes closed. Participants were seated in a dimly lit room, were instructed to close their eyes, and then to simply relax until they were informed that they could open their eyes. Participants were told that the resting period would last ∼10 min. The eyes-closed resting EEG recordings protocol was chosen to minimize movement and sensory input effects on electrical brain activity (Kondakor et al., 1997). EEG data were collected using a 64-channel Biosemi ActiveTwo system (Biosemi Instruments, Amsterdam, The Netherlands) positioned according to the standard 10–20 system montage, 1 electrocardiogram, and 2 bilateral electro-oculogram electrodes for horizontal movements. Nasion-inion and preauricular anatomical measurements were made to locate each individual's vertex site. The electrode impedance was kept <20 kOhm.
EEG data preprocessing was performed with the EEGLAB software (Delorme and Makeig, 2004). Recordings were digitally resampled to 256 Hz offline. The recorded EEG signals were preprocessed according to the PREP pipeline defined by Bigdely-Shamlo et al. (2015). The EEG data were segmented in consecutive epochs of 2 sec. Independent component analysis (ICA) was used to remove the artifacts caused by eye blinks and movement, and motion. After ICA decomposition, the independent components (ICs) were classified using the SASICA plug-in, which offers observers detailed information concerning guidance in the selection of artifact ICs (Chaumon et al., 2015). The number of rejected ICs was different across subjects, having a range of 2–9. An average of 100 artifact-free segments of 2 sec was used for further analyses.
Graph theory analysis
In graph theory analysis, a graph is defined as a set of nodes and edges that need to be defined. To this end, the LORETA_KEY (low-resolution electromagnetic tomography) package and the BRAPH (BRain Analysis using graPH theory) software were used. LORETA_KEY allowed the investigators to estimate the intracerebral electrical sources that generated the scalp-recorded activity in each of the frequency bands studied (Pascual-Marqui et al., 2002). Exact (e) LORETA is a genuine inverse solution that provides exact localization with zero errors in the presence of measured and structured biological noise. eLORETA intracortical lagged linear coherence was chosen for connectivity estimation among regions of interest (84 ROIs) defined according to the available Brodmann areas of the left and right hemispheres. This measure has been used in other studies before and was deemed an adequate approach for computing resting-state networks (Babiloni et al., 2016; Milz et al., 2014; Miraglia et al., 2015). It was shown by Pascual-Marqui et al. (2002, 2011) that the lagged connectivity measure for intracranial signals contains physiological information that is minimally affected by volume conduction artifacts. Detailed information on the eLORETA connectivity algorithm has been published previously (Pascual-Marqui et al., 2011). In brief, an EEG source connectivity analysis was performed by restricting the source space within the gray matter, including 6239 voxels with a 5-mm spatial resolution, as defined by the digitized MNI152 template. For each subject, adjacency matrices were computed in five frequency bands, namely delta (1.5–3.5 Hz), theta (4–8 Hz), alpha (8.5–13 Hz), beta (13.5–30 Hz), and gamma (30.5–40 Hz).
The BRAPH software was used to compute the graph measures (Mijalkov et al., 2017). Thus, the nodes of the graph were the voxel centroids of the 84 ROIs, and the edges were the lagged linear coherence values among the nodes. The strength of each connection between the nodes was represented by a weight; that is, the magnitude of the lagged linear coherence value. Weight and indirect graphs were constructed from the single-subject adjacency matrix separately for the frequency bands delta, theta, alpha, beta, and gamma. Graph topological properties were then evaluated. The topological properties of brain functional networks can be measured by both global and nodal network measures. The global measures included local efficiency, global efficiency, transitivity, modularity, and small worldness. The nodal measures included strength, path length, clustering coefficient, betweenness centrality, and closeness centrality (Rubinov and Sporns, 2010). These measures are defined in Table 1. In brief, the strength, path length, and clustering coefficient of a given node measure the extent to which the node is connected to the rest of the network, while centrality (betweenness and closeness) captures how many short paths between other parts of the network pass through the node. Global efficiency and local efficiency evaluate the potentiality of a network to transmit information at the global and local levels, respectively. Modularity and transitivity are global measures of how well a network can be decomposed into a set of interconnected modules, or can be formed into triangles, respectively. These indices were calculated separately for each of the frequency bands of interest. To assess the significance of the differences between groups in the graph metrics, nonparametric permutation tests were used (reported as p-values). They are performed by first randomly permuting the subjects from both groups, and then calculating the differences in the graph measures between the new randomized groups. By repeating this procedure multiple (typically 1000 or 10,000) times, a distribution of between-group differences is obtained. The p-values are then calculated as the fraction of the difference distribution values that exceeded the difference value between the actual groups. For the nodal measures, the false discovery rate (FDR) was used to correct for multiple comparisons (by using the Benjamini-Hochberg procedure). The multiple comparisons are done for many brain regions simultaneously, and only the number of ROIs is considered. The formulas used to calculate graph theory measures are given by Rubinov and Sporns (2010).
Network Topology Measures Summary
For a review, see Rubinov and Sporns (2010).
Results
Questionnaires analysis
The PCA of the original 14 subscales of the Brief COPE resulted in a four-factor structure, accounting for 55.11% of the variance. According to the Kaiser criterion, only factors with eigenvalues >1 were retained. The four factors were labeled social support (F1), problem solving (F2), positive thinking (F3), and avoidance (F4). The factor loadings are shown in Table 2. Only subscales with loadings >0.30 were included in the factor. Religion and behavioral disengagement were then excluded. The internal consistencies of the four factors were 0.83, 0.75, 0.81, and 0.79 for social support, problem solving, positive thinking, and avoidance, respectively. Based on the theoretical models, these four factors were grouped into two different styles of coping, namely passive and active coping. Passive coping included factors F1 and F4; that is, social support and avoidance. Active coping included factors F2 and F3; that is, problem solving and positive thinking. The 250 participants were then classified as follows: subjects scoring high on F1 or F4 were considered to use passive coping strategies, and subjects scoring high on F2 or F3 were considered to use active coping strategies.
Factor Loading of the Subscales of the Brief Coping Orientation to Problems Experienced Questionnaire
Items in bold represent loadings > 0.40 threshold.
F1, social support; F2, problem solving; F3, positive thinking; F4, avoidance.
The measurement model of the PLS-SEM analysis was constructed from the questionnaire data of the 250 subjects and included five reflective latent variables: coping, physical health QoL, psychology QoL, social relation QoL, and environment QoL. The reliability and validity results are given in Table 3. The internal consistency measures, as indexed by the composite reliability, ranged ∼0.70. The convergent validity (AVE) was >0.5 for all five constructs. Each item's factor loading was significant (p < 0.05, data not shown), and all were >0.5. As the validity of the measurement model was established, the structural model was assessed for each of the two groups separately. Data are shown in Figure 1.

Structural model of the direct effects of trait coping on physical health QoL, psychological QoL, social relation QoL, and environmental QoL in active
Assessment of the Measurement Model: Internal Consistency (Composite Reliability), Convergent Validity (Loading and Average Variance Extracted), and Discriminant Validity (Cross-Loading)
For item descriptions, see Baumann et al. (2010). Items in bold represent loadings > 0.40 threshold.
QoL, quality of life.
In the passive coping group (N = 125; Fig. 1A), the results showed that the model was statistically significant, F = 12.68, p < 0.0001, with an R 2 value equal to 0.29. All correlations were negative. Coping had a significant effect on social relation QoL and environment QoL (r > −0.43; p < 0.05). The relationships between physical health QoL and psychology QoL and coping were moderate but nonsignificant (p > 0.06).
In the active coping group (N = 125), the model was statistically significant (F = 8.92, p < 0.0001), with an explained variance of R 2 = 0.23. In this model, all correlations were positive, but only coping had a significant influence on psychology QoL (r = 0.446; p = 0.015).
The results of the multigroup t-tests showed a significant difference between the two coping styles for the path “coping—psychology” (t(248) = 2.98; p = 0.003).
The ReSQ results are reported in Table 4. They showed that the time dedicated to each mental activity was higher for both visual mental imagery and inner language, which displayed a proportion in the 22–50% range (% of the 10 min of the EEG recording), as opposed to the 0–18% range for the other mental activities (somatosensory awareness, inner musical experience, and mental manipulation of numbers). Similar proportions were measured in both coping strategies (t(30) ≤ 1.62; p ≥ 0.11).
Proportion of Participants Relative to the Time Spent in Each Cognitive Activity of the Resting-State Questionnaire
EEG and graph theory analyses
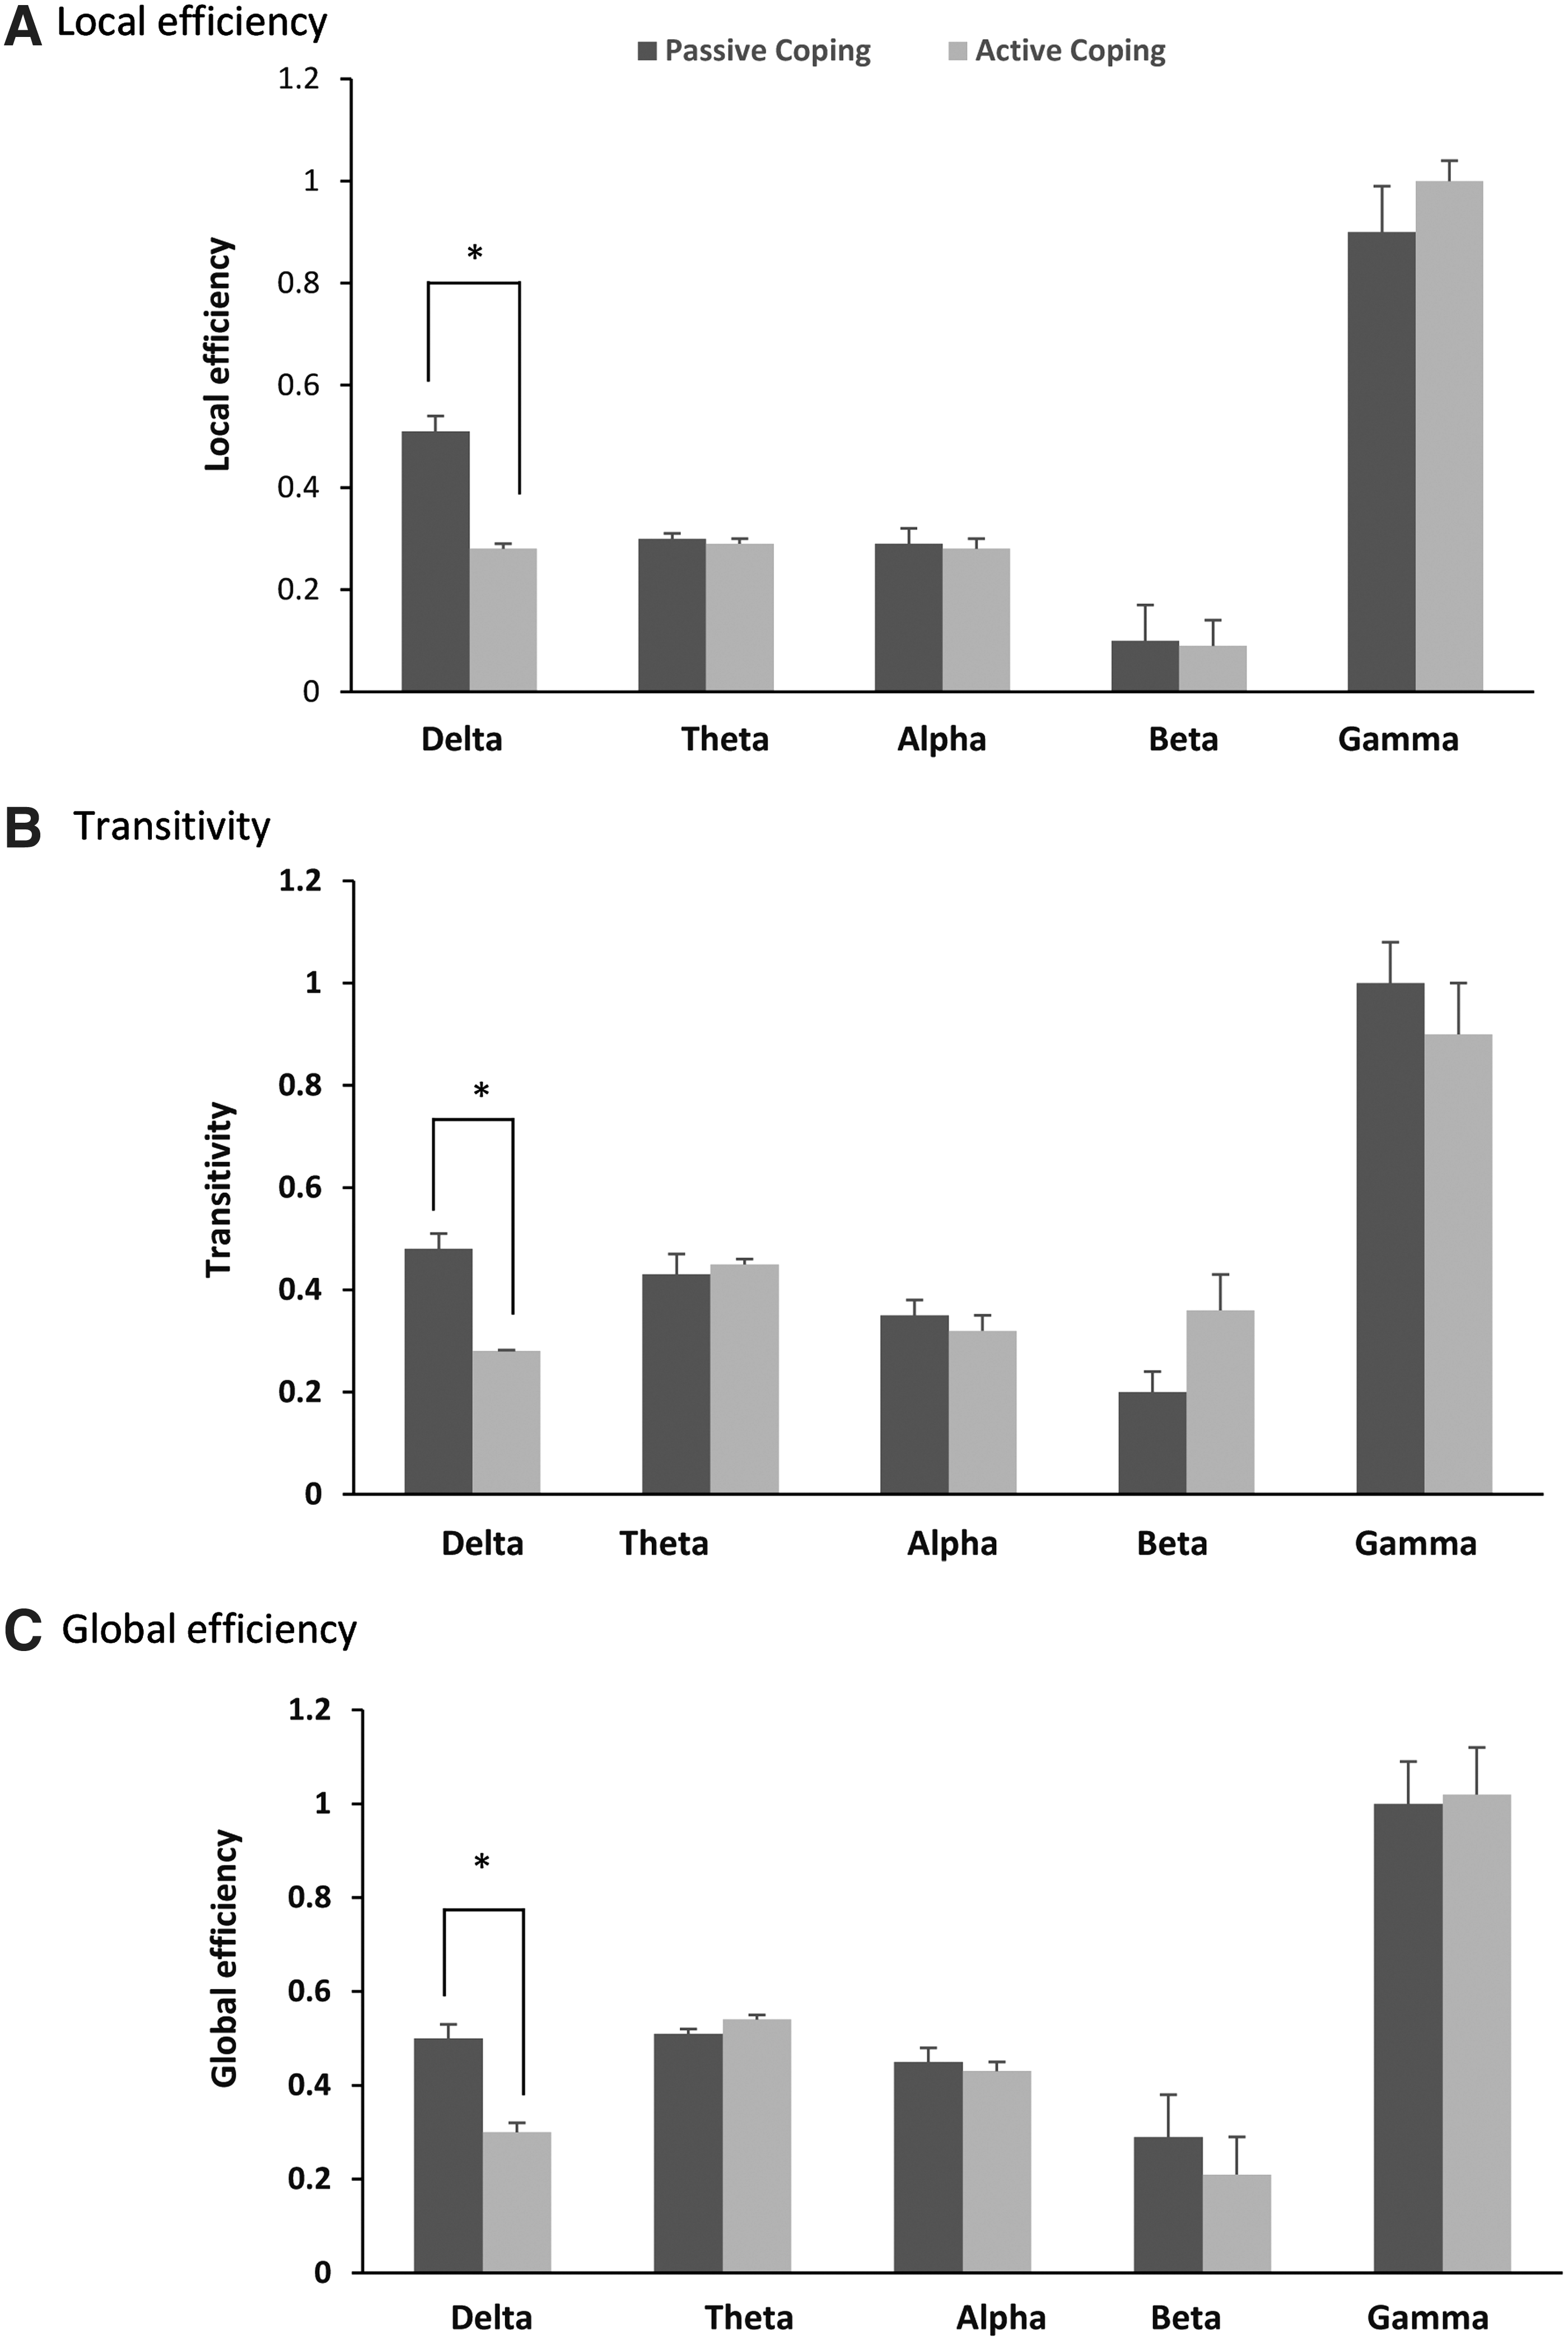
The data are reported in Figure 2 and Table 5. Note that only network properties showing significant differences (p < 0.05, FDR corrected) were retained. Network properties at the global level yielded significant differences between the passive and active coping strategies only in the delta band. Local and global efficiencies and transitivity were increased in the passive coping group compared with the active coping group (Fig. 2). In the other frequency bands (theta, beta, alpha, and gamma), there was no statistically significant differences between the two coping strategies, no matter what the graph metric was.
Local efficiency
Effect of Coping Strategies on the Nodal Metrics in the Delta, Theta, and Alpha Frequency Ranges
The table presents only the metrics and brain areas that were significantly different between the passive and active coping groups. The BA and their corresponding centroid voxel coordinates (obtained from the sLORETA analysis), and brain region names are indicated.
BA, Brodmann area; sLORETA, standardized low-resolution electromagnetic tomography.
Network properties at the nodal level showed several changes between the two groups depending on the wave band (Table 5). For the delta band, at the FDR-corrected significance threshold, differences in the nodal metrics were found in various brain areas, all having higher values with passive coping than with active coping, except the right area of BA45. Interestingly, the left paracentral lobule (BA5 left) was the only area showing significant differences between the two coping strategies within all nodal metrics, except betweenness centrality. Hence, the strength, path length, clustering coefficient, and closeness centrality were increased in passive coping compared with active coping. The posterior cingulate (BA23 left and right) was revealed to have higher path length and closeness centrality measures in passive coping than in active coping. In the frontal lobe, the superior (BA8 and BA10 left) and inferior gyri (BA45 right) were altered in terms of path length and betweenness centrality, respectively. The parietal lobe, the inferior gyrus (BA41 left), and the postcentral gyrus (BA42 right) were significantly higher in passive coping in terms of their strength and betweenness centrality, respectively. The occipital lobe, the cuneus (BA18 right), and the middle occipital gyrus (BA19 left and right) were affected by the coping strategies. The clustering coefficient and the betweenness centrality were increased in passive coping behavior compared with active coping behavior.
For the theta band, interestingly, changes in the nodal metrics were restricted to the superior temporal gyrus areas, namely BA43 left and BA22 right. All metrics were higher in active coping than in passive coping.
For the alpha band, only betweenness centrality was significantly altered. This was noted in four areas. All of them belong to the temporal lobe and were increased in active coping.
Discussion
This study showed that, according to the passive versus active coping strategies, QoL perception varies in terms of both strength and direction. Network properties differed at the global and nodal levels only in lower frequency bands, in particular the delta frequency range.
The first part of the study aimed to identify the factor structure of the Brief COPE. The results showed that a four-factor structure of the questionnaire displayed the most adequate psychometric properties, confirming previous data of Baumstarck et al. (2017) in a comparable sample of French participants. This four-factor solution was in line with the assumption that the two- and three-dimensional models of coping might be too oversimplified (Connor-Smith et al., 2000; Doron et al., 2014; Skinner et al., 2003). Interestingly, this hierarchical structure has been supported by theoretical models of coping. In particular, Holahan and Moos (1987), Brown and Nicassio (1987), and Carver et al. (1989) proposed models distinguishing active and passive coping strategies. According to these, in this study, passive coping included social support and avoidance factors, whereas active coping referred to positive thinking and problem solving. While the passive coping strategy involves focusing on instrumental and emotional supports, venting feelings, denial, and self-blame, active coping style involves the use of various coping mechanisms, including planning, positive reframing, and acceptance. Active coping behaviors are psychological responses planned to change the nature of the stressful event itself. Passive coping behavior involves efforts to remove oneself from experiencing or thinking about a stressful situation (Vanneste et al., 2014). The relationship between coping strategies and QoL is largely documented in the literature (Baumstarck et al., 2017; Cappeliez and Robitaille, 2010; Nipp et al., 2016). Coping is claimed to be one of the core concepts in the context of QoL (Folkman and Moskowitz, 2004). Kneebone and Martin (2003) found that problem-focused, direction–action-related coping was generally associated with well-being and positive outcomes. While Kramer (2017) found that emotion-focused coping was associated with depression and negative psychological outcomes. Similar findings were reported in studies looking at other coping behaviors aimed at reducing emotional distress, including those labeled as avoidant and dysfunctional (Zucchella et al., 2012). In this study, using structural equation modeling analysis, we showed that the influence of coping strategies on QoL varies in terms of both strength and direction. Although coping mechanisms are not universally beneficial or detrimental, active coping typically predicts better physical and mental health (Cappeliez and Robitaille, 2010), and passive coping typically predicts poorer outcomes (Aldao et al., 2010). Consistent with the data in the literature, the results of this study showed positive correlations between the active coping strategy and QoL dimensions, namely the physical health and psychological dimensions, but only the psychological dimension yielded statistical significance. Hence, the use of active coping, planning, positive reframing, acceptance, humor, and self-distraction may be related to the improvement of well-being focused on psychology. In other words, subjects using active coping had positive personal beliefs and feelings. Interestingly, it has been shown that people who utilize the active coping behavior are more likely to experience lower stress levels (Anthony, 2008). In contrast, negative correlations were found between the passive coping strategy and every dimension of the QoL. Hence, the more people utilized instrumental and emotional support, denial, venting, self-blame, substance use, the lower their QoL–social relation and environmental dimensions.
This study's main contribution was that it identified brain network properties in accordance with the passive versus active coping styles. To do so, graph measures were used since they provide a powerful means by which to analyze brain networks. To our knowledge, this is the first time that graph theory analysis was used to evaluate brain networks in healthy adults according to their ability to cope. The five frequency bands, namely delta, theta, alpha, beta, and gamma, have been classified into two categories. Thus, Knyazev (2012) indicated that delta, theta, and alpha oscillations are distributed over large cortical regions, so that they would play a major role in integration across diverse cortical sites by synchronizing coherent activity and phase coupling across spatially distributed neural assemblies. In contrast, beta and gamma oscillations are distributed over a more limited topographic area. As suggested by Engel et al. (2013), slow oscillations modulate fast oscillations on a higher level of hierarchy and, thus, determine the general mode of processing. Therefore, it might not be surprising that network properties related to personality traits, such as coping, were affected only in slower waves. In particular, both the global and nodal graph metrics were affected by the coping strategy in the delta band. Delta oscillations have been shown to be involved in many cognitive processes (Başar et al., 2001; Harmony, 2013; Knyazev, 2012). More particularly, delta waves may participate in the synchronization of brain activity involved in homeostatic regulation. It is expected to play a leading role in motivational processes and those related to attention of salient stimuli in the environment. The delta wave has also been found to be related to behavioral inhibition (Putman, 2011). Of particular interest is the involvement of delta waves in emotional mechanisms (for a review, see Knyazev, 2012). Several experiments showed that the degree of emotional impact of the signal was significantly associated with increases in evoked synchronization in the delta band (Aftanas et al., 2004; Klados et al., 2009).
In this study, network analysis at the global level includes measures such as local efficiency, transitivity, and global efficiency. We showed that both local efficiency and transitivity were increased in the passive coping strategy participants. These two metrics measure how efficiently the network exchanges information at the clustering level. They reflect the efficiency of parallel information transfer within the network (Achard et al., 2012). A third global metric was also increased in the passive coping subjects; that is, the global efficiency. It is a measure of the network's capacity for information transfer between nodes through multiple series of edges. It measures how efficiently the network is exchanging information at the global level (Achard et al., 2012). In other words, during rest period, passive coping strategy participants had network topology characterized by a high global efficiency, indicating an important level of integration between distant brain areas and a high local efficiency and transitivity, suggesting a high local communication between adjacent regions. One may hypothesize that such good network topology when neurons oscillate slowly promotes the functionality associated with this frequency band. Thus, during rest, passive coping subjects would notably be highly involved in emotional processes. Interestingly, a similar hypothesis has recently been reported by Santarnecchi et al. (2018). Using functional magnetic resonance imaging, they showed a negative correlation between avoidance- and social-oriented coping scores and connectivity profile in regions known to be involved in emotional processing, such as anterior cingulate cortex and left frontal cortex (Bush et al., 2000). Importantly, it is well documented that during rest, people engage in mind-wandering, self-generated thoughts unrelated to the current external demands (Killingsworth and Gilbert, 2010). Therefore, one may speculate that differences in network topology between passive and active coping would be related to the content of mind wandering. To investigate this, the ReSQ was used in this study. It allows a quantitative assessment of thoughts and feelings along several dimensions of mind wandering (Delamillieure et al., 2010). According to the literature, we showed that the participants exhibited a dominant mode of thoughts during rest (Delamillieure et al., 2010; Diaz et al., 2014), with a greater occurrence and amount of time spent in visual imagery over other mental activities. Thus, this activity seems to be a core of mental processing during rest. It is worth noting that no difference was observed between passive and active coping; the dominant feature of visual imagery was exhibited by both strategies. Therefore, the differences measured in network topology could not be attributed to various modes of thought during rest.
Network analysis at the nodal level includes measures such as strength, path length, clustering coefficient, betweenness centrality, and closeness centrality. These measures have been evaluated here since they represent commonly used metrics to detect pertinent regions in the brain. In the delta band, strikingly, all the nodal metrics were altered by the coping strategies, and all the brain areas involved had higher values in the passive coping participants, reinforcing the role played by the delta band in these subjects. In addition, our results revealed a greater left-sided hemisphere EEG asymmetry in the passive coping subjects. Interestingly, similar data were revealed by Master et al.'s study (2009) in individuals who reported engaging in a more emotional approach in response to stressful events. Such data corroborated our assumption that emotional support played a major role in our passive coping participants. The left paracentral lobule had a significant role in the passive coping group's network. Indeed, its links with other brain areas were strong. These connections were related to areas located both near (clustering coefficient) and far (path length) distances. These nearest neighbors seemed to also be directly connected to each other, as indicated by the high value of the clustering coefficient. More importantly, the increase in betweenness centrality, which is the number of shortest paths between any two nodes in the network that pass through that particular node, suggested that in passive coping participants, the paracentral lobule is connecting various different parts of the network together, contributing to the facilitation of the information flow in the cortical network. This might be associated with its anatomical position. Indeed, the human paracentral lobule is located at the junction of the precentral and postcentral gyri, which contain several important functional regions (Spasojević et al., 2013). Using functional connectivity analysis in healthy adults, Salvador et al. (2005) found that the paracentral lobule clustered statistically with the resting-state activity of other frontal and parietal regions. In the frontal region, this study highlighted areas such as the superior (BA8 and BA10) and the inferior (BA45) gyri in passive coping individuals. Regarding BA45, for instance, Tabei (2015) showed that it is activated during perceived emotional tasks. In the parietal region, since the clustering coefficient is an index of local structure, it can be argued that the connections of the inferior parietal gyrus (BA41) are intended to be with its closest regions. Such short path lengths are believed to promote functional integration of neurons that oscillate slowly (delta band) since they allow communication with few intermediate steps, and thus minimize the effects of noise. This area has been implicated in visuospatial attention (Egner et al., 2008) and visual memory (Xu and Chun, 2009). The posterior cingulate/precuneus (BA23) has also been highlighted in the delta band. Indeed, two measures were increased in passive coping participants compared with those in active coping participants, namely path length and closeness centrality, indicating that this area is richly connected within the rest of the network. Interestingly, this region is primarily involved in retrieval from working memory or episodic memory, especially the retrieval and processing of spatial images, visuospatial imagery, and self-processing operations (Cavanna and Trimble, 2006). Regarding the theta and alpha bands, only a limited number of areas were altered with the coping strategy. Strikingly, they were all localized in the temporal lobe, and their nodal metrics were increased in active coping participants this time. Of particular interest is the superior temporal gyrus (BA43), in which betweenness centrality was altered in both theta and alpha rhythms. Betweenness centrality provides a measure of a node's importance by counting how many of the shortest paths, not starting or ending at that particular node, pass through it (Hilger et al., 2017). It considers the load of a node, rather than only how well it is connected. Therefore, it can be seen as a measure of importance with respect to network functionality (Hilger et al., 2017). Thus, in active coping participants, one may argue that the superior temporal gyrus plays a major role when neurons oscillate in the theta and alpha frequencies. Interestingly, theta oscillations have been shown to play an important role in large-scale synchronization to form the functional neuronal networks required for visual mental imagery that are involved in mental navigation (Li et al., 2009) and remembering autobiographical experiences (Fuentemilla et al., 2014).
One major limitation of this study is the restricted number of EEG data used. Only 32 participants underwent EEG recordings; 13 subjects belonging to the group of passive coping and 19 subjects belonging to the group of active coping. Future studies including a greater number of EEG recordings are needed to challenge the reproducibility of our conclusions. A second limitation is the number of ROIs selected. One may argue that the smoothness of the inverse source reconstruction solutions may give spurious connectivity between nearby sources, particularly when the number of fitted sources exceeds the number of EEG channels.
Conclusion
Our graph theory analysis comparing network topologies between subjects who utilize passive or active coping showed preliminary evidence that passive coping participants have network measures, combining a high level of integration and a high local communication only when neurons oscillate in the delta band. This suggests that, at rest, passive coping individuals were highly engaged in processes restricted to the delta band, such as emotional mechanisms. Various regions such as the paracentral lobule, posterior cingulate, and other frontal or parietal areas have also been highlighted in the delta band in passive coping participants. In contrast, in subjects who utilize active coping strategies, only a limited number of regions restricted to the temporal lobe were identified, and they oscillated in at least two frequency bands, theta and alpha bands.
Footnotes
Acknowledgments and Authors' Contributions
V.P. conceived and designed the article. C.D., M.H.F., and V.P performed the experiments. A.W. provided technical support. V.P. also analyzed the data and wrote the article. M.H.F. and B.A.L supervised the article.
Author Disclosure Statement
The authors declare that no competing financial interests exist.