
Abstract
An estimated 70–90% of children with autism spectrum disorder (ASD) have sensory symptoms, which may present as hyper- or hyporesponsivity in one or more sensory modalities. These sensitivities correlate with social symptoms, activity, and social interaction levels. Interestingly, sensory symptoms appear to be most prevalent in late childhood, suggesting a developmental component. Although the neural basis of sensory sensitivities remains unclear, atypical functional connectivity of sensory brain regions has been suggested as a potential mechanism. Tactile sensitivities are among the most predictive of social functioning, yet no studies to our knowledge have examined somatosensory functional connectivity in children and adolescents with ASD, when symptoms are typically most prominent. In this study, we used human data from the Autism Brain Imaging Data Exchange (ABIDE-I) to assess functional connectivity differences of somatosensory regions during resting state functional magnetic resonance imaging, in youth aged 8–15 years. After head motion exclusion, our sample included 67 participants with ASD and 121 typically developing controls. We additionally examined associations between functional connectivity and age, as well as ASD symptom severity. Together, these seed-based analyses showed limited differences in functional connectivity between groups, either to hypothesized target regions or in terms of global connectivity. Our findings suggest that hyper- or hyposomatosensory functional connectivity at rest is not a population-level feature in ASD. However, this does not preclude increased variability of somatosensory networks across the ASD population. Furthermore, as sensory sensitivities were not specifically assessed in this sample, future studies may be better able to identify patterns of functional connectivity, reflecting individual differences in sensory symptoms.
Introduction
Autism spectrum disorder (ASD) is a common neurodevelopmental disorder diagnosed based on symptoms of social communication, and restricted or repetitive interests and behaviors (American Psychiatric Association, 2013). One of the symptoms that can contribute to diagnosis is hypo- or hyperresponsiveness to sensory features of the environment. An estimated 70–90% of children with ASD experience symptoms in one or more sensory domains (Leekam et al., 2007).
Sensory symptoms are associated with the severity of other core ASD symptoms, including social and communication difficulties (Hilton et al., 2010), and have been associated with activity, school, and social competence (Reynolds et al., 2011), suggesting an impact on quality of life. Indeed, it has been proposed that because early sensory and cognitive functions are building blocks for the development of social cognition (Ronconi et al., 2016), they may be critical to understanding the development of ASD (Thye et al., 2018).
Although sensitivities are frequently reported in individuals with ASD, there is wide heterogeneity across the population (Kern et al., 2007): individuals may be hyper- or hyposensitive and may respond actively or passively to stimuli. There is also lifespan heterogeneity with sensitivities more commonly reported in childhood (Kern et al., 2007), suggesting a developmental component. A meta-analysis has reported that the most consistent period of over-responsivity is 6–9 years (Ben-Sasson et al., 2009). Tactile symptoms impact activities of daily life such as oral hygiene (Stein et al., 2011) and are among the strongest predictors of social function (Hilton et al., 2010).
Although the neural basis of sensory sensitivities remains poorly understood, several hypotheses have been tested. One hypothesis is that over-responsivity may be due to heightened responses to sensory stimuli in primary sensory or limbic/emotional regions (Green et al., 2013, 2015). In support of this suggestion, functional responses to mildly aversive tactile and auditory stimuli (Green et al., 2015), and mildly aversive visual and auditory stimuli (Green et al., 2013), are enhanced in youth with ASD in both primary sensory cortices and emotional centers such as the amygdala. Electroencephalography correlates of hypo- and hyperresponsiveness to tactile stimuli have also been found at specific temporal phases in the evoked sensory response (Cascio et al., 2015).
A second related hypothesis is that sensory responses show reduced habituation in ASD. In support of this hypothesis, youth with sensory over-responsivity show reduced habituation of evoked responses in sensory cortices and amygdala (Green et al., 2015). This reduced neural habituation may be consistent with several studies demonstrating reduced perceptual adaptation in individuals with ASD in tactile (Puts et al., 2014), auditory (Lawson et al., 2015), and audiovisual (Turi et al., 2016) modalities.
Both exaggerated or nonhabituating responses to sensory stimuli could result from abnormal connectivity between primary sensory regions and the brain networks involved in the relay and processing of sensory information. Resting-state functional magnetic resonance imaging (rs-fMRI) is an ideal methodology with which to test this hypothesis, by investigating task-independent synchrony between brain regions (Damoiseaux et al., 2006). Although there is inconsistency in reports of rs-fMRI connectivity differences in ASD (Tyszka et al., 2014), several studies have reported atypical connectivity of sensorimotor networks. Broad overconnectivity has been reported in children with ASD (Supekar et al., 2013) [for a review also see Uddin et al. (2013b)], including primary sensory networks.
Overconnectivity between sensorimotor areas and the anterior insula (AI), a region of the salience network, has been reported in youth with ASD, and AI–sensorimotor connectivity has been shown to positively correlate with sensory over-responsivity in the ASD group (Green et al., 2016). Widespread underconnectivity accompanied by overconnectivity between primary sensorimotor and subcortical regions has been found in participants aged 7–65 years (Di Martino et al., 2014). An independent component analysis (ICA) study of participants aged 7–50 years reported overconnectivity between sensory and subcortical networks (encompassing the thalamus and basal ganglia) (Cerliani et al., 2015). Hyperconnectivity between somatosensory and motor networks and specific regions of the thalamus has recently been reported (Woodward et al., 2017). Moreover, classification of ASD versus typically developing (TD) participants found that somatosensory regions were among the most discriminating (Jahedi et al., 2017).
Although previous studies have suggested atypical functional connectivity of sensorimotor/somatosensory networks in ASD, findings have been inconsistent and none have performed a detailed examination of somatosensory functional connectivity in late childhood and early adolescence when sensory symptoms are suggested to be most prominent. With a large database such as Autism Brain Imaging Data Exchange (ABIDE-I), we can take a preliminary step toward assessing the role of sensorimotor functional connectivity in the symptoms of ASD, by examining group differences. In this study, we conducted a detailed examination of somatosensory functional connectivity in youth with ASD, relative to TD controls, overlapping with the age when symptoms are expected to be greatest, using the largest publicly available sample at the time of study initiation (ABIDE-I) (Di Martino et al., 2014).
Based on previous research (Cerliani et al., 2015; Di Martino et al., 2014; Uddin et al., 2013a) and somatosensory connectivity patterns, we hypothesized that we would find overconnectivity of somatosensory regions with subcortical (striatum, thalamus, and amygdala), cerebellar, and salience (Green et al., 2016) networks in youth with ASD. The cerebellum was included as a region of interest (ROI) because of its role in ASD (D'Mello and Stoodley, 2015; Igelström et al., 2017; Rogers et al., 2013) and in integrating sensorimotor information, more generally. Given the heterogeneity of symptom presentation in ASD, and the correlation between social and sensory symptoms (Hilton et al., 2010), we further examined associations with age and ASD symptom severity. Although with the available data we were not able to directly associate functional connectivity with social symptoms in this sample, given that sensory symptoms are highly prevalent in ASD and significantly greater in individuals with ASD, we undertook this analysis investigating group differences as plausible first step.
Materials and Methods
Data and participants
Data were obtained from the ABIDE data set, first release (
ASD diagnostic procedures varied by site, but included verification using the Autism Diagnostic Observation Schedule (ADOS) and/or the Autism Diagnostic Inventory-Revised (Lord et al., 1989, 1994). Additional phenotypic information included age at time of scan, intelligence quotient (IQ), gender, and Autism Diagnostic Observation Schedule (ADOS)-Gotham scores (Gotham et al., 2009). In addition, all sites used in our analysis reported participant handedness and eye status (open vs. closed) during the functional scan. Phenotypic data available only at select sites included medication status at time of scan (NYU, KKI, UM, UCLA), comorbidities (NYU), and Social Responsiveness Scale (SRS) scores (NYU, Yale).
Demographic, behavioral, and phenotypic data for the final sample, after exclusions based on data quality (described hereunder), are given in Tables 1 and 2. A total of 21 participants indicated that they were taking medication, including two TD participants who reported taking levothyroxine. Among the 19 participants with ASD who were reported to be taking medications, 21 different medications were listed and 15/19 participants with ASD reported more than one medication. The number of participants listed as taking each type of medication is guanfacine (four), citalopram (one), risperidone (six), escitalopram (three), dexmethylphenidate (one), peroxatine (one), methylphenidate (four), clonidine (one), atomoxetine (one), dextroamphetamine (three), amphetamine (three), fluoxetine (one), quetiapine (one), melatonin (two), trazodone (one), aripiprazole (three), sertraline (two), bupropion (one), zinc (one), valproic acid (one), and levothyronxine (two TD participants).
Participant Phenotypic Data for the Final Sample
ASD, autism spectrum disorder; FSIQ, full-scale intelligence quotient; TD, typically developing.
Autism Diagnostic and Symptom Severity Scores
Scores presented here were used as covariates for analyses presented [mean (SD)]. SRS scores, ranging from 3 to 150 (max. possible 190), are reported for both TD participants and participants with ASD. ADOS and derived (i.e., Gotham) scores were only collected for participants with ASD.
ADOS, Autism Diagnostic Observation Schedule; KKI, Kennedy Krieger Institute; NYU, New York University; RRB, restrictive repetitive behaviors; SRS, Social Responsiveness Scale; UCLA, University of California, Los Angeles.
MRI acquisition
Anatomical and resting-state functional scans were available for all subjects. Anatomical (T1) scan parameters ranged from repetition time (TR) = 250–2530 msec, echo time (TE) = 1.73–5.7 msec, field of view (FOV) = 250–256 mm, and resolution of 1.0–1.7 mm3. Functional (T2*) scan parameters ranged from TR = 2000–3000 msec, TE = 15–30 msec, 120–300 functional volumes, FOV = 192–256 mm, resolution of 28.8–35.5 mm3, and scan duration t = 6:00–10:00 min. All sites used echo planar imaging acquisition sequences for functional volumes, except UM that employed a reverse spiral acquisition sequence.
MRI data preprocessing
fMRI preprocessing was performed in the SPM8 toolbox (
Images underwent slice-timing correction and realignment to the first functional image through rigid body transformation. The Art toolbox (
Spatial smoothing with a 4 mm full-width half-maximum (FWHM) Gaussian kernel was applied before a motion adjustment step, which runs after realignment to suppress residual interpolation errors from large movements; the motion adjustment algorithm has better performance when images are lightly smoothed. Normalization to the Montreal Neurological Institute template, including resampling to 2 mm3 isotropic voxels, was performed, followed by a 7 mm FWHM spatial smoothing. The combination of the 4 and 7 mm spatial smoothing steps is roughly equivalent to a single 8 mm FWHM smoothing step. Segmentation and normalization of the T1 structural volume into white matter (WM), GM, and cerebral spinal fluid (CSF) were performed in SPM8.
Somatosensory ROIs
As this study was specifically focused on somatosensory functional connectivity and as we were interested in similarity and/or heterogeneity in connectivity differences across this region, we chose to use eight ROIs along the postcentral gyrus bilaterally for analyses presented here. ROIs were obtained from a previously published connectivity-based parcellation (∼300 parcellation; Fig. 1) (Shen et al., 2013) and spanned the pre- and postcentral gyrus bilaterally. Seed time courses were derived for each participant in each ROI by spatial averaging over voxels within each ROI.
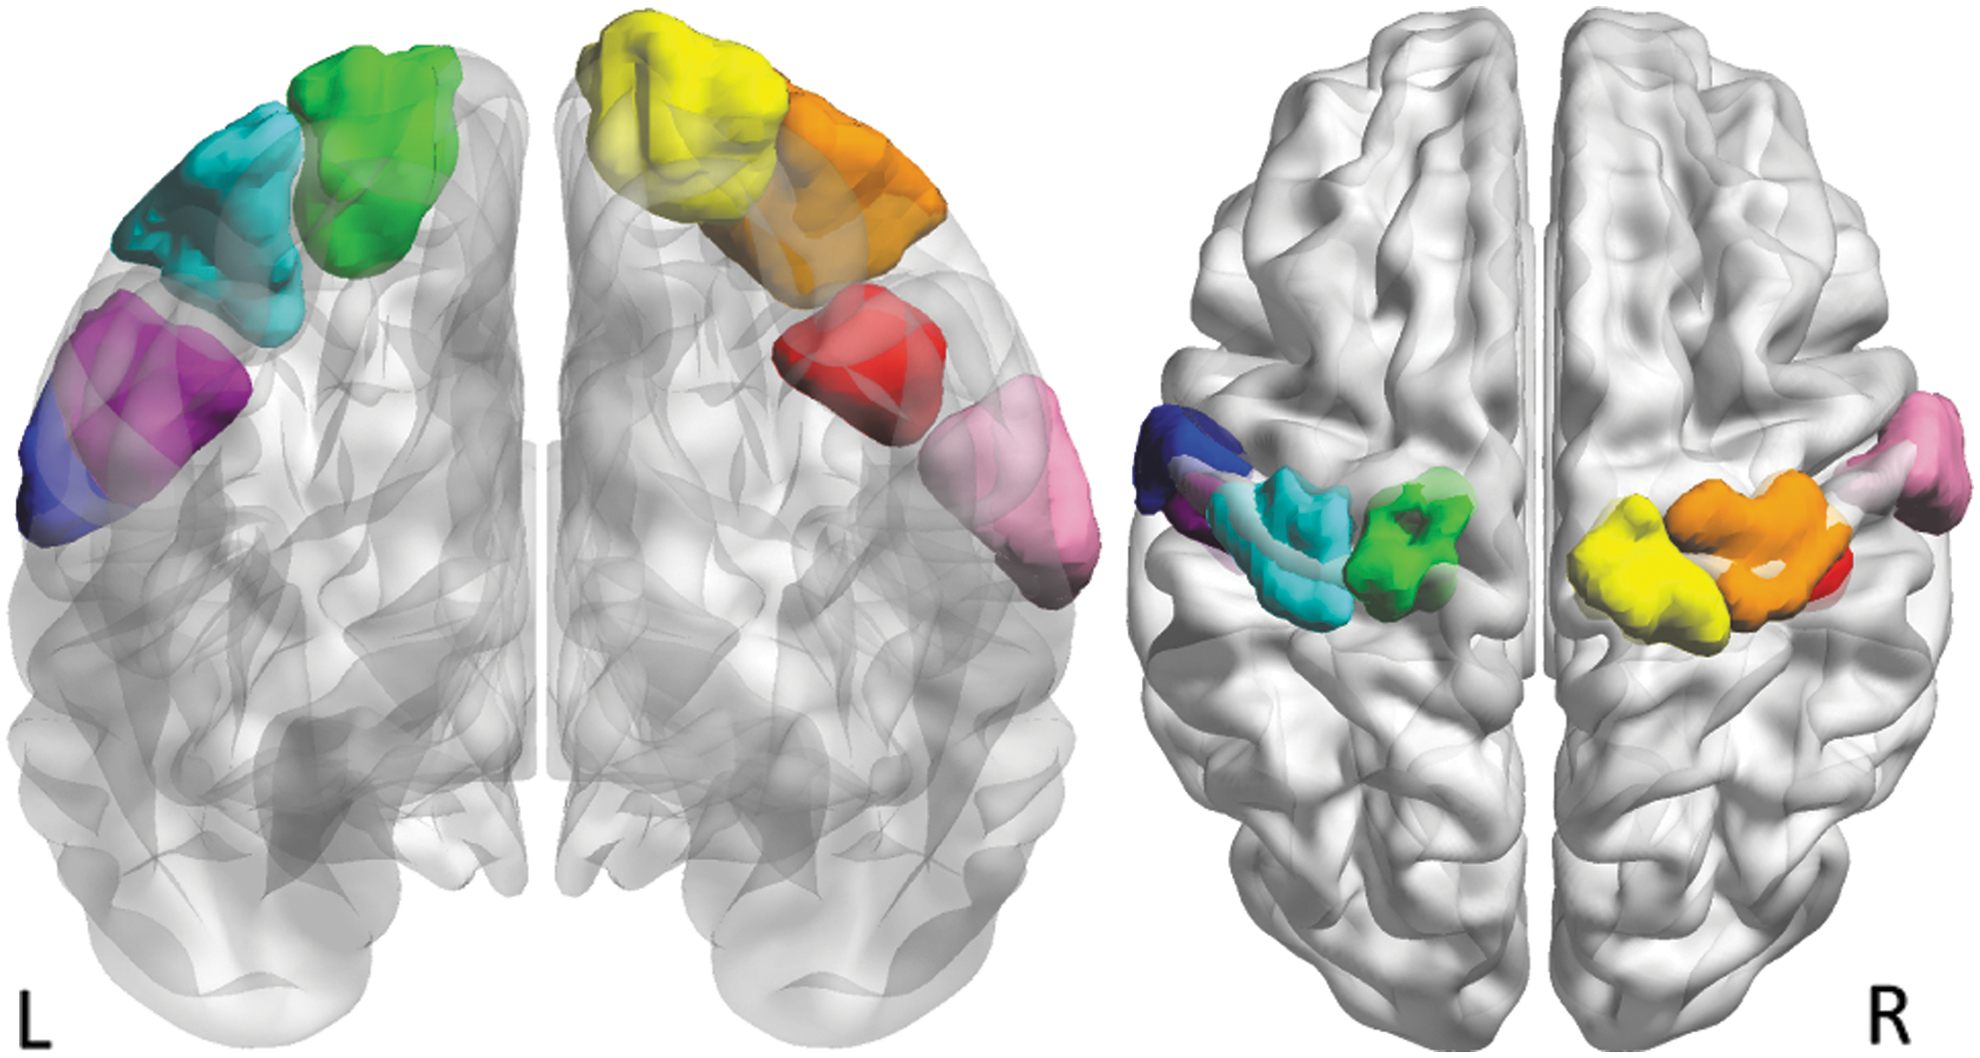
Somatosensory regions of interest along the postcentral gyrus. Regions were obtained through the parcellation published in Shen et al. (2013). From left to right: LBA 4.1 (blue), LBA1.3 (purple), LBA1.2 (teal), LBA1.1 (green), RBA1.1 (yellow), RBA1.2 (orange), RBA1.3 (red), and RBA1.4 (pink). Color images available online at
Functional connectivity models
Functional connectivity models were run in the ConnToolbox 15d extension (
Denoised data were entered into models at the individual subject level. For this, ROI time courses were entered into a set of eight first-level general linear models (GLMs) to estimate functional connectivity with the rest of the brain. For each seed region, contrasts were generated for the main effect of “seed,” that is, beta weights representing seed-to-voxel functional connectivity strength. These contrasts were then entered into second-level GLMs, which included group-level covariates: diagnosis (ASD, TD), age, gender, imaging site, full-scale IQ (FSIQ), and eye status during scan (open, closed). Linear covariates were entered as mean-centered values.
At the second level, contrasts were run to assess group differences, the effect of age, as well as the interaction between age and group. As comorbidities were only available from one imaging site, and medication status was variable, neither was used as covariates for analyses reported here.
Three additional sets of group-level models were run to assess associations between connectivity and symptom severity. These analyses were included because individuals with greater social symptoms are also more likely to experience sensory symptoms (Hilton et al., 2010). The first used the SRS total score as a covariate of interest, as this measure of symptoms was available for a subset of participants with and without ASD (n = 71, ASD = 23, TD = 48). We ran a second covariate analysis with a subset of participants with ASD using the ADOS-Gotham Severity scores (n = 61 ASD) (Gotham et al., 2009), and a third set of models using the Gotham restrictive repetitive behaviors (RRB) (n = 57 ASD). Gotham scores were used as they are better suited for comparison between modules and sites than raw scores (Gotham et al., 2009). The RRB subscale was used because it includes items specifically related to sensory symptoms. Covariates of no interest for these analyses were gender, imaging site, FSIQ, handedness, and eye status (open/closed) during scanning.
Finally, all models were repeated using a subsample strictly matched 1:1 on age, IQ, and gender (n = 134). To create this sample, all male ASD participants (n = 67) were matched to a same-site TD participant closest in age and IQ. Next, pairs of females were chosen to be age and gender matched, with a female from a different site chosen if a same-site counterpart could not be identified.
For all analyses, inferences were drawn at an uncorrected peak threshold of p < 0.001, and cluster-level family-wise error (FWE) correction was subsequently applied using Bonferroni correction for eight multiple comparisons (i.e., accounting for eight seeds; i.e., p < 0.05/8 = p < 0.00625).
In addition to whole brain inferences, to test a priori hypotheses about connectivity with specific networks, small volume corrections were performed in cerebellar, subcortical-limbic, and salience network ROIs, and are reported at p < 0.05 after FWE cluster-level correction. Subcortical-limbic and cerebellar masks were defined using the Wake Forest University anatomically labeled WFU_PickAtlas toolbox (
Global connectivity
In addition to assessing voxel-wise and network-wise differences in somatosensory functional connectivity, two measures of global connectivity were calculated (Cole et al., 2010): weighted and unweighted. In each case, the correlation between each of the eight seed ROIs and every GM voxel was computed. In the case of weighted global connectivity (wGBC) (Cole and Schneider, 2007), correlations with each seed were averaged over every GM voxel. In the case of unweighted global connectivity (uGBC) (Buckner et al., 2009), voxels with correlation >0.25 were counted. In this way, wGBC and uGBC measures were derived for each seed ROI. These values were entered into a set of linear models in IBM SPSS 21, accounting for site as a random factor, diagnosis as a fixed factor, with gender, interaction between gender and diagnosis, age, interaction between diagnosis and age, and eye status as covariates.
Results
Participant characteristics and data exclusion
Significantly more data sets from participants with ASD (67.5%) were removed than those from TD participants (42.4%) (Fisher's exact, p < 0.0001). Motion exclusion rates of participants were not significantly different based on gender in the ASD group (Fisher's exact, p = 0.141), but were significant based on gender in the TD group (p = 0.035) with 46.5% of TD males excluded due to motion and 29.4% of TD females. IQ was significantly lower in excluded participants with ASD (100 ± 16.7) than those included (105 ± 17.7) [t(203) = 2.26, p = 0.02]. IQ in excluded TD participants (110 ± 13.8) was not significantly different from that in included TD participants (109 ± 11.8) [t(208) = 0.29, p = 0.77]. ASD severity, based on ADOS-Gotham Severity scores, did not differ between included and excluded ASD participants [t(199) = 0.19, p = 0.85].
Residual total scan times between ASD (7.04 ± 1.55 min) and TD (7.00 ± 1.62 min) groups were not significantly different [t(186) = 0.27, p = 0.79]. The final sample of 188 data sets had significantly fewer female participants with ASD than with TD (Fisher's exact, p = 0.0016): 6/67 (8.96%) female participants with ASD, and 32/121 (26.44%) female TD participants. Groups did not differ in age [ASD = 12.7 (2.0), TD = 12.2 (2.3), t(186) = 1.60, p = 0.11], or IQ [ASD = 105.8 (17.7), TD = 109.5 (11.8), t(186) = 1.72, p = 0.13].
Group differences in somatosensory functional connectivity
Overconnectivity in ASD compared with TD was observed between a left lateral somatosensory seed (LBA4.1) and Brodmann's Area 7 (−28, −76, 44; n = 350; peak Z = 4.66; p = 0.001) within the left parietal cortex (Fig. 2). In the analysis excluding all participants who were taking medications (n = 167), this result remained significant (−28, −76, 44; n = 356; peak Z = 4.78; p < 0.001); no additional results were found in this model.

Overconnectivity in participants with ASD relative to TD controls. Image thresholded at p < 0.001 uncorrected and depicting a cluster that survived multiple comparison correction shown in red. This Brodmann's Area 7 cluster within the left parietal cortex (−28, −76, 44; n = 350; peak Z = 4.66; p = 0.001) showed greater connectivity in the ASD group when the left lateral somatosensory region (LBA4.1) was used as a seed. ASD, autism spectrum disorder; TD, typically developing. Color images available online at
Differential effects of age on somatosensory functional connectivity
No significant age-by-diagnosis interactions were found using whole-brain cluster-level correction. A significant age-by-diagnosis interaction effect was found between a right lateral somatosensory ROI (RBA1.4) and the dorsal anterior cingulate cortex (4, 16, 40; n = 196; peak Z = 4.31; p = 0.001) (Fig. 3a, b) when performing small volume correction within the salience network mask. In the analysis excluding all participants who were taking medications (n = 167), this result remained significant (−2, 10, 42; n = 135; peak Z = 4.33; p = 0.003); no additional results were found in this model.
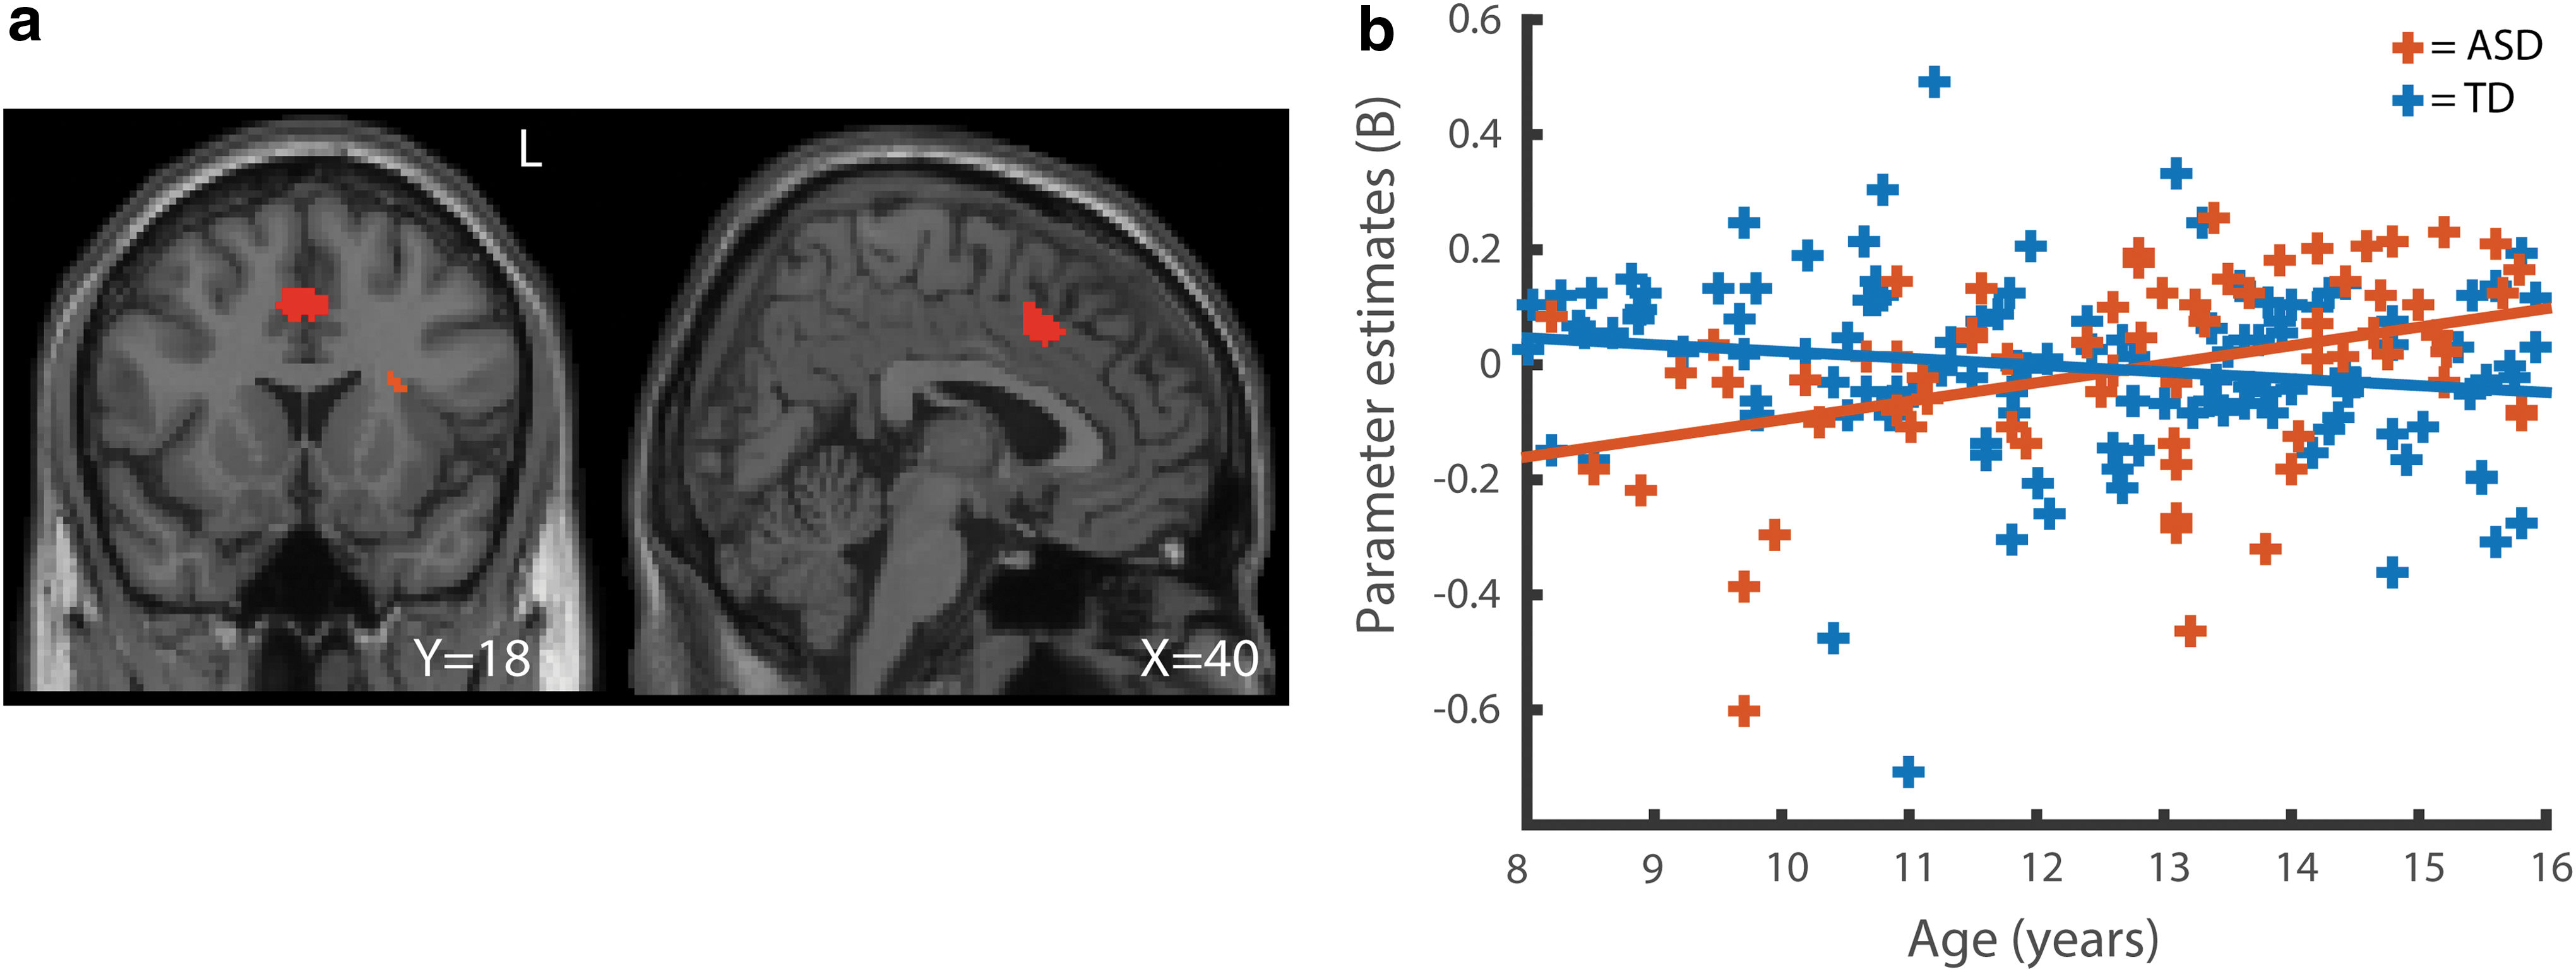
Age-by-diagnosis interaction in functional connectivity.
Somatosensory functional connectivity and symptom severity
No significant correlations between functional connectivity measures and ASD symptom severity were detected.
Matched sample analyses
No additional significant findings were observed in the 1:1 age-IQ-gender-matched subanalysis. The finding of ASD overconnectivity between LBA4.1 and Brodmann's Area 7 was confirmed in this sample (−28, −84, 46; n = 437; peak Z = 4.44; p < 0.001). The age-by-diagnosis interaction on connectivity between RBA1.4 and the dorsal anterior cingulated cortex was no longer significant in this sample (6, 16, 40; n = 120; peak Z = 4.03; p = 0.089).
Global connectivity analyses
No seed regions showed significant main effects of, or interactions with, diagnosis on wGBC or uGBC (all p > 0.05).
Discussion
This study tested the hypothesis that functional connectivity of somatosensory regions is atypical in children and adolescents with ASD. Using a relatively large multisite sample in a focused age range, we found limited evidence for connectivity differences of eight regions along the somatosensory strip, even when limiting the search space to targeted ROIs, and no evidence for associations with ASD symptom severity or global over- or underconnectivity. Our findings, therefore, suggest that functional connectivity of individually parcellated somatosensory regions is not atypical in youth with ASD. However, these findings were contrary to our expectations based on the previous literature, and we, therefore, highlight and discuss here several methodological reasons why that may be the case.
One of the largest studies to date examining functional connectivity differences in ASD, using the ABIDE-I sample, showed widespread hypoconnectivity in ASD with hyperconnectivity between somatosensory and subcortical regions (Di Martino et al., 2014). It is somewhat surprising that we did not find a similar hyperconnectivity effect using a subset of these data and similar methodology. However, there are several notable differences between studies. First, our sample was restricted to a narrow age range and we used different criteria for excluding participants based on head motion. Although both of these differences affect the characteristics of the data used for modeling, it also resulted in a smaller sample size (188 vs. 763; all males in both studies). It may be that the hyperconnectivity detected in the previous study was driven by older participants, and, therefore, is not apparent in our narrower age range.
Alternatively, there may be subtle hyperconnectivity that is not apparent in our sample with reduced power. A third possibility is that differences in methodology, including data processing or the parcellation scheme used to analyze the data, led to different findings. Di Martino et al. (2014) found similar results using two parcellation schemes for choosing seed regions (structural: Harvard–Oxford Atlas (Kennedy et al., 1998) functional: Crad-200 (Craddock et al., 2012)). The parcellation we used was finer than both of these at ∼300 regions (Shen et al., 2013). We also note that Di Martino et al. (2014) used an ROI-to-ROI connectivity measure, whereas we used a seed-to-voxel approach.
A second study used ICA on a different subset of the ABIDE-I data and also found increased correlation between primary sensory networks and basal ganglia and thalamus networks (Cerliani et al., 2015). This study used a carefully matched subset of the data that included 359 male participants (166 ASD and 193 TD) aged 7–50 years. The use of ICA can be considered a relatively coarse parcellation of the data, and this is a methodological difference that, in addition to the difference in age range, may have affected the results. Together this suggests that sample characteristics such as age range and methodological choices such as the use of seed-to-voxel rather than ROI-to-ROI or ICA component-to-ICA component may influence the ability to detect group differences in somatosensory functional connectivity.
A further important consideration in ASD is heterogeneity and several studies have shown idiosyncratic patterns of functional brain response (Byrge et al., 2015) and functional connectivity (Hahamy et al., 2015). Directly relevant to this study, it has recently been shown that somatomotor networks, in particular, have a relatively idiosyncratic spatial organization in individuals with ASD (Nunes et al., 2018). This finding has several implications for the analyses conducted here. The first is that the seed regions we chose that were derived from a separate data set of TD individuals (Shen et al., 2013) may be a better fit to somatomotor network regions in TD individuals. The second is that the pattern of functional connectivity of these regions may be more variable in participants with ASD relative to those with TD rather than higher or lower on average, which our analyses were not designed to detect.
In addition to between-group comparisons, we tested associations between functional connectivity and ASD symptom severity, because the severity of sensory symptoms has been correlated with the extent of social symptoms (Hilton et al., 2010). No significant findings emerged from these additional comparisons. However, it is important to acknowledge that sensory sensitivities were not specifically characterized in this sample. This leaves open the possibility that aberrant somatosensory functional connectivity may specifically associate with sensory symptoms (Green et al., 2016). In future work, associations with more specific measures of sensory symptoms should be performed. It is also unknown how the sensitivity of functional connectivity to this symptom compares with evoked activation (Puts et al., 2014; Tavassoli et al., 2016), and whether fMRI or magnetoencephalography, which detect signals in different frequency bands (Khan et al., 2015b), may be more sensitive to neural differences in sensory processing.
The only significant group difference identified in our analyses was overconnectivity in ASD between a left lateral ROI in the somatosensory strip (LBA4.1, Fig. 1) and the left lateral posterior parietal cortex. This seed region likely corresponds to the region for sensory input for the head and face (Penfield and Rasmussen, 1950), whereas the resulting cluster is contained within the somatosensory association network (Brodmann's Area 7) in the posterior parietal cortex. The superior parietal lobule has been implicated in saccadic eye movements and visuospatial processing (Simon et al., 2002), and is not typically included in sensorimotor resting state networks (Smith et al., 2009). However, given that participants with ASD have been found to have a more spatially variable somatomotor network (Nunes et al., 2018), this finding may reflect differences in the configuration of this network. We note that this finding was unexpected and requires independent replication.
To more specifically test the hypothesis that sensory regions would be overconnected to subcortical-limbic regions, or regions involved in salience processing or motor integration, a set of targeted masks were defined. However, even at a small volume-corrected threshold, we did not replicate previous findings of overconnectivity between sensory and subcortical regions (Cerliani et al., 2015; Di Martino et al., 2014). Both of these previous studies also used data from the ABIDE data set; however, both included a larger sample over a wider age range. Differences from findings reported here could be attributed to differences in sample size/statistical power, age range, or methodology. In particular, Cerliani et al. (2015) used ICA rather than a seed-based approach. Longitudinal studies could shed light on developmental effects. Increased cerebellar functional connectivity to sensorimotor networks has previously been reported in youth with ASD (Khan et al., 2015a). Given the role of the cerebellum in both cognitive and sensorimotor functions (O'Reilly et al., 2010), this was also included as a target ROI in our study, but did not show any significant differences.
The salience network was included as one of our a priori ROIs because it has been suggested to be particularly important in the physiology of ASD (Uddin et al., 2013a). The salience network plays a role in integrating external sensory input with internal information about the behavioral relevance of stimuli (Seeley et al., 2007). A previous study using a seed in the AI, found that overconnectivity of this region to sensorimotor areas was associated with sensory overresponsivity in ASD (Green et al., 2016), further suggesting that the salience network may be implicated in sensory features of ASD. Based on this, we hypothesized that our somatosensory seed regions would show overconnectivity with the salience network in ASD. However, rather than a main effect, we found a significant interaction between diagnosis and age in the functional connectivity between one of the somatosensory seeds and a cingulate region. The interaction effect showed an increase of functional connectivity in the ASD group with age, which was distinct from a trend-level decline in the TD group. Given that we would expect sensory symptoms to decline rather than increase across our sample, it seems unlikely that this finding relates to sensory symptoms. Our findings do suggest that functional connectivity of this region may distinguish people with ASD from people with TD more in adults than in children and reinforces the suggestion that studies of ASD neurophysiology should be considered in a developmental context (Uddin et al., 2013b). We note that the dorsal cingulate has been shown to respond atypically in ASD in several tasks, including shifting between internally and externally focused attention (Barttfeld et al., 2012) and social target detection (Dichter et al., 2009). However, given the unexpected nature of this finding, the functional relevance of this finding is not clear.
Finally, to assess the possibility that connectivity differences are broad rather than specific to one region or set of regions, two measures of global connectivity (weighted vs. unweighted) were compared. However, no significant differences were identified for somatosensory seeds. Global hypoconnectivity has previously been reported in adolescents with ASD relative to adolescents with TD, and suggested as an endophenotype that is present in a less severe form in unaffected siblings (Moseley et al., 2015). This is consistent with a review that found many studies in adolescents and adults to report hypoconnectivity, whereas studies in children are more likely to report hyperconnectivity in ASD (Uddin et al., 2013b).
Although strengths of this study include a relatively large sample size in a focused age range and a set of complementary analyses, there are several limitations. The most important limitation is the lack of specific assessments of tactile processing differences and sensory sensitivities, which would have enabled more focused brain–behavior correlation analyses. Although we made use of the available measures of symptoms, including the Gotham-ADOS RRB scores, this measure provides only a limited assessment of sensory symptoms in a brief interaction. Although age effects were examined, cross-sectional rather than longitudinal data may have limited our ability to detect developmental effects. The number of participants excluded due to excessive motion was proportionally higher in the ASD sample than in the TD sample, and within the ASD group excluded participants had a significantly lower IQ. This suggested a biased sample, and is common in MRI studies as the most severely affected patients are more likely to move. This is particularly relevant in a study of sensorimotor functional connectivity as the patients who have difficulty staying still may be those with more atypical sensorimortor brain networks. However, if their data are not reliable, they cannot contribute to making valid inferences. Nonverbal IQ measures are preferred in studies of ASD because verbal-based IQ assessments may underestimate intelligence in individuals with ASD (Mottron, 2004). However, because not all studies contributing to ABIDE provided verbal (VIQ) and procedural (PIQ) scores, our analyses used full-scale (FIQ) scores. Finally, the use of multisite data acquired on different MRI systems with different acquisition parameters contributes to variability in the data that may have limited our ability to detect significant group effects, but in contrast it increases the generalizability of findings.
In conclusion, we examined functional connectivity of a set of regions along the somatosensory strip, to determine whether functional connectivity is atypical in youth with ASD. Using a large sample, stringent head motion controls, and accounting for factors such as age and IQ, very limited significant differences in functional connectivity were found and no significant linear associations were found in relation to symptom severity. This suggests that although abnormal activity and connectivity may play a role in the manifestation of sensory sensitivities in ASD (40), resting BOLD functional connectivity may not be a sensitive marker for this symptom.
Footnotes
Acknowledgments
We would like to acknowledge the generous contribution of the scientists who contributed to the ABIDE project, and all the families who participated in this research. This work was supported by an NSERC i3T CREATE award to B.C., a SickKids Foundation and CIHR-IHDCYH award to S.B., and a CIHR salary award to C.L. The authors also acknowledge support from ACHRI, ACHF, and the Sinneave Family Foundation.
Author Disclosure Statement
C.L.'s spouse is an employee of General Electric Healthcare. No other competing financial interests exist.