




Abstract
In recent years, there has been strong interest in neuroscience studies to investigate brain organization through networks of brain regions that demonstrate strong functional connectivity (FC). Several well-known functional networks have been consistently identified in both task-related and resting-state functional magnetic resonance imaging (rs-fMRI) across different study populations. These networks are extracted from observed fMRI using data-driven analytic methods such as independent component analysis. A notable limitation of these FC methods is that they do not include or provide any information on the underlying structural connectivity (SC), which is believed to serve as the basis for interregional interactions in brain activity. We propose a new statistical measure of the strength of SC (sSC) underlying FC networks obtained from data-driven methods. The sSC is developed using information from diffusion tensor imaging (DTI) data. A key advantage of sSC is that it is a standardized coefficient that adjusts for the different number of voxels and baseline SC of various functional networks. Hence, sSC can be applied to compare the strength of structural connections across different FC networks. Furthermore, we propose a reliability index for data-driven FC networks to measure the reproducibility of the networks through resampling the observed data. By evaluating the association between the sSC and reliability index, we can investigate whether underlying SC informs the reliability of identified FC networks. To perform statistical inference such as hypothesis testing on the sSC, we develop a formal variance estimator of sSC based on a spatial semivariogram model with a novel distance metric. We demonstrate the performance of the sSC measure and its estimation and inference methods with simulation studies. For real data analysis, we apply our methods to a multimodal imaging study with rs-fMRI and DTI data from 20 healthy controls and 20 subjects with major depressive disorder. Results show that well-known resting-state networks all demonstrate higher SC within the network compared with the average structural connections across the brain. We also found that sSC is positively associated with the reliability index, indicating that FC networks that have stronger underlying SC are more reproducible across samples. These results provide evidence that structural connections do serve as structural basis for the FC networks and that the structural information from DTI data can be leveraged to inform the reliability of functional networks derived through data-driven methods.
Introduction
I
Numerous statistical approaches have been applied to evaluate FC in network-oriented analysis. These methods can be generally grouped into two classes of approaches, namely correlation-based and partitioning methods. The correlation procedures quantify dependence between spatially distinct brain regions with correlations or partial correlations based on fMRI BOLD time series (Hampson et al., 2002; Kemmer et al., 2015; Wang et al., 2016). The second class of data-driven FC approaches uses partitioning algorithms to identify spatially distinct components or clusters in the brain, with each component containing voxels exhibiting similar neural processing characteristics over time. For example, cluster data analysis was one of the first partitioning methods that had applications in fMRI studies (Bowman and Patel, 2004; Cordes et al., 2002).
In recent years, independent component analysis (ICA) has become the most frequently used partitioning method to identify brain functional networks (Beckmann and Smith, 2004, 2005; Calhoun et al., 2001; Guo and Pagnoni, 2008; Lukemire et al., 2018; Shi and Guo, 2016; Wang and Guo, 2018). Based on the approaches such as ICA, some primary brain functional networks have been consistently identified across studies such as the default mode network, visual network, and sensorimotor network (Smith et al., 2009).
For the FC networks, it is presumed that axonal fiber tracts serve as the basis for interregional interactions in brain activity. However, the nature of this structure/function relationship is only beginning to be revealed. Evidence of the structural connectivity (SC) and FC relationship has emerged from computational work as well as clinical observations. For example, computational research has suggested that the underlying anatomical architecture of the cerebral cortex shapes resting-state FC on multiple timescales (Ghosh et al., 2008; Honey et al., 2007). Earlier clinical observations have revealed that interhemispheric FC is directly related to callosal integrity (Putnam et al., 2008; Quigley et al., 2003). Recent advances in diffusion MRI now provide a direct approach to empirically examine the structure/function relationship in human brains.
In recent work, joint analysis of fMRI and diffusion tensor imaging (DTI) data has provided evidence suggesting a general correspondence between FC (measured by correlation-based FC) and SC (measured by diffusion tractography) (Hagmann et al., 2008; Honey et al., 2009; Koch et al., 2002; Várkuti et al., 2011; Ward et al., 2014; Zhu et al., 2014). There has been work (Bowman et al., 2012; Xue et al., 2015) that jointly analyzes fMRI and DTI data to more accurately determine FC while incorporating direct SC. Goñi and associates (2014) utilize network metrics measured from anatomical network and predict FC network based on those metrics. Mueller and associates (2013) offer a new approach for comparing FC and SC by directly comparing their variability. Chamberland and associates (2017) jointly study SC and FC using a recently proposed test/retest approach that better quantifies intersubject variability by first correcting for intrasubject nuisance variability that can artificially influence FC and SC measures.
Several methods based on Gaussian graphical modeling have been developed to estimate sparse FC networks from fMRI data while using the SC to inform the selection of the shrinkage parameters for the FC precision matrix (Higgins et al., 2018; Hinne et al., 2014; Ng et al., 2012). In particular, the recently proposed structurally informed Gaussian graphical model (Higgins et al., 2018) provides a flexible approach for accommodating heterogeneity in the structure/function relationship and enables robust FC network estimation even in the presence of misspecified anatomical knowledge.
Given the significant development in joint analysis of FC and SC, some important questions still remain. First, it is important to examine whether and how the strength of SC (sSC) varies across functional networks, which will help us to understand the difference in anatomical structure underlying various FC networks. Second, it will be insightful to determine whether the sSC is associated with the reliability or robustness of FC networks. Researchers have observed that some functional networks are more reproducible or robust across studies and samples. It will be interesting to investigate whether the difference in underlying SC plays a role in this robustness. Third, it is beneficial to explore whether the sSC underlying each of the FC networks differs between subpopulations, such as subjects with psychiatric or neurologic diseases versus healthy controls.
To address these objectives, we need to develop a meaningful measure of within-network sSC that is comparable across FC networks and also across subjects. Currently, a commonly used approach to summarize the SC derived from a probabilistic tractography algorithm based on DTI data is to construct a structural network based on the SC and then calculate some network metrics such as average degree or clustering coefficient to quantify the SC property for functional networks (Achard and Bullmore, 2007; Li et al., 2009; Tao et al., 2015). These methods focus on summarizing network topology measures, which are different from our goal of quantifying the sSC within an FC network.
A more relevant approach to define the sSC is to use a raw measure of within-network SC, which is the sum of the count or proportion of fiber track connections from the probabilistic tractography for all pairs of nodes within an FC network. However, this raw within-network SC measure has limited comparability across networks and across subjects. First, it does not account for the difference in the size or number of voxels of the brain regions that constitute the FC networks. Second, the raw within-network SC measure does not account for the variations in the baseline SC across different FC networks.
In this study, baseline SC represents the average sSC between a brain location within an FC network and a random location in the brain, which can be either within or outside the FC network. FC networks that consist of regions adjacent to high-traffic white matter areas where there is a high density of fiber bundles often have higher baseline SC. Consequently, these FC networks tend to show higher raw SC measures compared with other FC networks that are not located adjacent to major fiber bundles, even if the other networks actually have stronger and more coherent within-network SC relative to their baseline SC. We have demonstrated the limitations of the raw within-network SC measure via simulation studies (Appendix A3). Moreover, the raw within-network SC measure may have limited comparability across subjects due to the differences in baseline SC between subjects.
We present a novel measure of the sSC underlying a functional network, which can help us understand the structural underpinnings of functional interactions in the brain. We use this measure to characterize the sSC underlying FC networks estimated by a data-driven FC method such as ICA. A key advantage of our sSC is that it is a standardized coefficient that adjusts for the different number of voxels and for baseline SC related to a functional network. This standardization makes sSC a more suitable measure to compare the strength of structural connections across different FC networks and to investigate differences in SC between subpopulations.
We develop an estimator for sSC based on DTI probabilistic tractography. We develop a variance estimator, based on a parametric semivariogram model with a novel distance metric, to quantify the variability of the estimated sSC. For inferences, we develop three statistical tests for addressing various questions in FC and SC analysis. The first test evaluates the significance of sSC of a given functional network. The second examines the difference in SC between functional networks. The third test evaluates whether there is a significant difference in sSC between subject groups. We conduct simulation studies to evaluate the performance of our proposed measure and apply our method to a resting-state fMRI (rs-fMRI) and DTI data set.
The proposed sSC measure is applicable to investigate whether underlying SC informs the reliability of FC networks derived from data-driven methods. One issue with data-driven FC analysis is that the estimated FC networks often vary across samples or methods. For example, the results from an ICA run may vary based on the choice of algorithm, starting values, subject variability, or data preprocessing steps (Calhoun et al., 2004). Some functional networks may not be reproducible in different analyses or in other data sets. Determining the reliability of the estimated ICs obtained from a given data set is important for appropriate interpretations of the extracted networks.
Previous work has proposed assessing reliability of the estimated networks by evaluating the reproducibility in repeated ICA runs, with different initial conditions, with data resampled from the original functional time series, or with simulated data having a known brain network structure (Duann et al., 2006; Himberg et al., 2004; Meinecke et al., 2002). These approaches measure the reliability of networks only through the algorithmic and statistical reproducibility of ICA applied to fMRI data. The goal in this article is to evaluate whether the structural connections underlying these FC networks are related to the reliability of these networks. To this end, we propose a reliability index that measures the reproducibility of the estimated functional networks based on bootstrapped samples. We then evaluate the association between the sSC and the reliability index across functional networks.
Several well-known functional networks have been consistently identified in both task and rs-fMRI studies across different populations (Buckner et al., 2008; Damoiseaux et al., 2006; Laird et al., 2011; Smith et al., 2009). Some networks are identified more robustly than others, although it is unclear why. Our proposed measure of sSC will allow us to investigate the underlying SC of different functional networks, and to better understand the differences in their anatomical underpinnings, reliability, and other aspects of their nature.
Materials and Methods
Data
Subjects
We apply our method to the rs-fMRI data from a total of 40 subjects, including 20 healthy controls and 20 patients with major depressive disorder (MDD), from the Predictors of Remission in Depression to Individual and Combined Treatments (PReDICT) study (Dunlop et al., 2012). We estimated FC networks from healthy subjects. They were an average age of 42.4 years (SD: 9.0) and were 50% male.
Using the rs-fMRI and DTI data collected from this group of subjects, we used the proposed sSC measure to evaluate the SC underlying the extracted FC networks and investigated the association between sSC and reliability measure. In addition, we compared sSC between the 20 healthy subjects versus the 20 MDD patients. The MDD patients were matched with healthy control subjects by age and gender, with an average age of 45.8 years (SD: 9.6) and 50% male. The mean Hamilton Depression Rating Scale (HAM-D) score for the MDD subjects was 19 (SD: 3.4), indicating “Severe Depression” (Hamilton, 1960). The average length of their current depression episode was 82 weeks.
Data acquisition and preprocessing
DTI, rs-fMRI, and T1-weighted data were collected in a single session with a 3T Siemens Tim Trio scanner. The DTI sequence consisted of 60 scans with different diffusion-weighted directions (
For registration purposes, high-resolution T1-weighted images were collected using a 3D MPRAGE sequence with the following parameters: TR = 2600 ms, TI = 1100 ms, TE = 3 ms, number of slices = 176, voxel size = 111 mm, matrix size = 224256, and flip angle =
Several standard preprocessing steps were applied to the rs-fMRI data, including despiking, slice timing correction, motion correction, registration to MNI 2 mm standard space, normalization to percent signal change, removal of linear trend, regressing out cerebrospinal fluid (CSF), white matter, and six movement parameters, bandpass filtering (0.009–0.08), and spatial smoothing with a 6 mm full width at half maximum Gaussian kernel. Preprocessing steps for the DTI data include brain extraction to remove nonbrain regions, phase reversal distortion correction, and aligning diffusion-weighted images to the average nondiffusion-weighted image by rigid body affine transformation to remove motion and eddy current-induced artifact. We then estimate the directional diffusion at each voxel based on a diffusion tensor model implemented via the diffusion toolbox in FSL (Behrens et al., 2003).
Functional network estimation
We estimated group-level functional networks from the rs-fMRI data using the Group ICA for fMRI Toolbox (GIFT) (Calhoun et al., 2001). We extracted 20 independent components from the data and identified a set of components that represent well-established resting-state functional networks (Smith et al., 2009).
SC estimation
SC is assessed using DTI data, a diffusion-weighted MRI technique that estimates the location of structural fibers in the brain by measuring the direction and magnitude of water diffusion, since water tends to diffuse along white matter fiber tracts (Johansen-Berg and Rushworth, 2009). We evaluated SC across the whole brain by implementing a widely used probabilistic tractography algorithm via the PROBTRACKX function in FSL's diffusion toolbox (Behrens et al., 2003, 2007). This procedure successively initiates streams from a seed voxel, which are intended to trace the paths of white matter fibers throughout the brain by sampling from the distributions of voxelwise principal diffusion directions.
To facilitate estimation of plausible white matter tracts, all seeding voxels used in the algorithm are located in white matter. There was an average of 900 white matter seeding voxels in each functional network; 5000 streams were initiated from each seed voxel and traced voxel-by-voxel as they passed through the diffusion tensor field, terminating according to a set of stopping rules. The following stopping rules were implemented to avoid estimation of implausible tracts. A white matter inclusion mask was imposed to select only streams that pass through white matter in the brain; a CSF exclusion mask was also imposed to exclude any streams that pass through CSF. Furthermore, a curvature threshold (0.2) was imposed to limit any pathways with sharp turns, and streams were terminated when they had traveled 2000 steps or looped back on themselves.
Methods
The sSC measure
We propose a new statistical measure for quantifying the sSC underlying a functional network. The sSC is defined based on the average sSC between brain locations that constitute the functional network, reflecting the strength of within-network SC. Suppose that based on a data-driven FC method such as group ICA, we extracted q functional networks of interests. In group ICA, spatial distribution of functional networks is reflected by the component maps estimated from ICA. We propose the following measure,
Here,
where V is the total number of voxels within the brain. Similarly,
The raw SC probability,
We further standardize the sSC measure by dividing by the maximum possible value, in which there is complete SC between all voxel pairs within the functional network (i.e.,
In the sSC definition (1), j and k represent voxels in a functional network. Hence, the proposed sSC is a voxel-level measure of SC underlying an FC. Alternatively, we can define sSC in a similar way on the region level, where j and k represent regions within a functional network.
By adjusting for the network's baseline SC and standardizing the scale of the measure, the proposed sSC removes the effects from network-specific factors, such as network size (i.e., total number of voxels), the proportion of gray matter and white matter regions in the network, and the spatial location of a network. Therefore, sSC can potentially provide more accurate reflection of the relative within-network SC across different networks than the raw SC, which is demonstrated via simulation studies (Appendix A3).
We further illustrate the difference between the proposed sSC and the raw SC using real imaging data. We present comparisons between the two measures for three FC networks, including visual network, DMN, and executive control network for multiple subjects (Fig. 1). Across subjects, sSC consistently shows that it is highest in the visual network and lowest in the executive control network, which reflects the fact that the visual network has higher relative within-network SC than the executive control network. The raw SC, on the contrary, shows opposite results where it is highest for the executive control network and lowest for the visual network. The difference indicates that by adjusting the network-specific factors, the proposed sSC more accurately reflects the relative within-network SC across different FC networks.

Illustration of the difference between proposed sSC and raw SC. We show results of the two measures for three FC networks, including visual network, DMN, and EC network using data from five randomly selected subjects from a multimodality neuroimaging study. Across subjects, sSC consistently shows that the sSC is highest in the visual network and lowest in the EC network. The raw SC, on the contrary, shows the opposite results due to lack of adjustment for network-specific factors. DMN, default model network; EC, executive control; FC, functional connectivity; sSC, strength of structural connectivity.
Estimation and inference for the sSC measure
Estimate of the sSC measure
Plugging in the estimated probability of SC derived from probabilistic tractography yields the following estimator for the sSC measure of the 
where
Variance of the sSC estimate
To conduct statistical inference for
We can re-express the proposed sSC estimate,
where
Here,
Equation (3) shows that the numerator and denominator of
We have shown that the diagonal variance elements of the variance/covariance matrix
We use a novel approach based on a parametric semivariogram model (Bowman, 2007; Cressie, 1992; Gao et al., 2017) to estimate the covariance between pairs of stream counts from a probabilistic tractography procedure. Specifically, we model each covariance term,
One distinct feature in modeling spatial dependence between the tractography stream counts is that there is no straightforward way to define the spatial distance between
where
Biologically, the distance metric
The semivariogram offers a flexible approach to model the covariance as a function of spatial distance, since there are many different types of semivariogram models (e.g., exponential, Gaussian, spherical, and Matern class), each of which is characterized by shape parameters known as the range, sill, and the nugget effect. Thus, we use the semivariogram model to incorporate spatial dependence via our proposed distance metric (4) in the estimation of covariance between stream counts. The parametric model, and its associated parameters, is then estimated by fitting to the empirical semivariogram using the observed data (Cressie, 1992).
After obtaining the variance/covariance matrix 

In addition to (5), we consider a nonparametric variance estimate based on the bootstrap. We will compare the performance of the parametric versus bootstrap variance estimators in simulation studies.
Hypothesis testing based on the sSC measure
Based on the estimated sSC
In the first case, we aim to test the significance of sSC within a given functional network. For a network represented by the
with
The second test aims to compare the sSC between two networks characterized by components
Third, we can test whether the sSC for a given network, for example, the
where n
1 and n
2 are the number of subjects in each subgroup, and the definitions for the subgroup mean and variance terms are analogous to those in (6). If
Does sSC inform the reliability of functional networks?
It is often of interest to investigate the reliability of functional networks derived from data-driven methods such as ICA. The reproducibility of an estimated network varies across different runs of the algorithm or different samples of subjects. For example, due to the stochastic nature of the ICA algorithm and individual subject variability, the ICA-derived functional networks often vary across different fMRI studies or even across various ICA runs based on the same data. Researchers also noticed that some networks tend to be more reproducible compared with others (Zuo et al., 2010).
We investigate whether the strength of structural connections underlying functional networks is associated with their reliability. One hypothesis is that networks that have stronger direct structural connections may tend to be more reproducible given their underlying structure. Generally, a more reproducible functional network is interpreted as a network that is more consistently identified across different subject data sets sampled from the population and with different initial computational conditions. To aid our evaluation of potential links between sSC and reliability, we propose a novel reliability index, which basically assesses how reproducible each of the original components is in bootstrap samples from the original data. Please see the following Algorithm 1 for the definition of the proposed reliability index and the estimation procedure.

where
In the proposed reliability index (8), the first term in the numerator of
We further standardize the measure by dividing by its maximum possible value, in which the original component
Results
Simulation studies
We conduct simulation studies to evaluate the performance of the estimation and inference methods for the proposed sSC measure. We simulate fMRI data from two underlying source signals, that is,

True independent component maps for simulation studies. Source signal intensity for the true independent component maps for simulation studies. We simulated data from two underlying independent components (i.e., ICs). For each source, the spatial maps for the IC source signals are
We then simulate SC based on DTI data. To simulate the results of a probabilistic tractography procedure, we generate a
We use the model
Our simulation study mainly aims to assess the accuracy of the proposed estimation and inference methods for sSC. Therefore, streamline counts are directly simulated from distributions instead of inferred from simulated DTI data. As a reviewer pointed out, there are now approaches, such as that used in ISMRM 2015, to generate more realistic SC data. For future work, we plan to investigate more sophisticated approaches for generating SC data that closely mimic white fiber tracts in the brain. We like to point out that a challenge for this more realistic simulation is that one will need to find ways to obtain the true values of some parameters such as the covariance of SC streamlines, which are unknown in this setting.
Once the subject-level fMRI and SC data have been simulated, we estimate the group-level IC maps using the GIFT method (Calhoun et al., 2001), and then estimate sSC for each of the estimated ICs. Table 1 summarizes the results under different simulation settings with varying sample sizes and noise levels, with 300 simulation runs for each setting. We estimate the sSC for each of the two ICs along with its variance using the proposed theoretical variance estimator (based on semivariogram model) as well as the nonparametric bootstrap variance estimator (based on 1000 bootstrap resamples). We also evaluate the coverage probabilities of two types of 95% confidence intervals (CI): the Wald-type CI based on the theoretical standard errors (SE), and the CI based on the bootstrap percentiles.
Simulation Results for Estimating the Strength of Structural Connectivity Based on 300 Simulated Data Sets
Coverage probabilities I: Based on Wald-type CI using theoretical SE. Coverage probabilities II: Bootstrap percentile CI.
Results under the different simulation settings with varying sample sizes and noise levels, with 300 simulation runs for each setting. We estimate the sSC for each of the two ICs along with its variance using the proposed theoretical variance estimator based on semivariogram model (Theoretical SE) and the nonparametric bootstrap variance estimator based on 1000 bootstrap resamples (Bootstrap SE). We also evaluate the coverage probabilities of two types of intervals (CI): the Wald-type CI based on the theoretical SE (Cov. Prob. I), and the CI based on the bootstrap percentiles (Cov. Prob. II).
We evaluate the bias of our sSC estimator by comparing the mean
Because calculation of the theoretical variance term requires estimating the large matrix
Based on a reviewer's suggestion, we have conducted additional simulation studies to demonstrate the advantages of the proposed sSC over the raw within-network SC measure. We show that the proposed sSC has better comparability across FC networks with a different number of voxels or different baseline SC. Details are presented in Appendix A3.
Application to real data set
sSC analysis
We apply our sSC method to an fMRI and DTI data set from the PReDICT study. First, we evaluate and compare the sSC underlying various functional networks. We run a group ICA using fMRI data from 20 normal controls, since studies of MDD have shown resting-state FC differences in MDD patients (Greicius et al., 2007; Northoff et al., 2011; Veer, 2010). We extract

Brain functional networks estimated based on group ICA of subjects' fMRI data in the PReDICT study. We extract 14 ICs from the data and 9 of them correspond to well-known resting-state networks. fMRI, functional magnetic resonance imaging; ICA, independent component analysis. PReDICT, Predictors of Remission in Depression to Individual and Combined Treatments.
To evaluate the SC distribution of each IC, we conduct a probabilistic tractography procedure using voxels in the thresholded IC mask as seed locations. We initiate
Table 2 shows sSC results for nine estimated ICs from healthy controls. The
Results of Hypothesis Testing for the sSC for ICA-Derived Brain Functional Networks Among Control Subjects in PReDICT Study
All ICs have strength of underlying SC that is highly significantly greater than 0 (p < 0: 0001), indicating that the sSC within the functional networks is higher than the background sSC in the brain. Among the networks, the visual network demonstrates the highest sSC, while the executive control network displays the lowest sSC (see bolded values). SEboot(
ICA, independent component analysis; PReDICT, Predictors of Remission in Depression to Individual and Combined Treatments; sSC, strength of structural connectivity.
Among the networks, the visual network demonstrates the highest sSC, while the executive control network displays the lowest sSC. Figure 4 displays the SC distribution for these two networks. It shows that the visual network has a much higher within-network SC compared with its background SC across the brain, while the executive control network has low within-network SC relative to the rest of the brain. Permutation testing reveals that the sSC underlying the visual network is significantly higher than the sSC underlying the executive control network (
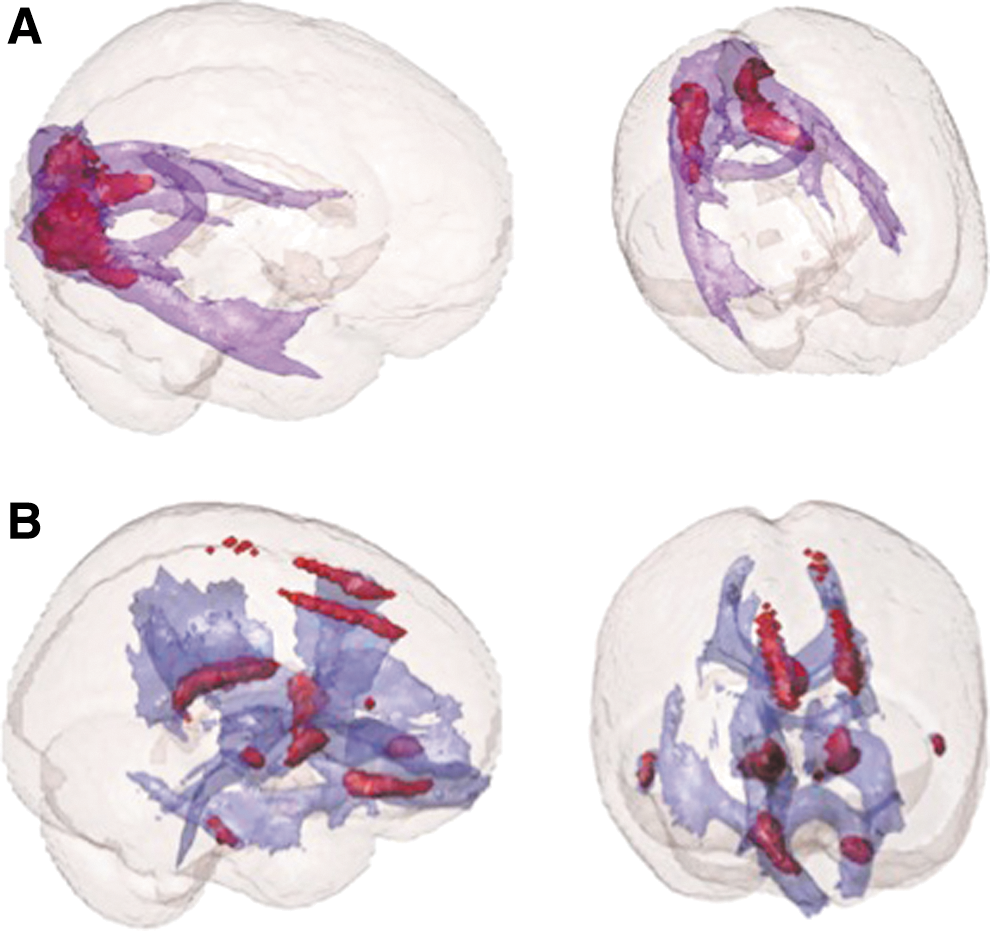
The structural connections of two brain functional networks (visual network and executive control network) estimated from the PReDICT study. Here, the red area represents the IC maps of each brain network estimated via the group ICA, and the blue region represents the structural connections of the IC region with the rest of the brain.
Next, we examine the difference in sSC for each IC between the control and MDD subject groups (Table 3). Results show each group's mean sSC for each IC, along with the bootstrap-based 95% CI and p-values (uncorrected) for the group difference in sSC. p-Values are derived based on both the bootstrap SE and permutation testing. The tests provide moderate evidence suggesting the sSC is higher among control subjects than the MDD in the frontal parietal left network. However, no significant between-group differences were revealed for the other extracted networks.
Results of Hypothesis Testing for Comparing sSC Between MDD and Controls in the PReDICT Study
MDD, major depressive disorder.
Finally, we investigate whether the sSC informs the reliability of the functional networks estimated by data-driven methods such as ICA. We plot the sSC measure versus the proposed reliability index for each of the nine ICA-derived functional networks in the PReDICT data, and find that these measures are positively associated (Fig. 5). That is, ICs with stronger underlying SC are more likely to be consistently estimated by the ICA algorithm. This suggests that we can leverage SC information from DTI data to inform the FC networks estimated from fMRI data.
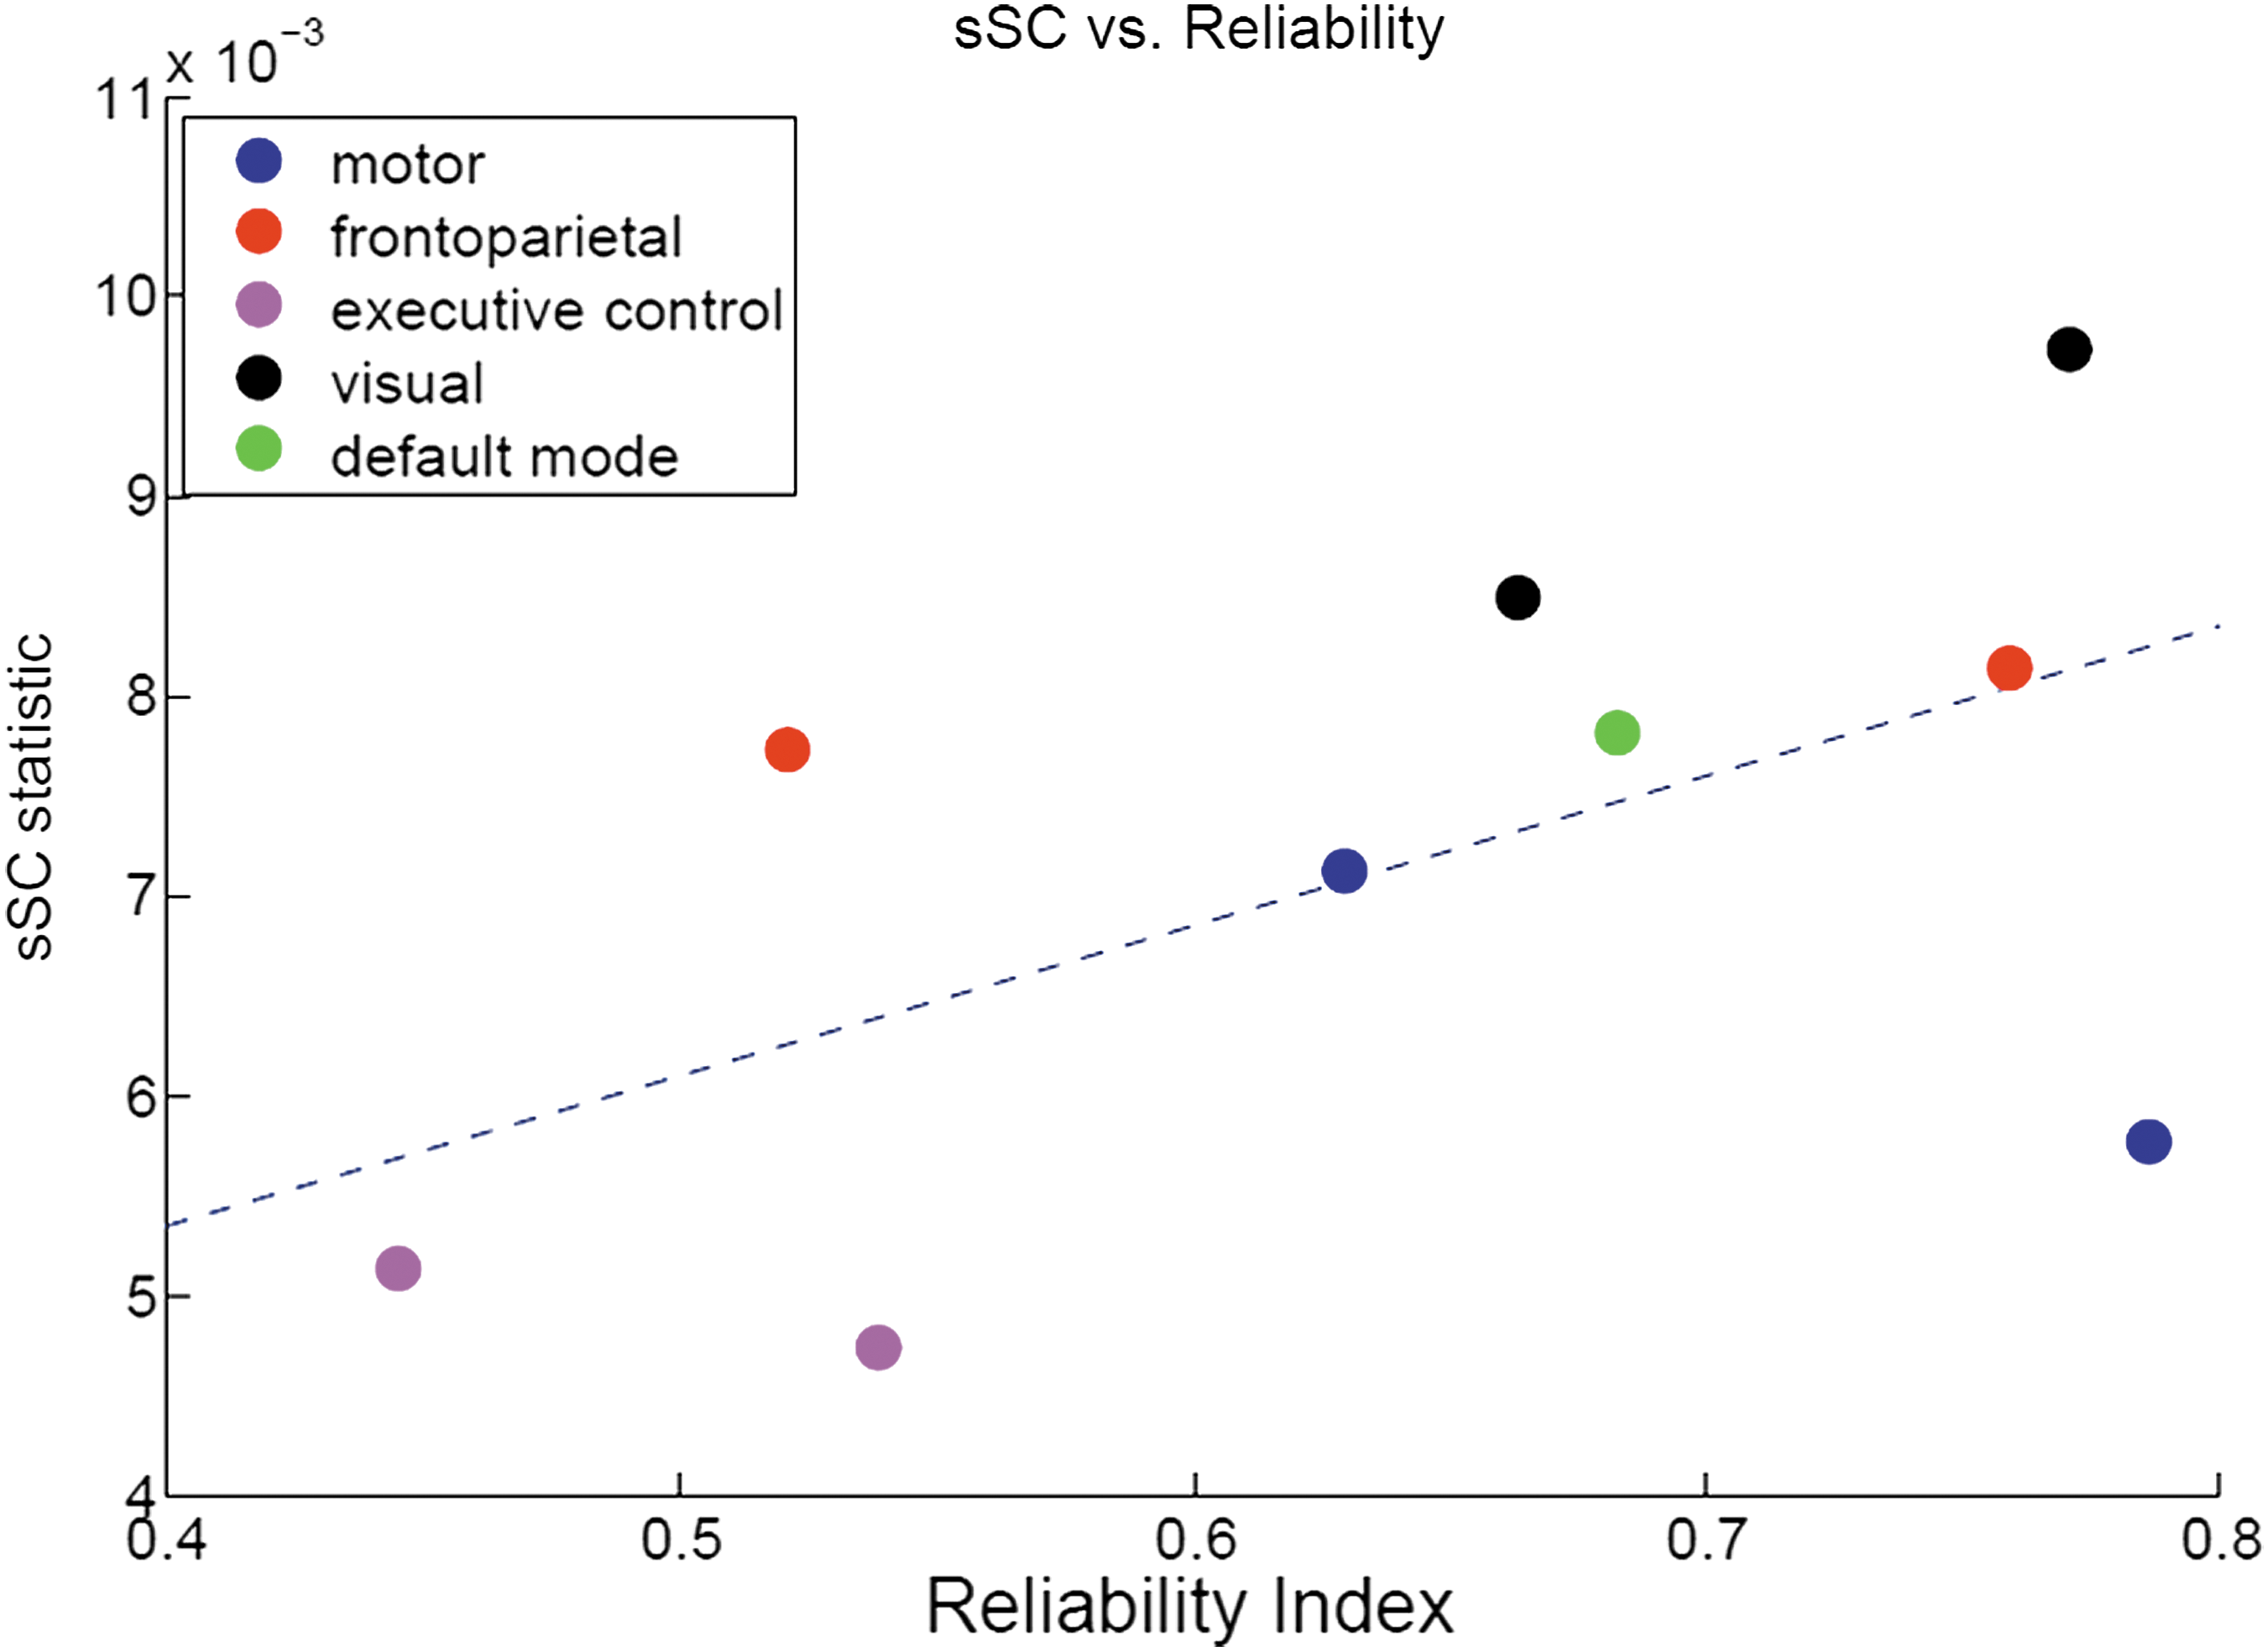
The association between sSC and network reliability. We plot the sSC measure versus the proposed reliability index for each of the nine ICA-derived functional networks in the PReDICT data, and find that the reliability of functional networks is positively associated with the underlying sSC.
Discussion
Our analysis framework integrates information from the fMRI and DTI data modalities to calculate a novel statistical measure of the sSC underlying a functional network. Our simulation studies and data application demonstrate the utility of the sSC measure, and reveal a positive association between sSC and the reliability of functional networks estimated by ICA in the PReDICT study.
The analysis of sSC in this article is conducted on the voxel level, while region-level analysis is feasible too. The proposed sSC measure could be defined on the region level, where j and k in the sSC definition (1) represent a pair of regions rather than voxels within an FC network. The estimation of the region-level sSC is similar to that of the voxel-level sSC. The main difference is that
In this article, we propose to model the covariance between two counts of streamlines connecting two sets of voxel pairs using a semivariogram model, where the covariance decays with the increase of distance between the two sets of voxel pairs. We propose a novel metric to quantify the distance between the end-points of the two streamlines. The metric is defined based on Euclidean distance because it is the most commonly used function in literature to approximate the anatomical distance between brain locations (Alexander-Bloch et al., 2012; Bellec et al., 2006; Dia et al., 2015; Salvador et al., 2005). As a reviewer rightly pointed out, the Euclidean distance has its limitations and does not always fully capture the anatomical distance between voxel pairs. For example, it does not taken into account the corpus callosum connection between right and left brain. The proposed distance metric for two sets of voxel pairs can be improved if a more appropriate distance function that truly reflects anatomical distance in the brain becomes available.
We propose a reliability index for data-driven FC networks to measure the reproducibility of networks through resampling the observed data. Our results show that the sSC is positively associated with the reliability of the FC network. As a reviewer pointed out, another way to assess the reliability of FC is to use test/retest data sets. It is noteworthy that there are some differences between the reliability assessed using the bootstrap approach and the reliability assessed using test/retest data sets. Specifically, the bootstrap-based reliability reflects reproducibility of FC networks across different subject data sets sampled from the population, that is, it reflects the across-sample reliability. In comparison, the test/retest reliability reflects reproducibility of FC networks within the same subjects across replicated fMRI scans, that is, it reflects within-subject reliability.
In this article, we are mainly interested in studying the across-sample FC reproducibility. Hence, the reliability accessed via the bootstrap approach in this article is more appropriate for our purpose. In future work, it will also be of interest to evaluate within-subject FC reproducibility using the test/retest data sets such as that in the HCP study and to investigate how it is associated with the sSC.
There has been extensive research devoted to FC over the past several years, with substantial interest focusing on resting-state FC. A set of RSNs have been consistently identified in these investigations (Smith et al., 2009; Damoiseaux et al., 2006; Laird et al., 2011), most prominently the default mode network (DMN; Buckner et al., 2008). While our work focused on resting-state connectivity, our proposed methods extend to other studies involving task-related fMRI.
Footnotes
Acknowledgments
Research reported in this publication was supported by the National Institute of Mental Health of the National Institutes of Health under award number R01MH105561 and R01MH079448 and by the National Center for Advancing Translational Sciences of the National Institutes of Health under award number UL1TR002378. The content is solely the responsibility of the authors and does not necessarily represent the official views of the National Institutes of Health.
Author Disclosure Statement
No competing financial interests exist.