
Abstract
Brain connectivity analysis has provided crucial insights to pinpoint the differences between autistic and typically developing (TD) children during development. The aim of this study is to investigate the functional connectomics of autism spectrum disorder (ASD) versus TD and underpin the effects of development, disease, and their interactions on the observed atypical brain connectivity patterns. Resting-state functional magnetic resonance imaging (rs-fMRI) from the Autism Brain Imaging Data Exchange (ABIDE) data set, which is stratified into two cohorts: children (9–12 years) and adolescents (13–16 years), is used for the analysis. Differences in various graph theoretical network measures are calculated between ASD and TD in each group. Furthermore, two-factor analysis of variance test is used to study the effect of age, disease, and their interaction on the network measures and the network edges. Furthermore, the differences in connection strength between TD and ASD subjects are assessed using network-based statistics. The results showed that ASD exhibits increased functional integration at the expense of decreased functional segregation. In ASD adolescents, there is a significant decrease in modularity suggesting a less robust modular organization, and an increase in participation coefficient suggesting more random integration and widely distributed connection edges. Furthermore, there is significant hypoconnectivity observed in the adolescent group especially in the default mode network, while the children group shows both hyper- and hypoconnectivity. This study lends support to a model of global atypical connections and further identifies functional networks and areas that are independently affected by age, disease, and their interaction.
Introduction
Autism spectrum disorder (ASD) is a clinical umbrella term for neurodevelopmental disorders that are characterized by atypical social behavior, including deficits in receptive and expressive language, theory of mind, and cognitive flexibility deficit (Kim et al., 2011; Zablotsky et al., 2015). It encompasses autism, Asperger syndrome, pervasive developmental disorder not otherwise specified, and childhood disintegrative disorder. Accumulating evidence indicates that ASD is associated with alterations of neural circuitry compared with typically developing (TD) individuals (Di Martino et al., 2009, 2014; Keown et al., 2013; McAlonan, 2004; Rudie et al., 2013; Schmitz et al., 2006; Stanfield et al., 2008; Supekar et al., 2013; Vissers et al., 2012). However, the recent literature is divided as to whether the autistic brain is dominated by under- or overconnectivity among the structural and functional connections between brain regions.
A method of choice to study the brain connectivity and its deviation in disease from the healthy controls has been the resting-state functional magnetic resonance imaging (rs-fMRI), which detects correlated and decorrelated fluctuations in the blood-level oxygen-dependent signals from the brain regions giving rise to resting-state functional connectivity (rs-FC). While the majority of the early findings in rs-FC suggested underconnectivity in midline core in the proximity of default mode network (DMN) brain regions in ASD compared with TD (Kennedy and Courchesne, 2008; Vissers et al., 2012; Yerys et al., 2015), a growing number of studies with advanced methodological details (Hahamy et al., 2015; Nair et al., 2013; Salmi et al., 2013) suggest a complex picture that also includes overconnectivity in children with autism (Keown et al., 2017; Rudie and Dapretto, 2013; Uddin, 2015), possibly related to impaired network differentiation (Fishman et al., 2014, 2015; Lee et al., 2016; Rudie et al., 2012).
Recently, the focus has shifted to looking at the hypothesis of topographic distribution of connectivity patterns (Hahamy et al., 2015; Uddin, 2015). Furthermore, studies also suggest a reduced connectivity pattern within major networks and increased connectivity between major networks in ASD (Hahamy et al., 2015; Rudie et al., 2012, 2013; Uddin, 2015).
Functional segregation refers to the ability for specialized processing within strongly interconnected modules of brain regions. Meanwhile, functional integration refers to the ability to rapidly combine specialized information from distributed brain regions (Rubinov and Sporns, 2010). Functional brain networks become simultaneously more integrated and segregated during typical development (Fair et al., 2009) and white matter integrity increases during development (Lebel et al., 2012; Weng et al., 2010), suggesting that brain networks in ASD may reflect “immature” or aberrant developmental processes. Despite this array of regional and systems-level findings in ASD, it is still unclear how these alterations might be reflected at a network level.
Graph theory, which describes complex systems as a set of “nodes” (i.e., brain regions) and “edges” (i.e., connections between nodes), has characterized the brain as a complex network with a hierarchical modular organization consisting of several major functional communities [i.e., visual, sensorimotor, DMN, and attentional systems; see Wang et al. (2010)]. Functional brain networks exhibit robust levels of local and global efficiency (i.e., small-world properties) (Watts and Strogatz, 1998) that can be quantitatively characterized using graph theoretic methods (Bullmore and Sporns, 2009; Rubinov and Sporns, 2010). Given the complexities and inconsistencies of the ASD literature, graph theoretic data-driven techniques provide exploratory approaches that are suitable for uncovering connectivity patterns even in the absence of strong directional hypotheses. Using graph theoretical analysis on rs-FC, studies have reported a decrease in local efficiency, clustering coefficient (CC), and characteristic path length (CPL), and an increase in global efficiency, in the ASD subjects, which is interpreted as increased randomness of functional network organization (Itahashi et al., 2014; Rudie et al., 2013). Interestingly, recent studies observed atypically increased intrinsic FC inside the “rich club” (i.e., densely interconnected hubs) in ASD (Watanabe and Rees, 2015).
In this study, we analyzed the rs-fMRI from the Autism Brain Imaging Data Exchange (ABIDE) data set to confirm some of the earlier and recent findings related to the functional connectomics of ASD versus TD and to test the altered functional integration and segregation hypothesis in ASD. We further extended the extant literature by underpinning independent effect of age, disease, and their interactions on network-level segregation and integration between large-scale brain networks in ASD children and adolescents. We show that multiple network measures quantifying the functional integration and segregation among the whole-brain neurocognitive networks can be used to characterize TD and ASD. The network-level analysis revealed how the topological distribution of nodes, edges, and communities is affected by age, disease, and their interaction.
Materials and Methods
Data
The data included in the present study were selected from ABIDE preprocessed initiative (Craddock et al., 2013b). A subsample from the ABIDE fMRI data set was considered, which comprised two cohorts: children (9–12 years, 52 TD and 37 ASD) and adolescents (13–16 years, 49 TD and 38 ASD). The data set used for this study was collected from multiple sites. Institutional review board approval was provided by each data contributor in the ABIDE database. Detailed recruitment and assessment protocols and inclusion criteria are available on the ABIDE website. The preprocessed data are available at:
Participant Information of a Subset of Autism Brain Imaging Data Exchange Data Set Used for the Analysis in the Age Group 9–12 Years
ASD, autism spectrum disorder; FD, framewise displacement; IQ, intelligence quotient; SD, standard deviation; TD, typically developing.
Participant Information of a Subset of Autism Brain Imaging Data Exchange Data Set Used for the Analysis in the Age Group 13–16 Years
Data acquisition and preprocessing
ABIDE data set
Resting-state fMRI (rs-fMRI) data from 75 ASD subjects and 101 TD subjects were acquired from the Preprocessed Connectomes Project (PCP; Craddock et al., 2013;
As movement artifacts are an important issue in ensuring validity of the results, we used samples that were minimally affected by motion. Framewise displacement (FD) is used as a quality control measure for movement artifact detection in fMRI time series signals and is estimated as the sum of the absolute values of the derivatives of the six realignment parameters (translational displacements along X, Y, and Z axes and rotational displacements of pitch, yaw, and roll) (Power et al., 2014). For the present study, we chose samples from the larger ABIDE pool such that the mean FD was not statistically significant between ASD and TD groups (Tables 1 and 2).
Furthermore, participants were excluded from our study if their mean FD during the rs-fMRI scan was greater than 0.10 mm or their full-scale intelligence quotient (IQ) was lower than 70. The ABIDE preprocessed initiative also provides manual quality assessment (QA) ratings from three human raters for functional data from each subject that inspected for incomplete brain coverage, high movement peaks, ghosting, and other scanner artifacts. For our study, we only selected samples that were given positive rating (OK) from all the functional raters. For the graph theoretical calculations, negative correlations were excluded, given their ambiguous interpretation and detrimental effects on test–retest reliability (Wang et al., 2011) and because most well-established graph topological measures use only positive connections. For all further analysis, we used gender, site (using a dummy coding scheme), and head motion effects measured as the mean FD (Power et al., 2012) as covariates to regress out any potential covariate-related effects.
Network measures
To evaluate the functional networks by means of graph theory, the FC matrices were binarized to generate undirected binary adjacency matrices where correlations above a certain proportional threshold were set to 1 and 0 otherwise. Binarization is a common step in functional graphs so as to include only the strongest functional connections. To avoid influence of false positives on group comparisons, here we applied proportional thresholding under the assumption that weaker edge weights in FC networks arise due to high false-positive rates. For each subject, the FC network was sparsified over range of thresholds between 1% and 50%. We reported the average measures across these thresholds. Multiple threshold values were used due to lack of consensus on the appropriate thresholding value. Group differences were calculated using a nonparametric permutation t-test (Nichols and Holmes, 2002). Binarized FC matrices from each of these groups were then evaluated for network measures of segregation (CC, local efficiency, small world index, and modularity), measures of integration between and within modules (global efficiency, assortativity, participation coefficient, and CPL), and a node centrality measure (betweenness centrality) (Rubinov and Sporns, 2010; Shine et al., 2018). These metrics were calculated using Graph-Theoretical Network Analysis (GRETNA) Toolbox (Wang et al., 2015).
The CC indicates the probability of two regions that are connected to a third one, also being connected to each other (forming triangles). Decreased CC implies reduced efficiency in local information transmission and processes (Wang et al., 2017). Local and global efficiency (Eloc and Eglob) (Latora and Marchiori, 2001) represents network efficiency of transmitting information at the local and global level, respectively. Decrease in Eloc of a node may damage connections between its neighbors, while decrease in global efficiency may lead to a decline in the ability to consolidate information from distributed brain areas. Small-world index (
Network modularity (Q) estimates were computed using the community detection algorithm by Newman (2006). Participation coefficient is a measure of the difference between the number of links (degree) of node i to nodes in all clusters with its number of links within its own cluster. Thus, if a node only directly connects with nodes within the same module, its participation coefficient is 0. Assortativity (r) is a correlation coefficient between the degrees of all nodes on two opposite ends of a link. A positive assortativity coefficient indicates that nodes tend to link to other nodes with the same or similar degree. CPL is calculated as the “harmonic mean” distance between all possible node pairs (Newman, 2003) to address the disconnected nodes. Betweenness centrality is a measure of centrality in a graph based on shortest paths, which is the number of these shortest paths that pass through the node i.
See Supplementary Data for more details with regard to all the network measures used in this article.
Disease and age effect on the network measures
We used 2 × 2 independent analysis of variance (ANOVA) with gender, site, and head motion as covariates to test the effect of disease, age, and their interaction on the network measures over the whole brain that are described above. To study the effect of thresholding, the network measures were calculated at each sparsity threshold between 1% and 50% and ANOVA was independently performed at each threshold to study the effect of threshold on the results. Subsequently, false discovery rate (FDR) correction was used to correct for multiple comparisons. Furthermore, to characterize the effect of disease, age, and their interaction on each ROI, we performed a 2 × 2 ANOVA on the nodal network measures: Eloc, participation coefficient and betweenness centrality of each node. Finally, we applied partial correlation to disentangle the relationships between the network metrics, for example, Eloc, participation coefficients, betweenness centrality, and IQ scores (full scale, performance, and verbal).
Edgewise analysis
We performed two-way ANOVA on each edge of the unthresholded FC matrix to analyze the effect of age, disease, and their interaction. FDR correction was used to correct for multiple comparisons. To further analyze the edgewise differences in connection strengths and isolate components of the connectivity matrix that differ significantly between ASD and TD, we used nonparametric permutation testing available in the Network Based Statistic (NBS) Toolbox (Zalesky et al., 2010). First, NBS performs mass univariate t-testing at each possible connection in the matrix of seed-to-seed connections (between ASD and TD), resulting in a t-statistic for each connection. All those connections for which between-group t-statistic exceeds a threshold are admitted to a set of suprathreshold connections. Among those connections, clusters are identified in topological space, resulting in a connected graph component for which a path can be found between any two nodes. Finally, a family-wise error rate (FWER)-corrected p-value is computed for each connected graph component using permutation testing (10,000 permutations). A component was declared significant if its corrected p-value was lower than 0.025. Differences in FC components (i.e., TD > ASD and ASD > TD) were tested for each age group (9–12 and 13–16 years).
Results
Network measures analysis
We characterized the differences in the whole-brain network between ASD and TD using graph theoretic analysis. We reported the average network measure across thresholds between 1% and 50% (proportional) (Figs. 1 and 2). For each network measure reported, significance is calculated using the nonparametric permutation test (10,000 permutations), which inherently accounts for multiple comparisons (Nichols and Holmes, 2002). We observed significant differences in CPL (p = 0.0068), Eloc (p = 0.0002), Q (p = 0.0433), CC (p = 0.022), and participation coefficient (p = 0.04) between TD and ASD in the adolescent age group (13–16 years) (Tables 3 and 4 and Figs. 1 and 2). In ASD, participation coefficient increased, while modularity (Q values), Eloc, and CC decreased. Furthermore, we observed a significant difference in mean participation coefficient in both the children (p = 0.004) and adolescent groups (p = 0.045), which could be largely indicating an increased integration within functional networks in ASD compared with TD in both groups. There were no differences (surviving permutation testing) in small worldness, Eglob, betweenness centrality, and assortativity between TD and ASD (Tables 3 and 4).

Differences in the network measures of functional integration and segregation between TD and ASD for the children (9–12 years) group.

Differences in the network measures of functional integration and segregation between TD and ASD for the adolescent (13–16 years) group.
Network Measures for the Subjects in the Age Group of 9–12 Years
Indicates statistical significance.
CC, clustering coefficient; CPL, characteristic path length.
Network Measures for the Subjects in the Age Group of 13–16 Years
Indicates statistical significance.
Supplementary Figures S1 and S2 show the sensitivity of these network measures to the range of thresholds. Eloc increases as a function of threshold, with the 13–16-year ASD group exhibiting difference with TD group at higher thresholds (Supplementary Fig. S2B). On the contrary, Q decreases as a function of threshold, with the 13–16-year ASD group exhibiting higher Q and less steep asymptote compared with TD (Supplementary Fig. S2A).
Disease, age, and interaction effects on the network measures
On performing 2 × 2 ANOVA over multiple proportional thresholding values, it can be found that there is significant independent effect (p < 0.05) of disease and age on CC and node-level Eloc, but no significant interaction effect on these measures. CPL showed significant age and interaction effect. Surprisingly, modularity showed only age effect. Furthermore, we observed that these effects on network measures were dependent particularly on the choice of the threshold at which they are being tested (Fig. 3). The effect of age (threshold = 30, F = 6.86, p < 0.05, FDR corrected) on Q was observed across thresholds (Fig. 3A). Furthermore, the effect of age (threshold = 10, F = 12.3, p < 0.05, FDR corrected) or disease (threshold = 10, F = 6.5, p < 0.05, FDR corrected) on the Eloc was observed across lower thresholds (Fig. 3B). On the contrary, small-world index only showed the effect of age (threshold = 10, F = 7.5, p < 0.05, FDR corrected) but not disease across all thresholds above 15% (Fig. 3H). The effect of disease and age on participation coefficient was observed at all proportional thresholds (Fig. 3F).
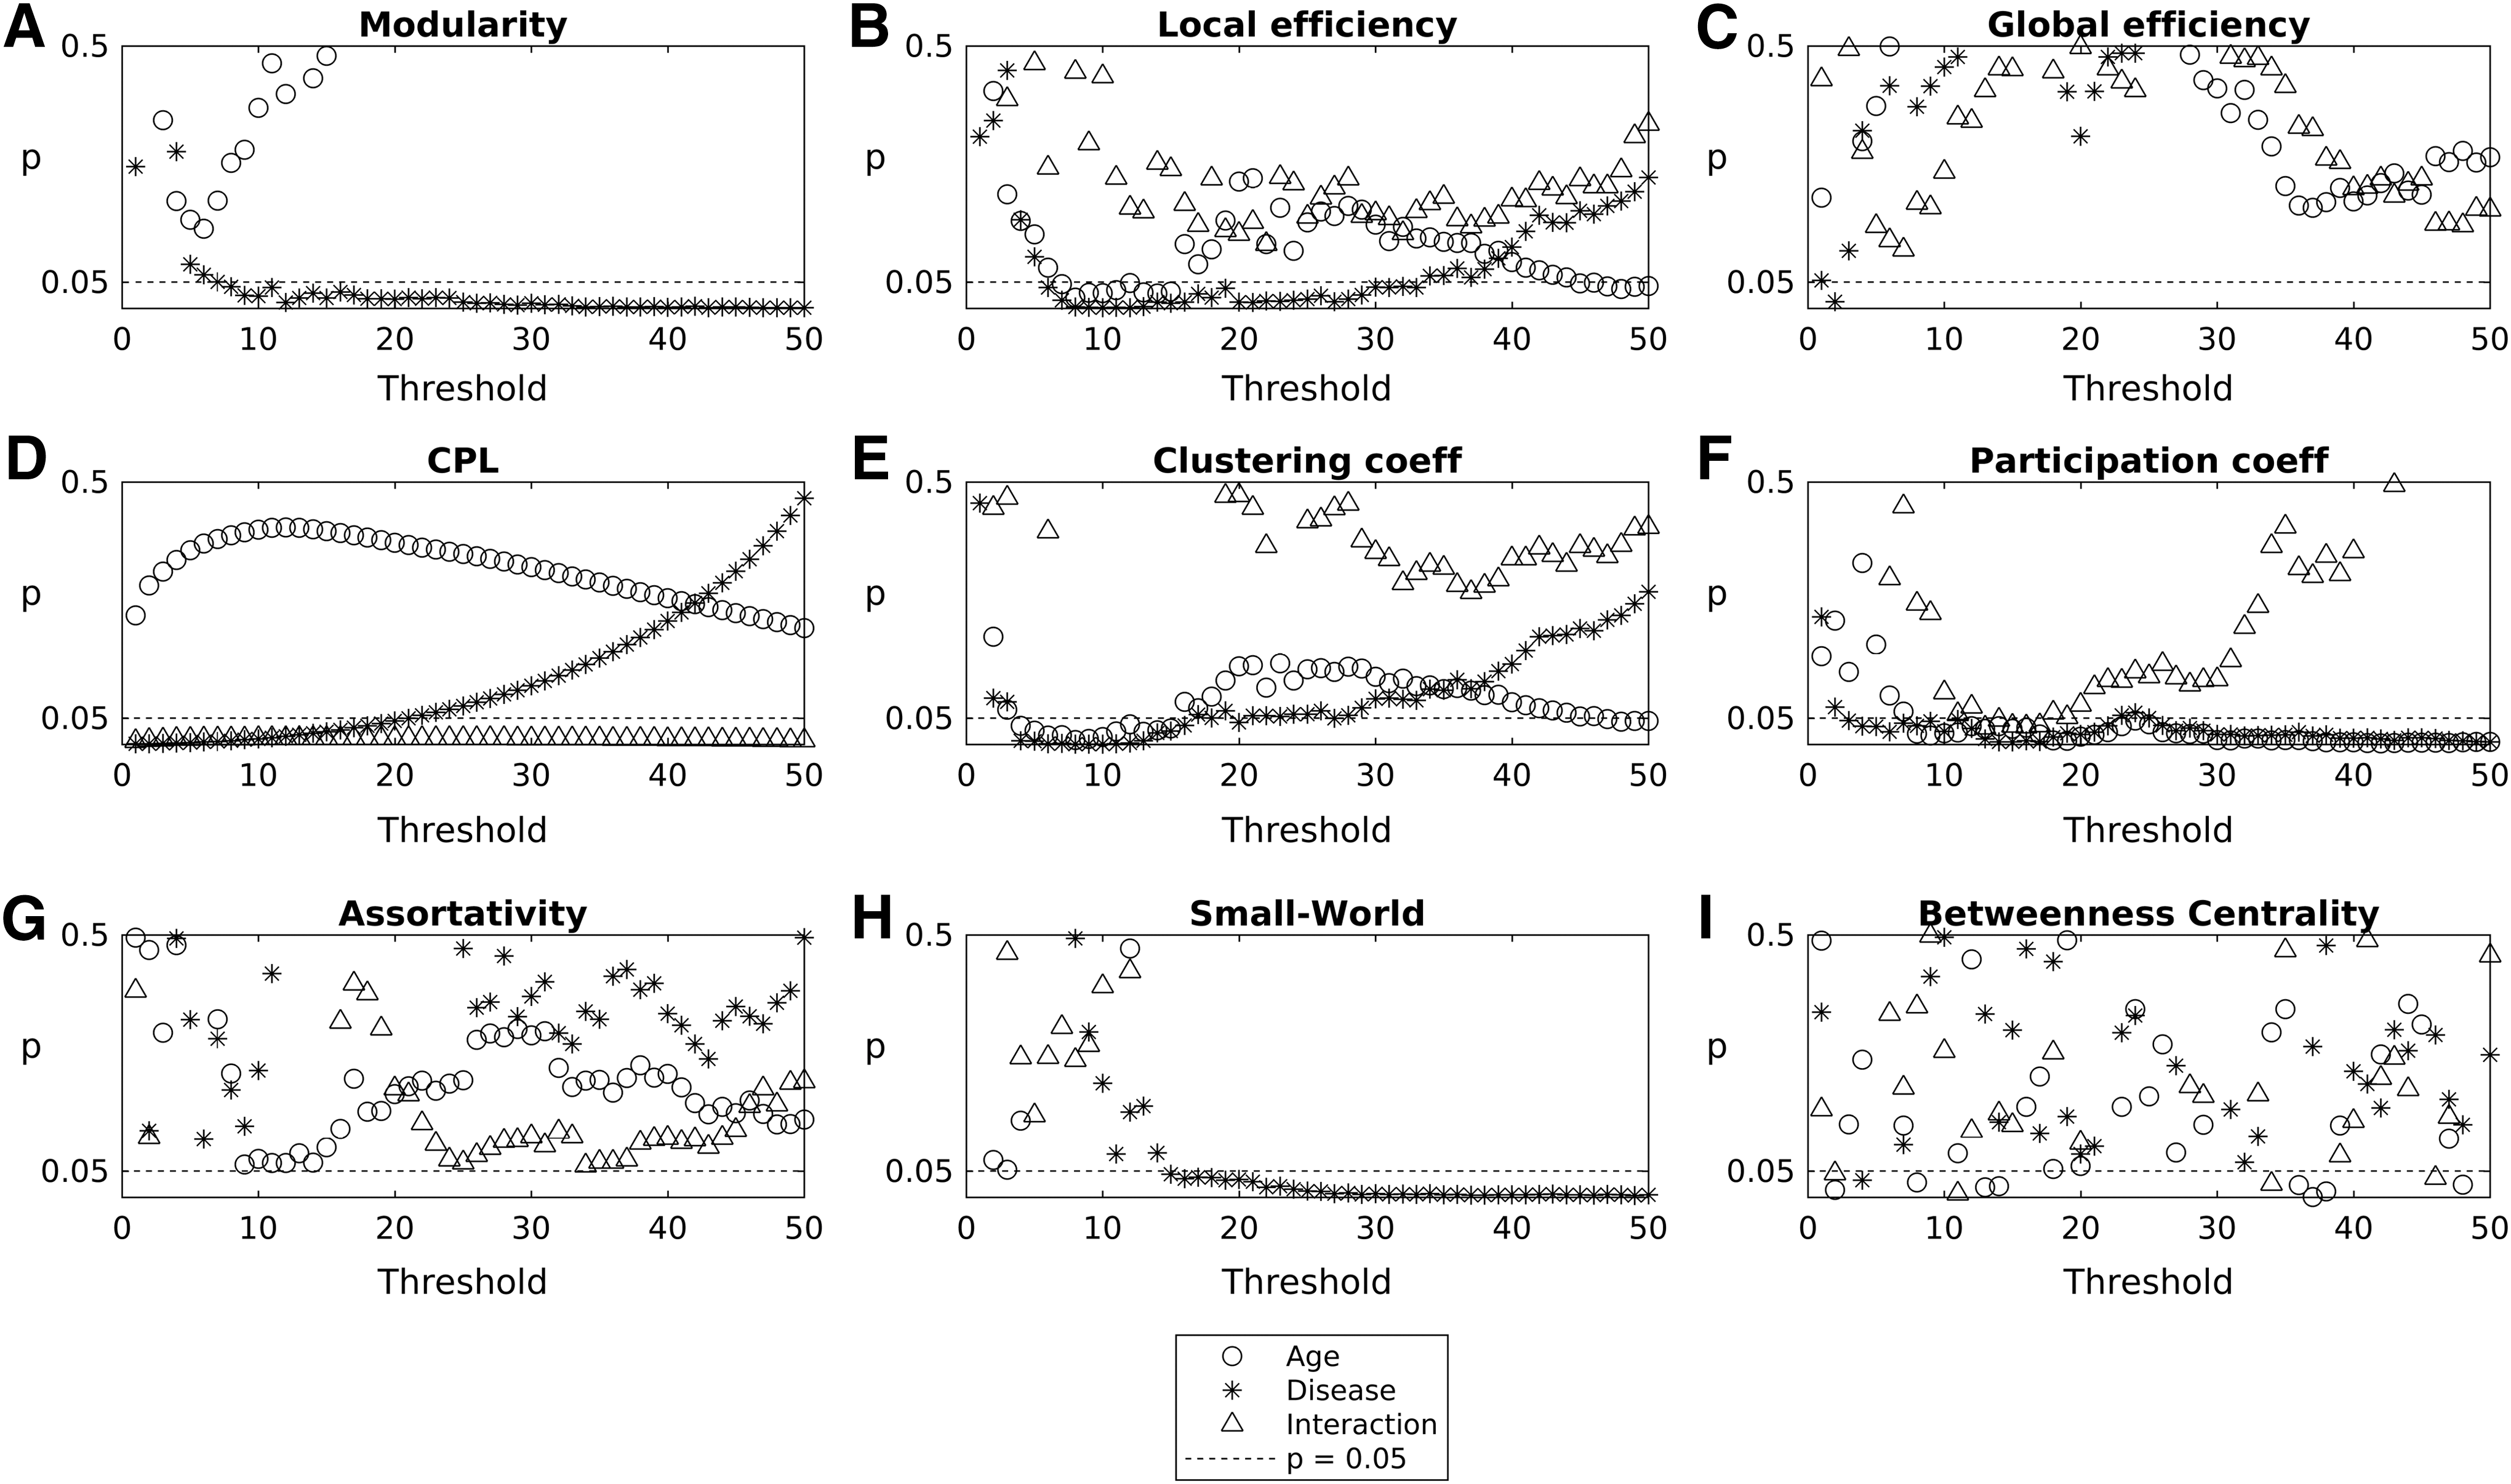
Results of 2 × 2 ANOVA depicting the effect of age, disease, and their interaction on network measures of integration and segregation. p Values from ANOVA are plotted for independent life span factors such as disease, age, and their interaction as a function of different thresholds for the network measure.
Disease, age, and interaction effects on the nodal measures
Using two-way ANOVA, we further characterized the effect of age, disease, and their interaction on nodal network measures: participation coefficient, Eloc, and betweenness centrality to identify specific ROIs that are affected by these factors. These results are presented in Figure 4 and tabulated in Tables 5–7. For participation coefficient, we found nodes that show significant age effect are right Heschl's gyrus and the left Rolandic operculum in the sensorimotor network (Table 5 and Fig. 4). However, these ROIs did not show any significant difference between ASD and TD groups. On the contrary, right posterior cingulate (DMN) and left thalamus (subcortical) showed significant effect of disease with an increase in participation coefficient in the ASD adolescent group.

Areas showing significant effect of age, disease, and their interaction for
Regions of Interest Showing Significant (p < 0.01, Uncorrected) Effect of Age, Disease, and Their Interaction on Nodal Network Measure, Participation Coefficient
Indicates that the effect survived FDR correction.
DMN, default mode network; FDR, false discovery rate; ROI, region of interest.
In the ASD adolescent group, we found that the right angular gyrus (attention network) and left orbital medial frontal gyrus (DMN) showed significant effect of age on Eloc. There is an increase in Eloc with maturation (Table 6 and Fig. 4). Interestingly, DMN nodes comprising left orbital superior frontal gyrus, left medial superior frontal gyrus, and right posterior cingulum showed the effect of disease on Eloc. In ASD, Eloc decreased in both children and adolescents (Table 6). For betweenness centrality (Table 7 and Fig. 4), right thalamus (subcortical) showed significant interaction effect, and an increase in adolescents compared with children is observed. On the contrary, left thalamus (subcortical) and right inferior occipital (visual) manifested disease effect, and right fusiform gyrus (visual) and right middle temporal gyrus (DMN) displayed an age effect. Interestingly, while the TD group shows a decrease in mean betweenness centrality of right thalamus with age, the ASD group shows an increase.
Regions of Interest Showing Significant (p < 0.01, Uncorrected) Effect of Age, Disease, and Their Interaction on Nodal Network Measure, Local Efficiency
Indicates that the effect survived FDR correction.
MNI, Montreal Neurological Institute.
Regions of Interest Showing Significant (p < 0.01, Uncorrected) Effect of Age, Disease, and Their Interaction on Nodal Network Measure, Betweenness Centrality
Indicates that the effect survived FDR correction.
Furthermore, using voxel-based methods, several studies have revealed correlations between IQ and certain brain regions involving the frontal, parietal, temporal, and occipital lobes (Haier et al., 2004; Li et al., 2009). In our study, partial correlation analyses performed across all subjects (TD and ASD) revealed significant correlations between intelligence test scores and the nodal metrics of multiple brain regions, including cortical areas located in the parietal, temporal, occipital, and frontal lobes, as well as subcortical structures such as the thalamus, amygdala, and hippocampus (Supplementary Tables S4–S14, Supplementary Figs. S3–S8). We found significant correlations between participation coefficient for several regions and performance IQ score for the TD group, while no such significant correlations for ASD group were observed. We also observed similar trends of positive correlation of IQ scores in ASD and TD children for betweenness centrality and local efficiency, while finding a change in directionality of correlation in the ASD adolescent group. However, these results are based on p-value less than 0.05 uncorrected for multiple comparison, and further studies with more subjects are required to establish the significance.
Intermodular and within-module edge analysis
We used 2 × 2 ANOVA to find the effect of age, disease, and their interaction on each edge weight of the FC matrices. We found that after FDR correction, there were only eight edges (1 DMN, 4 subcortical, and 3 intermodular) that showed an effect of interaction, 241 (20 DMN, 11 attention, 42 sensorimotor, 44 subcortical, 34 visual/auditory, and 90 intermodular) edges that showed effect of disease, and 35 (9 DMN, 2 subcortical, and 24 intermodular) edges that showed significant effect of age (Fig. 5A–C). Post hoc analysis revealed that the edges that showed disease effect were majorly underconnected in the ASD adolescent group (52 ASD < TD, 6 ASD > TD; p < 0.05), while they were majorly overconnected in the children group (7 ASD < TD, 31 ASD > TD; p < 0.05) (Fig. 5D). On the contrary, we found the edges that showed effect of age were majorly underconnected in ASD in both children (17 ASD < TD, 2 ASD > TD; p < 0.05) and adolescent groups (32 ASD < TD, 2 ASD > TD; p < 0.05) (Fig. 5D). The edges that showed interaction effect also showed a similar trend of ASD overconnectivity in the children group (7 ASD > TD) and underconnectivity in adolescent group (6 ASD < TD) (Fig. 5D).

Resting-state FC edges showing significant effect of
Network-based statistics
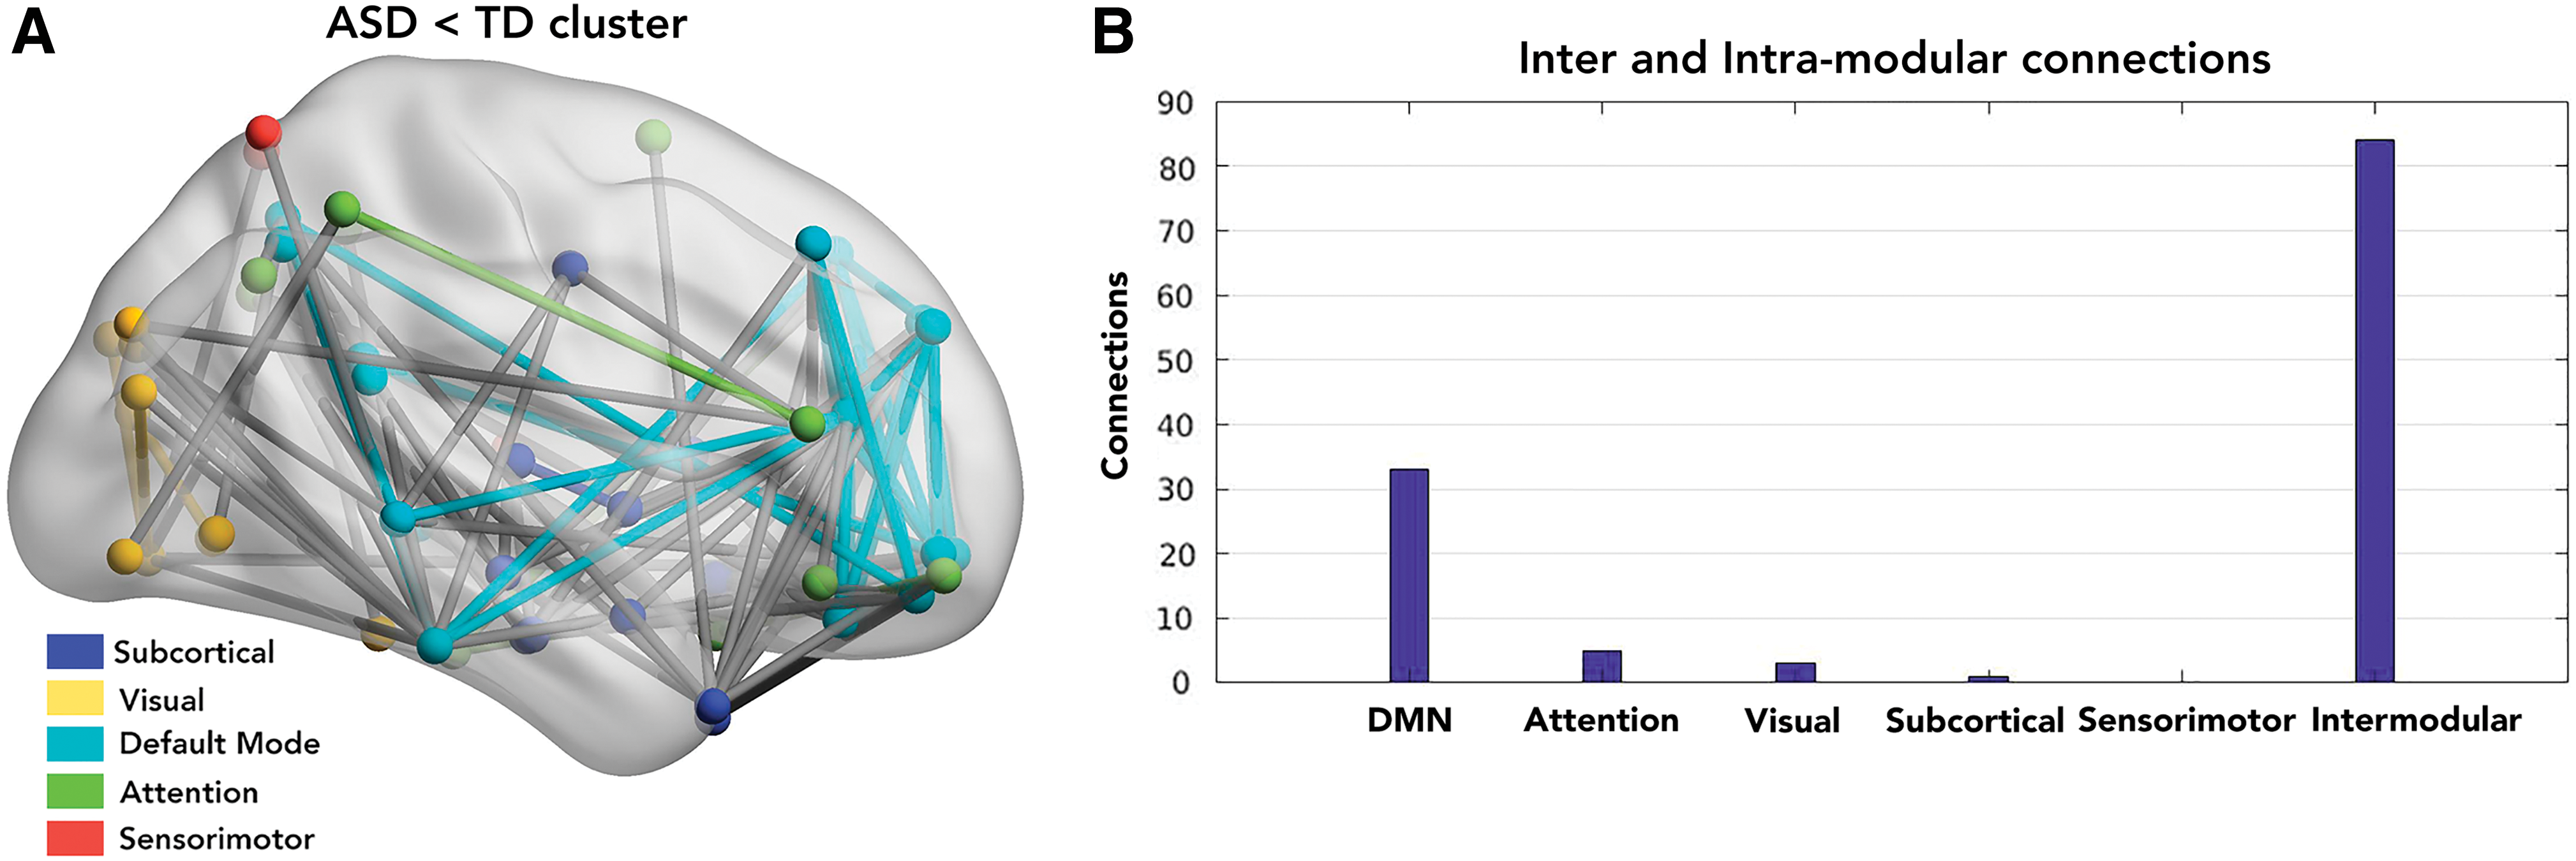
To further study how disease affects the FC in individuals, we used group-based network statistics to find significant clusters that survived multiple iterations (connection p < 0.001, cluster p < 0.05, FWER corrected, 10,000 loops). We found that for age group 9–12 years, there were no clusters with ASD > TD or TD > ASD. However, for the adolescent group (13–16 years), there was a significant component (p < 0.0005) that survived 10,000 iterations having 125 TD > ASD connections. These connections were mapped to five functional networks (DMN, sensorimotor, visual, attention, and subcortical areas) (Fig. 6A). Of these, 84 connections were intermodular, while 41 connections were intramodular. We further characterized the intramodular connections within the five identified functional networks. Of the 41 connections, 3 belonged to visual network, 5 to attention, 33 belonged to DMN, and 1 belonged to subcortical network (Fig. 6B). Furthermore, there were no significant networks identified with ASD > TD in the adolescent group. These whole-brain analyses indicated the existence of underconnectivity in ASD in each of the networks, especially DMN.
Reproducibility with single-site data
To establish the robustness of our results, we repeated our analysis on single-site data—NYU. We chose this site as it had maximum ASD subjects in both children and adolescent groups, who met our selection criteria (see the Materials and Methods section). Briefly, the trend observed in network measures for single-site data is consistent with the multisite network analysis. For the children and adolescent groups, the mean participation coefficient is significantly different between ASD and TD. For the adolescent group, the modularity is also significantly lower in ASD compared with TD. Overall, each network measure shows the same trend, increase or decrease with age and disease, as observed in the multisite analysis.
We also performed NBS analysis on single-site data. There is a cluster of connections that shows differences between ASD and TD for the adolescent group. This cluster comprises a majority of DMN—DMN intramodular and DMN intermodular connections. Detailed results are presented in Supplementary Data.
Discussion
Several studies have used whole-brain analysis of cognitive task based (Just et al., 2004, 2012) as well as rs-fMRI to underpin the effect of autism in neurocognitive networks (Abbott et al., 2016; Keown et al., 2013; Rudie et al., 2013; Supekar et al., 2013). However, there is a significant obstacle till date in understanding the brain FC phenotypes as it encompasses a wide range of abilities and levels of functioning depending on factors such as age, gender, and genotype. To overcome this complexity, the effect due to the multiple factors certainly needs to be characterized systematically. A recent study attempts to understand the age and gender effects on whole-brain FC and network properties (Henry et al., 2017). In this study, we have further explored systematically the disease, developmental trajectory (age), and their interaction effects in ASD by grouping subjects into children and adolescent groups. For this purpose, we have performed FC analysis using the ABIDE data set. We studied the differences in network-level properties and connection strength between TD and ASD. We found significant effect of age and disease on multiple network measures that characterize the functional integration and segregation. We used nodal network metrics to characterize nodes and functional networks that show significant differences in ASD. Furthermore, we found atypical connectivity, both under- and overconnectivity in ASD whole-brain functional networks.
In examining the differences in multiple nodal and global network measures of functional segregation and integration between TD and ASD, we observed that adolescents (13–16 years) show remarkable differences in many network measures compared with children (9–12 years) (Tables 3 and 4). We found a significant decrease in Eloc, Q, and CC in ASD adolescents, which indicates disrupted local network segregation (Rubinov and Sporns, 2010; Shine et al., 2018). Our results are consistent with the finding that local efficiency (i.e., Eloc) and modularity decrease in ASD (Rudie et al., 2012, 2013; Weng et al., 2010; Yerys et al., 2015). Interestingly, we found a significant increase in participation coefficient in ASD across both children and adolescent groups. Recent work showed that participation coefficient can be used as a network integration measure (Shine et al., 2018). An increase in participation coefficient observed in our study indicates an increase in the ability to rapidly combine specialized information from distributed brain areas. However, simultaneous decrease in modularity along with increase in participation coefficient in ASD suggests a less robust modular organization (i.e., communities were less distinct) and that there is a tendency for nodes to interact more with other communities as measured by higher nodal participation coefficients (Rudie et al., 2013). The observations that interacting nodes belong to diverse hub networks also account for the earlier observation of atypical increase in connectivity between the rich club modules during maturation (Keown et al., 2017).
One intriguing finding from Figures 1 and 2 is that the Eloc and CC show an increasing trend in the adolescent group compared with the children group. Similarly, participation coefficient and CPL show a decreasing trend in the adolescent group compared with the children group. However, the extent of increase or decrease of these network measures is affected by disease, which brings about significant group difference between TD and ASD in the adolescent group (Tables 3 and 4). This suggests a possible delayed maturation of the brain networks in ASD. Furthermore, a decrease in both participation coefficient and CPL in TD also suggests a complex global connectivity pattern between the functional networks with maturation. Previous studies have shown that the most prominent changes in topological properties of a developing brain network occur at late childhood and adolescence (Chen et al., 2013). A topological organization toward random configuration in late childhood has been observed by analyzing structural brain networks (Chen et al., 2013; Khundrakpam et al., 2013). They also found a significant increase in the local efficiency at adolescence suggesting that the dynamic process of rewiring brain connections occurs at different growth stages. Furthermore, it is also shown that functional brain network develops from local to distributed organization with development (Fair et al., 2009).
Since the network measures showed increasing or decreasing trend with respect to age, we studied the effect of age, disease, and their interaction on different network measures. Furthermore, we also identified the spatial location and distribution of ROIs or nodes in the whole-brain network affected by age, pathology, and their interaction. We found that measures of segregation (Q, small-world index, CC, and Eloc) and a measure of integration between and within modules (CPL, Eglob, r, participation coefficient) are significantly affected by age and disease (Figs. 4 and 5). We found that Eloc, CC, and participation coefficient consistently showed the effect of age and disease in a range of thresholds. Small-world index only showed the significant effect of age, while CPL and participation coefficient showed the effect of age/disease interaction.
We characterized the independent effect of age and disease on nodal measures (Eloc, participation coefficient, and betweenness centrality) for each node. Furthermore, we also mapped the spatial location and distribution of ROIs or nodes in the whole-brain network affected by age, pathology, and their interaction. We primarily found DMN nodes showing significant (p < 0.01, uncorrected) effect of disease on nodal Eloc (decreases in ASD) and nodal participation coefficient (increases in ASD). Subcortical areas showed the effect of disease on participation coefficient (increases in ASD) and betweenness centrality (increases in ASD). Sensorimotor areas show significant effect of age on participation coefficient. Furthermore, we also analyzed the association between nodal network measures (Eloc, participation coefficient and betweenness centrality) and IQ (verbal, performance, and full scale) scores. For the TD adolescent group, we found DMN, subcortical, and attention nodes were predominantly showing positive correlations (negative in ASD adolescent) of IQ scores with Eloc, betweenness centrality while showing positive correlation (no correlation in ASD adolescent) with participation coefficient. Furthermore, for the TD children group, we found sensorimotor nodes showing predominantly positive correlations of IQ scores with Eloc (positive in ASD children) and participation coefficient (no correlation in ASD children). Both TD and ASD groups also showed subcortical nodes having positive correlation between IQ scores and betweenness centrality.
We identified edges that showed significant effect of age, disease, and their interaction. We found that the edges affected by disease were largely overconnected edges in the ASD children group, while they were underconnected in the ASD adolescent group (Fig. 5). Similar results showing hyperconnectivity in children and hypoconnectivity in ASD adolescents have been reported in other studies (Nomi and Uddin, 2015; Uddin et al., 2013).
Furthermore, using NBS analysis, we confirmed that the adolescent group (13–16 years) has a significant underconnectivity TD > ASD network. We found significant overlap with the above ANOVA results in the edges showing effect of disease. Of 125 significant connections that survived FDR corrections, 33 edges were located primarily within the DMN (Fig. 6A, B). This is largely consistent with previous findings of DMN underconnectivity in ASD (Assaf et al., 2010; Rudie et al., 2012; Yerys et al., 2015).
Conclusions
In summary, this study demonstrates the independent effects of disease, development, and their interaction in ASD. Our study differed in several aspects from previously reported whole-brain network-level graph theory investigations in ASD. We have examined: (1) what the network properties are that best describe atypical connectivity in autistic subjects and (2) how development or maturation is affected in ASD. An interesting observation arising from the analysis of rs-fMRI of ASD is that the results point to the existence of both under- and overconnectivity in ASD. This might be due to variations in the functioning level of the ASD participants, that is, a group of low functioning individuals could show hypo-FC as against hyper-FC in the case of high functioning ASD subjects.
Complex network analysis, being a recent approach, lacks standardization of methods across clinical studies. Whole-brain connectivity anomaly and differences are highly sensitive to algorithms used for thresholding, clustering, and partitioning adjacency matrices into community structures. Importantly, closer methodological scrutiny is obviously required, given the recent controversy regarding the effects of motion confounds, through which not appropriately correcting for head motion can lead to both spurious increases in local connectivity and reductions in long-range connectivity. In our study, we have exercised caution by using samples corrected for motion artifacts and considered samples with low FD that were approved by manual functional QA raters.
In our study, we did not analyze the correlation and significance of the graph measures with the symptom severity (ADOS scores) because of nonavailability of ADOS scores for majority of samples included in this study. Our study provides insights into the patterns observed in the functional brain systems of TD and ASD from a network perspective, which can be further extended including a larger number of subjects, using a longitudinal design, and combining structural data.
Footnotes
Acknowledgments
D.R. is supported by the Ramalingaswami fellowship (BT/RLF/Re-entry/07/2014) and DST extramural grant (SR/CSRI/21/2016). P.K.V. acknowledges financial support from the Early Career Research Award Scheme (ECR/2016/000488), Science and Engineering Research Board, DST, India.
Author Disclosure Statement
No competing financial interests exist.
References
Supplementary Material
Please find the following supplemental material available below.
For Open Access articles published under a Creative Commons License, all supplemental material carries the same license as the article it is associated with.
For non-Open Access articles published, all supplemental material carries a non-exclusive license, and permission requests for re-use of supplemental material or any part of supplemental material shall be sent directly to the copyright owner as specified in the copyright notice associated with the article.