
Abstract
Neuroimaging studies have shown that discrete regions in ventral visual pathway respond selectively to specific object categories. For example, the fusiform face area (FFA) in humans is consistently more responsive to face than nonface images. However, it is not clear how other cortical regions contribute to this preferential response in FFA. To address this question, we performed a functional magnetic resonance imaging study on human subjects watching naturalistic movie clips from human actions. We then used correlation and multivariate regression (partial least-squares regression) analyses to estimate/predict the mean BOLD (blood oxygenation level-dependent) activity in FFA, from the mean and pattern of responses in 24 visual cortical areas. Higher tier retinotopic areas V3, hV4, and LO2, motion-selective area middle temporal, body-selective areas, and non-FFA face-selective areas had the best prediction accuracy particularly when they were located ipsilateral to FFA. All non-FFA collectively could explain up to 75% of variance in the FFA response. The regression models were also designed to predict the mean activity in one face area from the pattern of activity in another face area. The prediction power was significantly higher between the occipital face area and FFA. The multivariate regression analysis provides a new framework for investigating functional connectivity between cortical areas, and it could inform hierarchical models of visual cortex.
Introduction
Neuroimaging studies have shown that regions in the ventral visual pathway respond selectively to specific object categories (Grill-Spector and Weiner, 2014). One of these regions in human brain is the fusiform face area (FFA), which is consistently more responsive to face than nonface images (Kanwisher et al., 1997; Sergent et al., 1992; Tsao et al., 2008). However, it is not clear how this selectivity is formed and how other cortical regions contribute to this preferential response in FFA.
Studies in humans and nonhuman primates suggest that face processing occurs in a hierarchical manner. In this framework, the occipital face area (OFA) in human and the posterior face patch in monkey process facial features/parts (Issa and DiCarlo, 2012; Liu et al., 2010), FFA in human and the middle face patch in monkey process the configural aspects of faces (Tsao and Livingstone, 2008; Zhang et al., 2012), and anterior face patches in human and monkey process information about face identity and face viewpoint (Anzellotti and Caramazza, 2014; Freiwald and Tsao, 2010). Thus, part of face selectivity in FFA may have emerged through inputs from other face-selective areas. In fact, resting-state functional magnetic resonance imaging (fMRI) studies have demonstrated functional connectivity between FFA, OFA, and face-selective areas in posterior superior temporal sulcus (pSTS) and anterior temporal cortex (O'Neil et al., 2014; Turk-Browne et al., 2010; Zhu et al., 2011). The contribution of nonface areas to the responses in FFA is less known. One study has reported that motion could explain a large amount of variance in the face-selective response during viewing of dynamic natural stimuli (Russ and Leopold, 2015). Thus, it is possible that motion-selective areas contribute strongly to the responses in FFA.
Here we tested the role of 24 visual cortical areas in predicting the responses in FFA through regression models. These areas were defined by retinotopic mapping and functional localizers. The measurements were based on fMRI responses to naturalistic stimuli, assuming that the cortical interactions would be more pronounced when the cortical areas are actively involved in processing of incoming stimuli.
In fMRI encoding/decoding studies, a general approach is to present some stimuli, make a regression model between the stimuli and brain responses, and then test the accuracy of the model in predicting the responses to some new stimuli (Naselaris et al., 2011). In the current study, we propose a novel approach in which the mean response in FFA is predicted based on the mean and pattern of the responses in other visual cortical areas. For example, we tested how well V1 voxels can predict the FFA response, compared with voxels in V2, V3, motion-selective area, and category-selective areas. This approach could provide useful information about how selectivity in FFA is formed based on the responses in other areas. It could also inform us about the strength of connectivity between FFA and other areas, which can be used to build hierarchical models of interareal connections.
The null hypothesis here is that all other visual cortical areas contribute “equally” (or do not contribute at all) to the response of FFA. Specifically, we wanted to test the following hypotheses: V1 contributes more than any other area to the response of FFA. V1 contains a rich representation of low-level visual properties, and at the fMRI level, those low-level properties may explain most of the variances in the response of other areas such as FFA. Intermediate visual cortical areas (such as V4), which extract more complex information about visual contours and forms, might be the strong predictor of the FFA response. Areas that are anatomically close to FFA in the visual hierarchy may have the most contribution to the response of FFA, as these areas presumably provide a stronger input to FFA. The FFA response might be well predicted by other face-selective areas, since those areas and FFA are functionally correlated. A bit counterintuitive hypothesis could be that other category-selective areas (such as the nearby scene-selective area—parahippocampal place area [PPA]) are the strong predictor of the FFA response.
Methods
Participants
Seven healthy participants (four females), mean age 30.6 years (SD 3, range 25–34 years), took part in the study and provided written informed consent approved by Review Board of Institute for Research in Fundamental Sciences (IPM). All participants were right handed, had no history of mental disorders, and were paid for their participation.
Experimental procedures
MRI (magnetic resonance image) data were recorded in two sessions: one session was dedicated to structural imaging and functional localizers (category localizer and middle temporal [MT] localizer). In the other session, fMRI responses to movies (naturalistic action videos without sound) were measured. The stimuli were presented to the subjects using Psychtoolbox-3 (Brainard, 1997).
Category localizer
Each run contained two repetitions of five category blocks (faces, bodies, objects, scenes, and scrambled images). Twelve images were shown within a block (1000 ms each) with a blank in between (333.3 ms). Only one image was repeated randomly during the block. Each block lasted 16 sec. There were 12-sec blank (“fixation only”) periods between category blocks and also at the beginning and end of each run. Each run lasted 292 sec. Four runs with a counterbalanced order of category blocks were collected. To engage subjects' attention throughout the scan, they were asked to stare at a red fixation point at the center of screen, detect the repeated image, and report it by pressing a response key.
MT localizer
Each run contained four repetitions of two stimulus blocks (moving rings and static rings). Each block lasted 16 sec. There were 16-sec blank periods between stimulus blocks and also at the beginning and end of each run. Each run lasted 272 sec. Four runs with a counterbalanced order of stimulus blocks were collected. To engage subject's attention throughout the scan, they were asked to stare at a red fixation point at the center of screen, detect a color change at the fixation point, and report it by pressing a response key.
Movie experiment
In each run, sixty 6-sec naturalistic movie clips (size: ∼9 degrees of visual angle) were presented (Fig. 1). The clips showed various forms of human actions, and they were selected from a movie database (Soomro et al., 2012). The clips were presented successively (i.e., without a blank period between them). There were 12-sec blank periods of uniform gray at the beginning and end of each run. Each run lasted 384 sec. Ten runs with a pseudorandom order of movie clips were collected. Subjects were instructed to stare at a red fixation point throughout the scan.
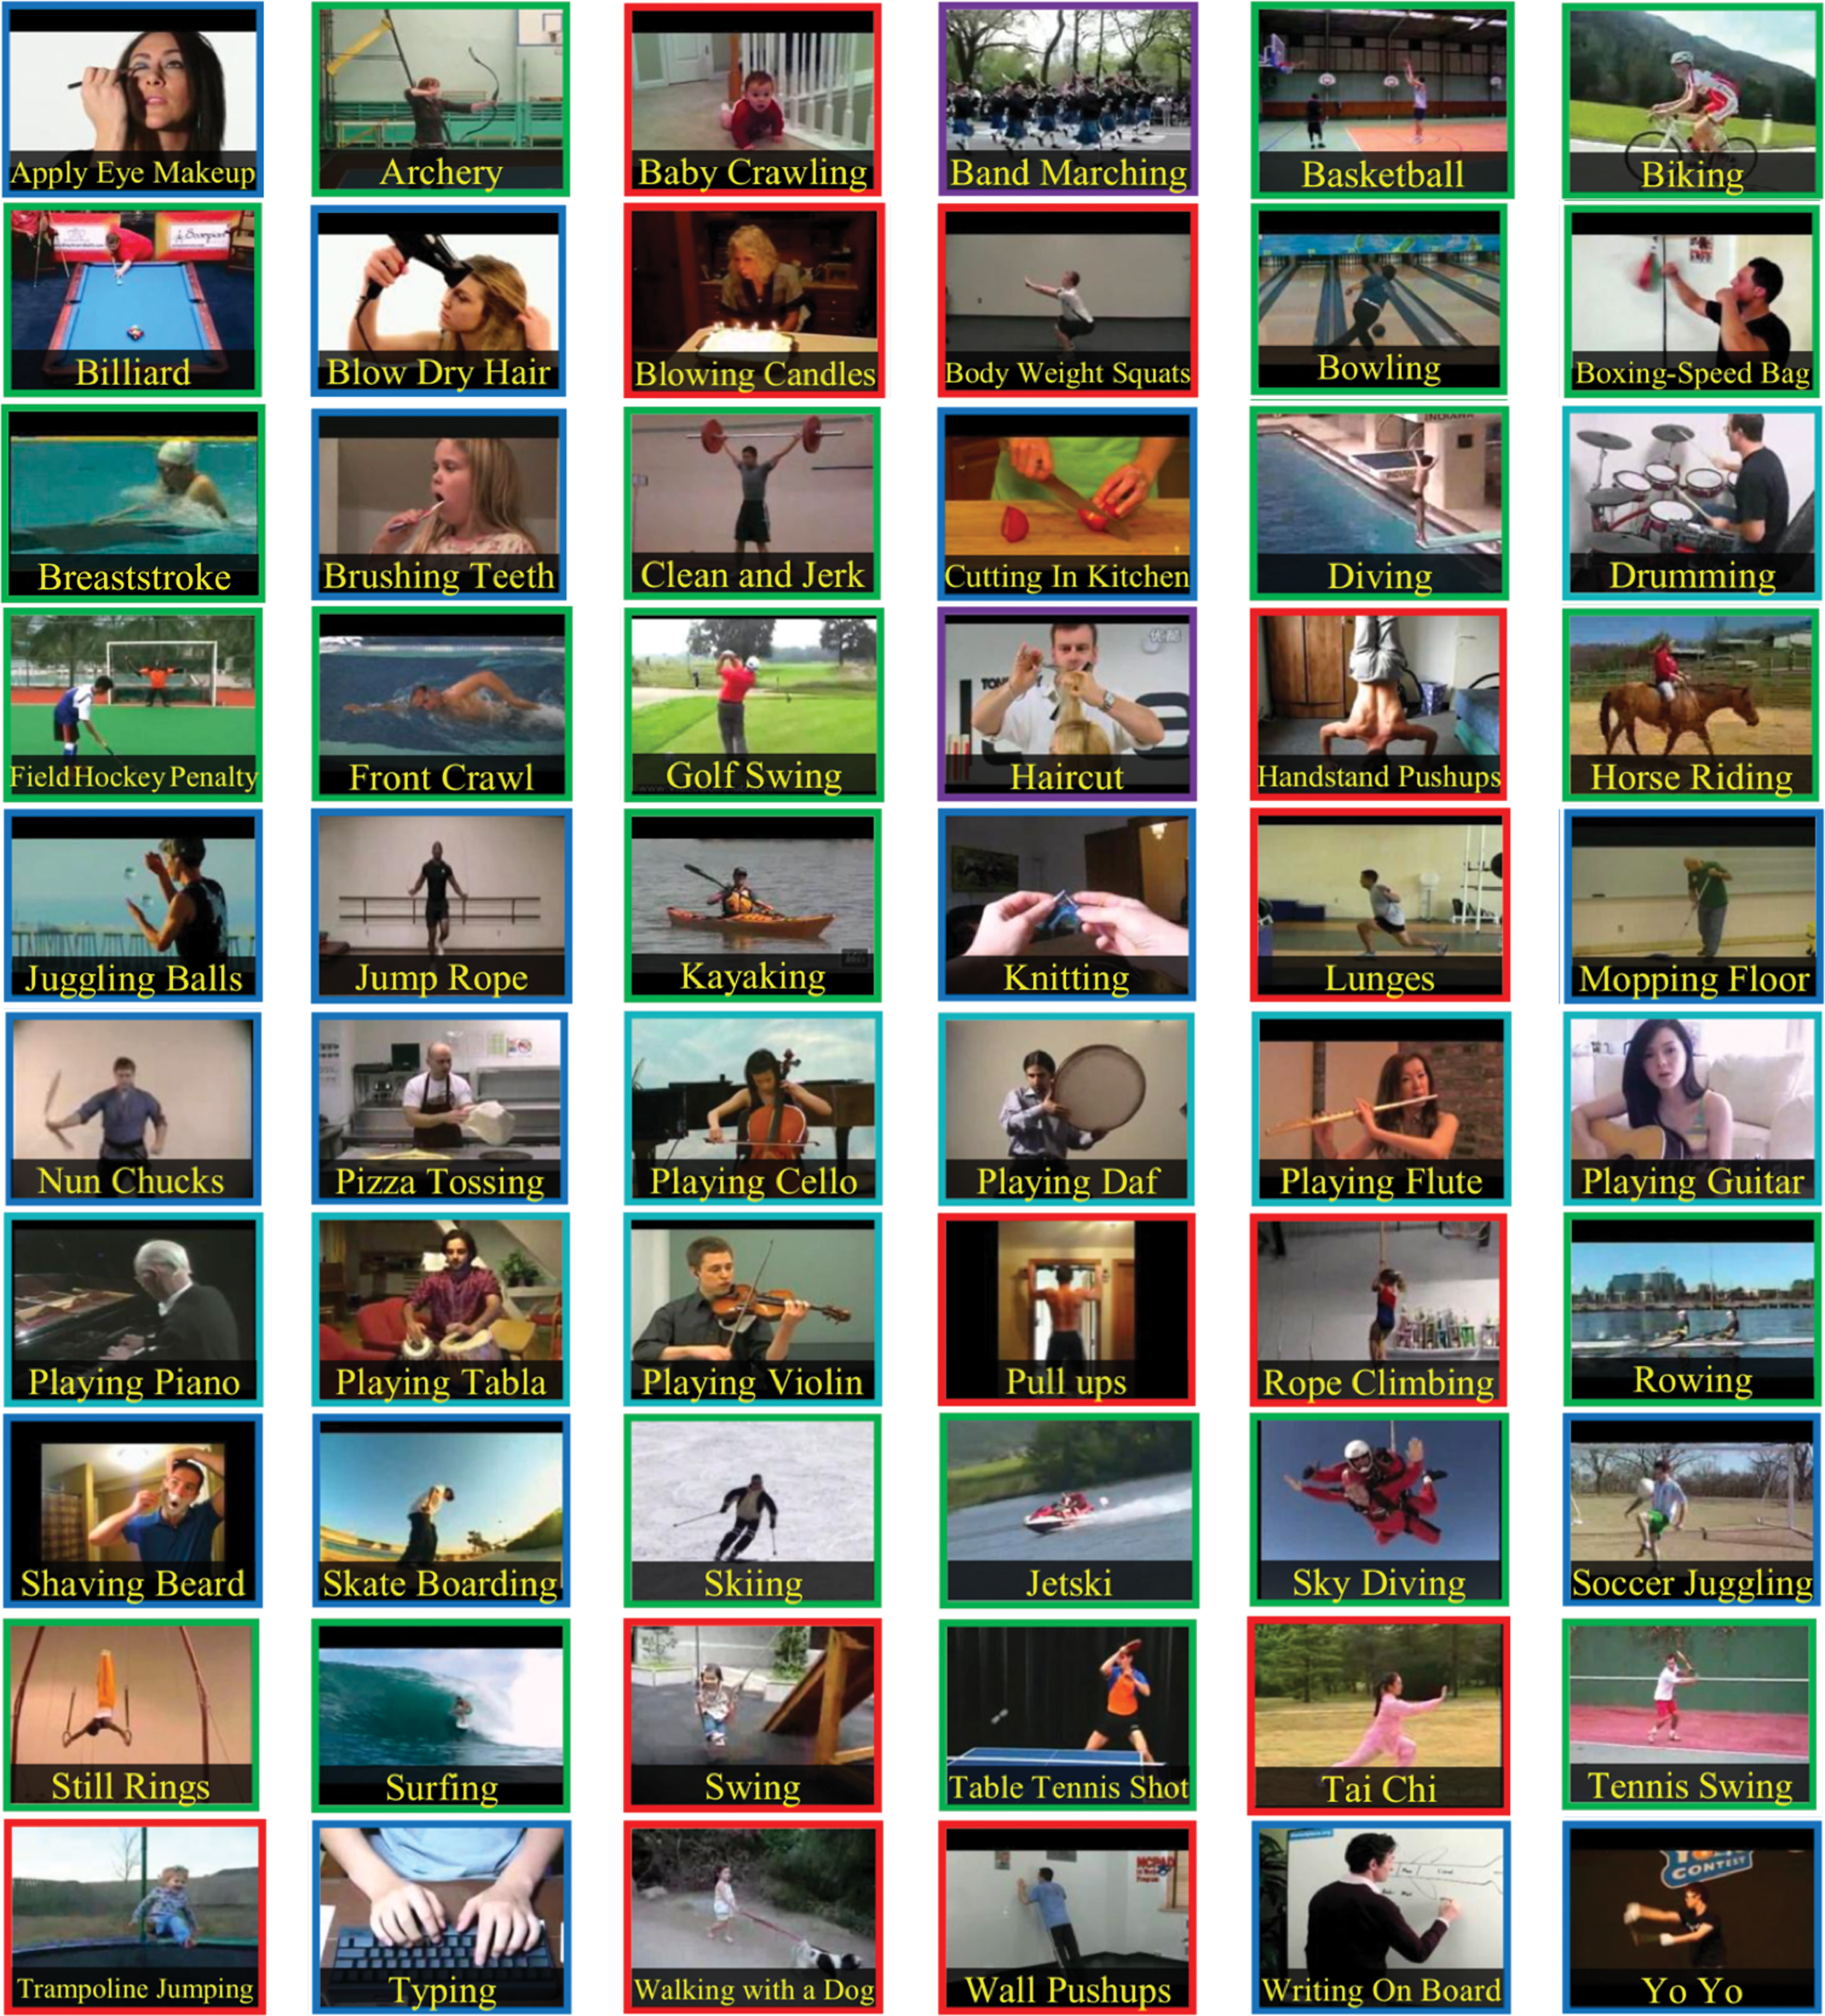
The snapshots (sample frames) of 60 movie clips used in the movie experiment. The action categories included human/object interaction (blue border), body-motion only (red border), human/human interaction (purple border), playing musical instruments (cyan border), and sports (green border). The type of action has been written for each snapshot. Sixty different action classes were used. In 75% of movies, a face was presented. Faces were mostly presented close to the fixation spot. Figure adapted with permission from Figure 2 in Soomro et al. (2012). Color images are available online.
fMRI methods
MRIs were collected at the Medical Imaging Center of Imam Khomeini Hospital Complex (Tehran, Iran) using a Siemens 3T Tim Trio MRI scanner and an eight-channel head coil. Visual stimuli were presented to the subjects by a video projector through a front projection system, and the subjects' responses were collected via an MRI-compatible response box. Blood oxygenation level-dependent (BOLD) functional images were acquired using a single-shot gradient-echo echo-planar imaging sequence with repetition time (TR) of 2 sec, echo time (TE) of 30 ms, 90° flip angle, 30 transverse slices, and voxel size of 3 × 3 × 4 mm3. One structural scan was also acquired from each participant using an MPRAGE pulse sequence (TR = 1800 ms, TE = 3.44 ms, inversion time = 1100 ms, 7° flip angle, 176 sagittal slices, and 1 × 1 × 1 mm3 isotropic voxels). To reduce the subjects' head motion, foam cushions were used around the head during scans.
FreeSurfer and FS-FAST were used for data preprocessing and analysis. Motion correction was applied on fMRI data, in which the image corresponding to the middle time point of each run was used as the reference. Functional data were then resampled to the vertices of the cortical surface in left and right hemispheres, in individual subjects. After resampling, data were spatially smoothed on the surface (by a Gaussian kernel with 5 mm FWHM in the localizer experiments and 3 mm FWHM in the movie experiment). In the analysis of MT localizer, category localizer and movie experiment, a general linear model (GLM) was applied with 2 (moving and static), 5 (face, body, object, scene, and scrambled), and 60 movie conditions, respectively. The stimulus pattern of each condition was convolved with a canonical hemodynamic response function to produce the desired regressors for GLM. Additional regressors included second-order polynomial nuisance regressor and six external regressors from the estimated head motion. In each run, the first four time points were excluded from data analysis. In the movie experiment, GLM beta values (activation levels) of 60 conditions were extracted for visually driven vertices (vertices that had higher activation for all conditions compared with baseline).
The motion-selective area MT was localized in each subject's hemisphere using the contrast of moving versus static conditions from the MT localizer. Eight category-selective areas were localized in each subject's hemisphere using the following procedure. First the thresholded maps were obtained for the contrasts of face versus all other conditions, body versus all other conditions, and scene versus all other conditions (map threshold: p < 0.001). Then, the maps were intersected with parcels derived from an average functional map (Julian et al., 2012). The resulting labels included three face-selective areas: FFA, OFA, pSTS, two body-selective areas: extrastriate body area (EBA), fusiform body area (FBA), and three scene-selective areas: PPA, retrosplenial cortex (RSC), and occipital place area. FBA vertices that had overlap with FFA were excluded from the FBA label. In each subject/hemisphere, only labels with more than 30 vertices were included in the analysis. Fifty retinotopic areas were also localized in each subject's hemisphere using the Wang atlas of visual topography (Wang et al., 2015). Derived labels included V1, V2, V3, V3A, V3B, IPS0–4, LO1, LO2, hV4, VO1, and VO2. Overall, there were 276 regions-of-interest in 2 hemispheres of 7 subjects.
Regression models
Regression models were constructed to estimate/predict the mean BOLD activity in FFA from the mean response or the spatial pattern of responses in 24 visual cortical areas, including retinotopic areas, MT, and category-selective areas. We used partial least-squares regression (PLSR) because PLSR could better cope with large data sets, where the number of predictors is greater than the number of observations. Moreover, PLSR could resolve multicollinearity among the predictors, which is a common problem when using regression models on fMRI data sets (Abdi, 2010; Krishnan et al., 2011). In pilot analyses, other methods of regression (ordinary least-squares regression, support vector regression, and regularized regression) were also examined. PLSR showed a better generalizability compared with other methods. Prediction accuracy was measured using the explained variance: 1 − (sum of square error/variance of actual values).
where y and
To have the best response prediction, PLSR required optimizing the number of latent variables. To find the optimal number of latent variables, a 10-fold cross-validation was applied on the training set, and prediction accuracy was obtained for different numbers of latent variables. The number with the highest prediction accuracy for the training set was later used to obtain prediction accuracy for the test set.
Results
As mentioned in the fMRI methods, 24 visual cortical areas (retinotopic, motion-selective, and category-selective areas) were localized in both hemispheres of each subject. Figure 2A shows these areas on a flattened patch of occipital/parietal/temporal cortex. In each area, the mean response (average activity across vertices) and the pattern of response (activity of all vertices) were extracted for 60 independent movie clips. Then, we used correlation and regression models to predict/estimate the mean BOLD activity in FFA based on the mean or pattern of responses in other areas.
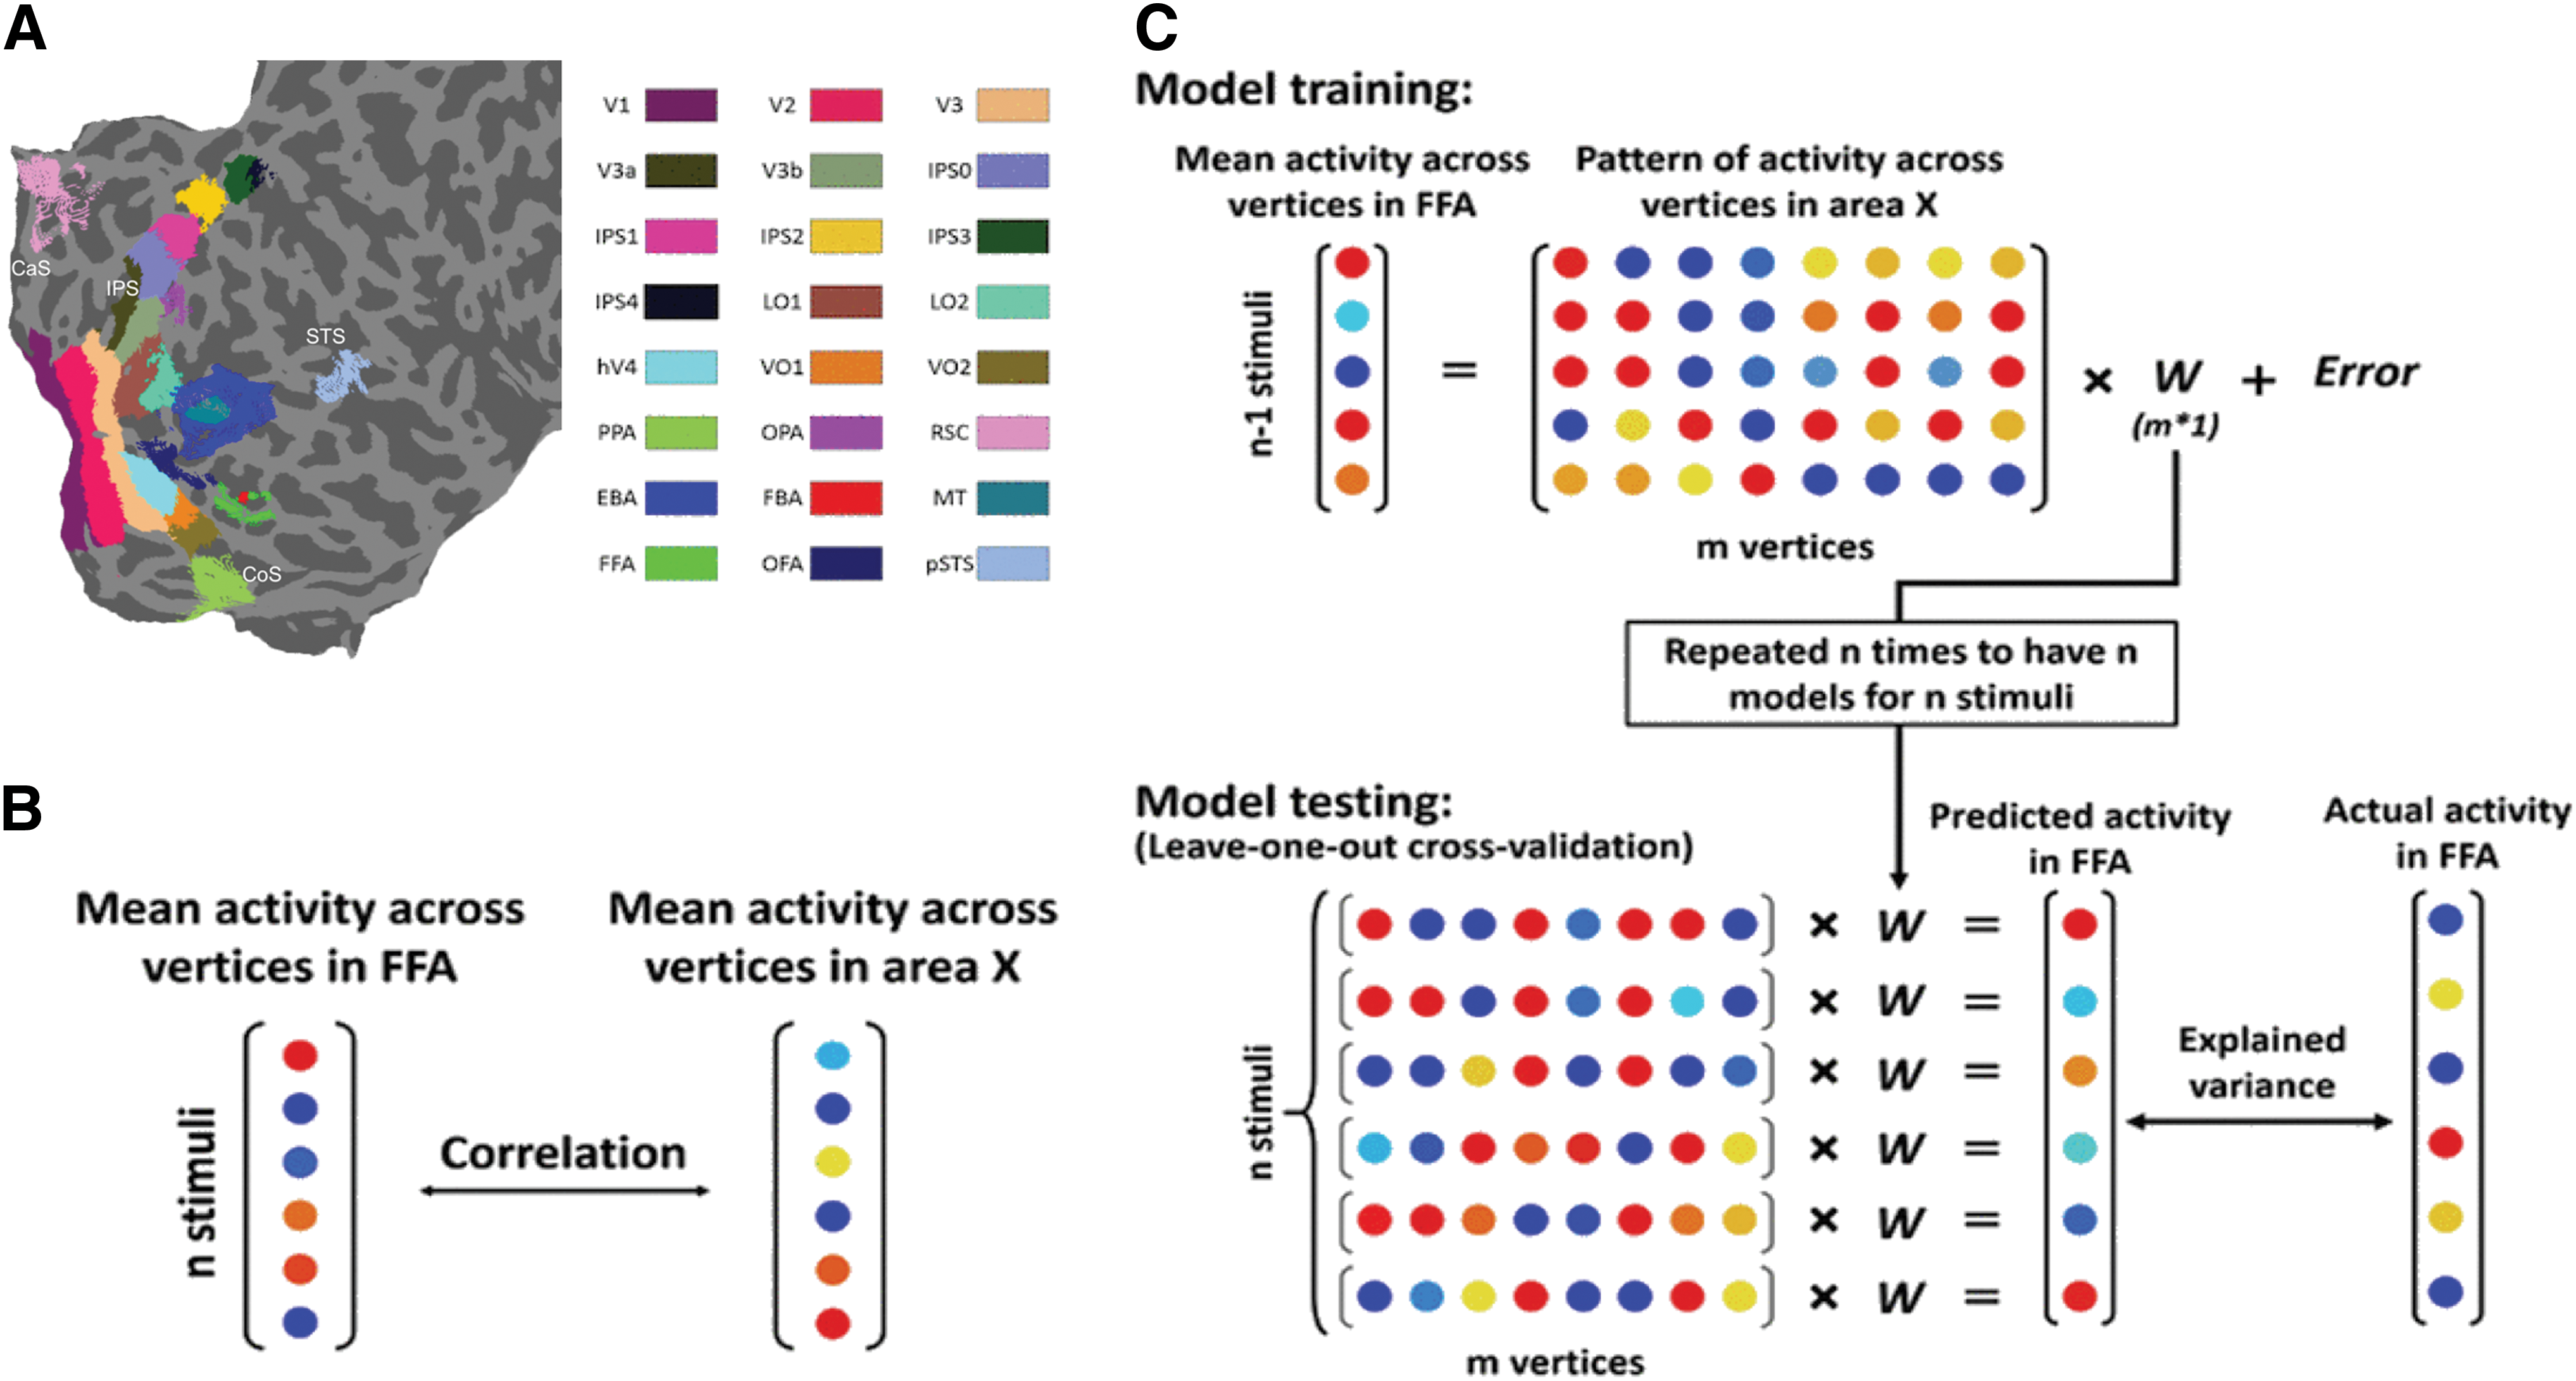
The procedure of data analysis.
First, we computed the correlation between mean activity in FFA and mean activity in other areas (Fig. 2B). The correlation values were obtained for areas ipsilateral to FFA and areas contralateral to FFA. The results are shown in Figure 3A. A two-way ANOVA revealed a significant main effect of laterality [2 levels, F(1,276) = 4.15, p < 0.05], a significant main effect of area [24 levels, F(23,276) = 41.56, p << 0.05], and no significant interaction between laterality and area [F(23,276) = 0.47, p > 0.05]. Thus overall, FFA had significantly higher correlations with ipsilateral areas than contralateral areas. The correlation values were also compared with zero after correcting for multiple comparisons (48 comparisons). In both ipsilateral and contralateral conditions, FFA, OFA, pSTS, EBA, FBA, MT, V1, V2, V3, V3A, hV4, LO1, LO2, IPS1, and IPS4 showed significantly higher correlations than zero (FDR-adjusted p < 0.05, one-tailed t-test).
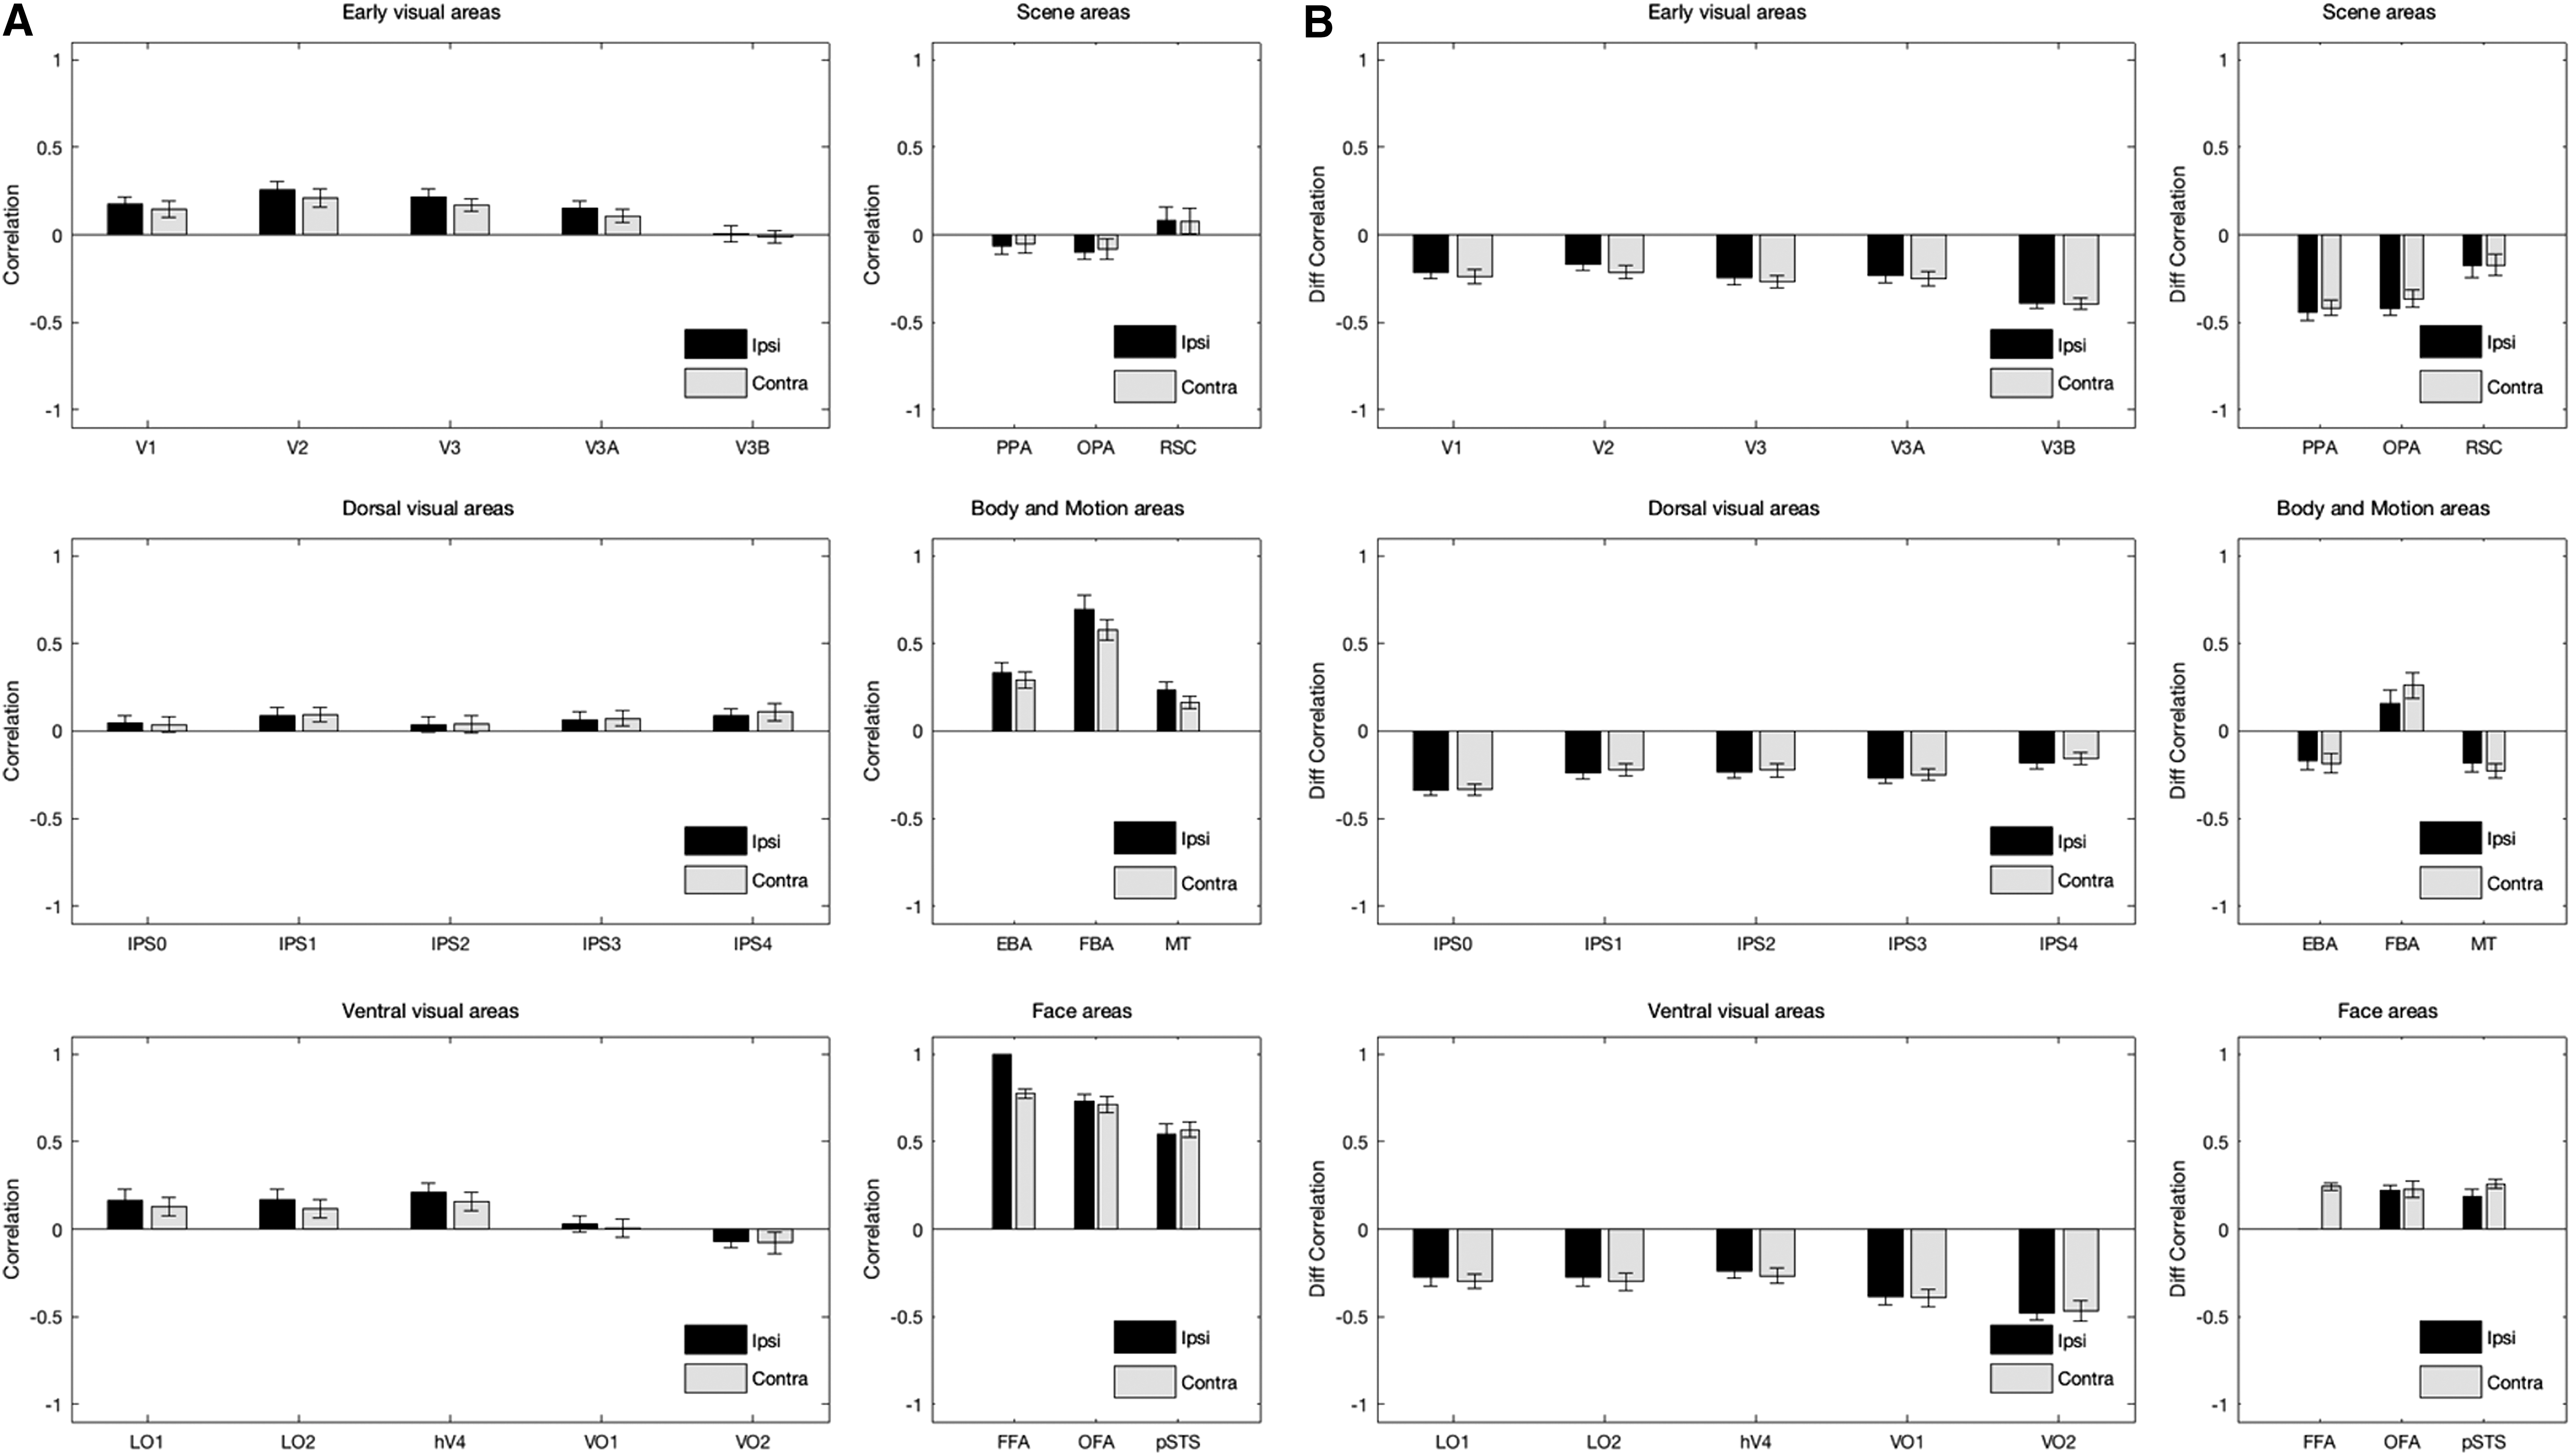
Results from the correlation analysis.
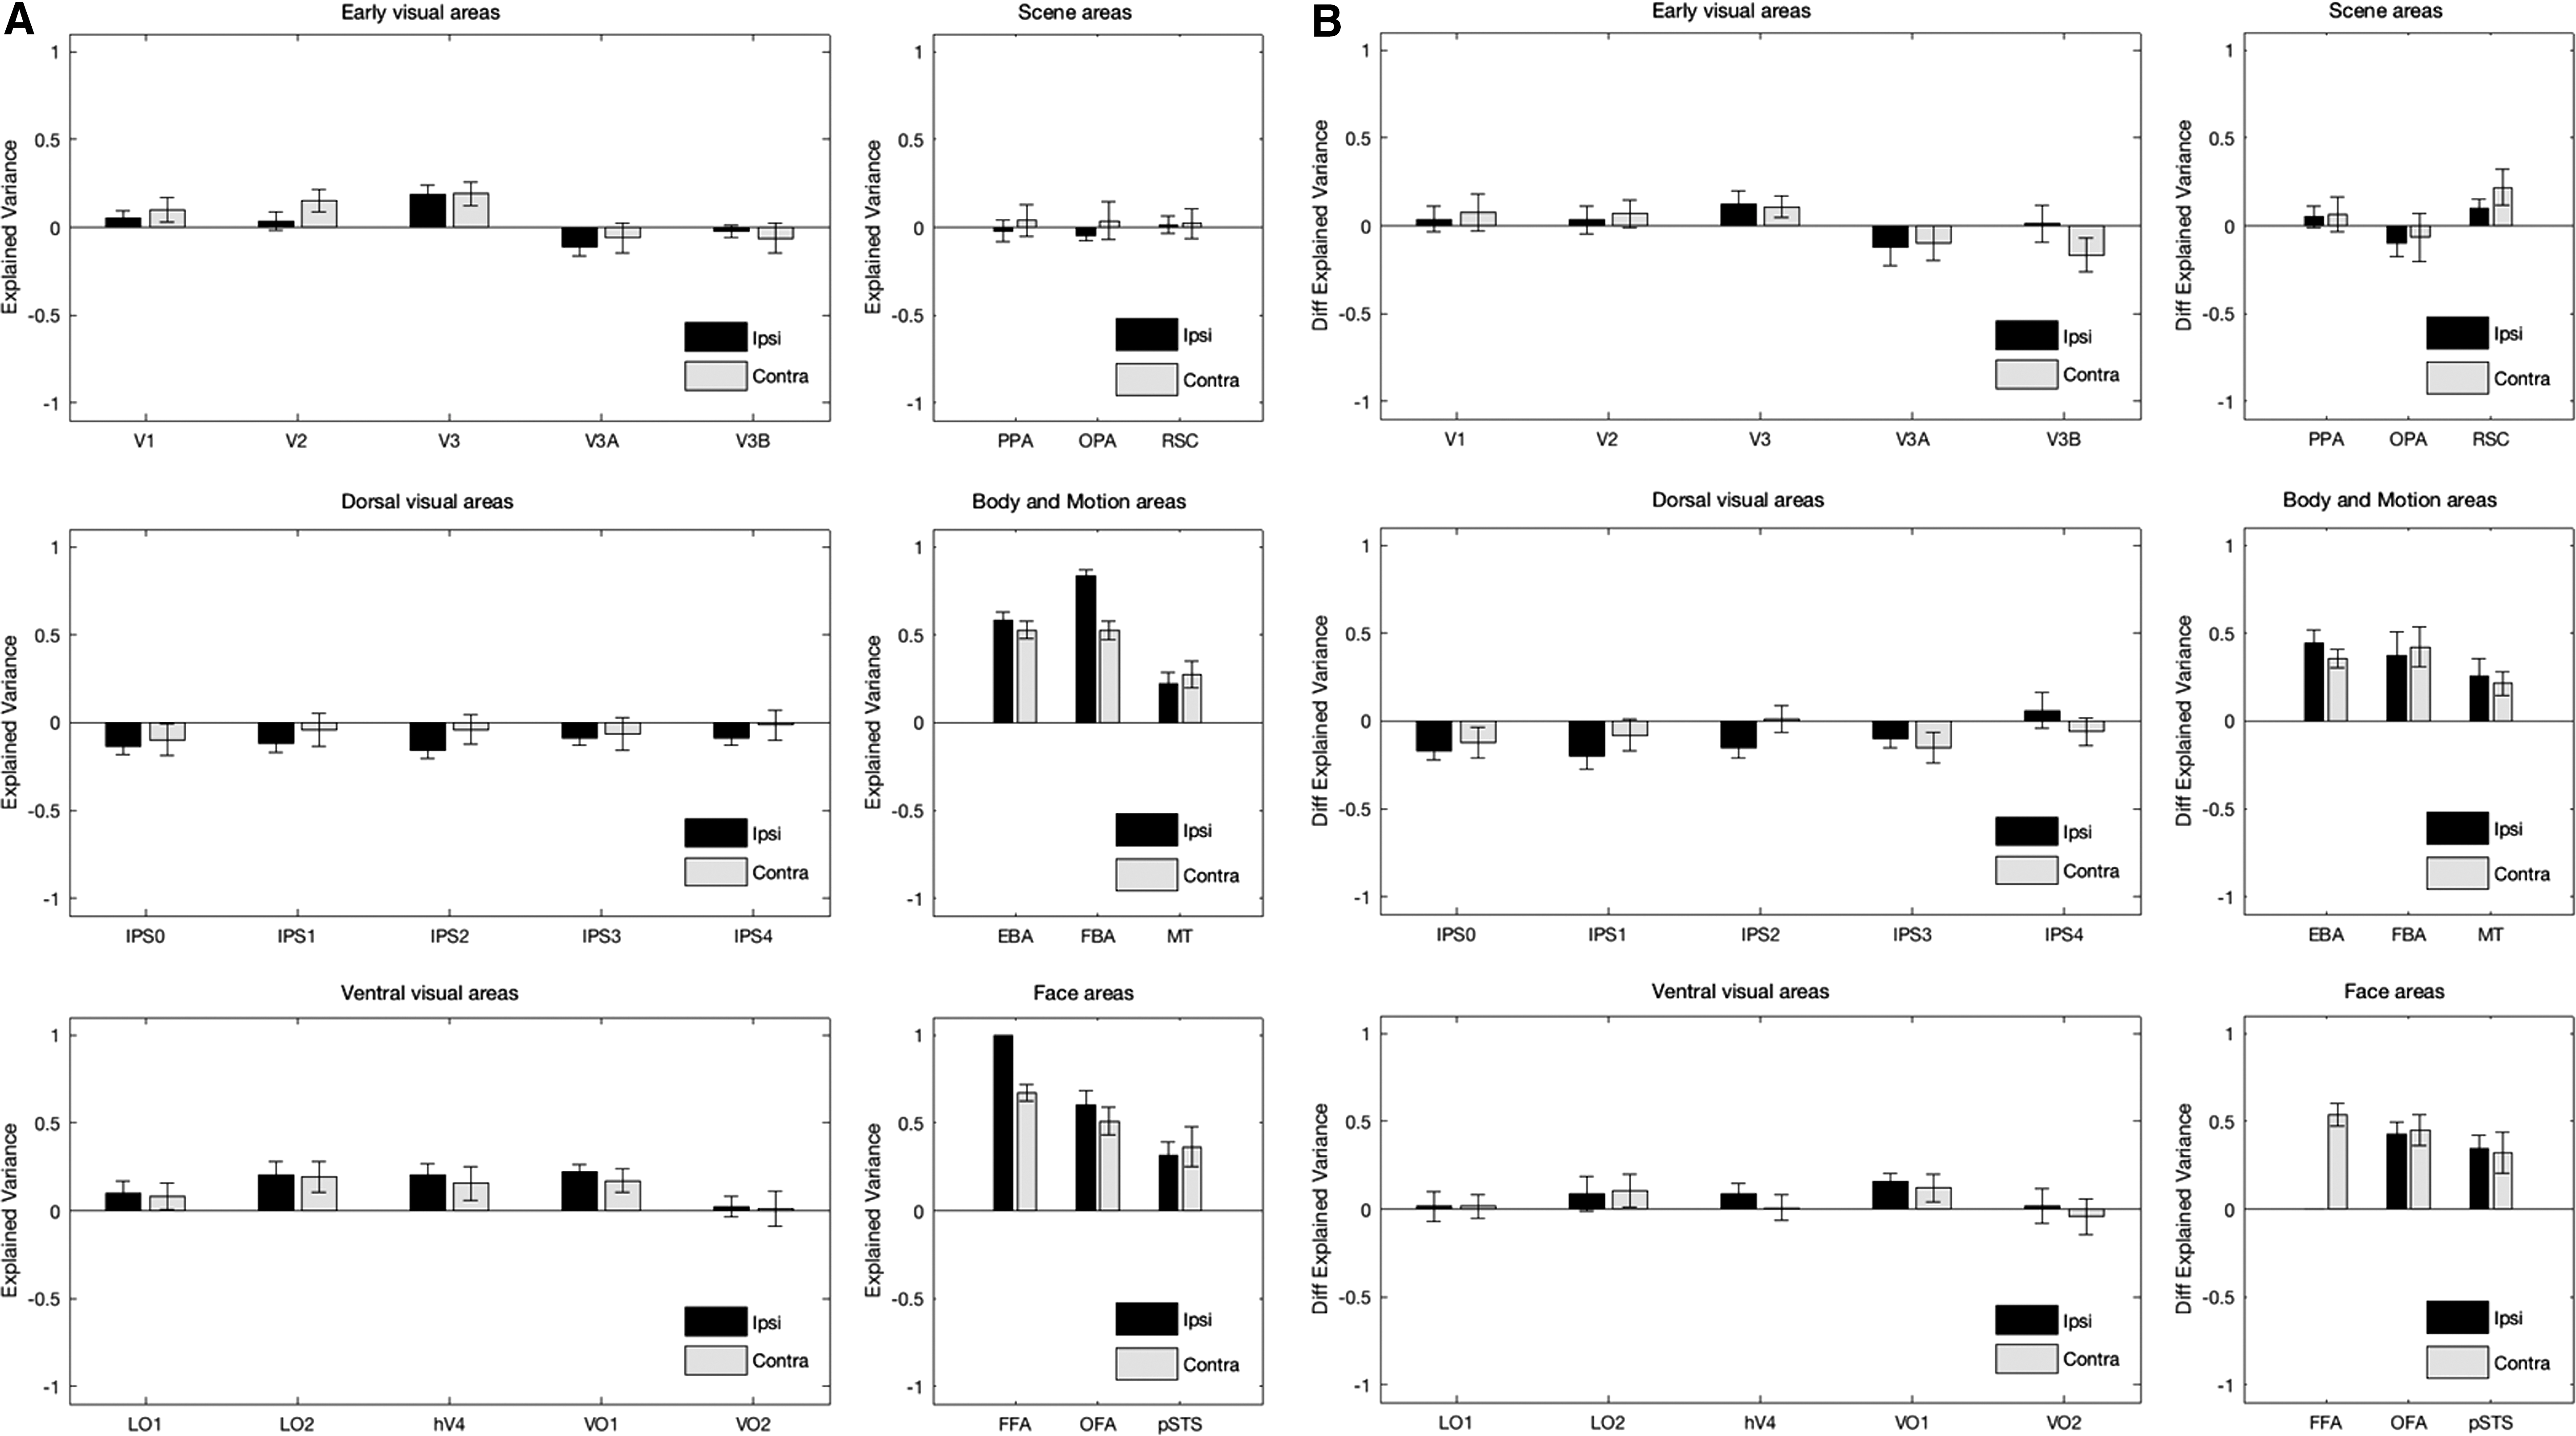
Next, we used PLSR models to predict mean activity in FFA based on the pattern of activity in other areas. A leave-one-out cross-validation procedure was used to train and test the models (Fig. 2C). For a given area (area X), a regression model was constructed based on 59 (out of 60) stimuli. If area X had m vertices, a weight/coefficient vector (W) of size m would determine mapping between activity in those vertices and mean activity in FFA. For the remaining stimulus, W was multiplied by the activity of vertices in area X to obtain a predicted mean activity in FFA. This procedure was repeated 60 times to have 60 models and predict mean activity of FFA for 60 stimuli. The two vectors of predicted and actual mean activity in FFA were compared through the calculation of explained variance [Eq. (1)]. The explained variance was an indication of prediction accuracy for the models. Figure 4A shows the explained variance for 24 areas. The values are plotted separately for ipsilateral and contralateral conditions. Control models were also derived from random data. In each area, the activity of vertices was substituted with a random value taken from a uniform distribution in the range between minimum and maximum of original activity in that area. The average explained variance was computed for 10 repetitions of control models. The original models outperformed the control models in many areas.
Results from the PLSR analysis.
A two-way ANOVA revealed no significant main effect of laterality [2 levels, F(1,276) = 0.2, p > 0.05], a significant main effect of area [24 levels, F(23,276) = 29.16, p << 0.05], and no significant interaction between laterality and area [F(23,276) = 1.25, p > 0.05]. The explained variance of original models was also compared with the explained variance of control models after correcting for multiple comparisons (48 comparisons). In both ipsilateral and contralateral conditions, the comparison was significant in FFA, OFA, pSTS, EBA, FBA, MT, V3, and VO1 (FDR-adjusted p < 0.05, one-tailed t-test). In addition, the comparison was significant in hV4 and LO2 in the ipsilateral condition (FDR-adjusted p < 0.05, one-tailed t-test).
To investigate the effects of stimulus-induced correlation, an additional analysis was conducted. In this analysis, a stimulus-related variable was defined. After regressing out this variable during preprocessing of fMRI data, the GLM residuals were obtained. The time-courses of residuals were then used for correlation and regression analyses. This approach would be qualitatively equivalent to using stimulus-free resting-state fMRI data (Fair et al., 2007). The correlation values derived from residuals were subtracted from the correlation values derived from stimulus-related beta values (Fig. 3B). Similarly, in the regression analysis, the explained variance values derived from residuals were subtracted from the explained variance values derived from stimulus-related beta values (Fig. 4B). In the stimulus-free condition, the correlation between mean activity in FFA and mean activity in other visual areas was generally higher, except for face-selective areas. The difference correlation values in Figure 3B were significantly positive for ipsilateral OFA and pSTS, and contralateral FFA, OFA, pSTS, and FBA (p < 0.05, one-tailed t-test). This result suggests that, in the presence of stimulus, the fMRI activations in FFA would get decorrelated from the activations in other visual areas, except for face-selective areas that seem to have a strong interconnection with FFA. A similar result was observed in the regression analysis; however, the pattern of activations in EBA, FBA, and MT (in addition to face-selective areas) could better predict the mean activity in FFA in the presence of stimulus. The difference explained that variance values in Figure 4B were significantly positive for ipsilateral OFA, pSTS, EBA, FBA, MT, and VO1, and contralateral FFA, OFA, pSTS, EBA, FBA, MT, and RSC (p < 0.05, one-tailed t-test). Thus, the regression analysis may have a higher sensitivity for detecting areas that are functionally interconnected with FFA.
We had two models for predicting mean activation in FFA: one based on the mean activity in visual cortical areas, and the other based on the pattern of activity in visual cortical areas. The prediction accuracies of these two models were highly correlated (Fig. 5; stats are shown in the figure). This correlation was higher when the prediction of mean activation in FFA was based on activations in the right hemisphere. This could be due to the dominance of right hemisphere in processing facial features (Pitcher et al., 2007).
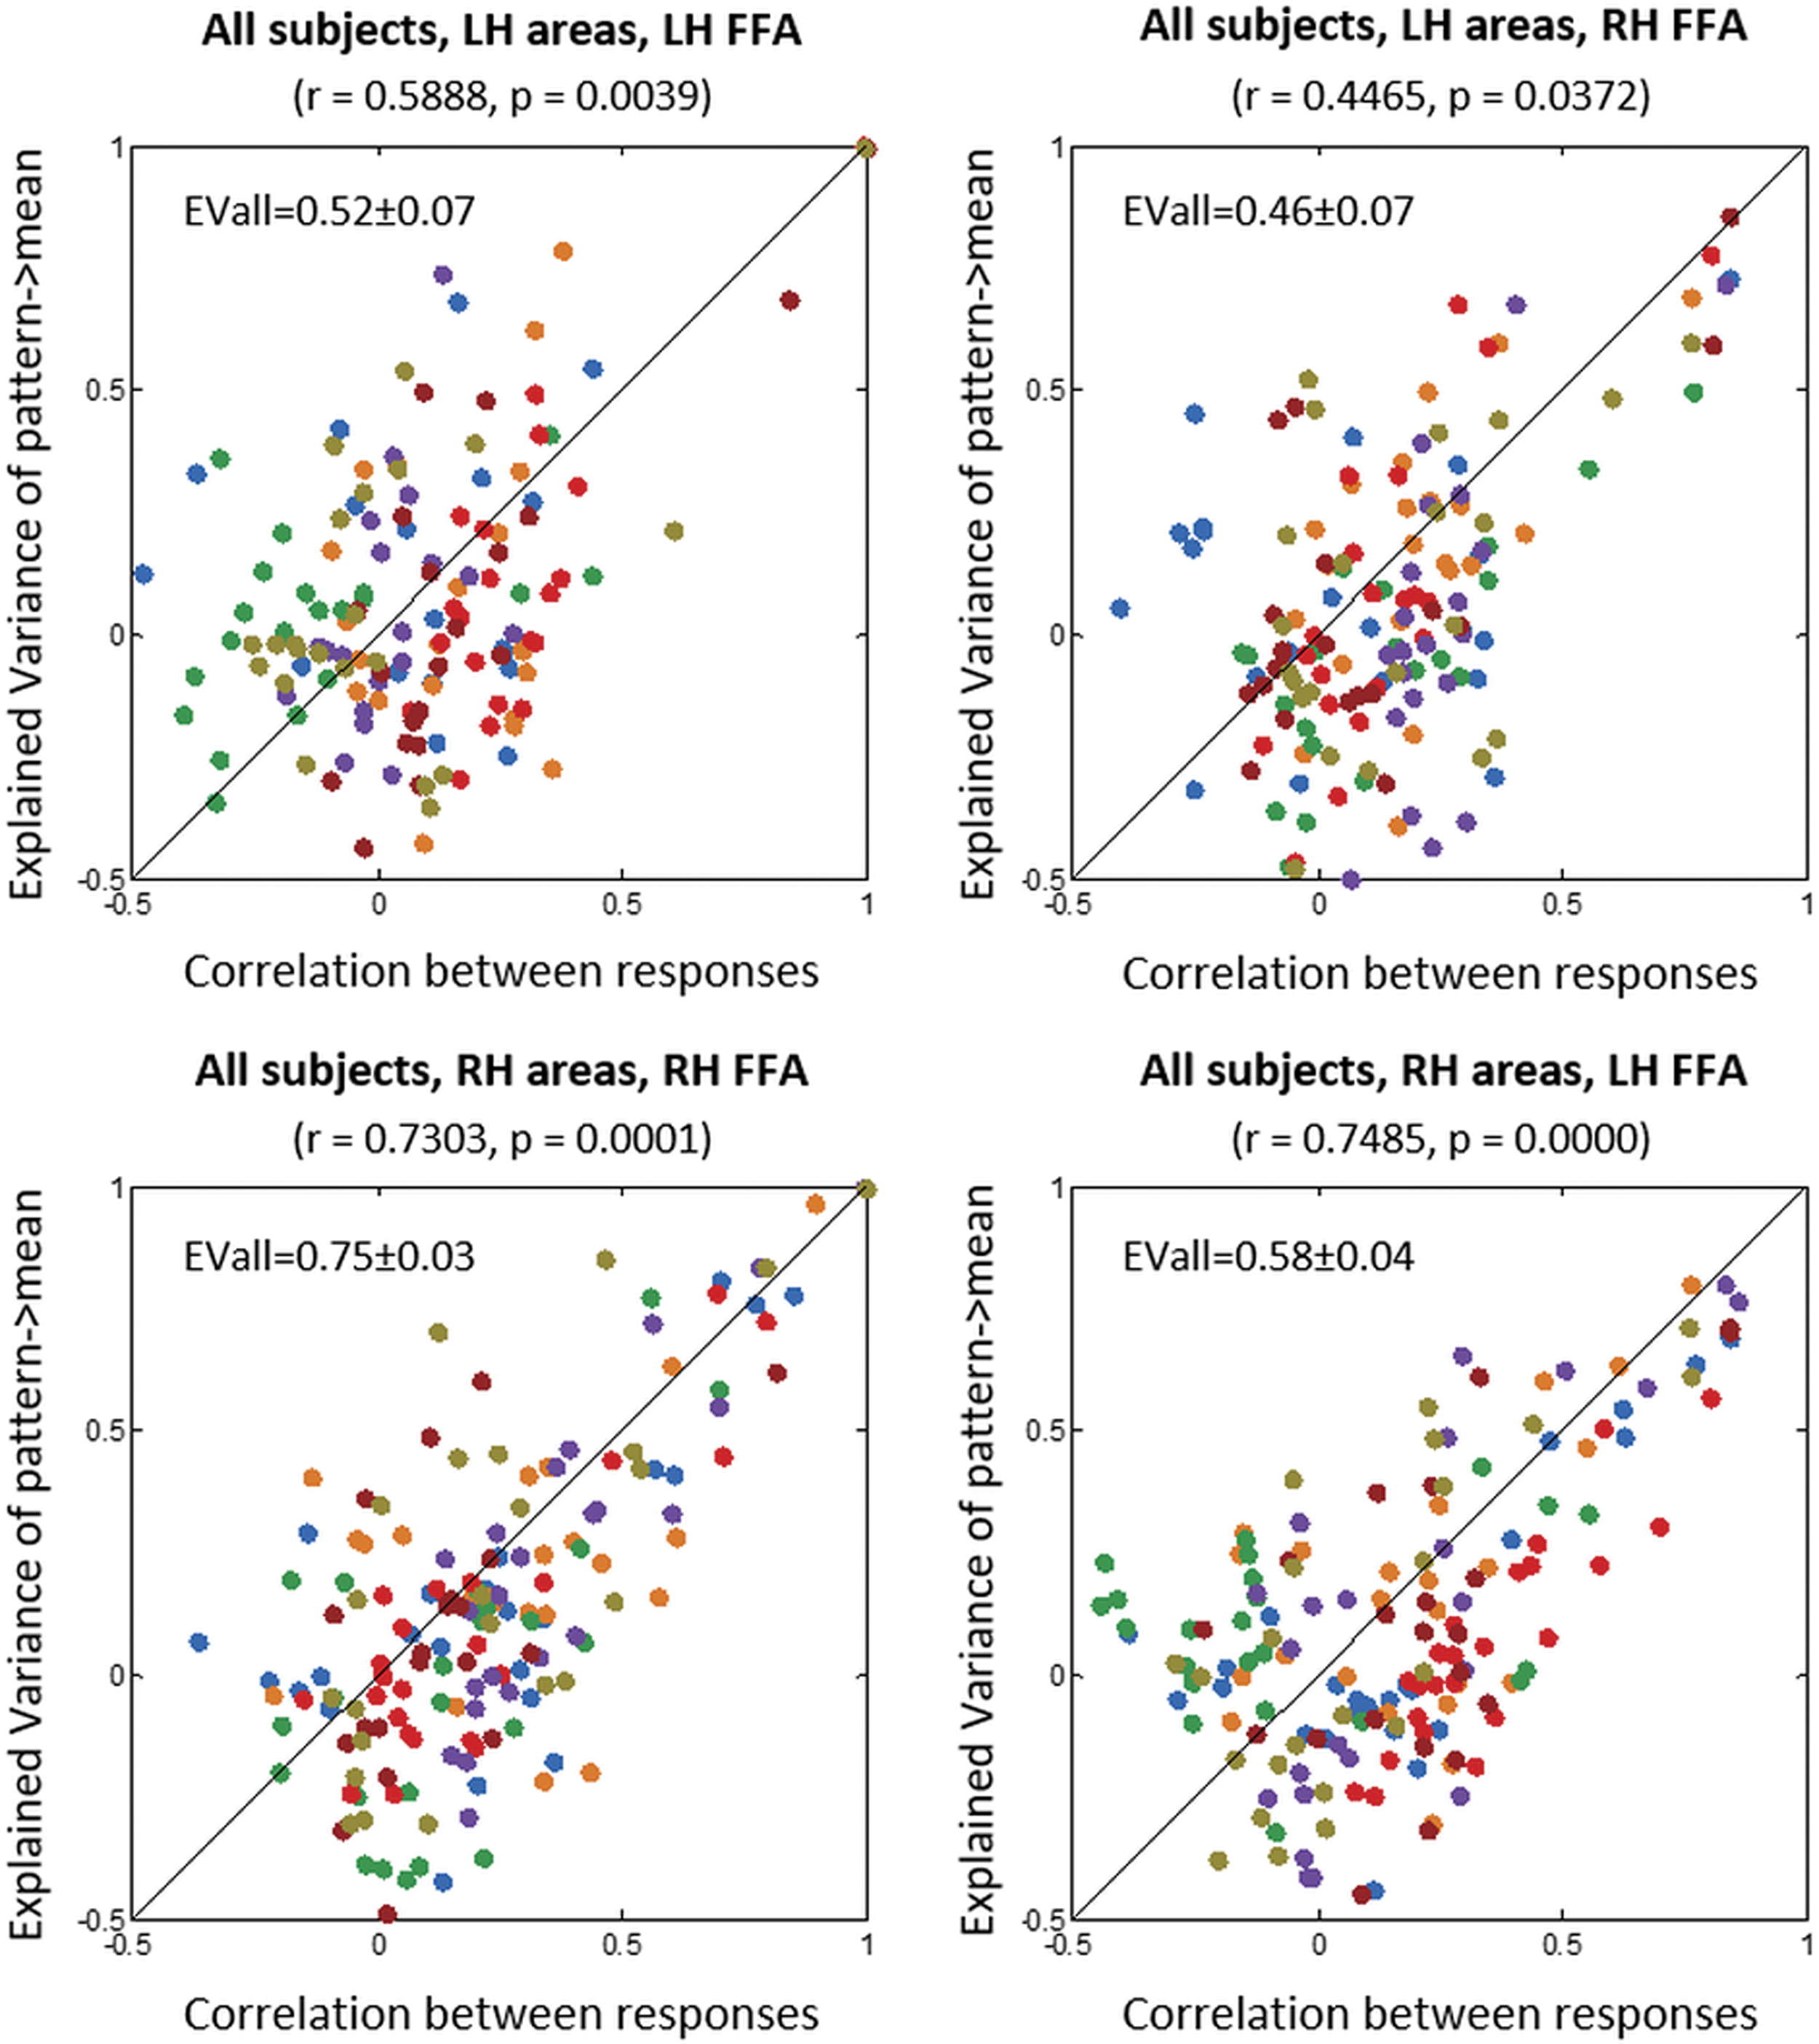
Correlation between accuracies of correlation models and PLSR models in predicting the mean activity in FFA. Each data point corresponds to one area. Data from all subjects are shown; each color corresponds to one subject. EVall, explained variance for all non-FFA. Color images are available online.
PLSR models were also designed to predict the mean activity in FFA based on the pattern of activity across all non-FFA vertices in retinotopic and functionally defined labels. The explained variance of such models was generally high, and in the best case, non-FFA could collectively explain 75% of variance in the FFA activity (the explained variance values are shown within the plots of Fig. 5).
For face-selective areas (FFA, OFA, and pSTS) in the right hemisphere, PLSR models were designed to predict the mean activity in one area based on the pattern of activity in another area. This analysis may reveal the hierarchical relationship between the three face areas. As shown in Figure 6, the prediction power was strongest between OFA and FFA (p < 0.05, one-way ANOVA with Tukey's HSD post hoc test). Moreover, OFA→FFA had higher prediction accuracy than FFA→OFA, OFA→pSTS had higher prediction accuracy than pSTS→OFA, and FFA→pSTS had higher prediction accuracy than pSTS→FFA.
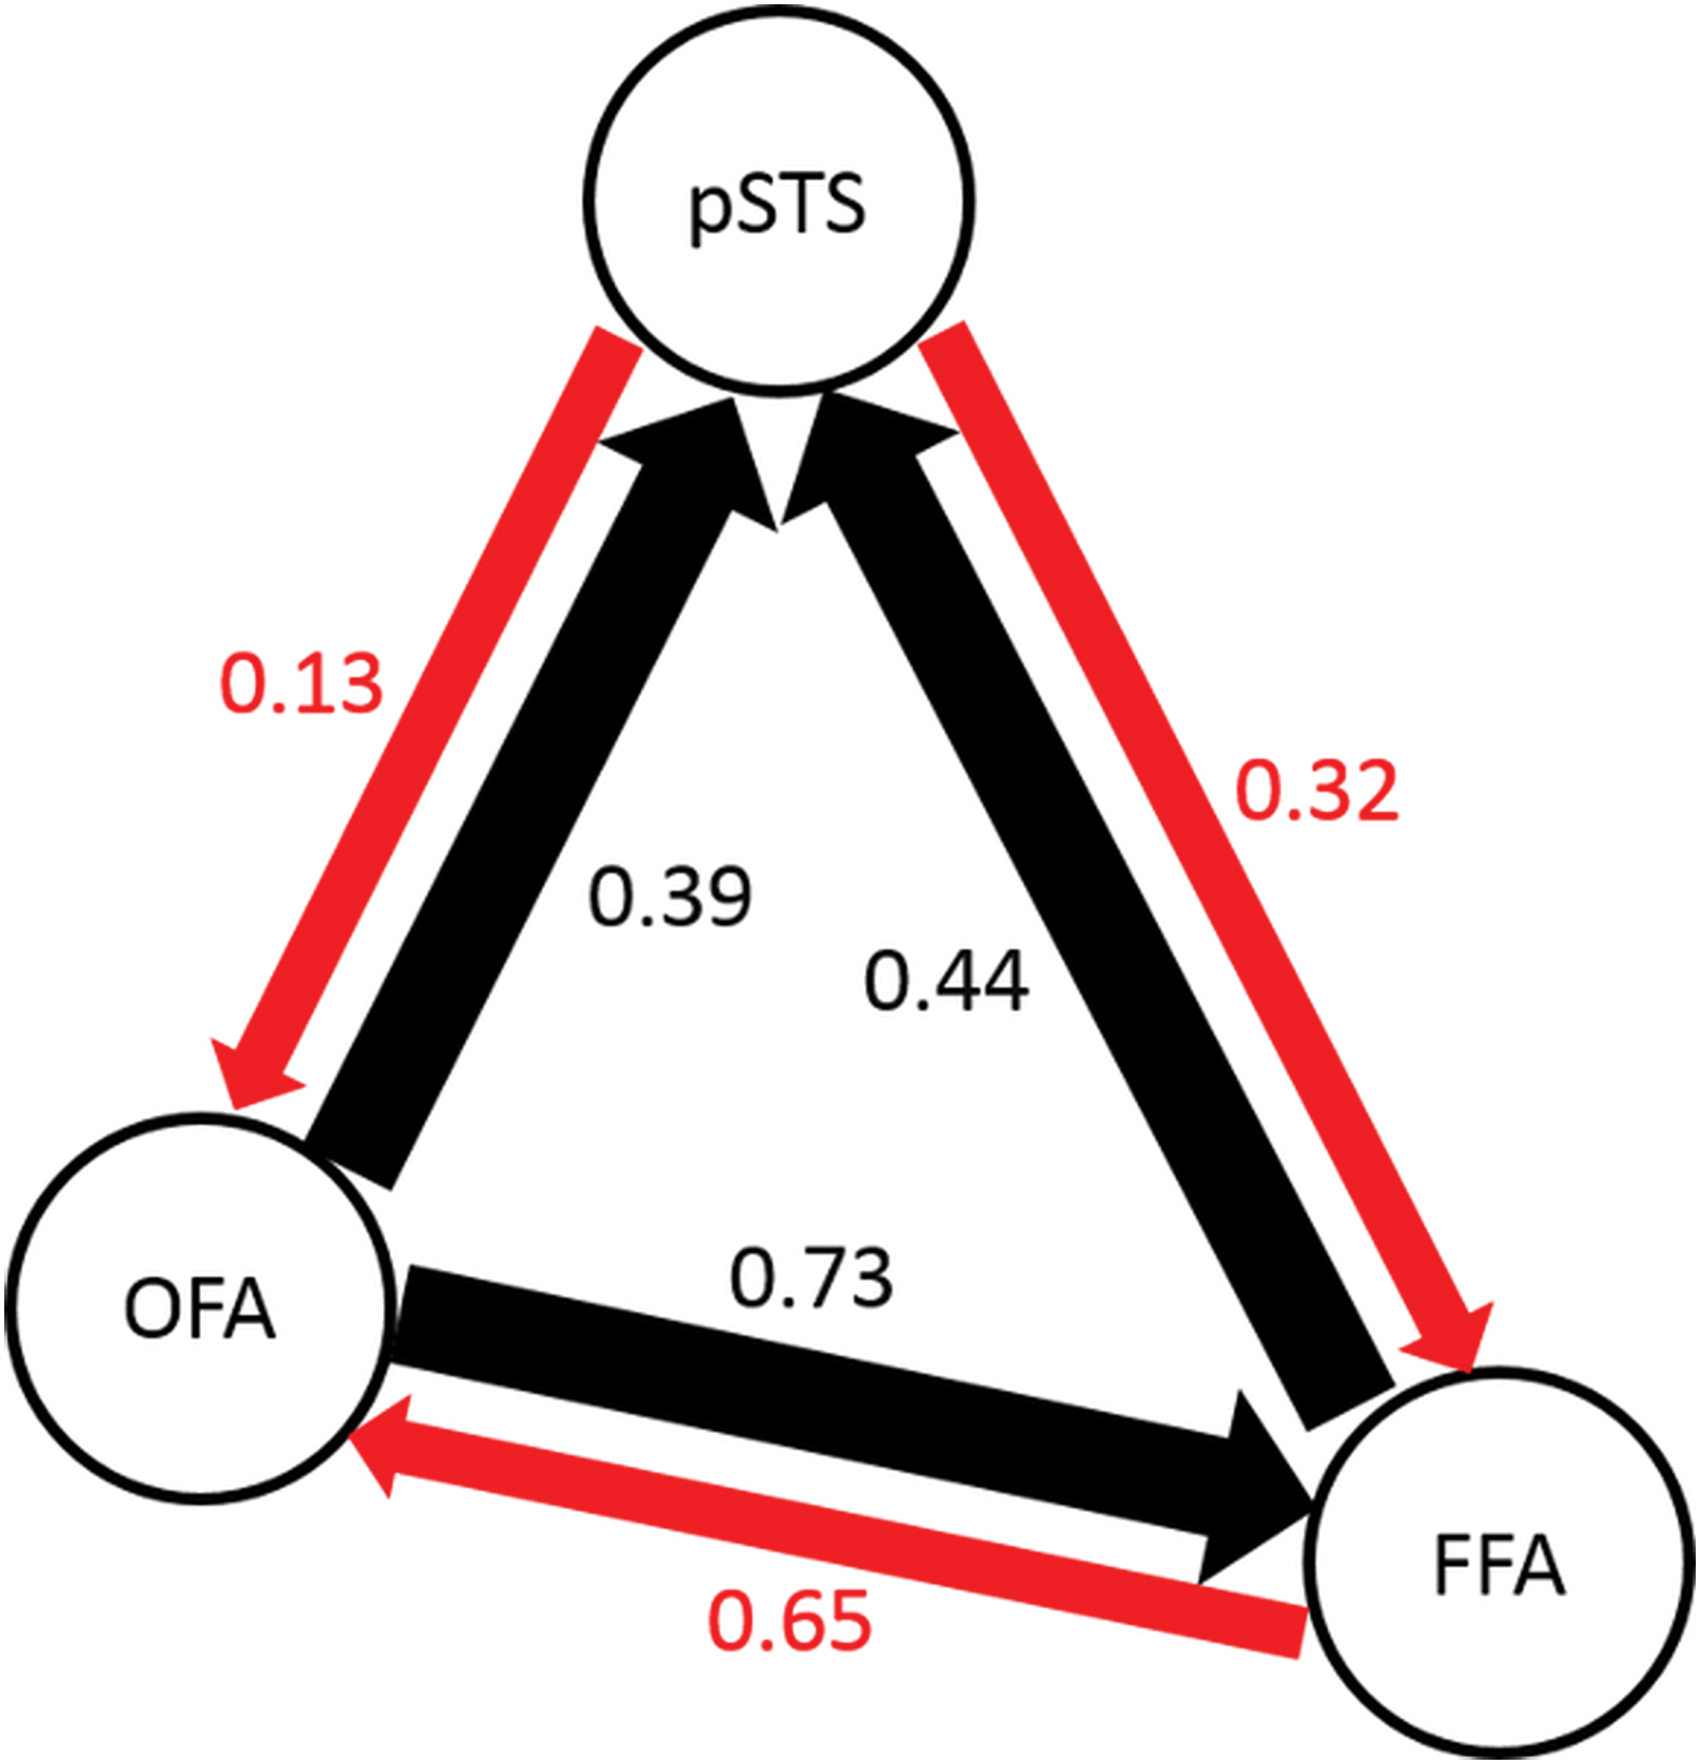
Prediction of the mean activity in one face-selective area from the pattern of activity in other face-selective areas. The values shown in the figure are the amounts of explained variance averaged across subjects. For each pair of face areas, the black arrow represents stronger prediction, and the red arrow represents weaker prediction. Color images are available online.
Finally, to test whether our PLSR method can be applied for another area, the mean activity in EBA was predicted based on the pattern of activity in retinotopic areas and other category-selective areas (Fig. 7). EBA was a relevant area because our stimuli included human actions, which could effectively drive body-selective areas (Downing et al., 2006; Hafri et al., 2017). A two-way ANOVA revealed a significant main effect of laterality [2 levels, F(1,276) = 34.3, p << 0.05], a significant main effect of area [24 levels, F(23,276) = 19.75, p << 0.05], and no significant interaction between laterality and area [F(23,276) = 1.47, p > 0.05]. The explained variance of original models was also compared with the explained variance of control models after correcting for multiple comparisons (48 comparisons). In both ipsilateral and contralateral conditions, the comparison was significant in EBA, FBA, MT, and LO2 (FDR-adjusted p < 0.05, one-tailed t-test). In addition, the comparison was significant in FFA, V3A, and IPS0 in the ipsilateral condition (FDR-adjusted p < 0.05, one-tailed t-test).
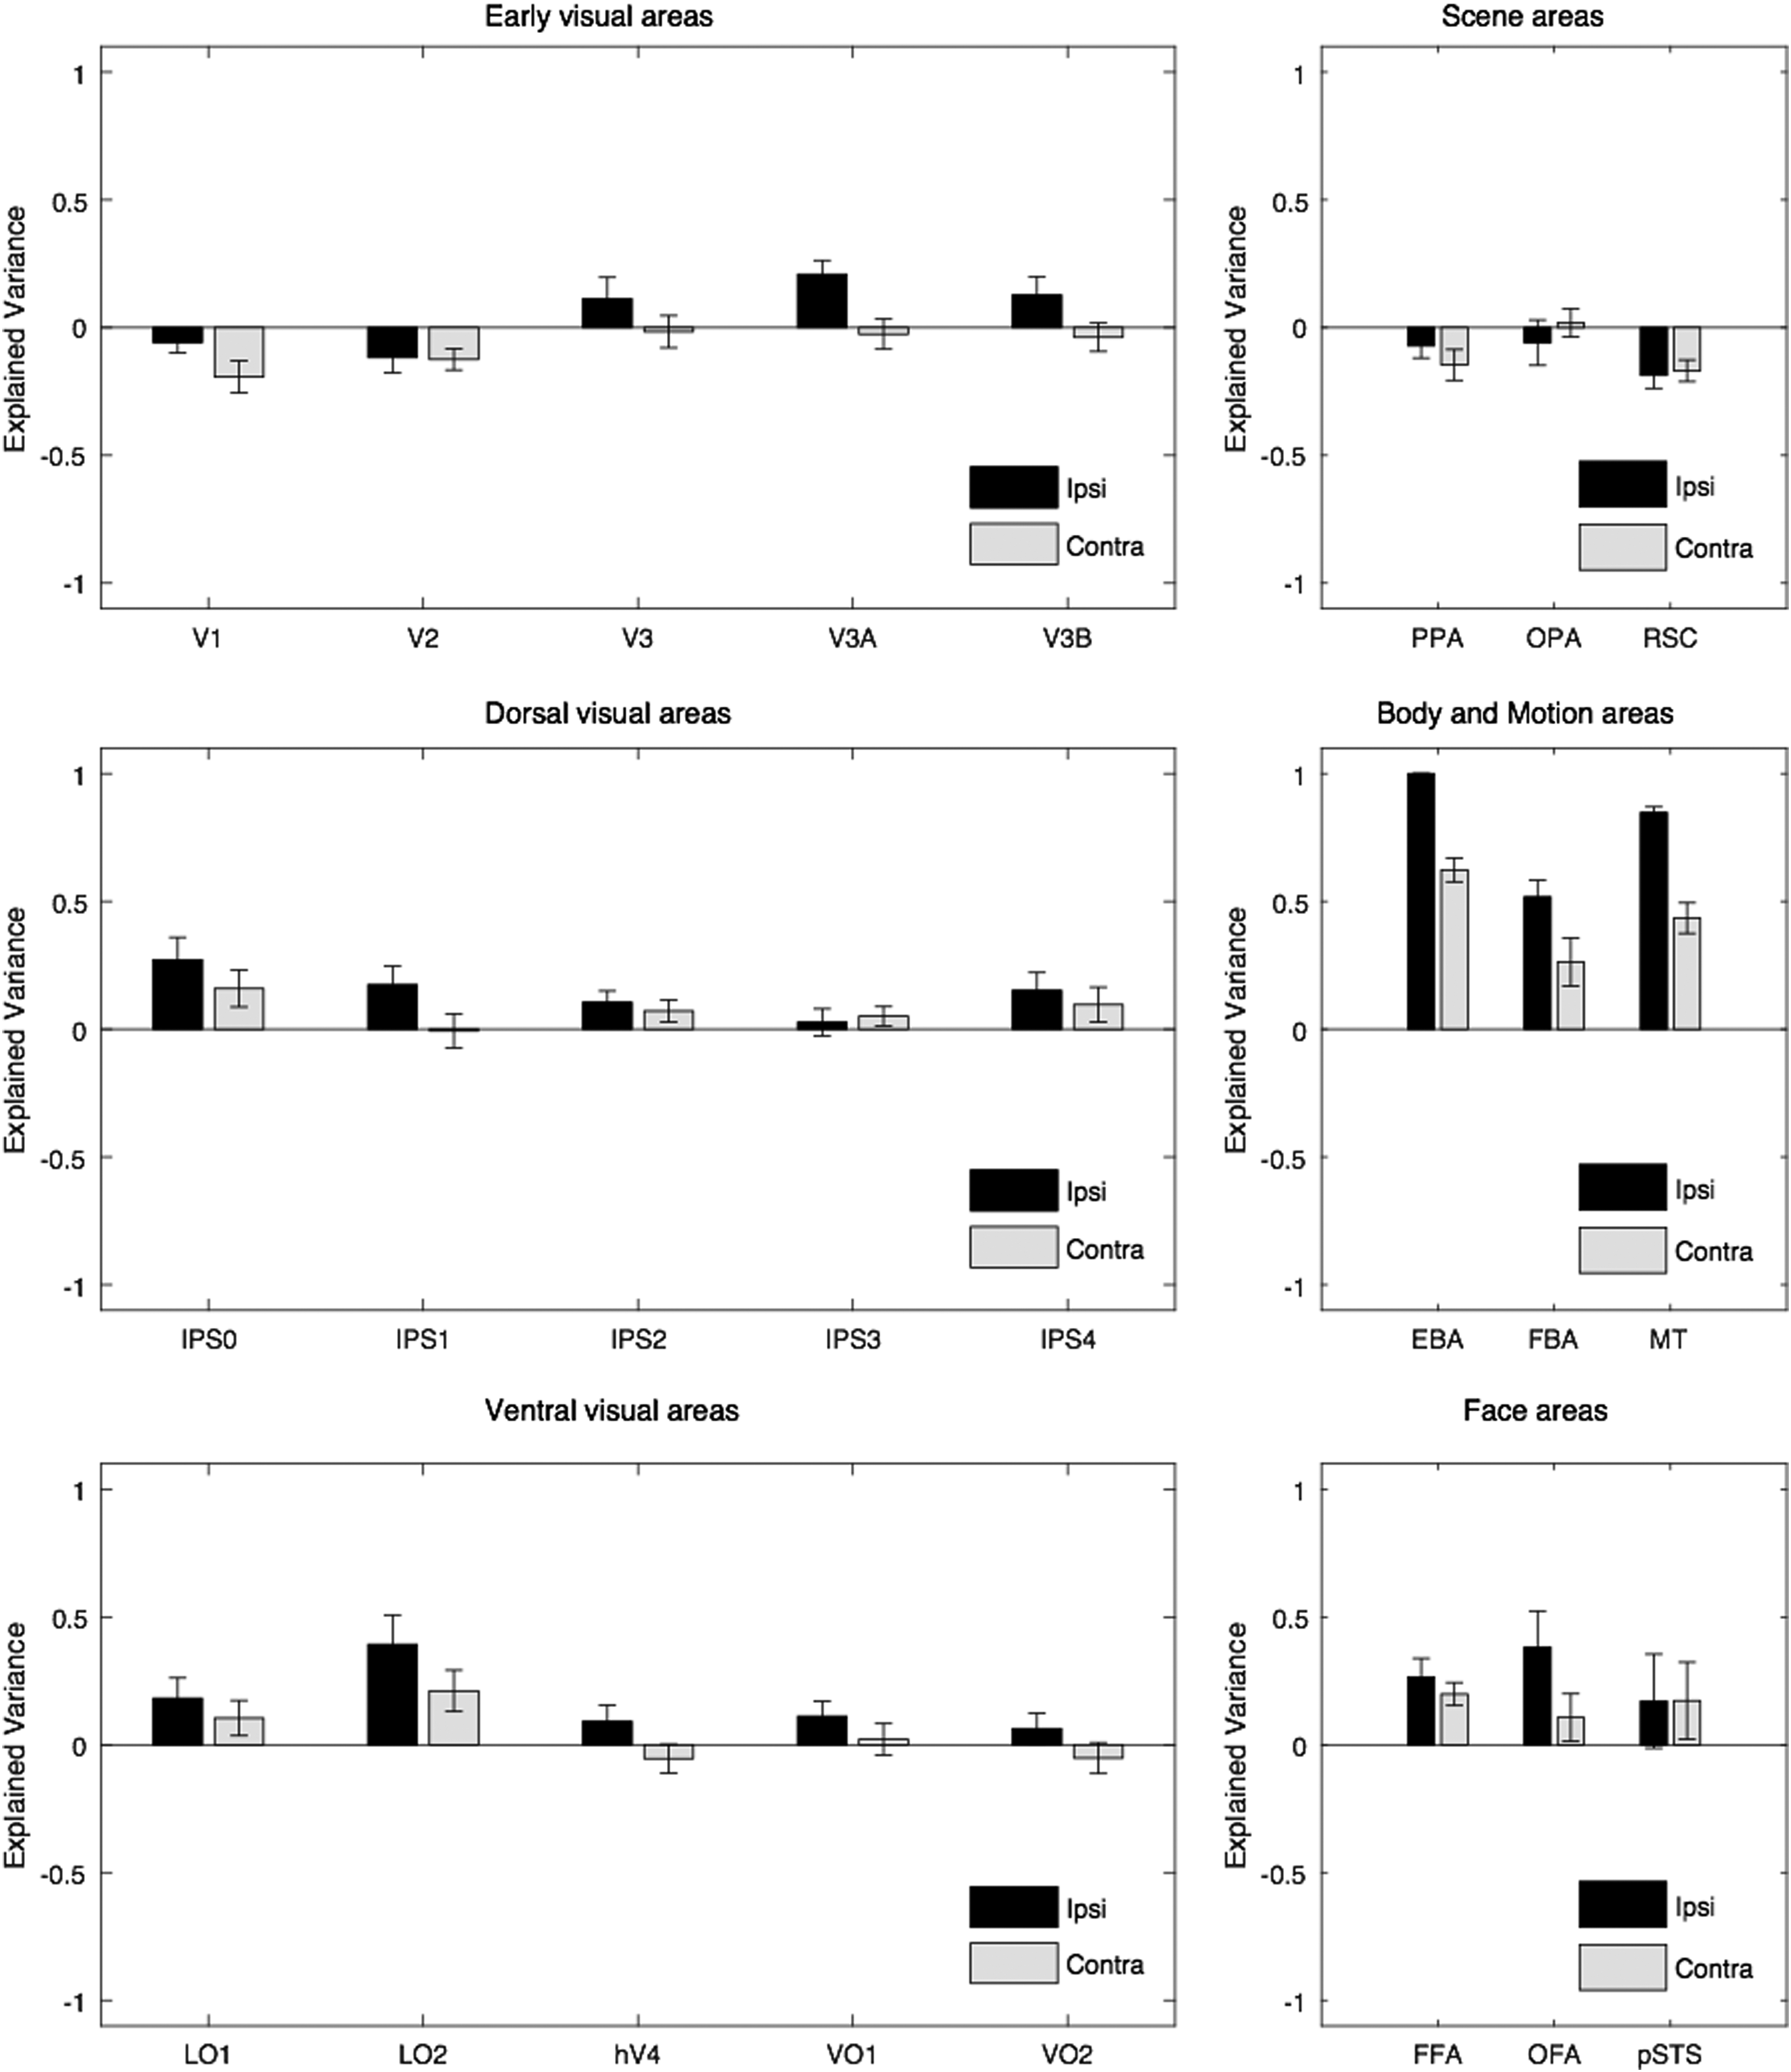
The explained variance of PLSR models in predicting the mean activity in EBA based on the pattern of activity in other areas. Error bars indicate one standard error of mean based on an average across subjects. EBA, extrastriate body area.
Discussion
In this study, we used correlation and multivariate regression analyses to estimate the mean response of FFA to naturalistic stimuli based on the mean and pattern of BOLD activity in retinotopic and functionally defined visual cortical areas. The results of these two sets of analyses were highly correlated (Fig. 5), however, few differences were observed. In particular, the correlation analysis showed higher correlation between mean activity in FFA and mean activity in ipsilateral (compared with contralateral) areas when all areas were included, whereas the regression analysis did not show such laterality effect. It is possible that the pattern of activity in areas contralateral to FFA carries more information than just the mean activity. A “contralateral bias” in FFA has been reported previously (Hemond et al., 2007)—although that report was also based on the measurement of mean activity.
Among areas with significant prediction power, some areas were good predictors just for ipsilateral FFA. These areas tended to be midlevel visual areas (e.g., hV4), which contain retinotopic representation, and have a bias for processing of information in the contralateral visual hemifield (Brewer et al., 2005).
Our results showed that the mean of BOLD activity in FFA can be predicted from the activity in other visual areas. However, the prediction power varied across the areas. In general, there was an increase in the prediction accuracy at the progressively higher tier areas of ventral visual pathway. As one would expect, face-selective areas OFA and pSTS were good predictors of FFA activity. These face areas are anatomically interconnected through white matter (Gschwind et al., 2012). Body-selective areas EBA and FBA were also good predictors of FFA activity. This could be related to the proximity of faces and bodies in the semantic space (Huth et al., 2012). Faces and bodies belong to a common superordinate category of animate stimuli, and these stimuli have a distinct representation in the ventral visual pathway (Kriegeskorte et al., 2008). The cortical proximity of FBA to FFA may also contribute to the good prediction power of FBA; however, the cortical adjacency per se was not a sufficient factor for predicting the FFA activity, as the nearby area PPA did not show a good prediction power.
The motion-selective area MT showed a high accuracy in predicting the FFA activity. This is consistent with a monkey fMRI study reporting that motion could explain a large amount of variance in the response of macaque face-selective patches during natural viewing of dynamic stimuli (Russ and Leopold, 2015). Polosecki et al. (2013) also investigated regional specialization for face motion in macaques and humans. The strong link between MT and FFA provides a mechanism for how specialized regions for face motion are working; face areas receive strong input from MT for processing face motion. Similarly, areas V3/V3A, which contain strong motion selectivity in humans (Tootell et al., 1997), showed a high prediction accuracy. The retinotopic areas in parietal cortex (within intraparietal sulcus) and V1 were not good predictors of FFA activity. The response variation in V1 could be highly correlated with that in FFA when the stimuli are varied along lower level dimensions such as size, position, and contrast (Yue et al., 2011). However, this correlation was revealed to be low when the areas were involved in decoding the semantic content of stimuli.
All non-FFA visual areas could collectively explain up to 75% of the variance in FFA response, not the whole variance. This result shows the vital and specialized role of FFA for detailed analysis of facial information, including configural and invariant processing of faces (Kanwisher, 2010).
In both correlation and regression analyses, there was a graded contribution of visual cortical areas to the activation of FFA. For instance, the activity in some areas was highly correlated with the activity in FFA, and some areas showed less correlation. Part of the correlation was related to common activation patterns and noise correlation in fMRI data. By removing this “nonspecific” correlation (difference correlation values in Fig. 3B), only few areas showed a significantly positive correlation with FFA. Thus, this approach provided an objective criterion in finding areas that were selectively correlated or possibly connected with FFA. Using this approach in the regression analysis (difference explained variance values in Fig. 4B), few more areas showed significant interaction with FFA. This suggests that the regression analysis could have more sensitivity in finding interconnected areas.
Saygin et al. (2012) used diffusion-weighted imaging and probabilistic tractography to predict face selectivity in the right hemisphere's fusiform gyrus based on anatomical connectivity patterns. However, there are important methodological differences between our approach and the approach used by Saygin et al. (2012). In study by Saygin et al, each voxel in the fusiform gyrus was modeled based on its structural connectivity with other cortical regions. Here we modeled the overall response of FFA based on the responses of individual voxels or the overall response in another area. We assumed that fMRI responses to naturalistic stimuli would produce richer interactions among cortical areas. In the present study, the functionally defined areas were localized using retinotopic mapping and category localizers. This is in contrast to Saygin et al. (2012) study, where the cortical regions were derived from large, anatomically defined parcels in the FreeSurfer atlas.
The functional interactions among face-selective areas were analyzed in Figure 6. This analysis suggested that such interactions are strongest between OFA and FFA. Thus, the main flow of information processing for faces happens from the OFA to FFA axis. Using face stimuli and dynamic causal modeling (DCM) on fMRI data, a strong connection between OFA and FFA/pSTS has been observed (Fairhall and Ishai, 2007). The facial information extracted in OFA and FFA could be used by areas in STS for further processing of faces [e.g., for encoding facial expressions (Engell and Haxby, 2007; Said et al., 2010) and facial movements (Polosecki et al., 2013)]. Face-selective responses have also been reported in higher order areas in anterior temporal cortex (Rajimehr et al., 2009), amygdala (Fried et al., 1997; Morris et al., 1996), and prefrontal cortex (Chan and Downing, 2011). In subsequent studies, our PLSR method can be used to investigate the contribution of high-level top/down signals (vs. low-level bottom/up signals) to the activity of face-selective areas.
In the present study, we have proposed a new, multivariate framework for investigating the functional connectivity or “functional links” between visual cortical areas. It should be noted that these links do not necessarily suggest anatomical connections. Compared with the conventional correlation analysis, the multivariate regression analysis has a potential in revealing the hierarchical organization of visual cortex. For areas A and B, if the pattern of activity in area A predicts the activity in area B better than the opposite case, one may infer that area B is causally influenced by area A, and thereby it is located at a higher stage in the visual hierarchy. By systematically analyzing all areas and comparing them, it would then be possible to infer the information flow between areas and build a hierarchical model of visual cortical areas. A similar approach has been applied on magnetoencephalography data using other measures of causality (Michalareas et al., 2016).
Correlation is the simplest measure of functional connectivity and provides evidence regarding potential causal relationships, but it does not determine whether activity in one region has a causal influence on activity in another region. Structural equation modeling (SEM), DCM, and Granger causality (GC) are among the most popular effective connectivity/causal relationship methods, however, there are some pitfalls with their application on fMRI data (Poldrack et al., 2011). SEM and DCM are confirmatory (not exploratory) approaches and require a previously known or hypothesized model. DCM is limited to models with relatively few variation sources. GC on fMRI data is also problematic due to the temporal characteristics of fMRI data. To overcome these limitations, PLSR was used in the present study to investigate brain connectivity. PLSR could better manage large data sets where the number of predictors is greater than the number of observations. Moreover, PLSR could resolve multicollinearity among the predictors, a common problem when using regression models on fMRI data sets (Abdi, 2010; Krishnan et al., 2011).
In future works, our method can be extended for predicting the pattern of activity in one area based on the pattern of activity in another area. The connectivity information obtained with this method could inform brain decoding algorithms. By testing multivariate connectivity in disease populations (e.g., in autistic patients), one could assess whether/how the functional interactions between brain areas are altered in those patients.
Conclusions
The present study seeks to accomplish three goals: (1) to demonstrate the role of lower level visual cortical areas in the activation of FFA, (2) to define the functional relationships between the face processing areas in human temporal and inferotemporal cortex, and (3) to introduce the use of PLSR in the analysis of fMRI data sets.
PLSR already has a significant track record in the analysis of fMRI data, however, our study is the first to apply this methodology to the study of ventral visual pathway and face processing. Using PLSR, it was shown that a significant fraction of explained variance in the mean activity of FFA (averaged activity across all vertices in FFA) can be attributed to the spatial patterns of response in other cortical areas, especially other regions in the face processing system in the temporal lobe. Thus, PLSR can be used to measure the functional link between multiple cortical areas in the visual processing stream and to pose models based on these measures. Overall, the results demonstrate that (1) V1 and other retinotopic cortical areas (such as those within the intraparietal cortex) do not predict FFA activity unless the stimuli are low-level visual features, (2) V4 and MT, both midlevel visual areas, do act as better predictors of FFA activity, (3) body-selective areas and other face-selective areas are much better predictors of FFA activity, but scene-selective areas (such as PPA) are poor predictors.
Footnotes
Acknowledgments
We thank Maryam Vaziri-Pashkam and Mohammad-Reza Abolghasemi-Dehaqani and two anonymous reviewers for helpful comments on the article. This research was supported by the Iranian Institute for Research in Fundamental Sciences (IPM) and Cognitive Science and Technology Council of Iran (CSTC).
Author Disclosure Statement
No competing financial interests exist.