
Abstract
The fractional amplitude of low-frequency fluctuations (fALFFs) of the BOLD signal have been successfully applied as exploratory tools in neuroimaging. This metric has been useful in mapping brain functional changes in many clinical populations. However, little is known about the neurophysiological correlates of fALFF. This study aimed at demonstrating that fALFF is related to local network centrality during childhood and adolescence. The establishment of this relationship is fundamental to provide a more meaningful explanation to previous clinical and neurodevelopmental studies based on fALFF. Our findings show a correlation of ∼0.5 between these two metrics at a group level, which is a finding replicated in four large independent samples. However, when considering the across-subject and intra-subject correlations between the two metrics, the correlation is much lower, probably due to the low signal-to-noise ratio. Moreover, we found that regions with high fALFF and degree centrality overlapped modestly, particularly the posterior cingulate/precuneus and lateral parietal cortices.
Introduction
Spontaneous low-frequency fluctuations of the blood oxygenation level dependent (BOLD) signal have been reliably verified in resting-state functional magnetic resonance imaging (rs-fMRI) (Fox and Raichle, 2007; Fransson, 2005; Zuo et al., 2010). The fractional amplitude of low-frequency fluctuations (fALFFs) (Zou et al., 2008) is one of the most common metrics used to quantify these oscillations. These fluctuations are increased in particular brain regions, especially in the default mode network (DMN) nodes (Biswal et al., 1995; Zou et al., 2008; Zuo et al., 2010). Such fluctuations are temporally correlated across certain functional networks in a highly consistent and replicable way (Buckner et al., 2009; He et al., 2009; Shehzad et al., 2009; Zuo et al., 2010), allowing functional connectivity and large-scale network analyses based on rs-fMRI data (Fox and Raichle, 2007; Smith et al., 2009; Van Den Heuvel and Pol, 2010). Low-frequency BOLD fluctuations probably convey information about physiologically and behaviorally relevant neural oscillatory activity, though this is not yet fully established (Cordes et al., 2001; Wang et al., 2015). This is supported by the findings of significant connection between different measurements based on these fluctuations and diverse cognitive states and pathological conditions, via association with specific gene expression (Wang et al., 2015). However, the potential correlation between specific features of low-frequency fluctuation phenomena and distinct neural activity remains unknown.
Over the past years, these compelling findings have inspired the use of rs-fMRI data as an investigation tool in neuroimaging (Biswal et al., 2010). The exploratory approach that aims at comprehensively characterizing the set of functional connections of the human brain was accordingly called “functional connectome” (Biswal et al., 2010; Van Dijk et al., 2010). Although the most appropriate way to conceptualize and measure the functional connectome remains debatable, diverse analytic approaches have been put forward in recent years. In this context, graph theory-derived metrics (e.g., degree centrality) (Bullmore and Sporns, 2009) have particularly attracted interest as suitable tools to investigate the connectome.
In fact, an increasing number of studies have used spontaneous low-frequency fluctuations and graph metrics analyses in diverse exploratory settings, especially in the search for biomarkers of neuropsychiatric conditions (Han et al., 2011; Meda et al., 2015; Sato et al., 2016; Wang et al., 2016; Xu et al., 2014, 2015; Yu et al., 2014; Zhong et al., 2016). According to Bullmore and Sporns (2009), complex networks can be advantageously modeled by sets of nodes and vertices, that is, by a graph. The degree centrality of a given node is determined by the number and strength of connections (or vertices) established with all the other nodes in the graph. Therefore, this measure is believed to indicate the relevance of each node for the information flow in the global network. In turn, Zou et al. (2008) originally proposed a measure of fALFF, which is defined by the power within the range 0.01 and 0.1 Hz, normalized by the total power in the detectable frequency range. Relevant to neurodevelopmental studies, fALFF was found to be relatively robust against head motion artifacts (Yan et al., 2013). It is important to note, from the previous definitions, that the two network analysis approaches have potentially complementary characteristics. fALFF is potentially a proxy for local spontaneous neural activity and is accessed in a voxel-wise manner; whereas degree centrality indicates the relationship between the local activity and the global network dynamics, since it integrates information about all the connections to the region, including local and long-range connections.
A few studies have shown the association between degree centrality and the fALFF. Di et al. (2013) reported positive correlation between the networks' strength of connectivity and the ALFF in a group of elderly individuals. Interestingly, multimodal rs-positron emission tomography (PET)/fMRI studies have investigated the association between glucose uptake and rs-fMRI metrics in adults and aging populations (Aiello et al., 2015; Bernier et al., 2017; Nugent et al., 2015). Particularly, Aiello et al. (2015) have demonstrated that, at the group level, the top-degree centrality regions overlapped with top fALFF ones. However, more importantly, fALFF was more correlated with glucose uptake across the regions than degree centrality, and a high correlation was also found between fALFF and glucose uptake in the DMN. These results reinforce the hypothesis that degree centrality and fALFF may convey partially independent and complementary information about the underlying neural processes. What is not yet known is whether these two metrics, which reflect potentially distinct neural processes, are also correlated during childhood.
This study aimed at exploring the correlation between fALFF and degree centrality during childhood. We analyzed the rs-fMRI data of 340 participants. The data were obtained from four independent samples from a developing country, allowing replication analysis and also contributing to research progress at a global level. Finally, the brain areas with high fALFF and degree centrality were mapped. We expected a spatial overlap between high fALFF and degree centrality in the regions of the DMN, based on the results previously reported.
Materials and Methods
Participants
The participants of this study were 340 typically developing children and adolescents who were a part of the “High Risk Cohort Study for Psychiatric Disorders in Childhood” (HRC, N = 2512 participants) (further information in Salum et al., 2015). They were recruited from public schools in 2 Brazilian cities: 139 participants were scanned in São Paulo (site 1), and 201 participants were scanned in Porto Alegre (site 2). To investigate possible influence of age on the correlation between fALFF and degree centrality, these two samples were then subdivided into two (younger and older children) based on median age (10.8 years old), resulting in four independent samples. Table 1 presents the demographical information.
Demographic Information of This Sample
IQ, intelligence quotient; SD, standard deviation.
Participants included in this study displayed low levels of head motion (see explanation in Images Preprocessing section), and none of them fulfilled any criteria for psychiatric diagnoses according to the Development and Well-Being Assessment (DAWBA) (Goodman et al., 2000). The intelligence quotient was estimated by using the vocabulary and block design subtests of the Weschler Intelligence Scale for Children and the Tellegen and Briggs method (Tellegen and Briggs, 1967). The local ethics committee approved the study protocol, and all parents (or legal guardians) provided written consent for the study (and verbal assent was obtained from the children).
Images acquisition
The fMRI data were acquired by using two 1.5 Tesla Signa MR systems (G.E.), HDX and HD (site 1 and 2, respectively), with the same acquisition parameters. The fMRI sequence was based on 180 echo-planar imaging (EPI) scans (repetition time [TR] = 2000 msec; echo time [TE] = 30 msec; slice thickness = 4 mm; gap = 0.5 mm; flip angle = 80°; matrix size = 80 × 80; reconstruction matrix = 128 × 128, 1.875 × 1.875 mm; number of excitations (NEX) = 1; 26 axial slices; 6 min of acquisition). The protocol was a resting-state scan with eyes open and a fixation point. For spatial normalization purpose, high-resolution T1 images (three-dimensional fast spoiled gradient recalled echo sequence) were also acquired (TR = 10.91 msec; TE = in phase 4.2 msec; thickness = 1.2 mm; flip angle = 15°; matrix size = 256 × 192; field of view = 24.0 × 18.0 cm; and NEX = 1, up to 160 axial slices for whole-brain coverage).
Images preprocessing
The imaging data preprocessing was done by using the fMRI toolboxes of AFNI (version 2011_12_21_1014) (Cox, 2012) and FSL (version 5.0) (Jenkinson et al., 2012). The following steps were carried out: discarding four initial volumes of EPI; skull stripping; realignment for head motion; despiking; band-pass filtering (0.01 and 0.1 Hz; in fALFF analysis this step was not applied) and detrending; spatial smoothing (Gaussian Kernel, 8 mm full width at half maximum); linear registration to the anatomical scan; structural image non-linear registration to MNI152 template; non-linear registration of EPI volumes based on the same warping parameters; and finally, regression out of cerebrospinal fluid, white matter, global signal, and six linear motion parameters from each voxel signal (in fALFF analysis this step was not applied).
Current literature on fMRI developmental studies has revealed that head motion can cause a strong bias in functional connectivity estimation (Power et al., 2012). Thus, only subjects with mean frame-wise displacement (FD) [Eq. (9) of Yan et al., 2013] below 0.15 mm were included in this study.
Data analysis
The data analysis of functional connectivity and fALFF pipelines performed in each subject is depicted in Figure 1A. The regions-of-interest (ROIs) were defined by using the 333 cortical parcels from Gordon et al. (2014).
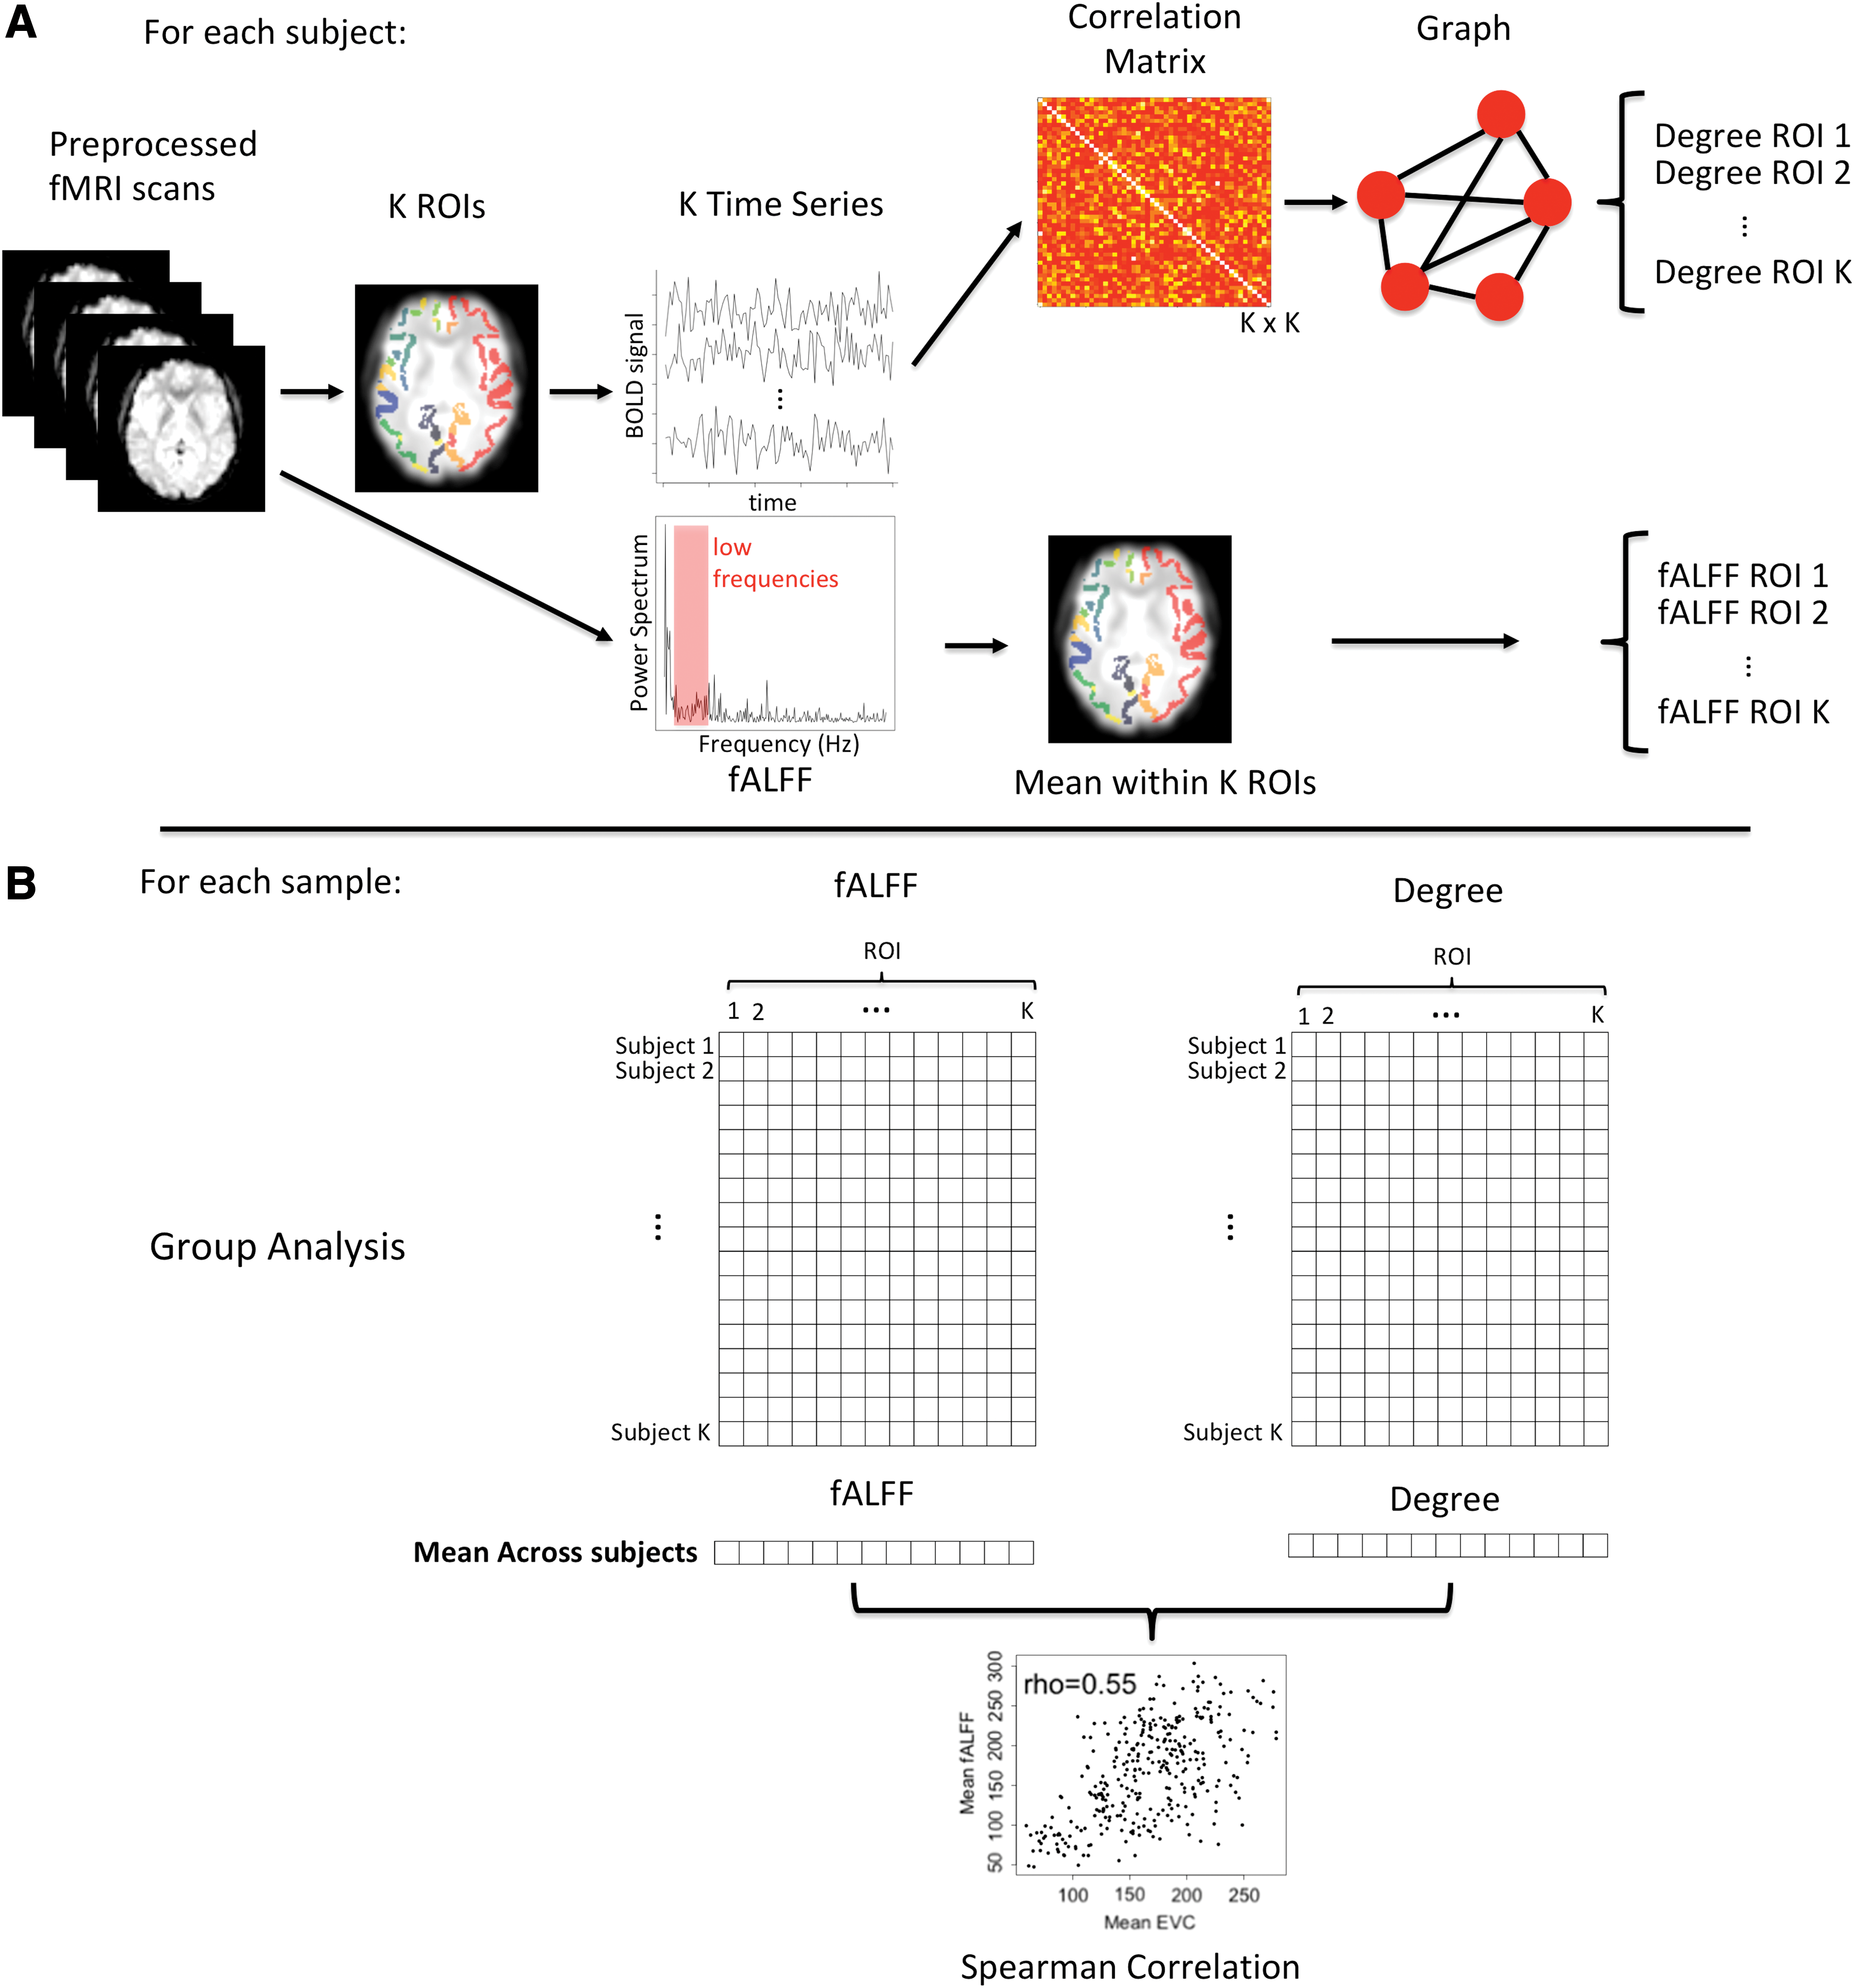
After preprocessing, fALFF (Zou et al., 2008) voxel-wise measures at the frequency band (0.01–0.1 Hz) were extracted and averaged (mean) within each ROI. The pairwise functional connectivity strength among the ROIs was estimated by using Spearman's correlation coefficient (robust against outliers) between the preprocessed BOLD signals at each ROI (mean signal across voxels). The pairwise correlations were organized as a 333 × 333 graph adjacency matrix, in which the correlation was considered the strength of each edge. We calculated the degree centrality of each ROI as the sum of the absolute values of the respective edges' strengths.
Subsequently (Fig. 1B), for each of the four samples (site 1 and 2, younger and older children), the mean (across subjects) fALFF and degree centrality of each ROI was calculated. These mean arrays (of dimension 333 cells) were then used to build scatter-plots and calculate Spearman's correlation (across ROIs) between mean fALFF and mean degree centrality at each sample. Finally, to evaluate the overlap of the two measures, we constructed the brain maps depicting the top 10% mean rank of fALFF and degree centrality for each sample. We used the rank values instead of the absolute values to maintain the coherence with previous Spearman's correlation analyses.
Regarding the fALFF and degree centrality correlation at individual level, complementary analyses were carried out. For each subject, we calculated the Spearman's correlation coefficient between fALFF and degree centrality (across regions). Finally, we built histograms (across subjects) of the correlation for each of the four samples.
Results
Complementary to the demographical information presented in Table 1, Figure 2 depicts the histograms for age (years) and head motion (frame-displacement) for each of the four samples. Spearman's correlation coefficients (R) and scatter-plots between mean degree centrality and mean fALFF (across ROIs) are shown in Figure 3, highlighting the spatial correlation between the two metrics. Note that the moderate correlation (between 0.49 and 0.55) in these two measures was reproduced in all the four samples, regardless of the age group (younger and older participants).
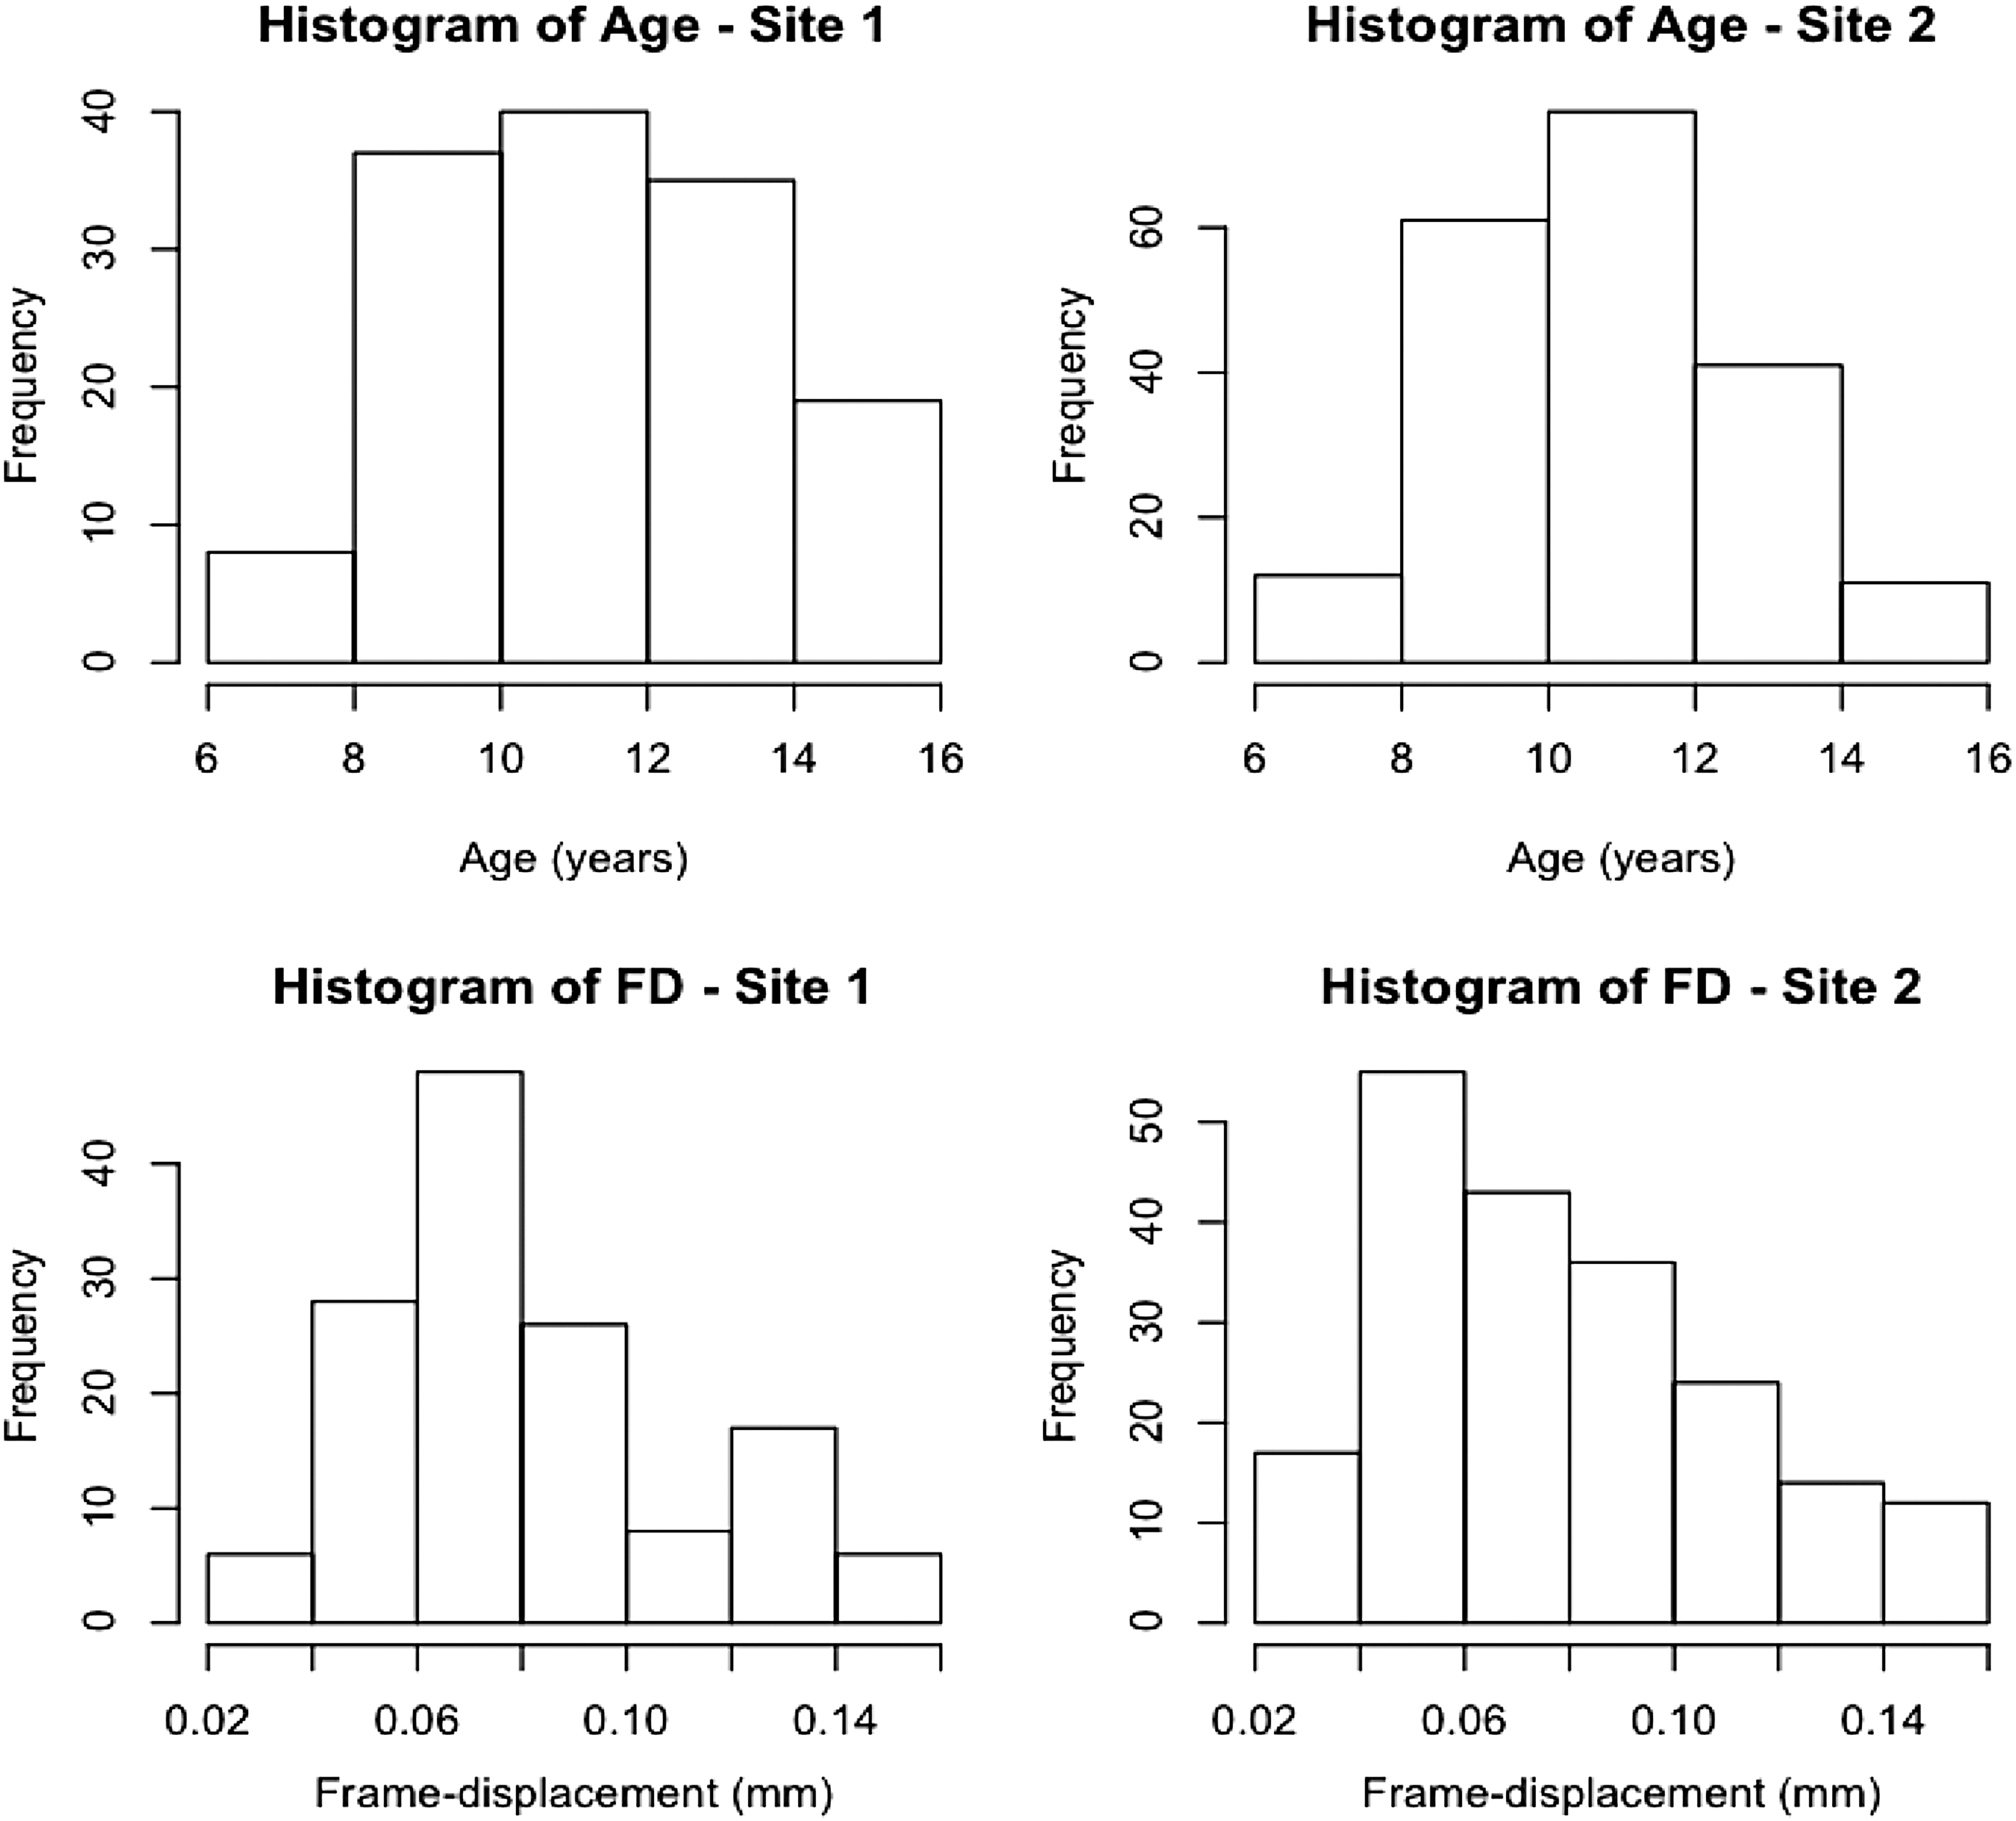
Histograms of age and head motion (frame-displacement) at each site of acquisition.

Scatter-plots of mean degree centrality (across subjects) and mean fALFF for each sample. Each point represents one ROI from the total of 333. This figure depicts the spatial correlation (i.e., across ROIs) between the two metrics. fALFF, fractional amplitude of low-frequency fluctuation; ROI, region-of-interest.
We present the brain mapping of main network hubs and regions with the top fALFF in Figure 4. Figure 4 highlights the top 10% ROIs with a greater mean rank of fALFF and degree centrality at each site of acquisition (considering both age groups). There were many overlapping regions, mainly at precuneus, posterior cingulate, and lateral parietal cortices.

Top 10% ROIs with greater mean fALFF rank (red) and mean degree centrality rank (green) at each of the four samples. The overlap between the two measures is depicted in yellow. Color images are available online.
Finally, to describe the individual variations, Figure 5 presents histograms of Spearman's correlation coefficient (across ROIs) between fALFF and degree centrality calculated within each subject. Although mostly above zero, individual correlations are considerably smaller than those obtained at the group level. This finding is expected because averaging across subjects reduces the variability and increases the estimation accuracy of fALFF and centrality measures. As a consequence, the correlation across subjects is low.

Histograms of the individual correlation (across ROIs) between fALFF rank and degree centrality rank at each sample (site 1 and 2, younger and older children).
Discussion
In this study based on typically developing children and adolescents, we investigated whether spontaneous cortical activity variability measured by fALFF is associated with functional connectivity estimated by using the degree centrality. In four independent developmental samples, we found a moderate correlation (r > 0.49) between the rank of fALFF (across ROIs) and the respective rank of degree centrality. Our findings not only reproduced the correlation between mean fALFF and mean degree centrality across ROIs but also suggested that this association is similar between young and older children. Further, the top 10% regions with greater fALFF and degree centrality coincided with regions of the DMN.
Previous studies have demonstrated possible overlaps between findings from fALFF and functional connectivity analyses (Aiello et al., 2015; Di et al., 2013), although systematical investigations exploring their association remain scarce. First, our study highlights a replicable moderate correlation (r > 0.49) between the rank of fALFF (across ROIs) and the respective rank of degree centrality across two different sites of imaging acquisition. Further, we also reproduced the results in two different age groups when major neurobiological changes occur. It is important to remember that the pioneering study on this topic (Di et al., 2013) was focused on a healthy elderly sample. Here, we have extended the study to a developmental sample and our findings point in the same direction. In addition, as children-based samples tend to be more prone to movement issues, we attempted to be very restrictive to the impact of head motion, employing a mean FD <0.15 mm as an inclusion criterion (as shown in Fig. 2).
Second, we confirm a modest spatial overlap between regions with the highest fALFF and degree centrality. The top 10% cortical regions with the greatest fALFF and the top 10% with the highest degree centrality (depicted in yellow in Fig. 4) are mainly related to the posterior cingulate, precuneus (in both sites), and lateral parietal cortex (only in site 1). These regions are a part of the DMN, one of the most replicated and consistent resting-state network (Buckner and Vincent, 2007). Notwithstanding, this relationship in the top 10% regions (Fig. 3) suggests a linear association between fALFF and degree centrality, which is also present in the regions with low and intermediate ranks.
Although we found that fALFF is correlated to functional connectivity, the neurobiological mechanisms linking the local fALFF and degree centrality remain unknown. This study cannot provide information on this issue. An interesting hypothesis to explain this correlation is that the hub regions involved in many subsystems are expected to present a greater variability in spontaneous activation. Recent studies have suggested associations between BOLD oscillations and the ones observed in EEG at low frequencies (He et al., 2008). In addition, electrophysiological experimentation has explored the link between neural oscillations and interactions among distinct brain subsystems (Buzsáki and Draguhn, 2004). Even so, we cannot rule out the possibility of an artefactual correlation induced by other physiological signals such as cardiac or vascular systems in the BOLD signal (Shmueli et al., 2007). However, Zuo et al. (2010) have demonstrated that regional rank ordering of fALFF is, indeed, preserved during breath-holding, which disrupts vascular dynamics.
Although there are significant similarities between the metrics, we would also like to highlight some divergence between fALFF and degree centrality, shown in Figure 4. For example, the relevance of the frontal cortex is better highlighted by degree centrality, whereas the occipital cortex is more clearly depicted by fALFF. This might be due to intrinsic differences of both measures or due to biological underpinnings related to these regions. The implication of these differences is unknown and should be further explored in future studies.
Our results provide a new standpoint on the interpretation of several results previously reported based on fALFF. This perspective is particularly useful for the fALFF findings in clinical investigations (i.e., when comparing patients with controls), since many brain disorders are now considered connectome disorders (Di Martino et al., 2014; Satterthwaite and Baker, 2015). Finally, frequency domain approaches (such as fALFF) are less prone to movement artifacts (Yan et al., 2013) than functional connectivity estimation, which is a challenge when studying clinical samples that present higher levels of head motion (e.g., attention deficit/hyperactivity disorder and Parkinson's disease), particularly children's samples.
In addition, it is important to mention that one of the main novelties of this study is that the samples are from a developing country, when most of the studies in the literature are from North American or European populations. This is of particular relevance considering neuroimaging from a global health perspective. In this context, the utilization of 1.5 Tesla scanners is a demonstration of this point because in developing countries, only a few 3 Tesla scanners are available.
There are a few limitations in this study. First, we emphasize that the intra-subject correlations are considerably lower than the group averages, which is expected due to the high noise in fALFF and functional connectivity estimation (perhaps because 1.5-Tesla MR systems have lower SNR compared with systems with higher main field strength). As a consequence, the correlation across subjects is also low. Thus, caution is necessary when interpreting results involving single-subject inferences.
Second, the impact of structural and vascular alterations on fALFF is unknown. Thus, interpretation in clinical populations must be carried out taking into consideration the effect of these confounders. Although fALFFs has been reported to be more robust against physiological noise than ALFF (Zuo et al., 2010), peripheral measures such as respiratory/cardiac rhythms and oxygen saturation were not available for the subjects of this study. Indeed, this is a limitation of this study, and it indicates that further investigation with simultaneous acquisition of peripheral physiological features should be conducted (Birn et al., 2008, 2014). On the other hand, corrections using peripheral measures are also prone to some difficulties (Birn et al., 2009; Murphy et al., 2009).
In conclusion, despite the inherent limitations of this study, we found evidence that low-frequency fluctuations of spontaneous cortical activity are associated with the functional connectivity with other regions, particularly in the DMN. Further, this finding was reproduced in four independent developmental samples. Further studies to explore the neurobiological significance of these correlations are warranted.
Footnotes
Acknowledgments
The opinions, hypotheses, conclusions, and recommendations of this study are those of the authors and do not necessarily represent the opinions of the funding agencies. The authors are grateful to FAPESP (grants 2018/21934-5 and 2018/04654-9 to J.R.S. and grants FAPESP 2016/04983-7 and 2013/08531-5 to A.P.J.) and the National Institute of Developmental Psychiatry for Children and Adolescents, (INPD) (grant FAPESP 2014/50917-0; CNPq 465550/2014-2).
Author Disclosure Statement
No competing financial interests exist.