
Abstract
Methylphenidate (MPH) is the leading drug for treatment of attention deficit/hyperactivity disorder (ADHD), yet its underlying neuronal mechanisms are still unclear. Here, we use a dynamical brain networks approach to explore the effects of cognitive effort and MPH on ADHD subjects. Electroencephalography data were recorded from 19 ADHD subjects and 18 controls during a Go/No-Go Task. ADHD subjects completed the task twice a day over 2 days. The second session was administered post-ingestion of placebo/MPH (alternately). Controls performed two tasks in 1 day. The data were divided into 300 ms windows from −300 pre-stimulus until 1200 ms post-stimulus. Brain networks were constructed per subject and window, from which network metrics were extracted and compared across the experimental conditions. We identified an immediate shift of global connectivity and of network segregation after the stimulus for both groups, followed by a gradual return to baseline. Decreased global connectivity was found to be 400–700 ms post-stimulus in ADHD compared with controls, and it was normalized post-MPH. An increase of the networks' segregation occurred post-placebo at 100–400 and 400–700 ms post-stimulus, yet it was inhibited post-MPH. These global alterations resulted mainly from changes in task-relevant frontal and parietal regions. The networks of medicated ADHD subjects and controls exhibited a more significant and lasting change, relative to baseline, compared with those of nonmedicated ADHD. These results suggest impaired network flexibility in ADHD, corrected by MPH.
Introduction
Attention deficit/hyperactivity disorder (ADHD) is a developmental psychiatric disorder that is characterized by difficulties maintaining attention and/or hyperactivity and impulsivity (Wilens et al., 2002). The prevalence of ADHD is estimated at 10% among children and adolescents (Davidovitch et al., 2017), yet the underlying neuronal mechanisms of the disorder are not fully understood. Methylphenidate (MPH) is a stimulant drug that intervenes in dopamine uptake and is the standard treatment approach for ADHD. Studies indicate increased performance in various cognitive tasks (Aron et al., 2003) and enhancement of frontal cortex activation under MPH compared with placebo (Rubia et al., 2014). Although MPH is considered an effective stimulant (Faraone and Buitelaar, 2010), the mechanisms underlying its efficacy remain unclear. Given the high prevalence and broad effects of ADHD on young people, a better understanding of the causes and treatment of the disorder is an important goal in neuroscience research.
In the past, research regarding the neurobiological mechanisms of ADHD mainly focused on local brain abnormalities compared with healthy controls (Krain and Castellanos, 2006; Qiu et al., 2009). More recently, widespread disruptions in functional and structural connectivity of fronto-striatal, fronto-parieto-temporal, fronto-cerebellar, and fronto-limbic regions were described and research has shifted its focus to the potential dysfunction of brain network organization (Castellanos and Proal, 2012; Cubillo et al., 2012; De La Fuente et al., 2013; Konrad and Eickhoff, 2010). Based on this view, studies found dysfunctional connectivity in ADHD during resting-state activity (Castellanos et al., 2008; Fair et al., 2010) and during the performance of cognitive tasks (Rubia et al., 2010, 2012; Wolf et al., 2009). Therefore, ADHD is nowadays believed to be associated not only to regional abnormalities but also to aberrations in large-scale brain systems.
A common method to examine widespread structural alterations is the network analysis approach, in which the brain is represented as a graph with nodes and edges. The nodes of the graph are usually determined based on the constraints of the neuroimaging technique, and the edges are often determined by some form of correlation between the nodes' time courses (Cao et al., 2014; Reijneveld et al., 2007). Constructing such graphs from neuroimaging data allows to simplify the brain's complex network and to expand our outlook from a local to a global perspective. The network structure can be estimated by several network measurements, which include, for example, the nodal strength (NS; defined per node as the sum of its edges' weights, and relates to the level of network connectivity) and the clustering coefficient (defined as the likelihood that two neighbors of the same node in the network are also connected, and relates to the level of network segregation). Other metrics include the path length (the minimal number of edges connecting between two nodes), global efficiency (defined as the average inverse path length, and relates to the level of network integration), and local efficiency (defined per node as the global efficiency in the sub-graph that includes only this node's neighbors) (Bullmore and Sporns, 2012).
Since the topological organization of networks is essential to their overall function (Vidal et al., 2011), differences in the networks' topological features can be used to draw insights regarding different “brain states.” Consequently, research on aberrant brain connectivity using the network approach has become a promising course of study in the field of psychopathology (Bassett and Bullmore, 2009), and studies have reported altered brain networks in neurological disorders such as Schizophrenia, Alzheimer's, and Autism (Fornito et al., 2012; Murias et al., 2007b; Sanz-Arigita et al., 2010). In addition, altered network dynamics were found after various perturbations (He et al., 2012; Joyce et al., 2013; Naim-Feil et al., 2018).
In this article, network analysis is applied to investigate network organization in ADHD, and to examine the effects of the disorder and of MPH treatment on the balance between network segregation and integration. Previous network studies on ADHD revealed aberrations in graph metrics in both resting-state and task conditions across a range of neuroimaging techniques. For example, resting-state electroencephalography (EEG) studies have provided evidence of anomalies such as smaller mean shortest path and higher clustering coefficient in ADHD subjects compared with controls (Ahmadlou et al., 2012). Resting-state functional magnetic resonance imaging (fMRI) studies found that relative to controls, ADHD participants exhibited increased local efficiencies combined with decreased global efficiencies (Wang et al., 2009). Other fMRI evidence suggested increased directed connections into the right striatum/pallidum (Di Martino et al., 2013) and altered connections between the frontal amygdala-occipital and the frontal temporal-occipital sub-networks (Cocchi et al., 2012).
In addition, functional network connectivity studies have explored task-related abnormalities in ADHD (Cao et al., 2014). These include an EEG study that involved the “Multi-Source Interference” task and found increased local characteristics combined with decreased global characteristics in ADHD compared with controls (Liu et al., 2015), and an fMRI study involving a continuous performance task (CPT), which found reduced local efficiency in ADHD (Xia et al., 2014). However, none have examined in detail the time course of the graph metrics immediately after the stimulus.
Overall, the majority of network studies in ADHD report increased local features and decreased global features compared with controls. These findings encourage further investigation of the effects of MPH treatment on the network, especially during the performance of cognitive tasks, which initiate time-dependent collaboration of widespread brain regions (Erika-Florence et al., 2014). However, very few of the previous studies have examined the effects of MPH on network metrics, and even fewer compared these effects with placebo. For example, Rubia and colleagues (2009) showed that under placebo, subjects with ADHD had reduced functional connectivity during the CPT, which was normalized after MPH intake. Another study by Peterson and colleagues (2009) showed that MPH improved the suppression of default-mode activity in youths with ADHD during a Stroop task.
Taken together, these previous findings call for a better understanding of abnormalities in task-related network metrics and their dynamics in ADHD, and the way MPH affects them. To this aim, we employ a double-blind placebo-controlled cross-over design to quantify the ADHD network response to a Go/No-Go task (Robertson et al., 1997) and examine the effects of MPH on this response. Our comprehensive experimental design enables us not only to identify dynamic network anomalies associated with ADHD during the performance of a cognitive task but also to probe how MPH can alter these patterns of dynamic network response compared with placebo. In addition, our setup enables us to compare between nontreatment sessions of ADHD subjects and controls, and to examine the normalizing effect of MPH compared with the pre-treatment session.
Methods
Subjects
Twenty children diagnosed with ADHD (according to DSM-5 criteria) (American Psychiatric Association, 2013) between the ages of 9 and 18, and 20 age- and gender-matched controls were originally recruited for the study. All ADHD participants were diagnosed with at least a moderate severity of ADHD symptoms (Clinical Global Impression–Severity score ≥4). Due to technical problems in the EEG recordings, the final ADHD group included 19 participants (10 males; mean age = 12.1; SD = 2.5; age range = 9–17), and the control group included 18 participants (10 males; mean age = 12.2; SD = 2.8; age range = 9–17). The study was approved by the Institutional Review Board at Sheba Hospital and conducted according to the Helsinki declaration. The participants' parents signed an informed consent and were reimbursed for travel and loss of time. For details see the Supplementary Data.
Procedure
The ADHD group was assessed by the Hebrew version of the Schedule for Affective Disorders and Schizophrenia for School-aged Children, Present and Lifetime (Kaufman et al., 1997), and their parents and teachers filled the Dupaul ADHD rating scale (DuPaul, 1991). Both study groups (ADHD and controls) completed a general demographic questionnaire and a standardized intelligence test based on Raven's Progressive Matrices scale (Raven, 2000). To account for mood effects on cognitive performance, both study groups also completed the PANAS (Positive Affect Negative Affect Scale) (Watson et al., 1988) after each testing session. Demographic and clinical information can be found in Table 1.
Demographic and Clinical Information for Subjects with Attention Deficit/Hyperactivity Disorder and Healthy Control Subjects
ADHD, attention deficit/hyperactivity disorder; CGI, Clinical Global Index; N/A, not applicable; SD, standard deviation.
Each testing session included a 5-min eyes-open baseline EEG recording, followed by continuous EEG recordings during the performance of the Sustained Attention to Response Task (SART), the N-Back task, and the Stroop Color and Word task. Here, we report on the SART task results only. In the SART, single digits (“1” to “9”) appeared in a mixed and randomized order on a white background. The subjects were asked to press a designated button whenever a digit appeared on the screen (Go condition), except for the digit “3,” for which they were asked to refrain from pressing (No-Go condition) (Robertson et al., 1997). Every session consisted of two hundred ninety-seven 150 ms trials (264 Go and 33 No-Go), each followed by an inter-stimulus interval of 1.5, 2, or 2.5 sec (Naim-Feil et al., 2018).
The ADHD group performed four experimental sessions over two test days in a double-blind placebo-controlled cross-over design (Epstein et al., 2011a). On the first day, the subjects completed the first session and then received either MPH immediate release (10 subjects) or placebo (9 subjects) in a randomized manner. After an hour break, during which the EEG cap remained on their heads, the subjects performed the second session. On the second day (1 week later), the subjects performed the third and fourth sessions in a similar manner, with the alternative treatment to day 1. The control group performed only two testing sessions on the same day in a similar manner, but without any treatment (Fig. 1).
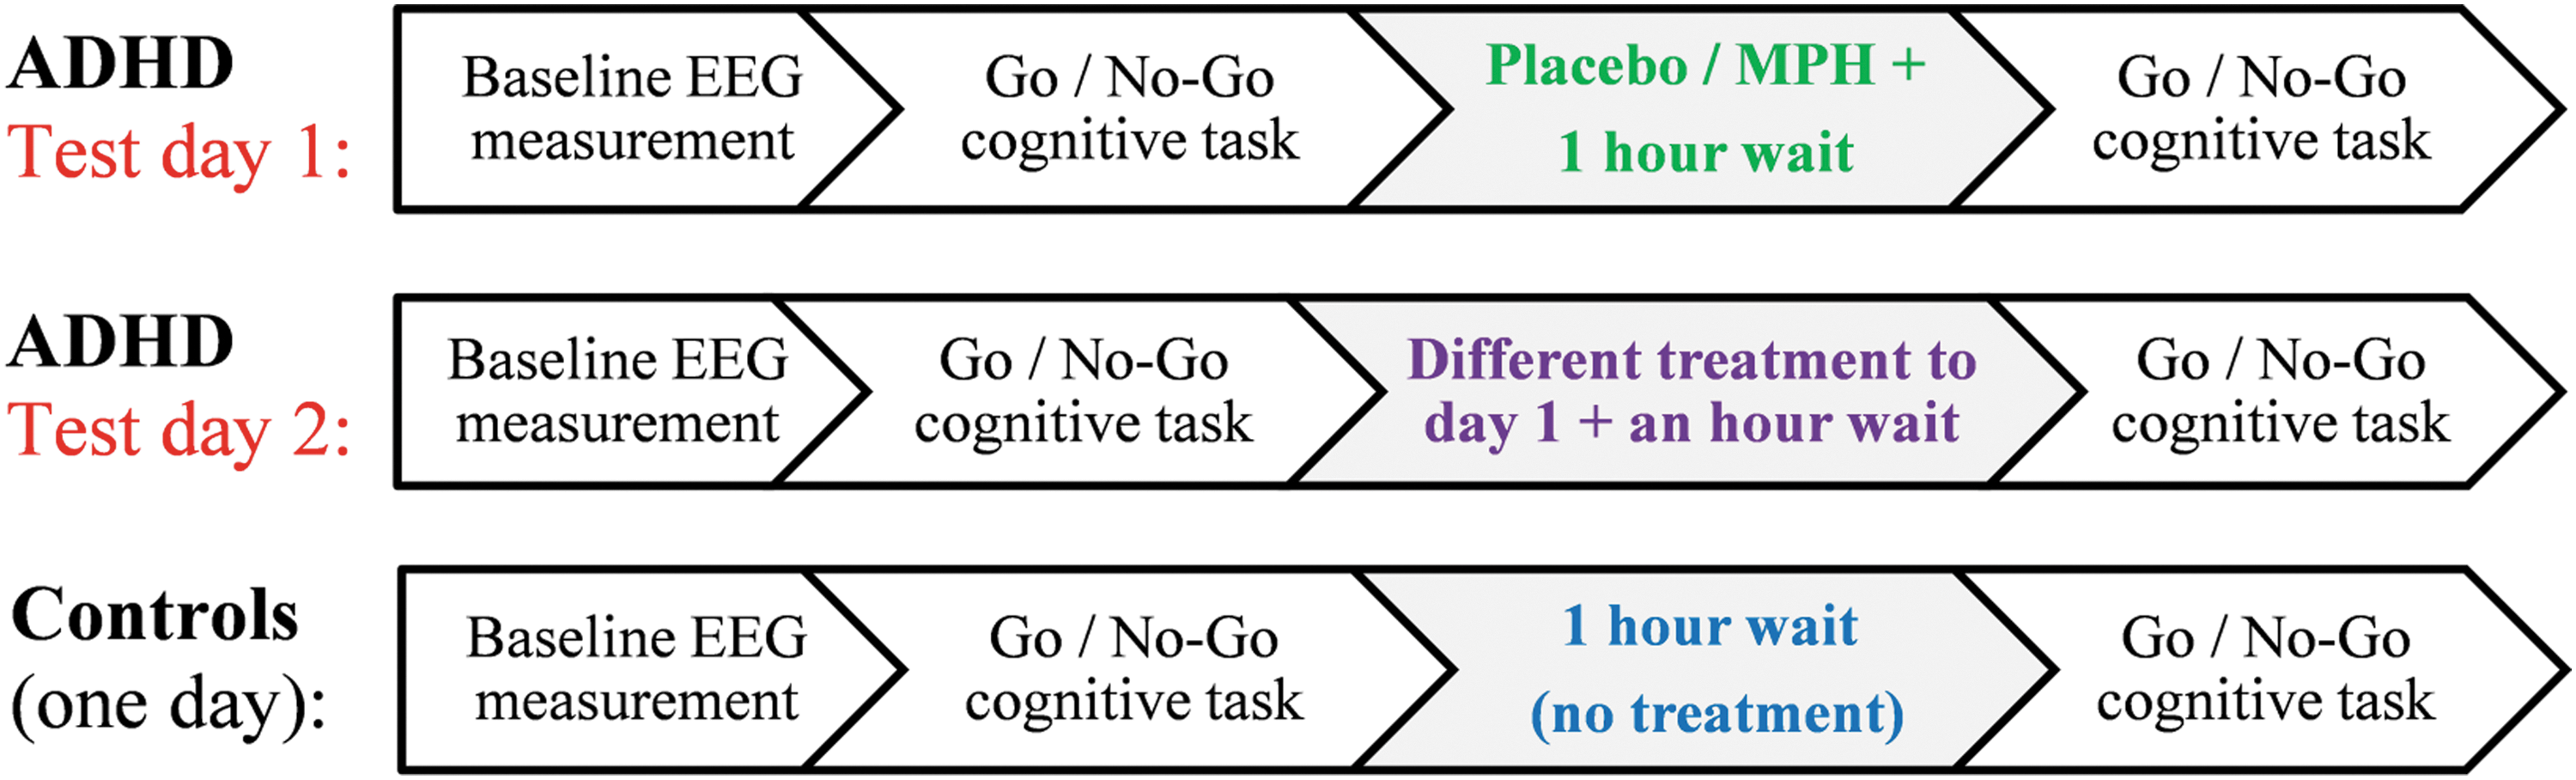
Scheme of the experimental procedure for the ADHD and control groups: In the ADHD group, participants who were randomly assigned to receive MPH on the first day received placebo on the second day, and vice versa. ADHD, attention deficit/hyperactivity disorder; MPH, methylphenidate.
EEG recordings
EEGs were recorded from 64 Ag-AgCl active electrodes (10/20 international system) by using a BioSemi head-cap (BioSemi, Amsterdam, The Netherlands). The data were sampled at 1024 Hz and filtered offline by using a linear finite impulse response bandpass filter (1–80 Hz) and a notch-filter of 50 Hz.
The SART trials were segmented into epochs from −1000 to 2000 ms around the Go/No-Go stimulus, and they were normalized by removing the average of the trial from −350 to 0 ms. The data were re-referenced by subtracting the average of all electrodes (Bertrand et al., 1985). The two dominant components obtained by independent component analysis (Delorme and Makeig, 2004) were removed to account for eye-blinks and lateral eye movements. Only the correct Go trials (ADHD: 97.25% of Go trials; controls: 98.03% of Go trials) were included in the analysis.
The trials were averaged per electrode into mean response waveforms (MRW). The MRW were divided into four post-stimulus time windows at 100–400, 400–700, 700–1000, and 1000–1300 ms, and one baseline pre-stimulus window at −300 to 0 ms. The statistical analysis detailed next was performed for the four nonoverlapping post-stimulus time windows. To portray the dynamic response with better resolution, the Supplementary Data (Supplementary Figs. S1–S5) shows the MRW divided into 26 sliding time windows of 300 ms. These windows ranged from −300 to 1200 ms post-stimulus and had a large overlap of 250 ms between two consecutive windows (except for the first two windows, which had no overlap between them).
Connectivity matrices and network metrics
Generation of the graphs using the EEG traces of each window was done by using the method previously developed: 139 nodes were defined by using a “Gradient Montage” and a connection between two nodes was defined based on the maximal absolute cross-correlation between their EEG signals. For details see Rubinson and colleagues (2017), the Supplementary Data and Figure 2. The resulting graphs are binary and directed. A deviation from the cited protocol is that the edges' weights were taken into account for the strength measurement. To make the networks comparable, the threshold on the correlations matrices is chosen such that all graphs have a fixed mean degree (van Wijk et al., 2010). Different values of mean degree were examined, ranging from <k> = 10 to <k> = 50 in increments of 5.
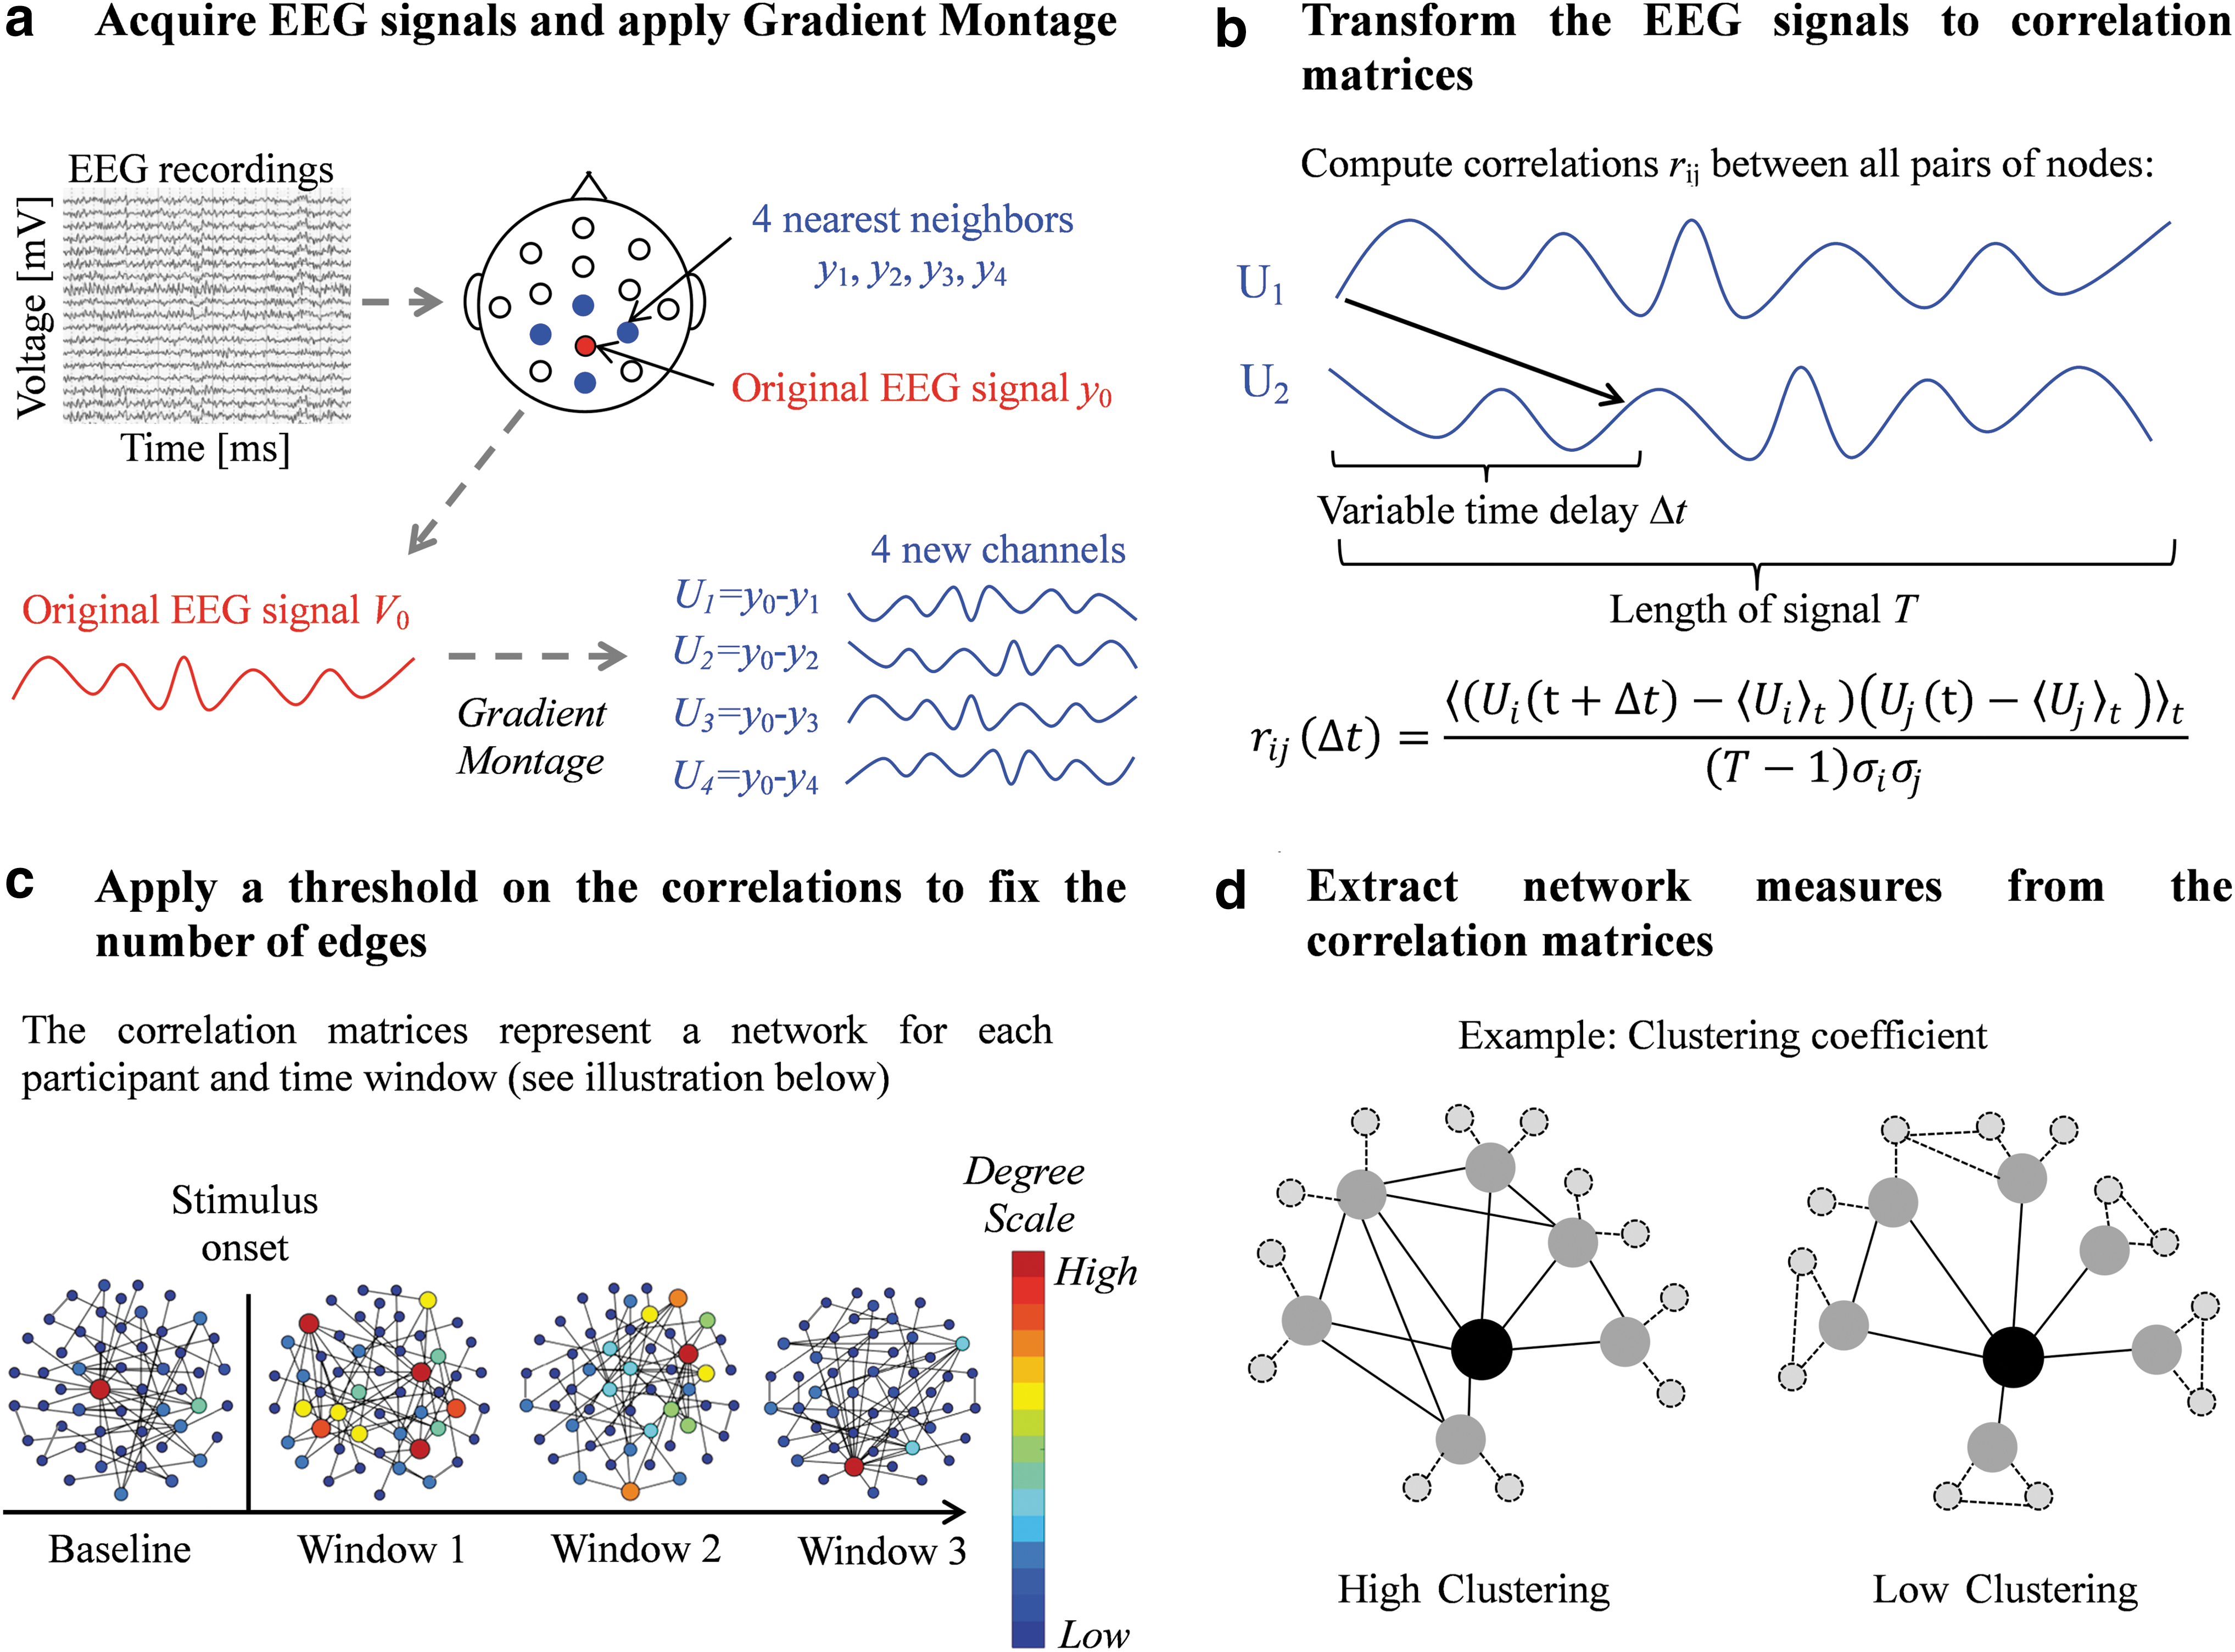
Network analysis pipeline.
For each EEG graph, we calculated a range of network metrics (including the strength, clustering coefficients, local and global efficiency, and small-worldness (Bullmore and Sporns, 2012). Here, we detail only the measurements for which results were obtained (the other measurements are detailed in the Supplementary Data):
Strength
The NS of a node is defined as the sum of all its edges' weights. In our analysis, the weight of an edge represents the cross-correlation between the activity of the two nodes that this edge connects, calculated as described in Rubinson and colleagues (2017). The mean nodal strength (MNS) of a network is the average of NS over all nodes. The mean local strength (MLS) is the average of NS for a sub-network that includes a pre-defined subset of the nodes.
Clustering coefficient
The nodal clustering coefficient (NCC) Ci
is defined for node Vi
as the number of actual edges between its nearest neighbors as a proportion of the maximal possible edges:
Statistical analysis
For the ADHD group, we defined the following nomenclature: If the EEG session preceded or followed the treatment, it was labeled “pre” or “post”; if the treatment was placebo or MPH, it was labeled “PLB” or “MPH”; and if the session took place on the first or second day, it was labeled “1” or “2.” Discarding the day label and grouping the data such that they reflect only the existence and type of treatment yields the labels “prePLB,” “preMPH,” “postPLB,” and “postMPH” and allows for within-subjects comparisons between the treatments, as well as examining the effect of each treatment compared with its preceding session. Disregarding the treatment type and examining only the sessions that preceded the treatment yields the labels “pre1” and “pre2,” and allows us to examine between-days variability and learning effects.
For the control group, we labeled their first session as “H1” and their second session as “H2.” A within-controls comparison was performed by examining H1 versus H2. Differences between the ADHD and controls were tested by comparing pre1 with H1. Finally, to examine within-day effects, we labeled the difference between same-day sessions as “ΔPLB” (postPLB minus prePLB) and “ΔMPH” (postMPH minus preMPH) for the ADHD group, and “ΔH” (H2 minus H1) for the control group.
The statistical analysis was performed in Matlab (The MathWorks, Inc., Natick, MA) for the MNS and MCC. For each window and graph measure, the distribution across subjects was first tested for normality by the Jarque-Bera normality test (Bera and Jarque, 1980). If the assumption of normality was rejected, we used the nonparametric Wilcoxon rank-sum test to compare between unpaired samples, and the Wilcoxon signed-rank test to compare between paired samples (Wilcoxon et al., 1970). In this case, the p-value is reported along with the z-value. If the assumption of normality was not rejected, we used a two-sample two-tailed t-test to compare between unpaired samples, and a pairwise t-test to compare between paired samples. In this case, the p-value is reported along with the t-statistic value. The results of the Jarque-Bera test for all data distributions can be found in the Supplementary Data (Supplementary Table S1).
A within-subject comparison in the ADHD group was conducted for the postPLB and postMPH conditions (2 conditions × 19 subjects) with the relevant paired-samples test for each window. Similarly, a within-subject comparison was conducted between the ΔPLB and ΔMPH conditions. We considered as possible covariates the ADHD sub-types, previous usage of MPH, age, and the label of the test day. We found no interaction of these covariates with the effect of the treatment.
In addition, a within-subject comparison in the control group was conducted [2 conditions (H1 and H2) × 18 subjects] with the relevant paired-samples test for each window.
Finally, a between-group comparison of the ADHD and control groups was calculated by comparing pre1 (19 ADHD subjects) with H1 (18 controls) with the relevant unpaired-samples test in each window.
MRW: Mean Response Waveform
NS: Nodal Strength
MNS: Mean Nodal Strength
MLS: Mean Local strength
NCC: Nodal Clustering Coefficient
MCC: Mean Clustering Coefficient
• pre1: The first session of test day 1
• pre2: The first session of test day 2
• prePLB: The session preceding placebo treatment
• preMPH: The session preceding MPH treatment
• postPLB: The session following placebo treatment
• postMPH: The session following MPH treatment
• ΔPLB: postPLB minus prePLB
• ΔMPH: postMPH minus preMPH
• H1: First session
• H2: Second session
• ΔH: H1 minus H2
The statistical significance level α for all analyses was set at p ≤ 0.05. As we test four time windows in each of the mentioned analyses, we need to account for multiple comparisons. Therefore, a Benjamini-Hochberg false discovery rate (FDR) procedure (Benjamini and Hochberg, 1995) was performed for the p-values of the four windows. One window that did not pass the FDR test in any of the comparisons detailed earlier was discarded from further analysis, and a second FDR test was performed for the remaining windows.
Results
Behavioral results
The ADHD subjects made significantly less commission errors postMPH compared with preMPH (p = 0.005), whereas no such difference was found for the postPLB condition. In addition, they made significantly more omission errors postPLB compared with prePLB (p = 0.01), but not for postMPH compared with preMPH. The standard deviation of the response time (RTSD) was similar for the prePLB and preMPH conditions, significantly increased (p < 0.01) in the postPLB condition (compared with prePLB and to postMPH), and significantly decreased (p < 0.01) in the postMPH condition (compared with preMPH and postPLB).
No differences were found between H1 and H2. Performance results are detailed in Table 2.
Behavioral Results in the Go/No-Go Task
Every entry shows the average over subjects followed by the variance in parentheses. H1 and H2 stand for the first and second sessions of the controls, respectively. prePLB and preMPH stand for the sessions that preceded the placebo and MPH treatments of the ADHD group, respectively. postPLB and postMPH stand for the sessions that followed the placebo and MPH treatments of the ADHD group, respectively. <RT> stands for the average response time, RTSD stands for standard deviation of the response time, and SD stands for standard variation. The response time data relate only to the Go condition.
MPH, methylphenidate.
Network dynamics following the Go stimulus
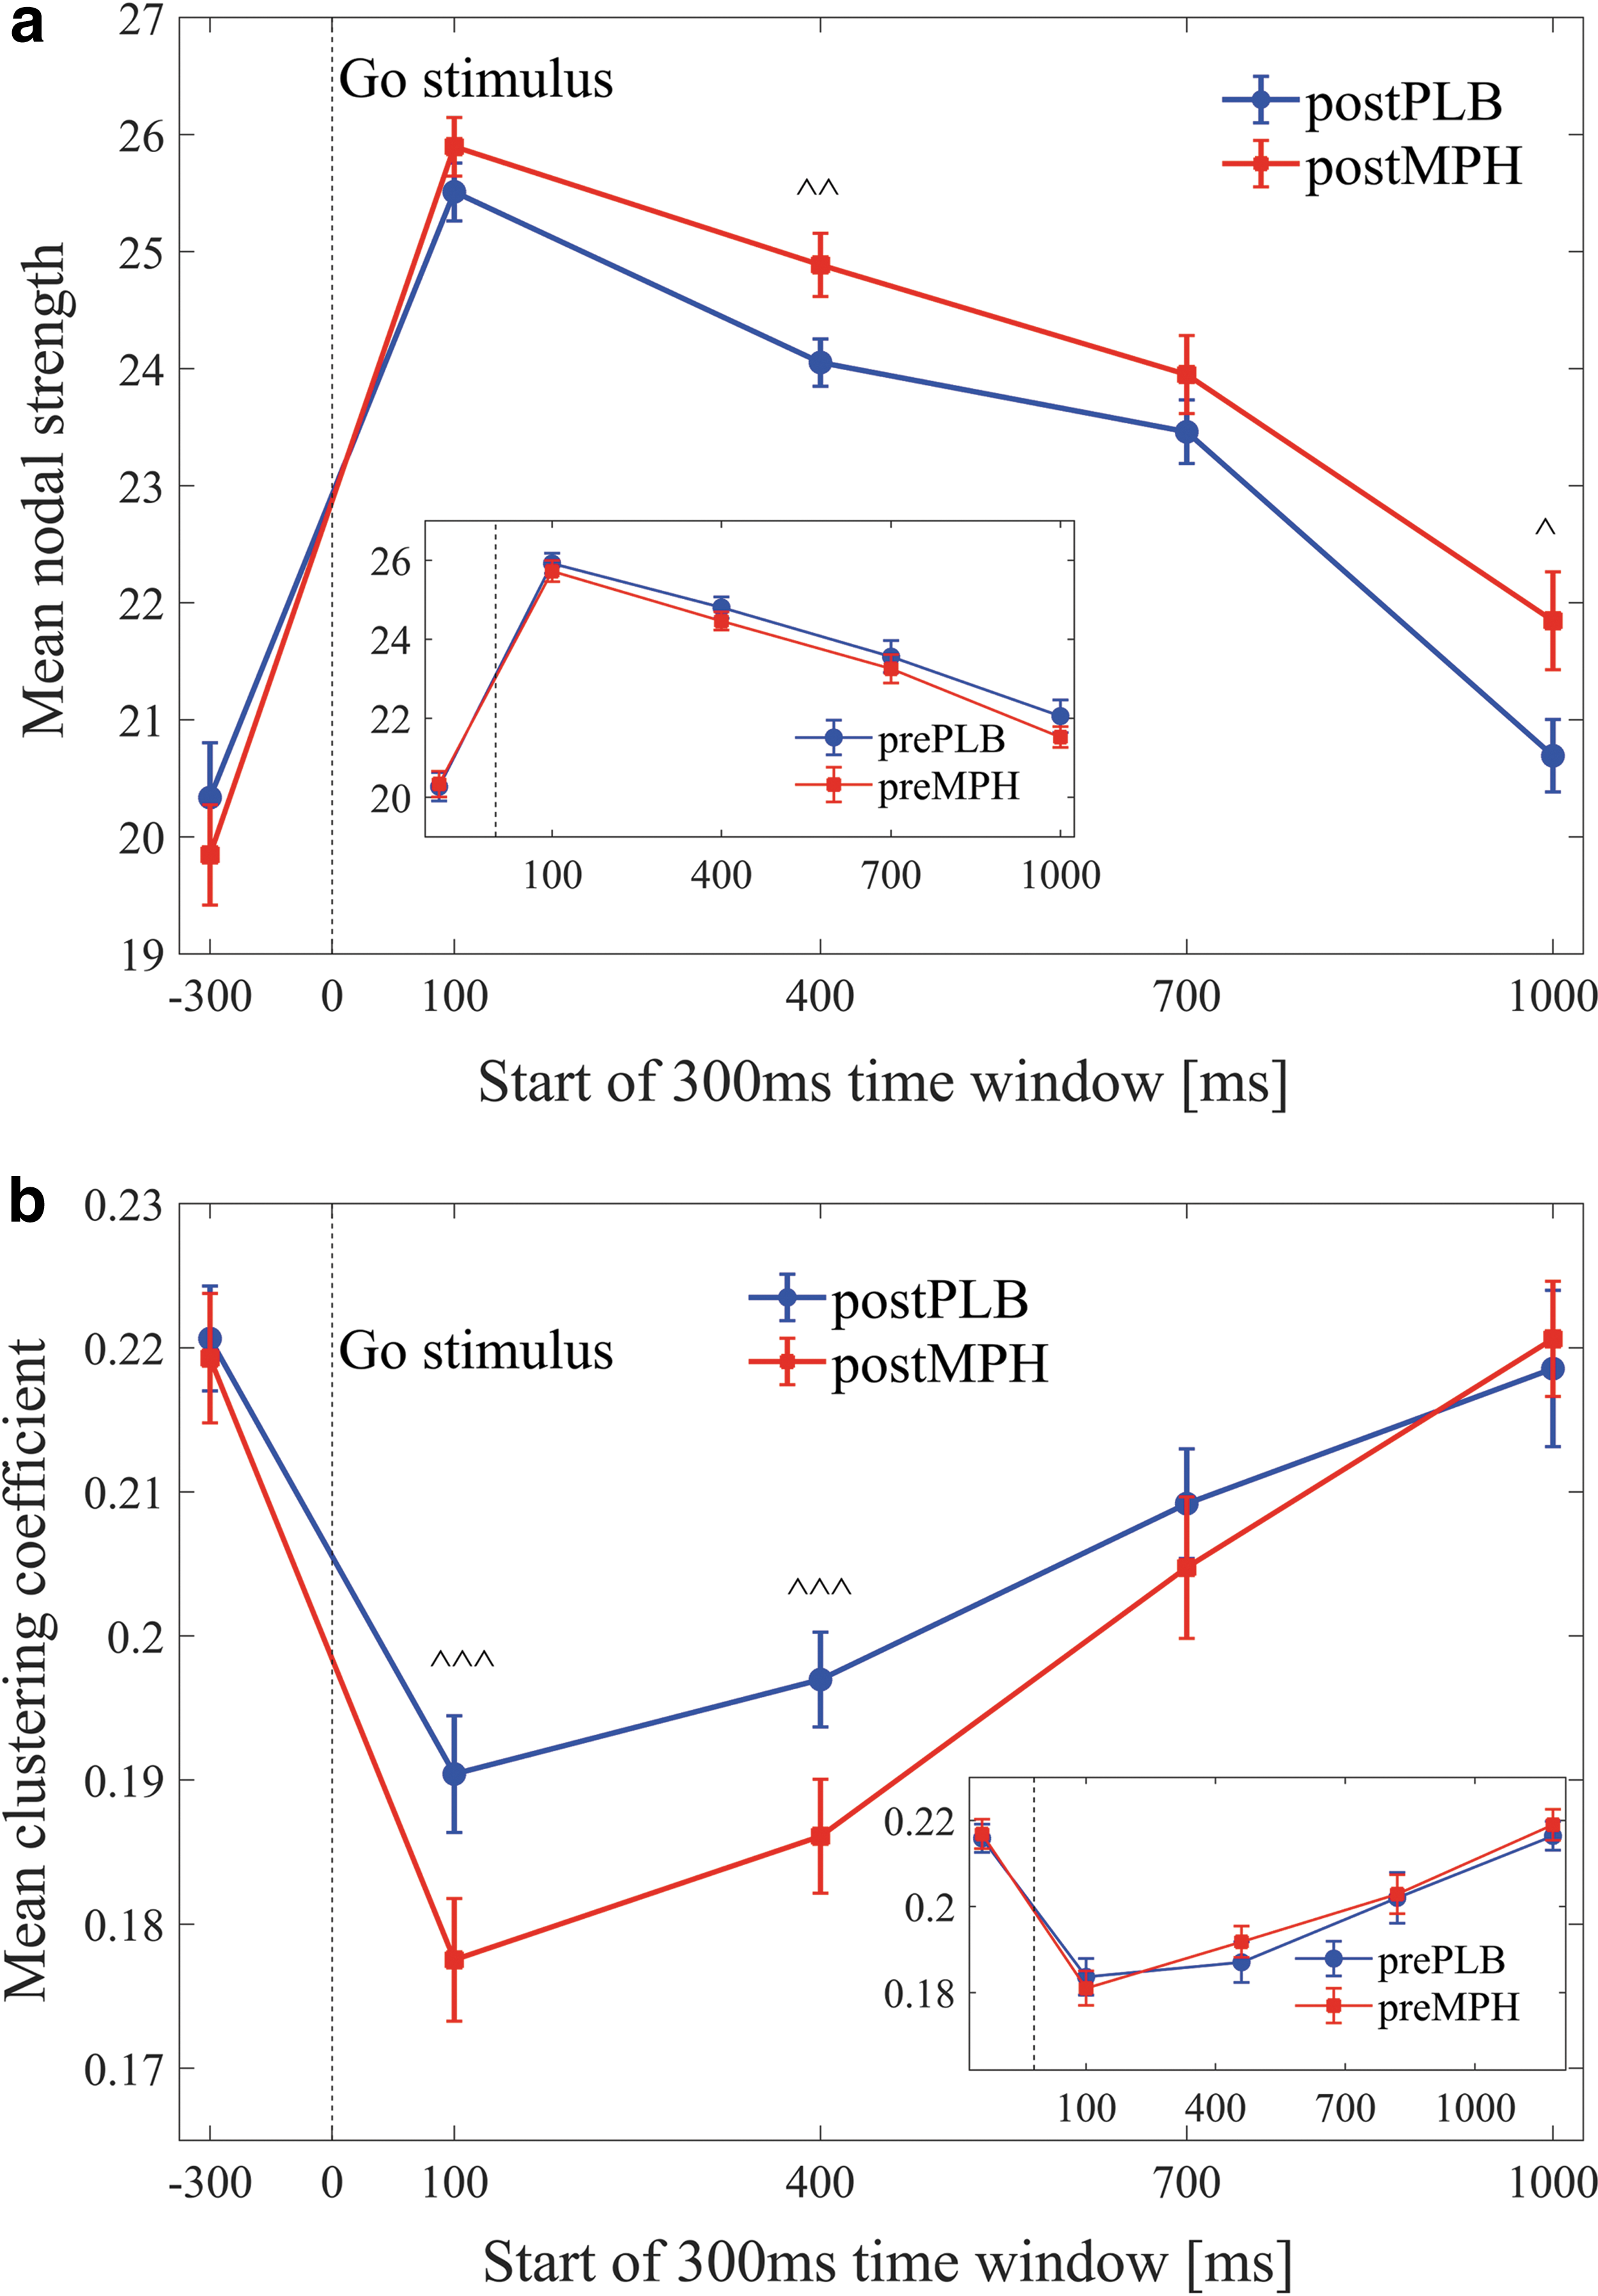
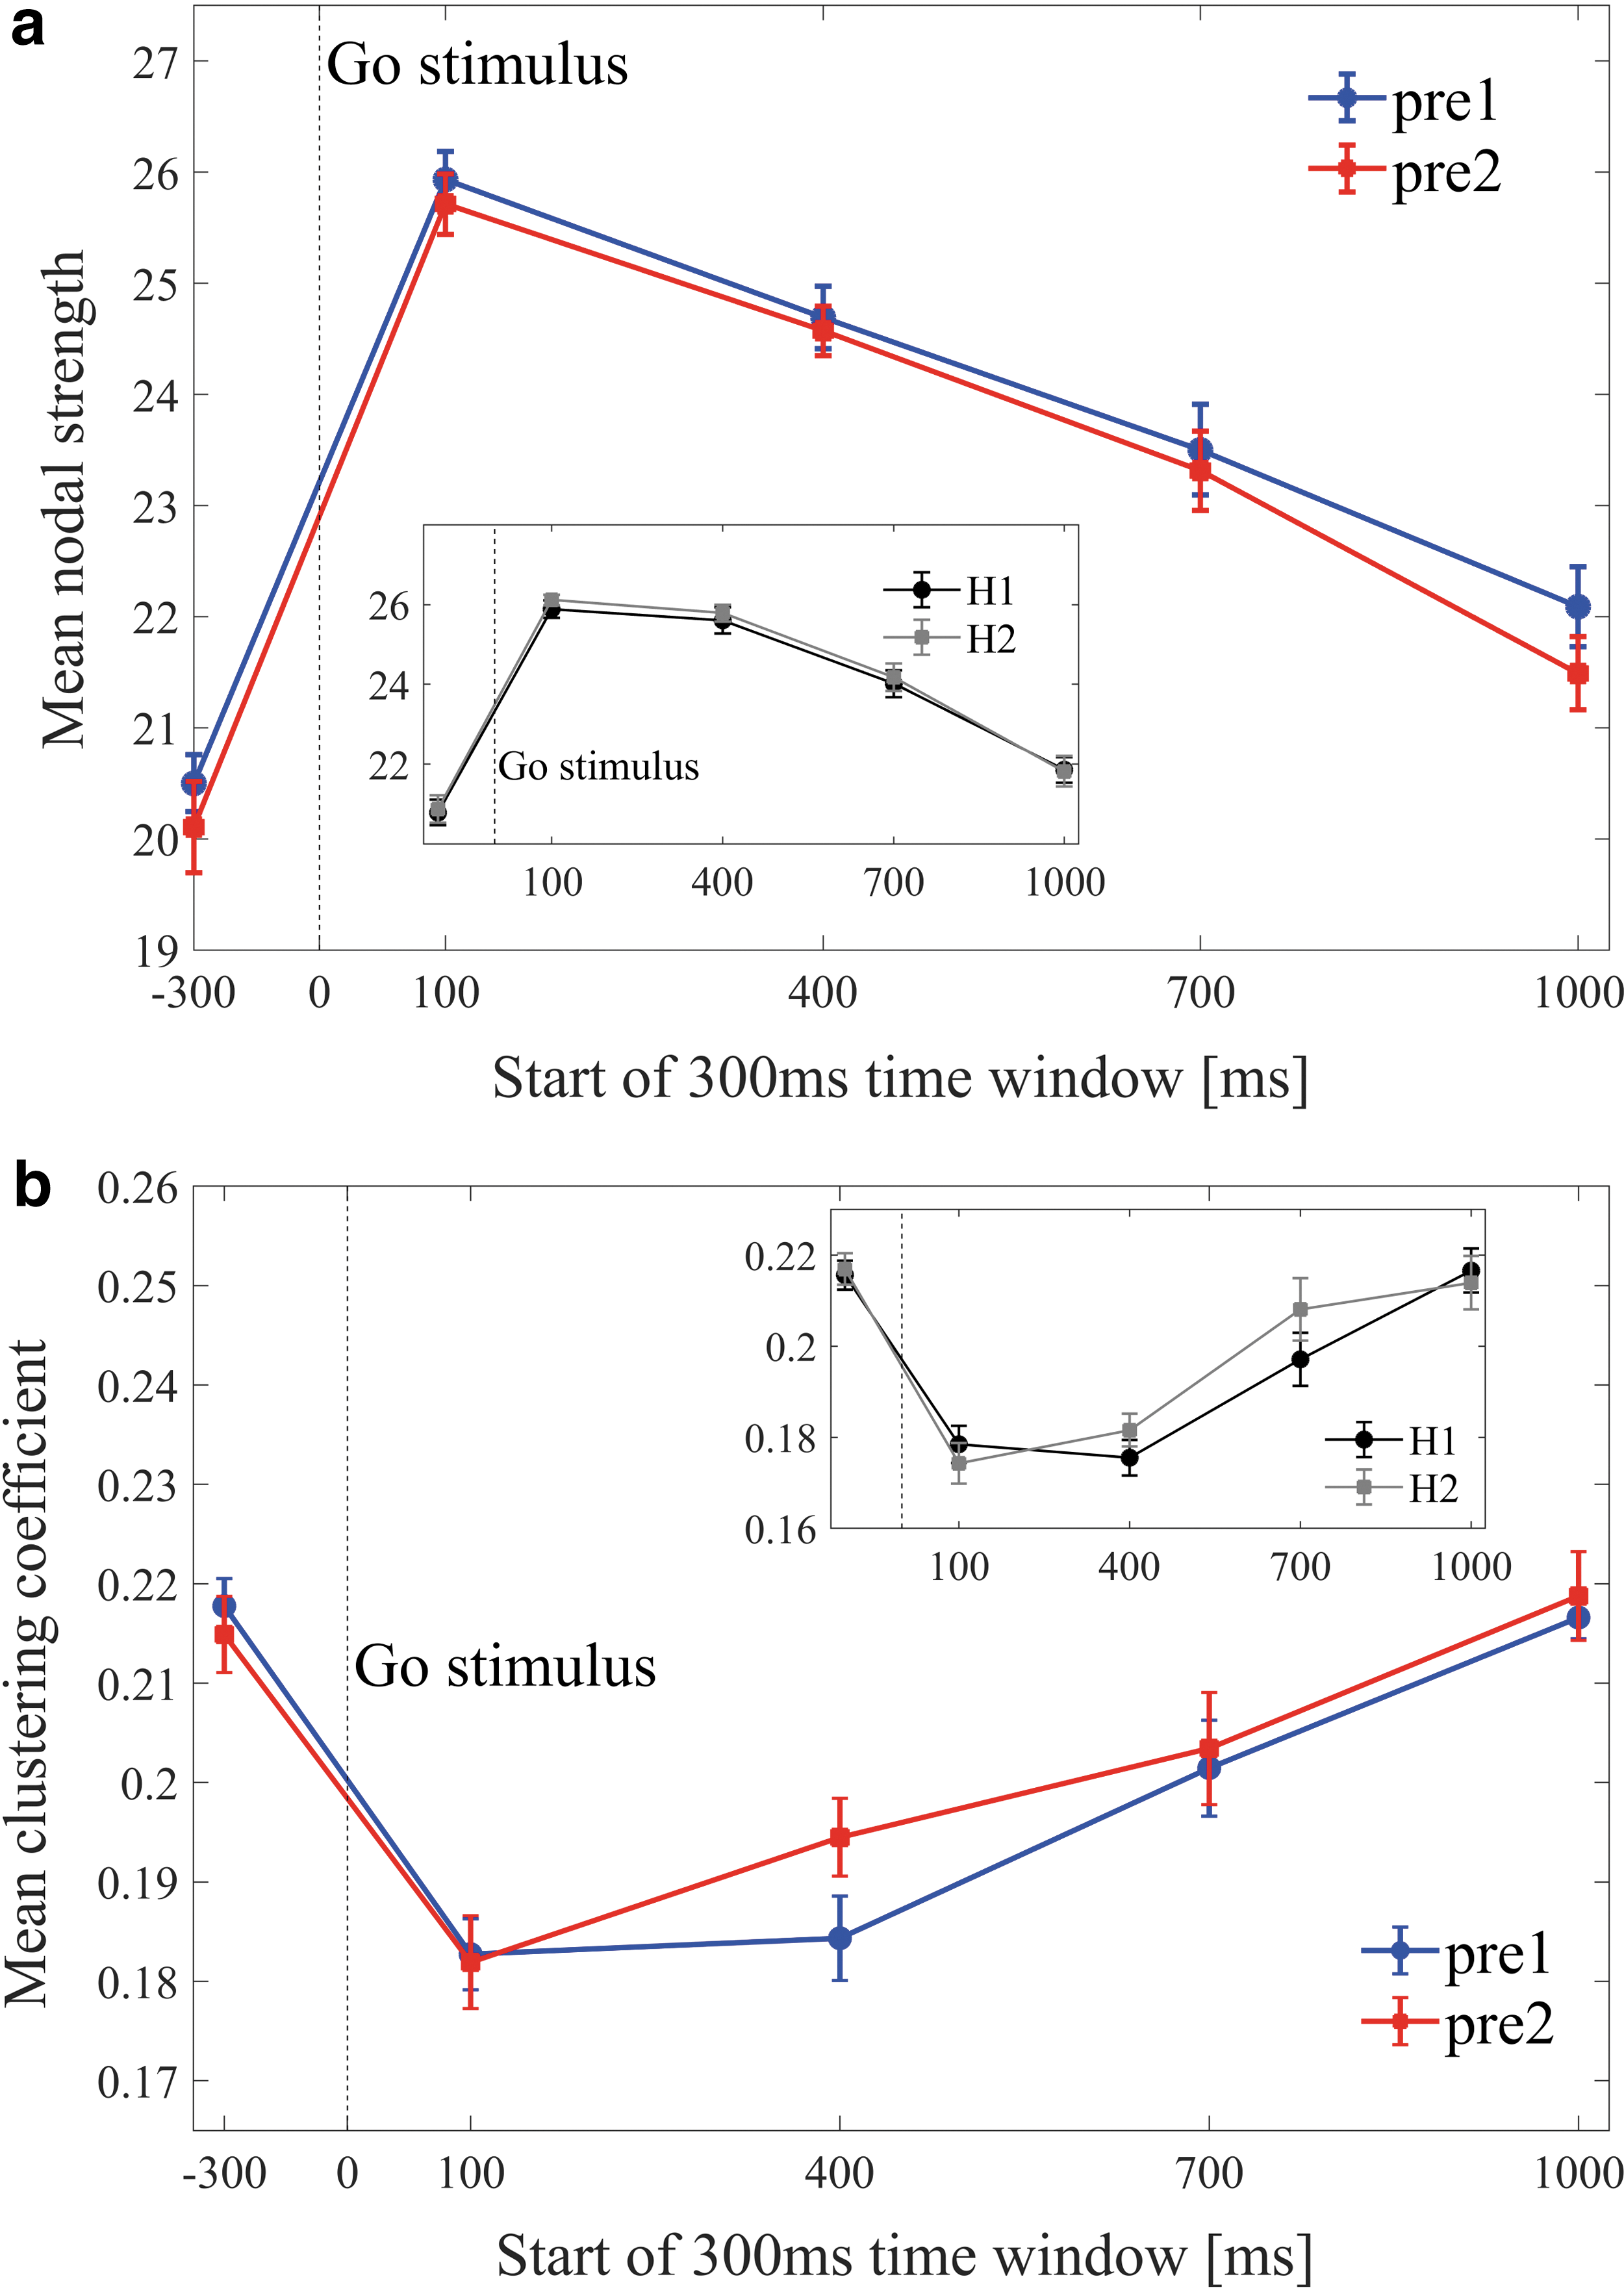
For all experimental conditions, across both ADHD and control groups, a significant increase of the MNS and a significant decrease of the MCC were evident at the onset of the Go stimulus (in the first post-stimulus window at 100–400 ms, compared with the pre-stimulus window at −300 to 0 ms, see examples for <k> = 30 in Figure 3a, b, p < 0.01). After the stimulus, we found consistent trends for both metrics: The MNS continued to increase until 100–400 ms post-stimulus and then gradually decreased back in the direction of its pre-stimulus baseline value. The MCC continued to decrease until 400–700 ms post-stimulus and then gradually increased back to baseline. These trends were consistent for the entire range of fixed mean degrees examined. No clear differences or trends were found for other network metrics.
Dynamics of the mean nodal strength
The results described in the following sections are valid (p < 0.05) for a range of fixed mean degree (≥30). Figures and statistical information are detailed for graphs with mean degree <k> = 30, as this was the minimal degree for which differences between the control and ADHD groups were obtained.
An FDR procedure was performed over the p-values of the four windows in each of the analyses detailed later. Significant results after this FDR were marked by ^^^. These significant results were found, across all analyses, in three out of the four tested windows. These windows were 100–400, 400–700, and 1000–1300 ms. Then, a second FDR was performed for each analysis, including only the p-values in these three windows. Significant results after the second FDR procedure were marked by ^^. Significant results (p < 0.05) that did not pass any FDR test, but were evident in these three windows, were marked by ^.
Methylphenidate versus placebo
A within-subject comparison in the ADHD group was conducted. Results showed that the MNS of the postMPH condition was significantly higher compared with postPLB in the windows 400–700 ms [^^ p = 0.016, t(18) = −2.6], and 1000–1300 ms [^ p = 0.04, t(18) = −2.2] (Fig. 3a).
A within-subject comparison in the ADHD group showed that the MCC of the postPLB condition was significantly higher compared with postMPH in the windows 100–400 ms [^^^ p = 0.002, t(18) = 3.6], and 400–700 ms [^^^ p = 0.02, t(18) = 2.5] (Fig. 3b).
ΔMPH versus ΔPLB
Significant differences were found in the MNS of the conditions ΔPLB and ΔMPH (ΔMPH > ΔPLB) in the windows 100–400 ms [^^ p = 0.04, t(18) = −1.1], 400–700 ms [^^^ p = 0.010, t(18) = −2.8], and 1000–1300 ms [^^^ p = 0.009, t(18) = −2.9]. Furthermore, ΔMPH significantly increased relative to baseline (p < .05) in all time windows (Figure 4a). When examining the MCC of the conditions ΔPLB and ΔMPH, a significant difference (ΔPLB > ΔMPH) was found in the window 400–700 ms [^ p = 0.02, t(18) = 2.5] (Fig. 4b).

Dynamics of the mean nodal strength
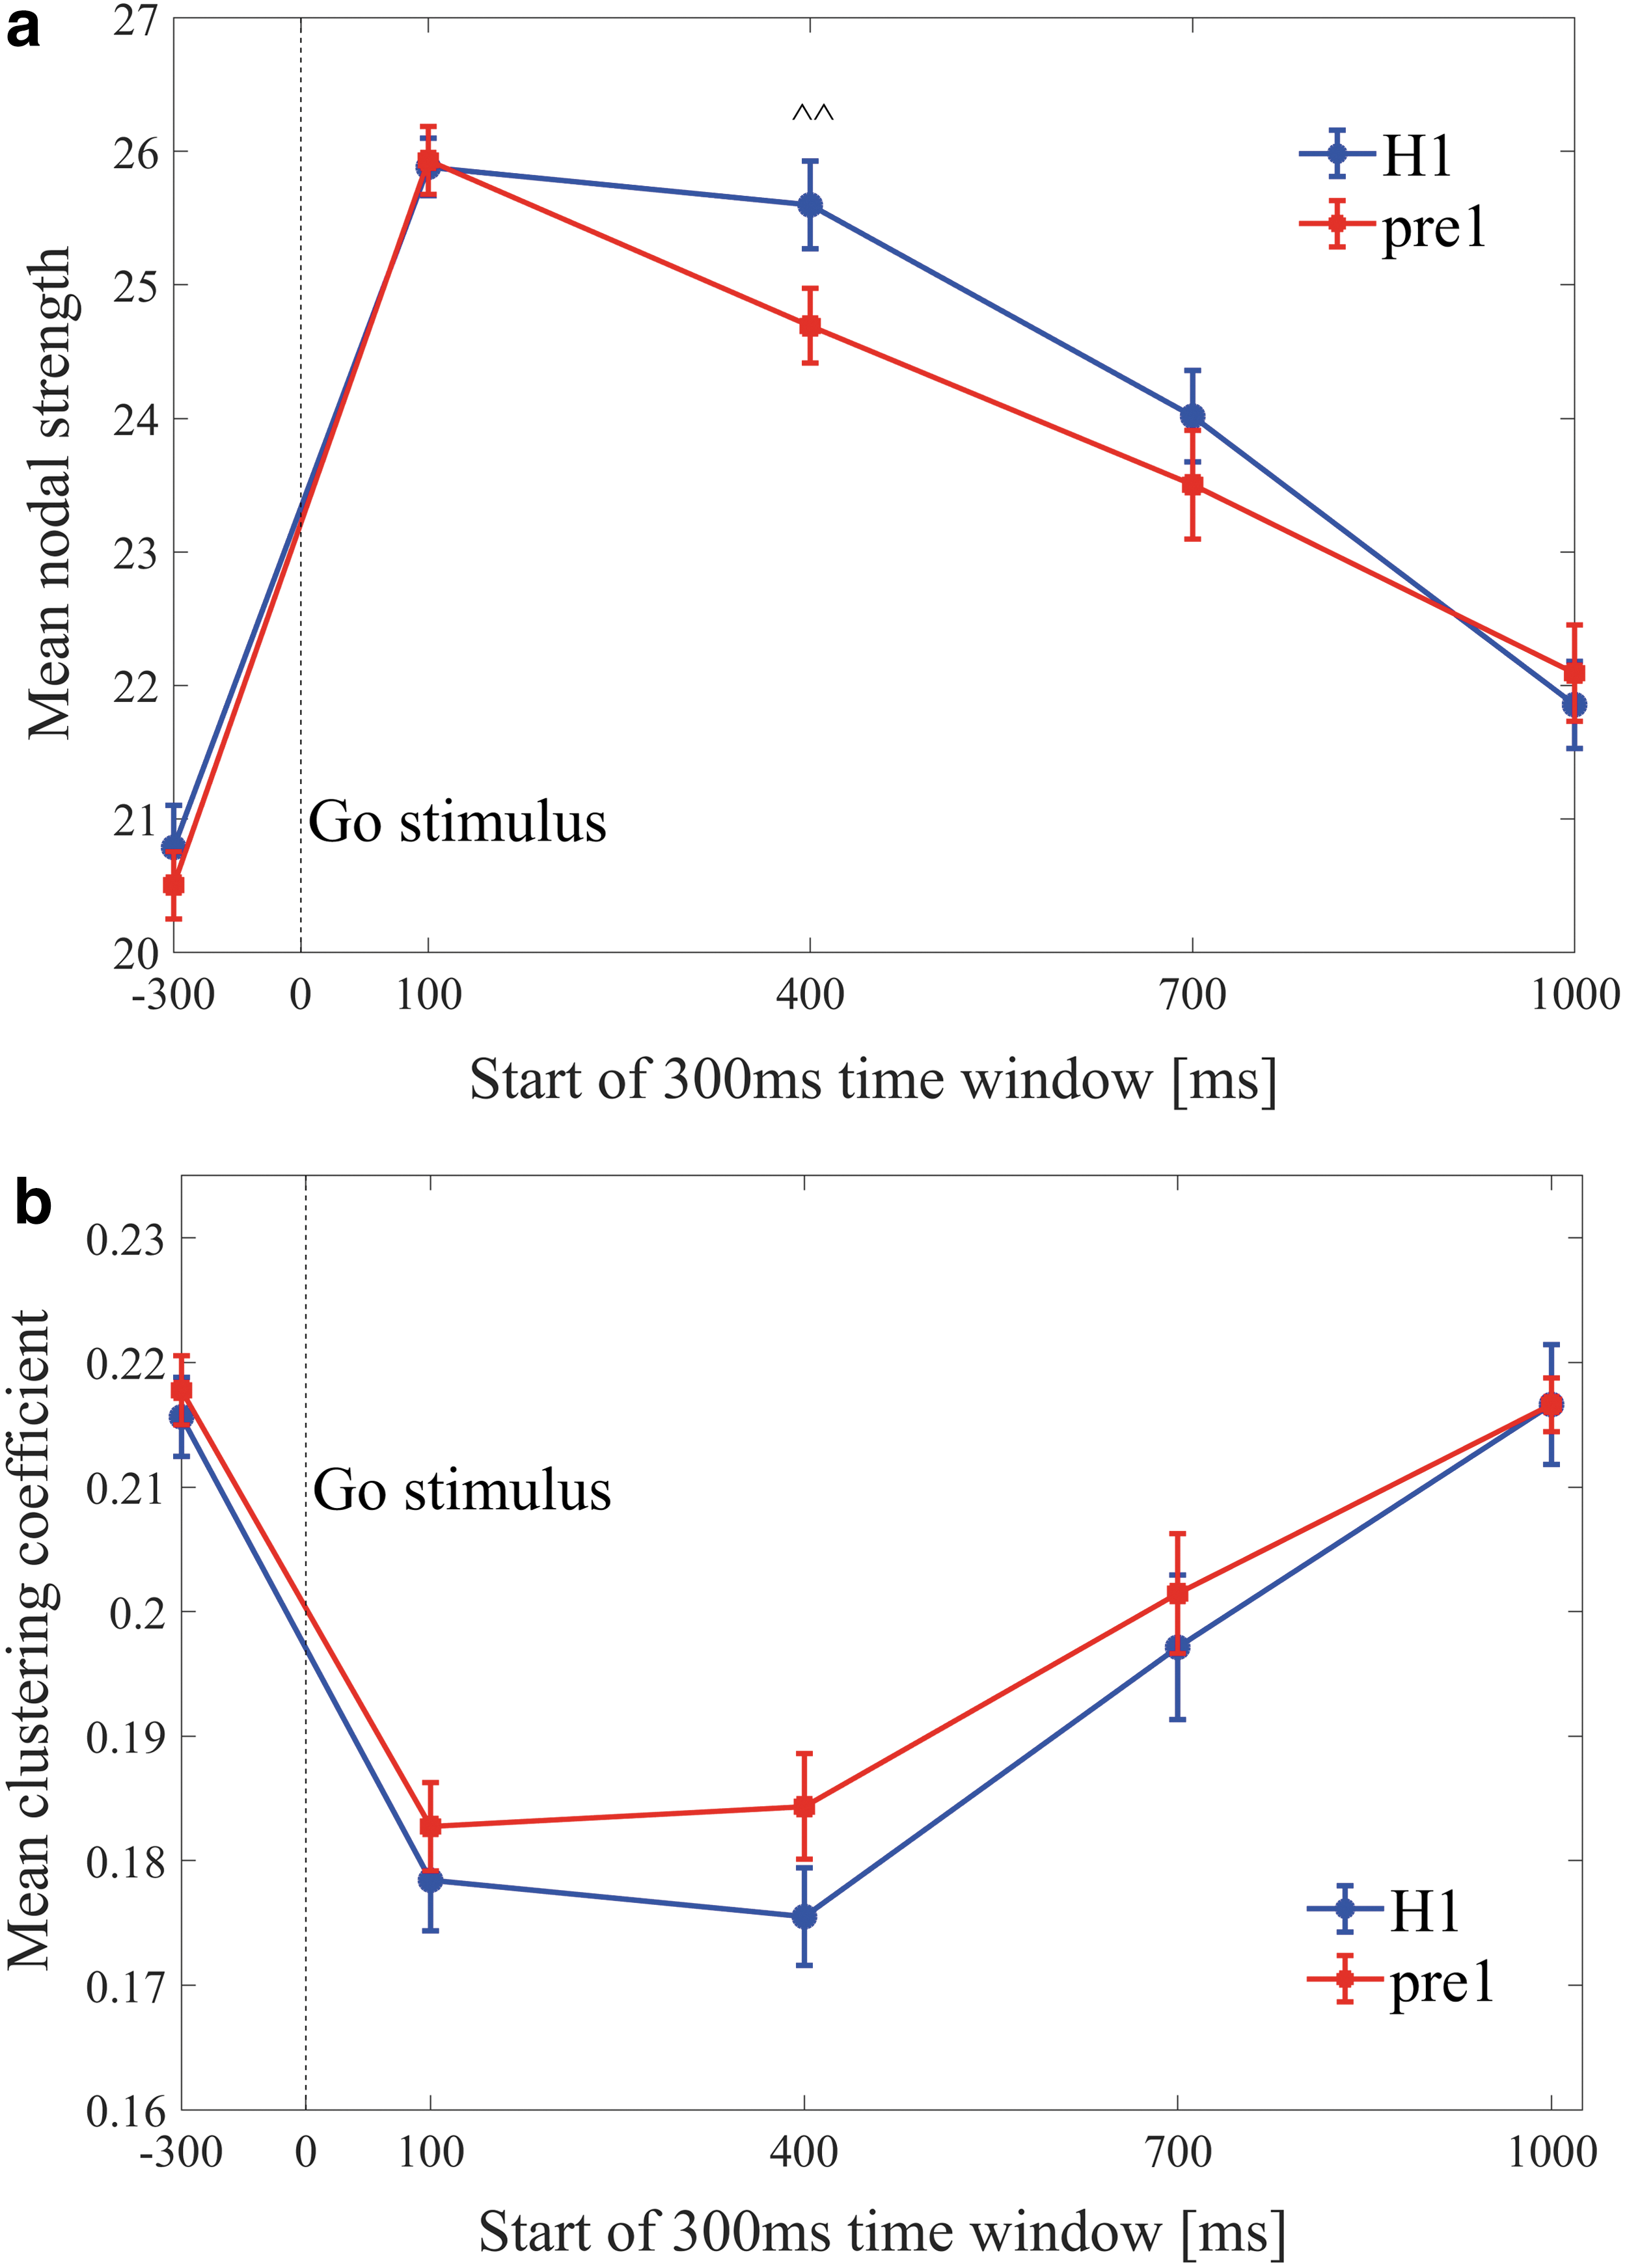
ADHD versus controls
A between-group comparison of the first session of ADHD subjects (pre1) and controls (H1) yielded significant differences of the MNS for the 400–700 ms window [ADHD<control, ^^ p = 0.01, z(35) = 2.3] (Fig. 5a). No differences were found for the MCC across the windows (Fig. 5b).
Dynamics of the mean nodal strength
Between- and within-days variability
To examine between-days variability, a within-subject comparison of the MNS and MCC was performed for the ADHD group between the pre1 and pre2 conditions. No differences were found across all windows (Fig. 6a, b). To test for possible fatigue or learning effects, a within-subject comparison of the MNS and MCC was performed for the control group between the H1 and H2 conditions. No differences were found across all windows (Fig. 6a, b, smaller panel).
Dynamics of the mean nodal strength
Increased NS post-methylphenidate
Following our findings of a significant MNS increase postMPH compared with preMPH in the windows 100–400, 400–700, and 1000–1300 ms (Fig. 4a), we examined the NS changes between these conditions in these windows. The location of each EEG channel was defined as the middle point between the locations of the two EEG electrodes that were subtracted to retrieve this channel. The NS changes after MPH were found to be consistently higher in the frontal and parietal brain regions (Fig. 7a, c). In other words, the NS increase in these regions contributed most to the overall MNS increase in these windows.
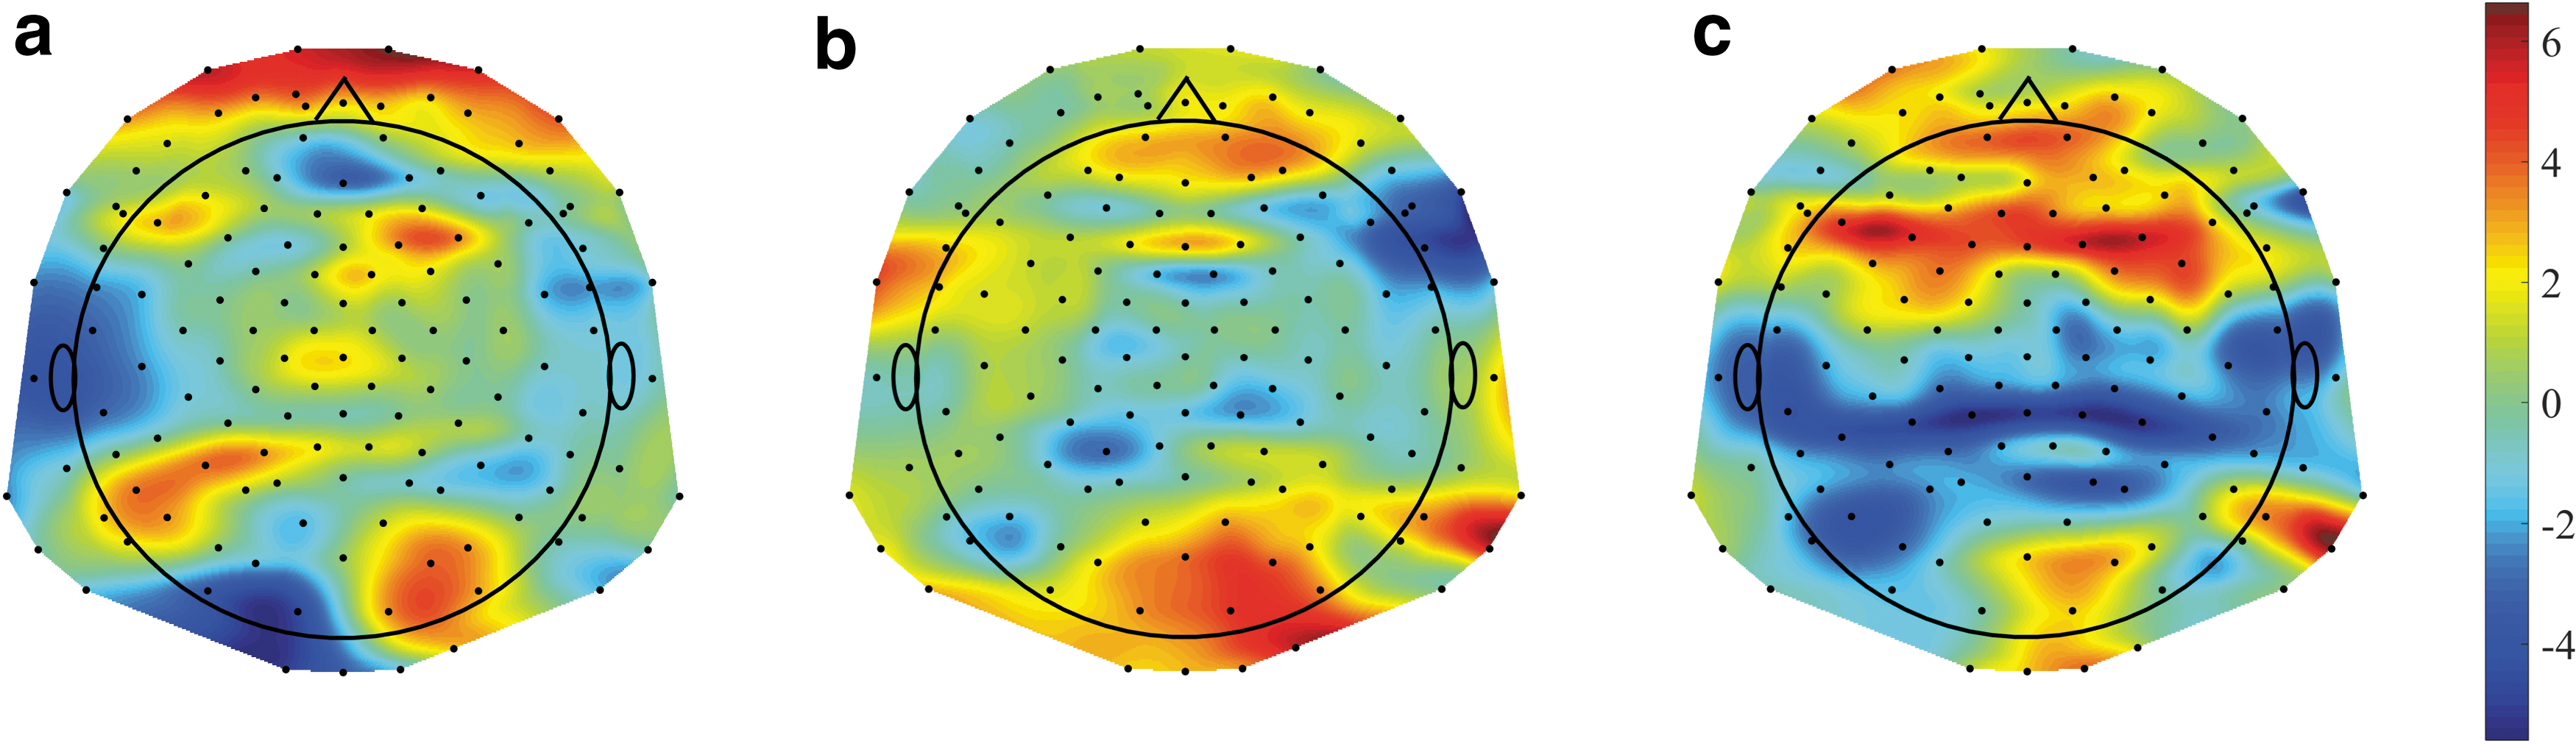
The difference of NSs between the post-methylphenidate and pre-methylphenidate conditions: The NS values of 139 EEG channels are plotted for the time windows
Increased NCCs post-placebo
Following our findings of a significant MCC increase postPLB compared with prePLB in the windows 100–400 ms and 400–700 ms (Fig. 4b), we examined the NCCs changes between these conditions in these windows. The increase of NCC postPLB was found to be highest in the mid-frontal, right-parietal, and left-parietal brain regions (Fig. 8). In other words, the NCC increase in these regions contributed most to the overall MCC increase in the 100–400 and 400–700 ms windows.
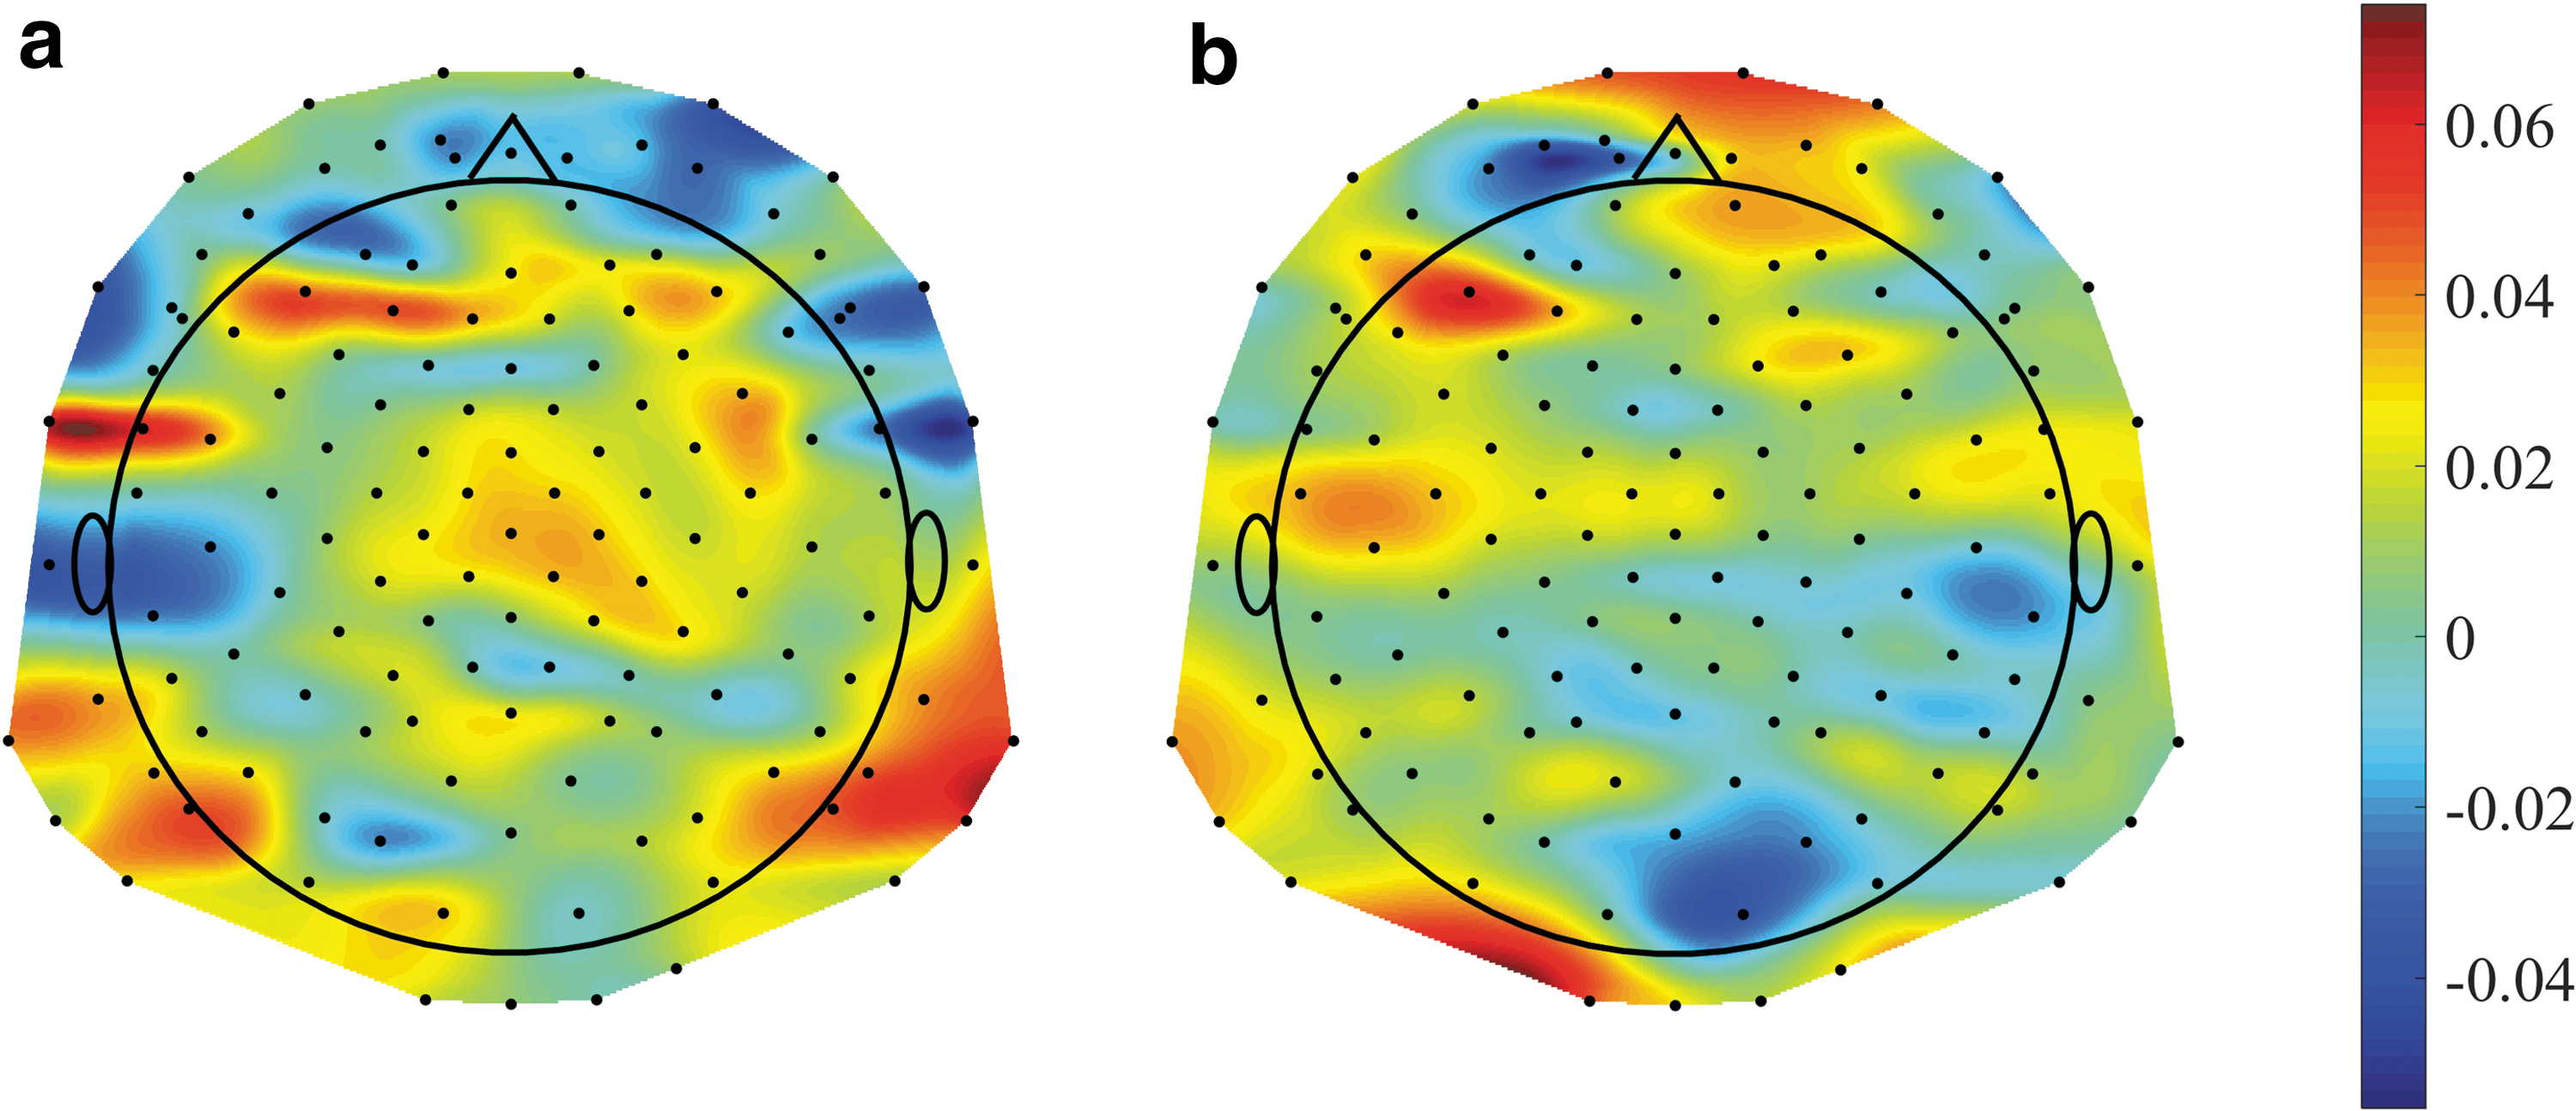
The differences of nodal clustering coefficients between the post-placebo and the pre-placebo conditions: The nodal clustering coefficient values of 139 EEG channels are plotted for the time windows
Altered long-range connectivity between the frontal and parietal regions
In the previous sections, we found that connectivity alterations after placebo were mostly in the frontal and parietal regions. Further, we found significant MNS differences in the time window 400–700 ms between ADHD and control subjects, as well as between postPLB and postMPH conditions. Therefore, we focused on this time window and examined the connections between the frontal and parietal regions [the division of the regions is detailed in the Supplementary Data of Naim-Feil et al. (2018)]. For each subject, the MLS of the frontal-parietal connections was calculated, and results were compared across the experimental conditions mentioned earlier. We found that the MLS between the left-middle frontal regions and the right-middle-left parietal regions was significantly higher in controls (H1) compared with ADHD subjects (pre1) [p = 0.03, t(35) = −2.2], and it was significantly lower after MPH compared with placebo [p = 0.005, t(18) = 3.2] within the ADHD subjects. A significant increase postMPH was also evident compared with preMPH [p = 0.006, t(18) = 3.1]. No differences were found between the conditions prePLB and postPLB, nor between prePLB and preMPH (Table 3).
Mean Local Strength in the Frontal-Parietal Regions for the Different Experimental Conditions in the 400–700 ms Time Window
Significant differences were found between controls (H1) and ADHD (pre1) [p = 0.03, t(35) = −2.2], preMPH versus postMPH [p = 0.006, t(18) = 3.1], and postPLB versus postMPH [p = 0.006, t(18) = 3.1].
SE, standard error.
Discussion
This study used the graph theory to examine dynamic network connectivity during a cognitive effort of ADHD subjects and the effects of MPH intake on these dynamics. The response to the SART is a dynamic process that involves time-dependent collaboration of widespread brain regions (Erika-Florence et al., 2014). Graph-theory tools enable the examination of the evolution of the networks after the stimuli (Bola and Sabel, 2015; Naim-Feil et al., 2018; Wei et al., 2015) and a comparison of these dynamics after placebo or MPH intake.
Consistent with previous findings, the behavioral results showed that MPH intake resulted in less errors and in a reduced standard deviation response time compared with placebo (Bedard et al., 2003; Epstein et al., 2011b; Nandam et al., 2011).
For both the ADHD and the control groups, the Go stimuli induced an ongoing shift in the networks' topology. The general result was an immediate increased connectivity (represented by the MNS) and a decreased segregation (represented by the MCC), which gradually returned to baseline levels at 1200–1500 ms post-stimulus. This suggests that the cognitive task caused the networks to change temporarily into a different topological state. Similar temporal patterns of network metrics in response to the SART were previously shown for Schizophrenia patients and healthy controls by Naim-Feil and colleagues (2018).
ADHD versus controls
Our dynamic approach revealed a decrease in the MNS of ADHD subjects relative to controls, localized to the 400–700 ms post-stimulus window. Lower MNS in ADHD indicates weaker connections between the nodes, consistent with previous studies that reported reduced functional connectivity in ADHD (Fair et al., 2010; Rubia et al., 2009; Wolf et al., 2009). Interestingly, the 400–700 ms window corresponds to the average response time of the subjects. Our results suggest that networks of ADHD participants are unable to sufficiently increase and maintain global connectivity in response to a cognitive perturbation, indicating a possible impairment in network flexibility (Braun et al., 2015; Ekman et al., 2012; Naim-Feil et al., 2018). Decreased flexibility was previously shown to be an indicator for decreased learning (Bassett et al., 2011) and decreased adaptability to cognitive demands (Braun et al., 2015). Altered network flexibility in response to the Go/No-Go task was also found by Naim-Feil and colleagues (2018), which showed a faster return to baseline in patients with Schizophrenia compared with controls.
Methylphenidate versus placebo
For the same 400–700 ms window in which the MNS decreased in ADHD relative to controls, we also found increased MNS postMPH compared with postPLB. No between-days effects were found. These results suggest a normalizing effect of the MPH in the direction of the healthy controls, consistent with previous EEG (Lawrence et al., 2005; Verbaten et al., 1994) and fMRI (Peterson et al., 2009; Rubia et al., 2009) studies. A MNS increase postMPH relative to postPLB was also evident in the late 1000–1300 ms window, suggesting a possible MPH normalization of an impaired preparation to the upcoming stimulus in ADHD (Doehnert et al., 2013). Further, the MCC increased postPLB compared with postMPH 100–400 and 400–700 ms post-stimulus, indicating a stronger presence of loops (triangles of connections) and increased widespread network segregation under placebo.
The lack of differences in the MCC pre- and post-MPH may result from inhibition of time-on-task effects by the MPH. Time-on-task can cause mental fatigue, and it is known to decrease the amplitude of the EEG signals around 300 ms post-stimulus (Möckel et al., 2015). It was also shown to decrease attention in ADHD subjects more than in controls (Bioulac et al., 2012). We hypothesize, therefore, that the cognitive effort of two consecutive SART sessions resulted in an increase of the MCC when the subjects received placebo. As MPH is proposed to improve response inhibition (Aron et al., 2003; Nigg, 2001), these fatigue effects were inhibited by the MPH. This hypothesis is strengthened by the observed increase of RTSD postPLB compared with prePLB, and its decrease postMPH compared with preMPH, since higher RTSD is known to indicate attention deficits (Epstein et al., 2011b). Notably, a similar effect was not evident in the control group.
The importance of including a pre-treatment session was highlighted by the analysis of ΔPLB (postPLB minus prePLB) and ΔMPH (postMPH minus preMPH), which revealed significant differences in additional time windows.
Nodal and local characteristics
To identify the underlying regional sources of the increase in MNS postMPH, we examined the NS of the EEG channels in the windows 100–400, 400–700, and 1000–1300 ms. NS is defined per node as the sum of its connections, and it represents the nodal connectivity of the node. For all three windows, the highest NS increase between preMPH and postMPH occurred in the frontal and parietal brain regions. Similarly, the sources of the increase in the MCC postPLB were investigated by testing the NCCs of the EEG channels in the 100–400 and 400–700 ms windows. The highest increase in NCC between prePLB and postPLB occurred in the same frontal and parietal regions. The integrity of frontal and parietal brain regions is known to play a role in successful performance in the SART (Dockree et al., 2005). Further, previous fMRI studies have demonstrated hypo-activation of the frontal-parietal networks in ADHD compared with controls during response inhibition tasks (Dickstein et al., 2006; Morein-Zamir et al., 2014), and they have shown that MPH enhances activation of the frontal cortex during such tasks (Rubia et al., 2014). Our findings further support the relevance of these regions in ADHD under cognitive effort.
To understand the potential cause of the observed network alterations, we examined the connections between the frontal and parietal regions in the time window 400–700 ms. We found a decrease in the MLS of the frontal-parietal sub-network in ADHD subjects compared with controls, which was significantly corrected by MPH compared with placebo. Therefore, we suggest that long-range connections between these regions are impaired in the ADHD brain, whereas short-range connections, as manifested by the higher MCC, dominate instead.
Limitations
While we conducted a double-blind placebo-controlled cross-over experiment, the subjects varied in age, ADHD sub-types, and previous usage of MPH. Ideally, this variation should be minimized, as it might act as an intervening factor. However, including these variables as covariates revealed no significant interactions to the reported results.
Another significant limitation relates to the methodology of applying network analysis to neuroimaging data, and there is still no consensus on the proper ways to construct the networks, choose the referencing method, define the nodes and edges, or decide on the appropriate threshold. In this study we combined standard methods (Fornito et al., 2012) with nonstandard ones such as the “Gradient Montage” (Rubinson et al., 2017). The lack of consensus regarding these issues challenges our ability to compare our study with other network studies.
Finally, it is also important to be cautious in the interpretation of the networks' edges, which are based on the correlations between the EEG signals, and do not necessarily represent causality between the nodes.
Conclusions
This study is the first to report alterations in temporal trajectories of the global connectivity in EEG-derived networks after a cognitive perturbation, in nonmedicated ADHD subjects compared with medicated ADHD subjects and with matched controls. These alterations were also evident in the networks' local features in task-relevant brain regions.
The dynamic graph approach was sensitive to the stimulants' effect on the brain, and we found differences in global topological features after the intake of placebo and MPH. The altered trajectory of global connectivity response in ADHD subjects relative to controls may indicate impaired network flexibility in ADHD, a phenomenon that is normalized by MPH intake. Our results emphasize the need of a well-designed study, combined with a dynamic approach when studying various neurobiological conditions after a cognitive perturbation and the effects of stimulants on these conditions.
Footnotes
Acknowledgments
E.M. is supported by the Minerva Foundation (Germany) and by the Israel Science Foundation 1385/16.
N.L.-B. is supported by the Israel Science Foundation grant (No. 1169/11) and by the National Institute of Psychobiology in Israel.
J.N.-F. is a recipient of the Senior Postdoctoral Fellowship at the Weizmann Institute, the Curwen-Lowy Postdoctoral Fellowship, and the Clore Post-doctoral Fellowship.
The authors are thankful to Dr. Dominik Freche for his advice and support, and to Daphna Bar-Haim, Shachaf Granot, Omer Katzengold, Dor Lipetz, Jackie Shpilman, and Yael Spiegelman for their assistance. Trial registration details: Trial name: Psychostimulants Effects on Brain Functional Connectivity in Youth with Attention Deficit Hyperactivity Disorder; Registration number: NCT02318017.
Author Disclosure Statement
No competing financial interests exist.
Supplementary Material
Supplementary Figure S1
Supplementary Figure S2
Supplementary Figure S3
Supplementary Figure S4
Supplementary Figure S5
Supplementary Table S1
References
Supplementary Material
Please find the following supplemental material available below.
For Open Access articles published under a Creative Commons License, all supplemental material carries the same license as the article it is associated with.
For non-Open Access articles published, all supplemental material carries a non-exclusive license, and permission requests for re-use of supplemental material or any part of supplemental material shall be sent directly to the copyright owner as specified in the copyright notice associated with the article.