
Abstract
Previous research has found that functional connectivity (FC) can accurately predict the identity of a subject performing a task and the type of task being performed. These results are replicated using a large data set collected at the Ohio State University Center for Cognitive and Behavioral Brain Imaging. This work introduces a novel perspective on task and subject identity prediction: blood-oxygen-level-dependent variability (BV). Conceptually, BV is a region-specific measure based on the variance within each brain region. BV is simple to compute, interpret, and visualize. This work shows that both FC and BV are predictive of task and subject, even across scanning sessions separated by multiple years. Subject differences rather than task differences account for the majority of changes in BV and FC. Similar to results in FC, BV is reduced during cognitive tasks relative to rest.
Introduction
Recent studies have shown that functional connectivity (FC) is highly diagnostic of the task that a subject is performing (Gonzalez-Castillo et al., 2015; Kaufmann et al., 2016; Kucyi et al., 2016; Richiardi et al., 2011; Shirer et al., 2012; Tagliazucchi et al., 2012), and the identity of the subject performing a given task (Finn and Constable, 2016; Finn et al., 2015). These two prediction problems are illustrated in Figure 1. For task prediction, a subject is scanned performing an unknown task and the goal is to use imaging data from that scan to predict what task that subject was performing. For subject identity prediction, an unknown subject is scanned performing a known task and the goal is to use imaging data from that scan to predict the five subject's identity. The present work aims to replicate results showing that FC is predictive of task and subject identity and to demonstrate that a different metric, BOLD (blood-oxygen-level-dependent) variability (BV), is also highly diagnostic of task and subject identity. The present article has three goals: first, to replicate results by showing that FC is predictive of both task and subject identity; second, to demonstrate that BV is also highly diagnostic (although less diagnostic than FC) of both task and subject identity; and third, to demonstrate that both FC and BV are robust across preprocessing variations and can be used for subject identity prediction over a time span of several years.
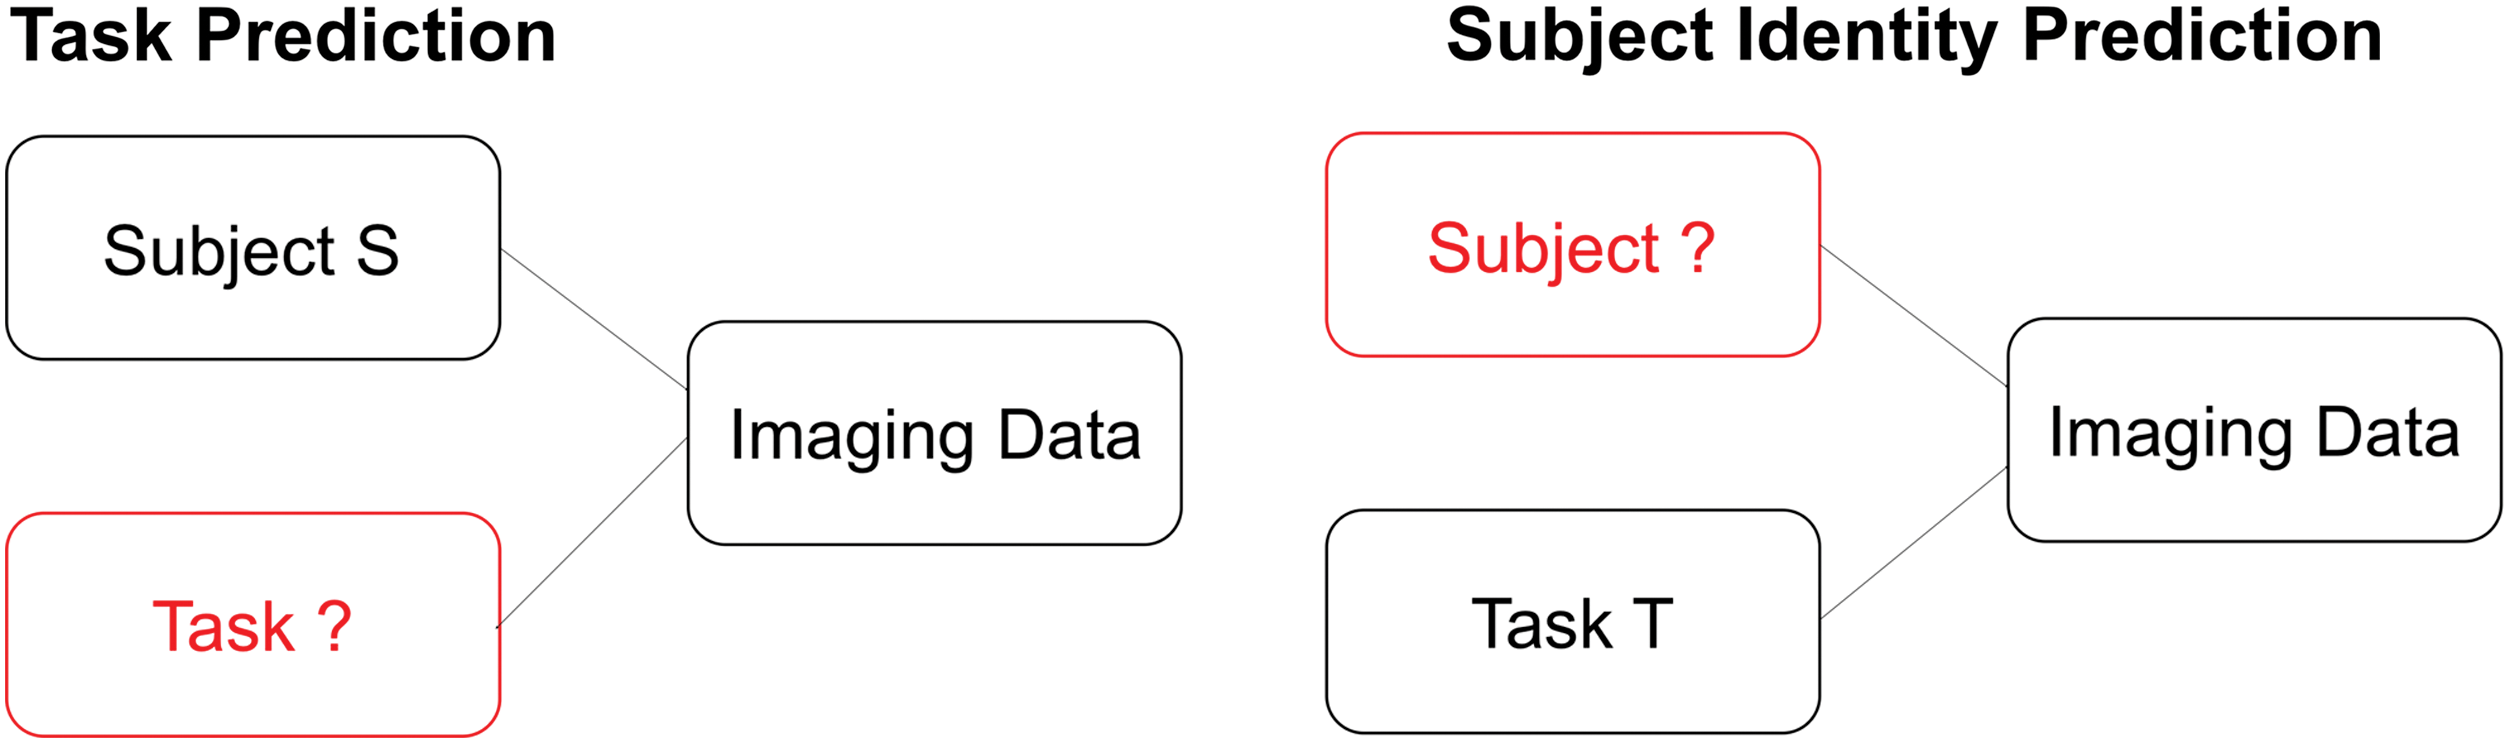
There are two prediction problems addressed in the present article: the task prediction (left) and the subject identity prediction (right). For both settings, an image is generated by a subject performing a task. For task prediction, the goal is to use imaging data to infer which task was performed given the subject's identity. For subject identity prediction, the goal is to use imaging data to infer the unknown subject's identity given the task that was performed. Color images are available online.
Defining FC and BV
FC and BV are two metrics that focus on changes of the BOLD signal around the mean. FC is the correlation or covariance in BOLD activation across regions (Biswal et al., 1995; Friston, 2011; Friston et al., 1993; Van Den Heuvel and Pol, 2010). A perhaps less familiar perspective to brain connectivity researchers, but one mathematically related to FC, is BV: the region-specific variance in BOLD activation (Garrett et al., 2010, 2011, 2012). Figure 2 illustrates how FC and BV are connected. For a given set of regions-of-interest (ROIs), one can compute the variability of the BOLD time series and the degree to which each BOLD time series is related to other time series in the set of ROIs. Both of these calculations are contained in the variance/covariance matrix, where the diagonal elements contain variance terms and the off-diagonal elements contain covariance terms (i.e., Fig. 2B). However, because covariance terms are often difficult to interpret, FC is typically based on the Pearson correlation, which normalizes the covariance terms by dividing the variances of the corresponding ROIs, as shown in Figure 2C. As a result, the elements of the correlation matrix are blend of variance and covariance elements, which could potentially obscure important details inherent to tasks, subjects, or ROIs.

Relationships between the calculation of FC and BV. Time series for three ROIs
FC predicts task and subject identity
In the task prediction setting, both whole-brain FC and network-level FC have been studied. Whole-brain FC has been shown to accurately predict whether subjects are engaged in a task or at rest (Richiardi et al., 2011), to discriminate between subject-driven cognitive states (Shirer et al., 2012), and to robustly track ongoing cognition (Gonzalez-Castillo et al., 2015). Furthermore, the ability to track states with FC has been associated with measures of behavioral performance (Gonzalez-Castillo et al., 2015). FC networks have similarly been shown to predict subject-driven cognitive states (Tagliazucchi et al., 2012), to be associated with attention (Kucyi et al., 2016), and to accurately track task-evoked states (Kaufmann et al., 2016).
Despite strong links between FC and task-evoked states, recent research suggests that the majority of the variance in FC is accounted for by “who you are and not what you are doing” (Finn and Constable, 2016, p. 281). Subjects exhibit individual resting-state network architectures that are detectable in task-based fMRI (Cole et al., 2014) and can be used to accurately identify subjects within a group (Chen and Hu, 2018; Finn et al., 2015; Horien et al., 2018; Kaufmann et al., 2017; Vanderwal et al., 2017; Waller et al., 2017). Individual resting-state FC has also been used to predict changes in the BOLD signal across task conditions. For example, Tavor et al. (2016) used resting-state FC and gross brain morphology to accurately predict BOLD modulation across a range of cognitive paradigms, suggesting that individual differences in task-evoked activity are stable trait markers of underlying individual differences in resting-state FC.
There is no consensus about whether subject-specific FC signatures are persistent across time. One long-term study found that FC within a single individual changed over time and was paralleled by ongoing fluctuations in behavior, although many brain networks are largely stable (Poldrack et al., 2015). Other studies suggest that functional signatures are more stable. For example, Laumann et al. (2015) found that areal parcellation of subject FC is stable over the span of a year, and Choe et al. (2015) found that resting-state FC in a single individual, and especially the executive resting-state network, was stable over a 3-year period.
BV associations with task and individual differences
BV presents a different approach to study BOLD fluctuations, also associated with task and individual differences. A series of neurocognitive aging experiments (see Garrett et al., 2013; Grady and Garrett, 2014, for reviews) showed age-related effects on task BV that are separate from, and more predictive than, the mean (Garrett et al., 2010). A follow-up study (Garrett et al., 2011) identified regions that were associated with age, the speed of response, and consistency of behavioral performance. The difference in variability of high-performance-associated regions versus low-performance-associated regions was greater for younger, high-performing subjects. In a latent variable study, BV was linked to age, response time, and accuracy in a spatial working memory task (Guitart-Masip et al., 2016). BV in the neocortex was also associated with task-related disengagement of the default mode network (Guitart-Masip et al., 2016). BV has also been shown to be related to suboptimal financial risk tasking among older adults (Samanez-Larkin et al., 2010). In addition to age-related effects, individual differences in BV have been associated with lower visual discrimination thresholds (Wutte et al., 2011). BV has also been found to vary across task conditions (fixation vs. during task) (Garrett et al., 2012), and to be associated with task-evoked activity (Mennes et al., 2011). A study of older adults showed that greater BV was associated with better fluid abilities, better memory, and greater white matter (WM) integrity in all WM tracts (Burzynska et al., 2015). Mirroring their FC analyses, Finn et al. (2015) used BV to accurately predict subject identity between different cognitive tasks.
Goals of the present study
In this study, we replicate results showing that FC is predictive of task and subject identity, test whether BV is also diagnostic of task and subject identity, and compare the predictive ability of FC and BV. As FC has already been established as highly predictive of both measures, we aim simply to replicate these results here. However, as BV is studied less frequently, comparing BV to FC provides an important assessment of the relative merits of variance, covariance, and Pearson correlation. We show that connectivity leads to superior results, but that BV can also successfully predict task and subject differences. We also show that the predictive models are robust across time—FC and BV can be used to predict subject identity across time periods on the order of 3 years. In addition, we test the robustness of predictive performance across different preprocessing methods. We focus on the preprocessing methods based on the recommended Human Connectome Project (HCP) denoising options (Burgess et al., 2016). In the Supplementary Data, we investigate the effect of varying changes in the preprocessing pipeline, including the effect of independent component analysis (ICA) denoising, choice of noise regressors, and whether to regress out the experimental design.
Materials and Methods
Data acquisition
MRI recording was performed using a standard 12-channel head coil on a Siemens 3T Trio Magnetic Resonance Imaging System with TIM, housed in the Center for Cognitive and Behavioral Brain Imaging at the Ohio State University (OSU). BOLD functional activations for tasks were measured with a T2*-weighted echo-planar image sequence (repetition time = 2000 ms, echo time = 28 ms, flip angle = 72°, field of view = 222 × 222, in-plane resolution = 74 × 74 pixels or 3 × 3, 38 slices with thickness of 3 mm). The resting-state acquisition had higher resolution (repetition time = 2500 ms, echo time = 28 ms, flip angle = 75°, in-plane resolution = 2.5 × 2.5, 44 slices with thickness of 2.5 mm). T1-weighted structural images were acquired for each subject with the three-dimensional magnetization-prepared 180° radio-frequency pulses and rapid gradient-echo (MPRAGE) sequence (1 × 1 × 1 mm3 resolution, inversion time = 950 ms, repetition time = 1950 ms, echo time = 4.44 ms, flip angle = 12°, matrix size = 256 × 224, 176 sagittal slices per slab; scan time 7.5 min).
Stimuli were presented to subjects on a rear projection screen through a mirror on top of the head coil. Visual stimuli were generated on a Windows computer running MATLAB programs based on Psychtoolbox extensions. Subjects were recruited from the OSU and the surrounding community, and gave informed consent. The experimental protocol was approved by the Institutional Review Board at OSU. A total of 250 subjects participated in the study, but only 174 of them (age 18–39, mean 21.6; 63 males and 111 females) were included in the data analysis. A subject was excluded if, during any of the tasks, part of the cerebral cortex was out of the field of view due to head motion.
During the 1.5-h MRI session, each subject performed eight behavioral tasks designed to target basic cognitive functions: emotional picture viewing (360 sec) (Cunningham et al., 2010), emotional face viewing (360 sec) (Decety et al., 2010), episodic memory encoding (304 sec), episodic memory retrieval (252 sec) (Maril et al., 2003), Go/No-go (360 sec) (Simmonds et al., 2008), monetary incentive (456 sec) (Knutson et al., 2001), working memory (354 sec) (Xue et al., 2004), and theory of mind stories/questions (376 sec) (Dodell-Feder et al., 2011). Resting-state scans were also recorded for each subject (360 sec). Task descriptions are presented in Supplementary Table S1. For convenience of description, resting state is treated as one of the nine tasks.
Of the 174 subjects, 19 subjects returned and repeated the experiment ∼2.8 years (SD = 0.4) later. We refer to this group of subjects as the target group as all machine learning evaluations focus on this group.
Data processing
For fMRI preprocessing, we used the parameters proposed in the minimal preprocessing pipelines of the HCP (Glasser et al., 2013) when applicable. Specifically, functional brain images were realigned to compensate for head motion, spatially smoothed (2-mm FWHM Gaussian kernel), normalized with a global mean, and masked with the final brain mask. The functional images were then coregistered to the T1-weighted images, normalized to the standard brain, and further refined using nonlinear registration in FSL (FMRIB software library, version 5.0.8. Due to spatial resolution of our acquisition, images were not projected to surface space, so the minimal spatial smoothing was performed in volume space.
To denoise the functional data, we followed the HCP FIX-denoising procedures (Burgess et al., 2016), including first lenient high-pass temporal filtering (2000-sec cutoff), motion regression, ICA-based denoising, and mean global time series (MGT) regression. Additional high-pass filtering (200-sec cutoff) was conducted after regression of the confounding time series. Finally, for the BV measures, we partialled out the mean framewise displacement.
Images were parceled into 299 ROIs using a functional atlas derived by functional clustering of an outside data set at the University of Western Ontario (Craddock et al., 2012). A mask was used to remove edge voxels to prevent the machine learning classifiers from classifying subjects on the basis of edge-cortex misalignment artifacts created during brain coregistration. To create the mask, we removed any voxels that had low mean intensity in any scan. We removed all ROIs with any voxels that were removed (which is the most conservative approach for removing edge affects, e.g., as opposed to removing ROIs based on a threshold of percentage of voxels removed). The procedure results in 269 ROIs for the subsequent analyses (see Supplementary Figure S1).
Feature generation
We use the term FC to refer generally to any set of features requiring computing the covariance, and BV to refer to any set of features requiring computing only the variance. For the time series from each task and subject, we compute FC using three different approaches that all depend on entries of the covariance matrix: (i) the Pearson correlation (FCP), (ii) the off-diagonal entries of the covariance matrix (FCC), and (iii) the full covariance matrix (FCCV). FCP and FCC exclude direct information about the variance. However, FCP uses the variance as a normalizing term (Fig. 2). We compute BV using three different approaches: the variance (BVV), the standard deviation (BVSD), and the mean absolute deviation (BVMAD).
Machine learning approach
Our analysis consists of two prediction tasks: task prediction and subject identity prediction. The goal of task prediction is to predict which task a test subject was performing, given features computed from the scan (random performance amounts to 1/9 = 11% accuracy). The goal of subject identity prediction is to predict which subject generated a test scan, given features computed from the scan (random performance amounts to 1/174 = 0.57% accuracy). Task prediction and subject identity prediction are evaluated in two settings: within-session and between-session. For within-session prediction, all training and test data are taken from session 1. For between-session prediction, training data are taken from session 1 and test data are taken from session 2. For task prediction, we exclude session 1 scans of the target group from training so that the classifier learns from only task-related (i.e., not subject-related) information. Because fewer subjects participated in session 2, we restrict test sets to only the target group (i.e., 19 subjects who were scanned in both sessions 1 and 2), allowing us to directly compare within-session and between-session performance. However, note that for the subject identification task, the models were not informed of this restriction and have to discriminate between all 174 subjects who participated in the experiment.
We used multinomial logistic regression (LR) for task prediction. To be consistent with previous analyses (Finn et al., 2015), we used single nearest neighbor (1-NN) models for subject identity prediction. Both classes of models are evaluated using accuracy and we test for significant differences in model performance by computing 95% highest posterior density credible intervals and assessing whether intervals for models overlap. Details of model evaluation for each class of models are specified in the next section.
Multinomial LR
Regularized multinomial LR models (Hoerl and Kennard, 1970; Tibshirani, 1996; Zou and Hastie, 2005) learn to discriminate between multiple class labels for a given data point. Feature weights are regularized using a choice of norm (L1, L2, elastic) and a parameter λ that controls the strength of regularization. We use an L2 penalty and a nested cross-validation routine to optimize λ over the set {1x, x
We used stratified nested cross-validation with five outer folds and two inner folds to evaluate and select models. The cross-validation procedure was stratified to guarantee that for subject prediction, a particular test subject always had some data used for training. We select models in the inner loop using out-of-sample accuracy and report accuracy on outer loop test data (not used for the inner loop). We performed an additional analysis using L1 LR to quantify the predictive performance of BV versus FC for the most informative features. We sweep through values of the regularization parameter to create models that vary in the number of nonzero (functional) features and analyze model accuracy as a function of the number of nonzero features.
Nearest neighbor model
In contrast to LR models that learn from information across tasks, our 1-NN models were restricted to information from pairs of tasks where one was used for test and the other could be thought of as a training set. In principle, the 1-NN model could be set up analogously to the LR model, but we replicated analyses used in previous work (Finn et al., 2015) that were used to investigate whether functional signatures indicative of subject identity are preserved across pairs of tasks.
Each 1-NN model took as input a test instance from task A and a set of labeled training instances from all subjects in task B, where each instance comprised features computed from a scan from a particular subject in a particular task. The predicted identity was the identity of the subject corresponding to the nearest training instance, where we defined similarity using the Pearson correlation. For between-session prediction, we iterated through all pairs of tasks A and B. For within-session prediction, we excluded pairs consisting of the same tasks (e.g., A-A) because each task was performed only once per session. To give a comparable setup to LR task prediction, the test instances were always chosen from the target group and training instances were always chosen from session 1.
Results
Data and analyses reported in this article are publicly available on the Open Science Framework. First, we examine patterns in BV organized by subjects and tasks. Next, we show the performance of the machine learning classifiers. We contrast the relative diagnosticity of BV and FC in the three prediction tasks. Finally, we overview the impact of different preprocessing options on prediction results.
Visualizing BV
Figure 3 shows BVSD for the target group of subjects in session 1 (panel A) and session 2 (panel B). Rows are first grouped by subject and then by task. Columns are first grouped by brain lobe and then by ROI. The results show subject-specific patterns in BV that are preserved between sessions. For example, subjects 2, 7, and 9 have relatively high BV in both sessions regardless of task, and subject 18 seems to have relatively low BV in both sessions regardless of task. None of these subjects with outlying BV was outlying in demographic categories (weight, age, height, race). Subject 5 has relatively low frontal BV, but average occipital and parietal BV. In addition, the results show lobe-specific effects that are also preserved between sessions. For example, limbic BV is on average lower than parietal BV. The variance in BV between regions in the occipital lobe is higher than in other lobes.
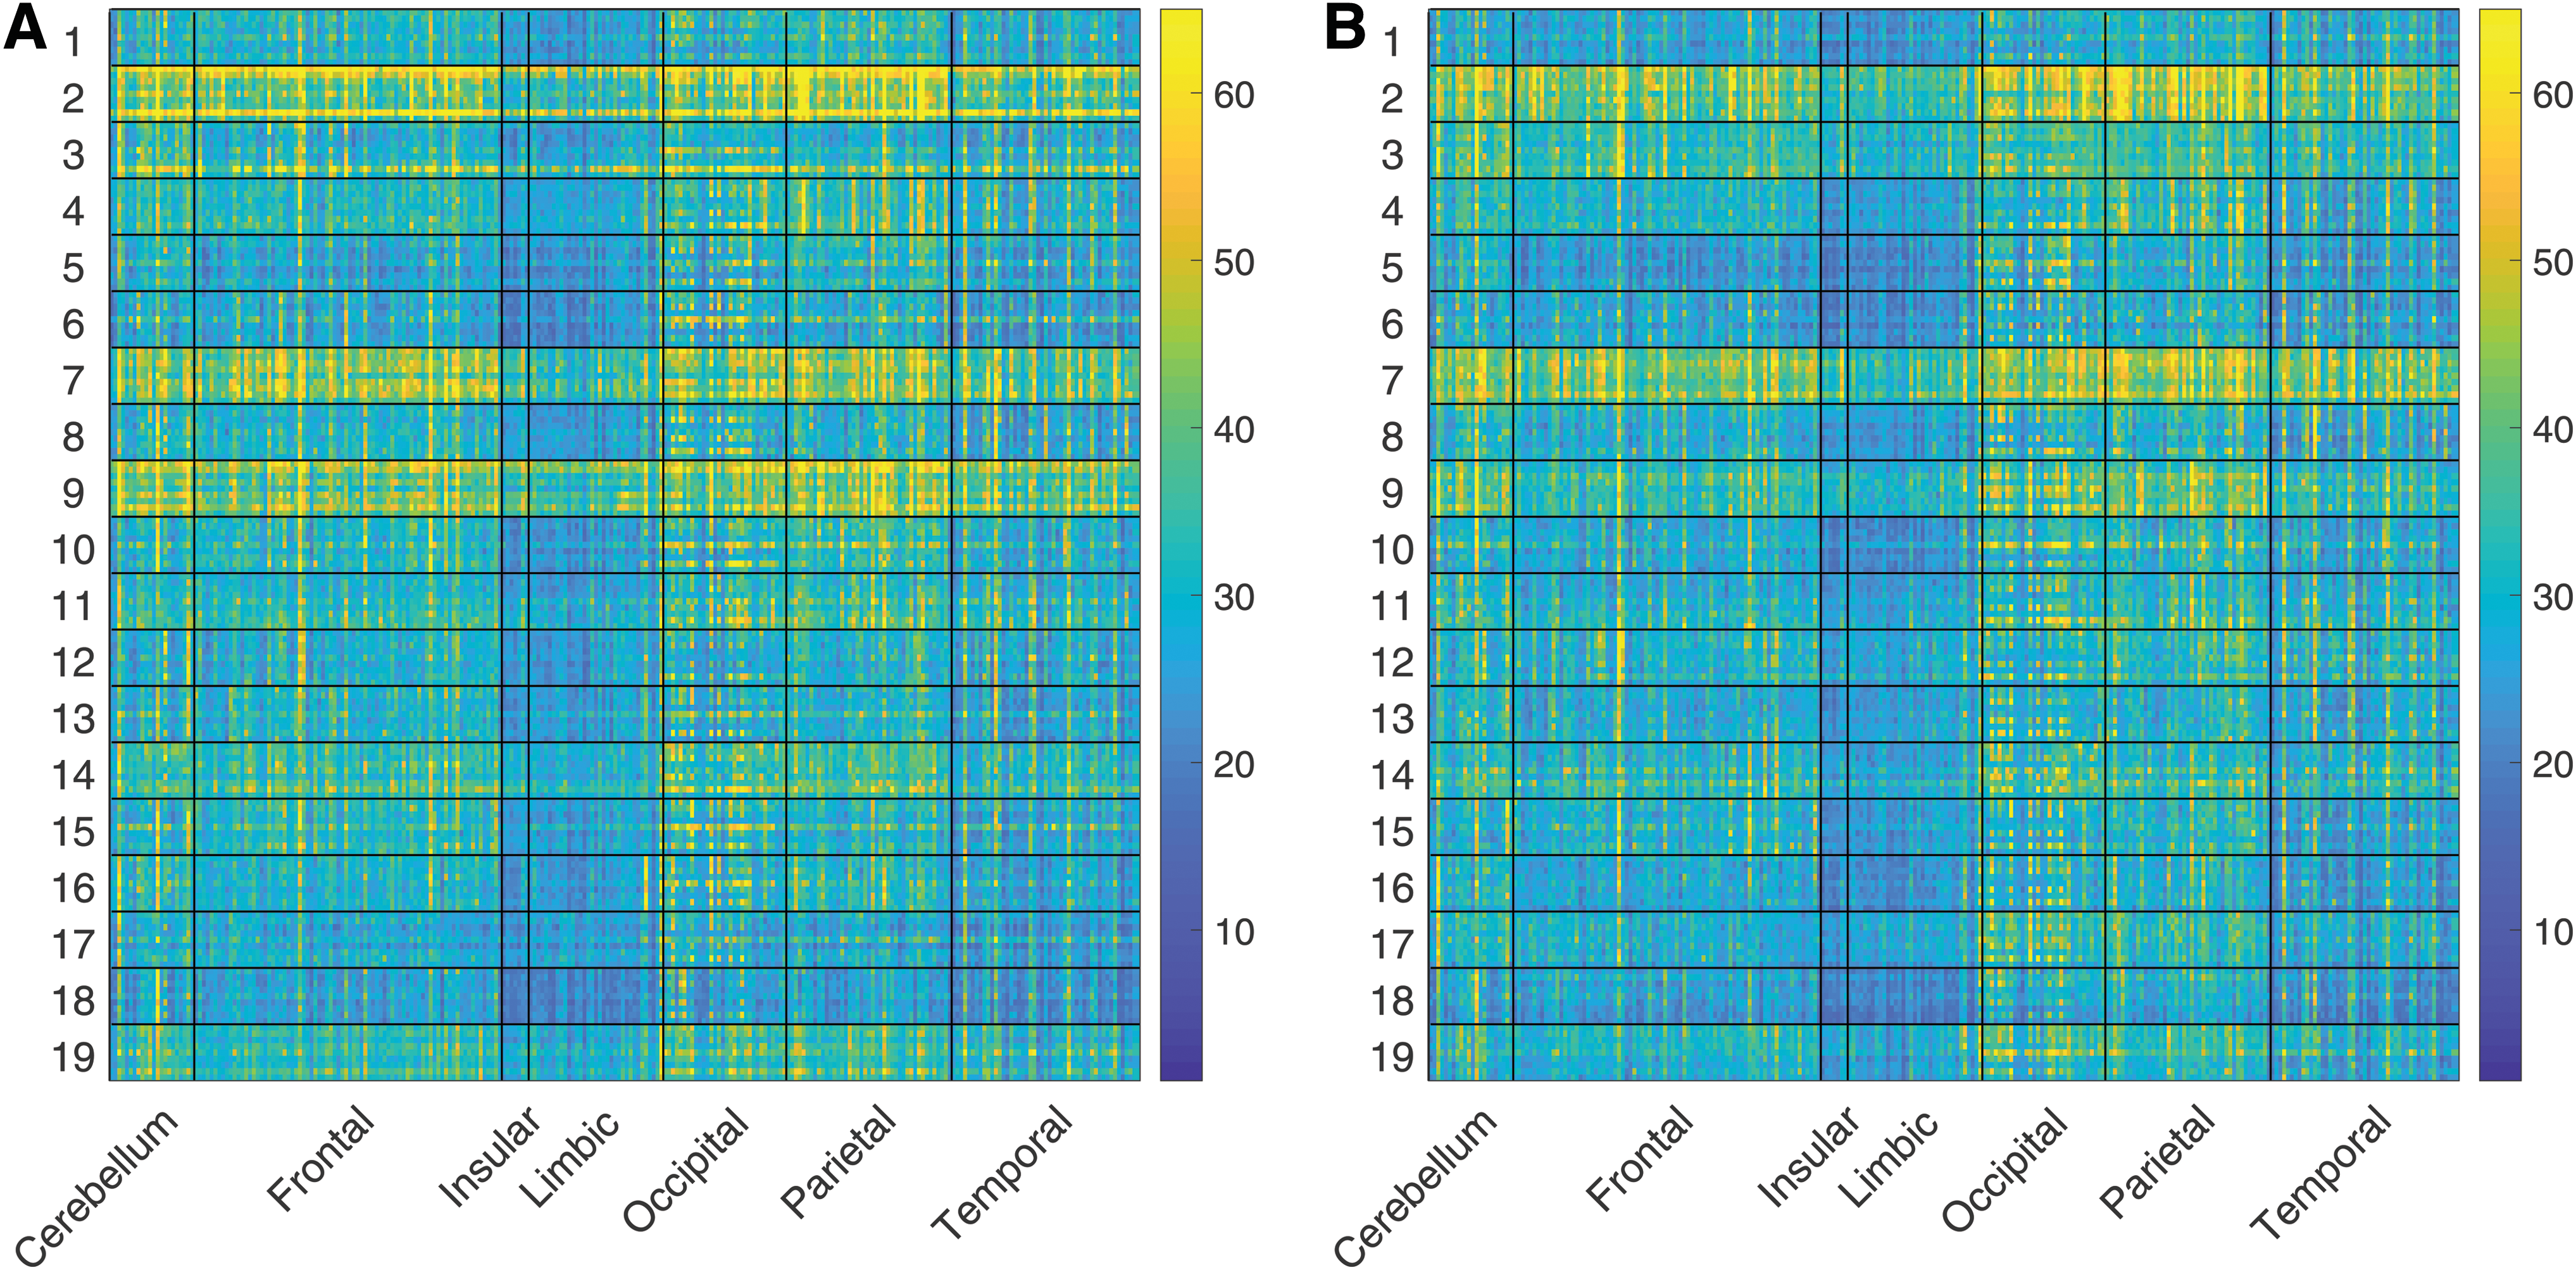
BV for 19 subjects from session 1
Figure 4 shows BV (computed by BVSD) for the target group subjects in session 1 (panel A) and session 2 (panel B). Rows are first grouped by task and then by subject. Columns are first grouped by brain lobe then by ROI. When ordered by task, BV shows patterns that are preserved across sessions (e.g., lobe-specific or task-specific effects). For example, occipital activation is higher for the working memory task, and temporal activation is higher during resting state. Aside from these two effects, based on visual inspection of Figure 4, the BV patterns do not seem to be task specific. However, the machine learning models (discussed in the next section) demonstrate that the patterns contain diagnostic information that distinguishes the tasks.

BV for 19 subjects from session 1
Finally, we can re-examine known effects of FC through the lens of BV. For example, research has shown a reduction of covariance in the default mode network during task compared with rest (Greicius et al., 2003). We examine whether a similar result can be extended to BV. Figure 5 shows resting-state BV versus nonresting-state BV in each ROI averaged over all subjects and tasks. Analogous to the effect in FC, for almost all ROIs, resting-state BV is higher than task BV (p < 1e-38, t = 18.6, df = 267).
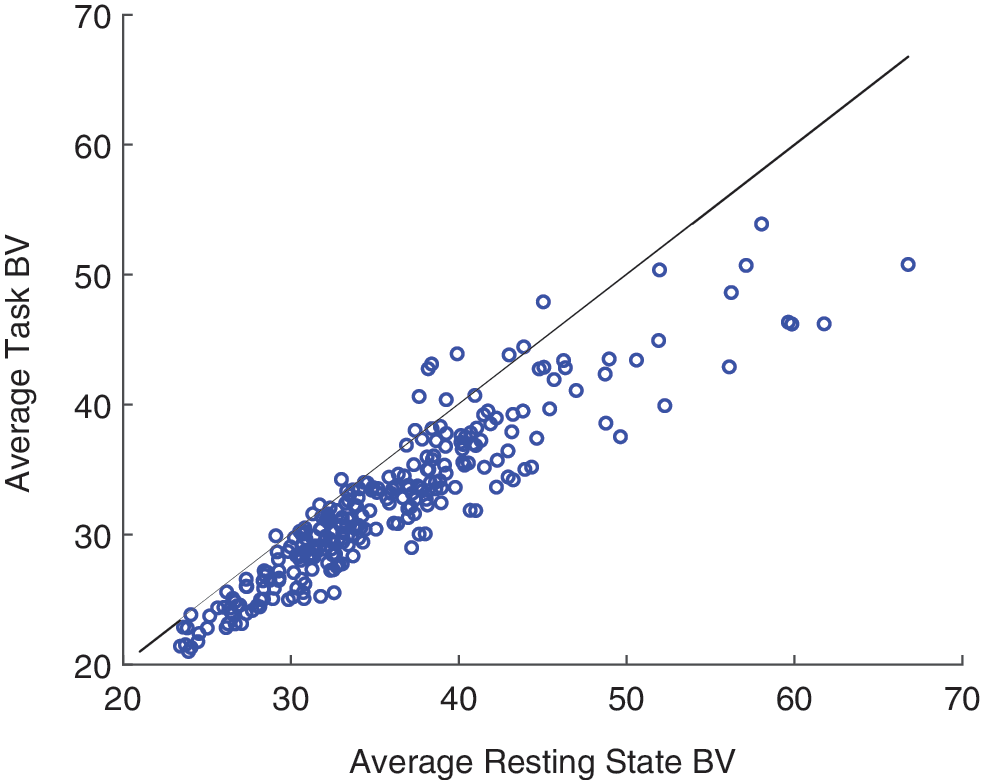
BV in a resting-state task versus nonresting cognitive tasks. Each point represents an individual ROI (averaged over subjects) and the reference line indicates equal BV in resting- and nonresting-state tasks. Color images are available online.
Task prediction
Task out-of-sample LR prediction accuracy and associated 95% credible intervals are reported in Table 1 (see Supplementary Data for details of credible interval computation). Overall, BV and FC accurately predict task. All models show performance well above chance (1/9 = 11%) for all feature sets. However, nonoverlapping credible intervals show a significant performance benefit when using FC versus BV. In addition, within-session performance is consistently better than between-session performance across all feature sets. The difference between within-session and between-session accuracy is lower on average for BV (8%) versus FC (10%), suggesting that FC contains more session-specific information than BV. The particular method of computing FC does not strongly affect predictive performance, but there is some suggestive evidence that BVSD leads to more accurate predictions than BVV, which might be due to a stabilizing effect on the within- and between-subject BV distributions.
Task Classification Predictive Accuracy
Predictive accuracy (percentage correct) of the logistic regression model for task classification for different methods of computing FC and BV and method for assessing generalization (within or between scanning sessions). The 95% credible interval is reported in parentheses.
BV, blood-oxygen-level-dependent variability; BVV, BV is computed using the variance; BVMAD, BV is computed using the mean absolute deviation; BVSD, BV is computed using the standard deviation; FC, functional connectivity; FCC, FC is computed using the covariance matrix minus diagonal; FCCV, FC is computed using the full covariance matrix; FCP, FC is computed using the Pearson correlation.
To understand the relative performance differences between BV and FC, we compare the confusion matrices for within-session classification in Figure 6. Some cognitive tasks are more difficult to discriminate on the basis of BV. For example, the emotional faces and emotional pictures tasks (both involving emotional processing despite different visual inputs) and encoding and retrieval tasks (both involving episodic memory) are occasionally confused on the basis of BV but less so for FC, suggesting that FC contains unique information that discriminates between these tasks. For resting state and Go/No-go, discrimination using BV is comparable with FC. The FC model makes more errors than the BV model for only two cells in the confusion matrix (Go/No-go-emotional faces and emotional faces-encoding). In addition, the structure of errors is similar between BV and FC (i.e., the two models tend to make errors on similar pairs of tasks). The nondiagonal elements of the confusion matrices have a Pearson correlation of 0.45, suggesting that BV and FC make similar types of errors, but that BV makes those errors more often.
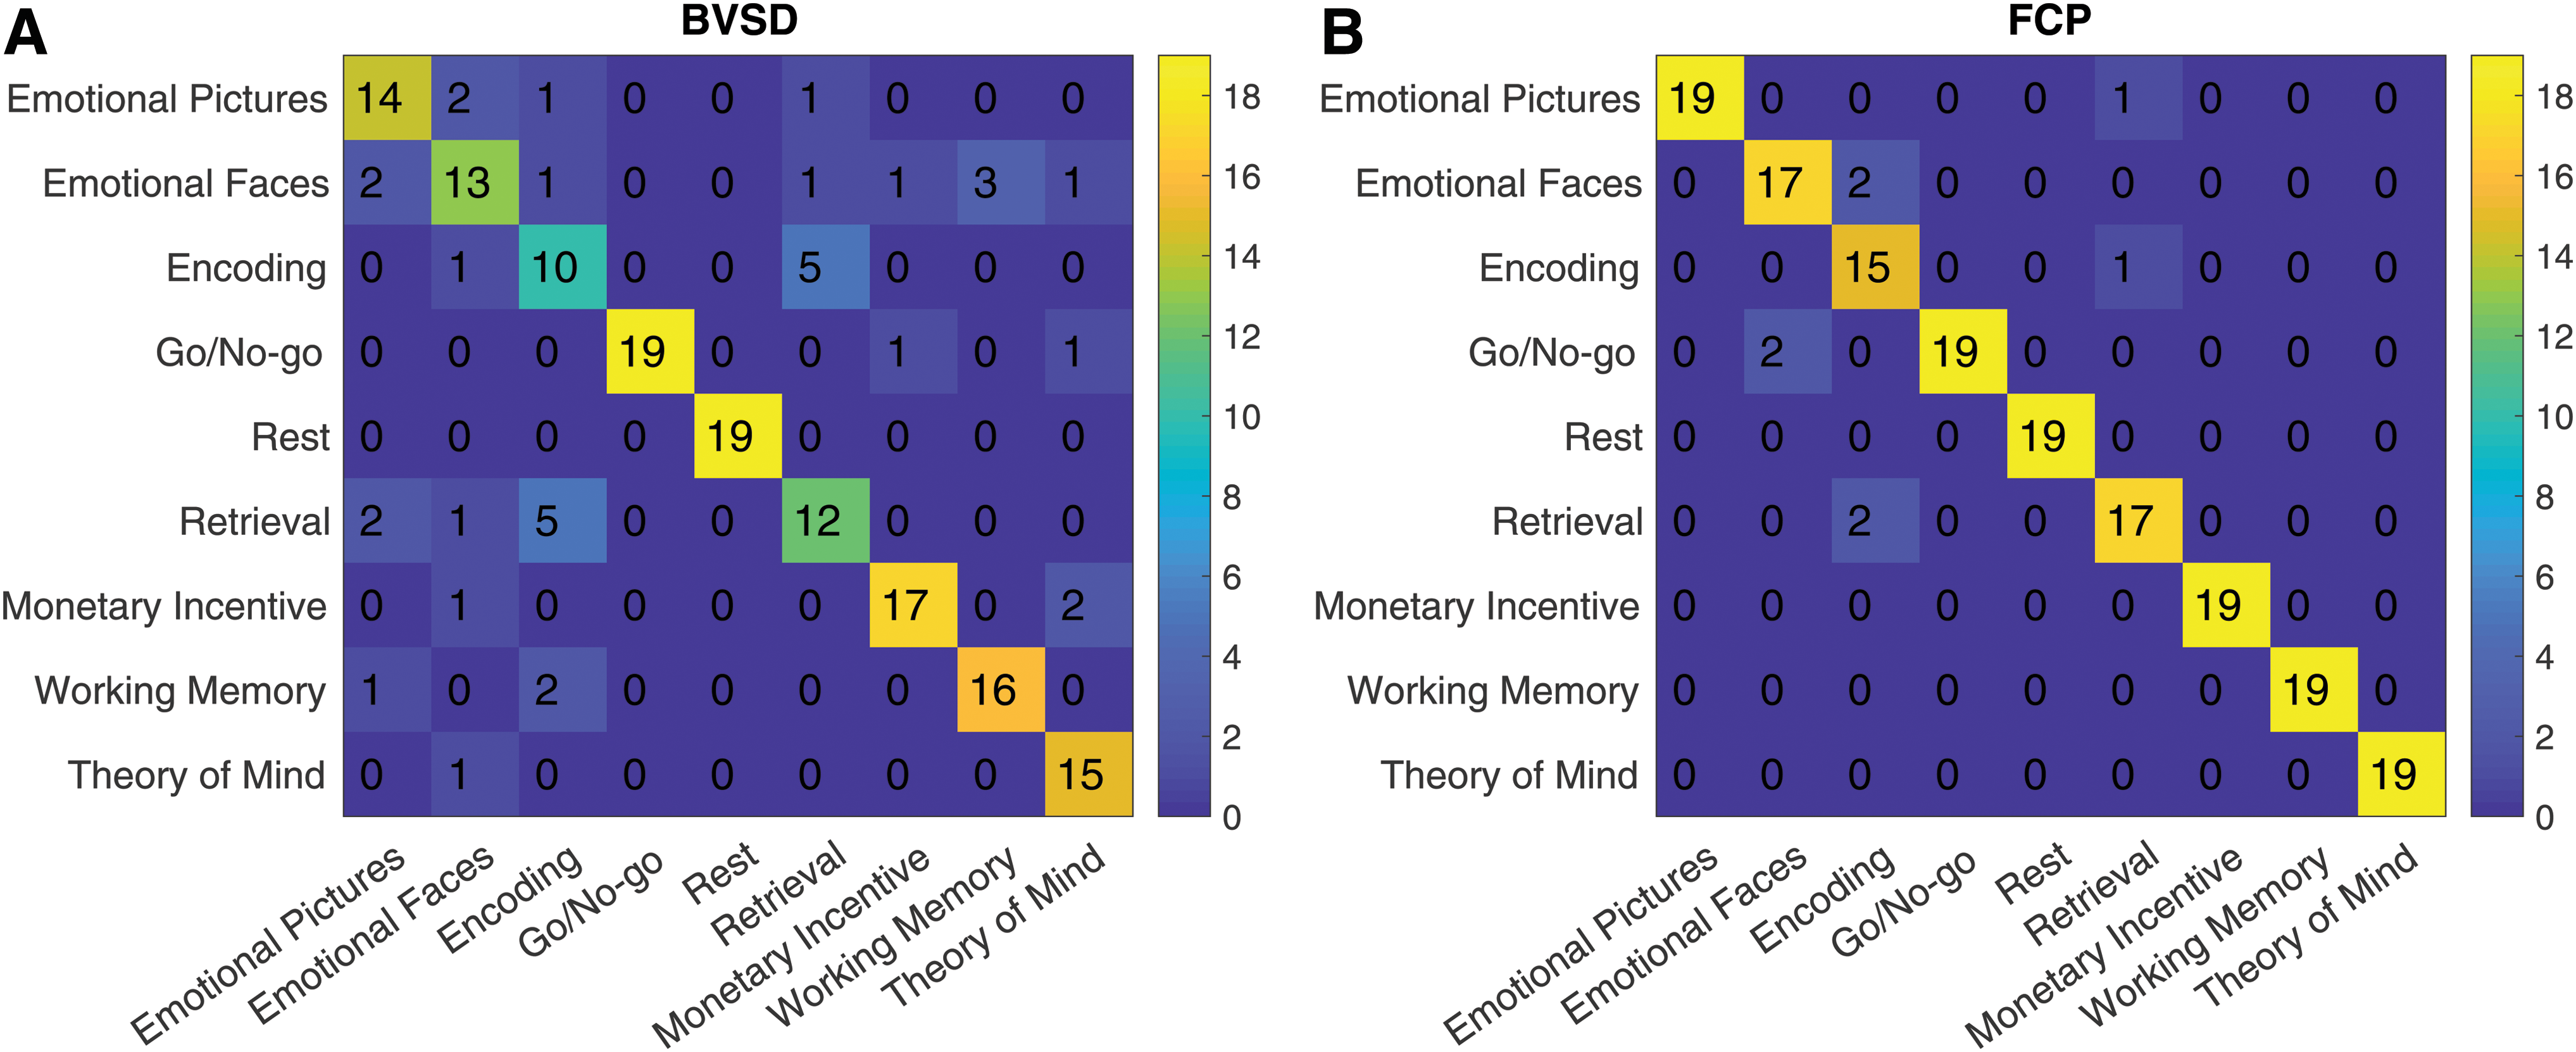
Confusion matrices for task prediction using BV
Model performance for varying number of features
Although we used regularization to reduce the freedom of the models to use all available features, it is possible that the advantage for FC over BV could simply be due to the number of features available to the classifier. Figure 7 shows the results of task classification when we vary the regularization parameter in L1 models (each point represents a model that corresponds to a specific regularization parameter), leading to variation in the number of nonzero features, allowing a comparison between FC and BV for the same number of features. We report the test accuracy and number of nonzero features for each model and estimate an LOWESS curve for the relationship between accuracy and nonzero features. BVSD and FCP perform similarly for between 1 and ∼600 nonzero features, after which there emerges a clear advantage to using FC. Therefore, the advantage for FC over BV can be attributed to a difference in the diagnosticity of the features and not simply the number of features.
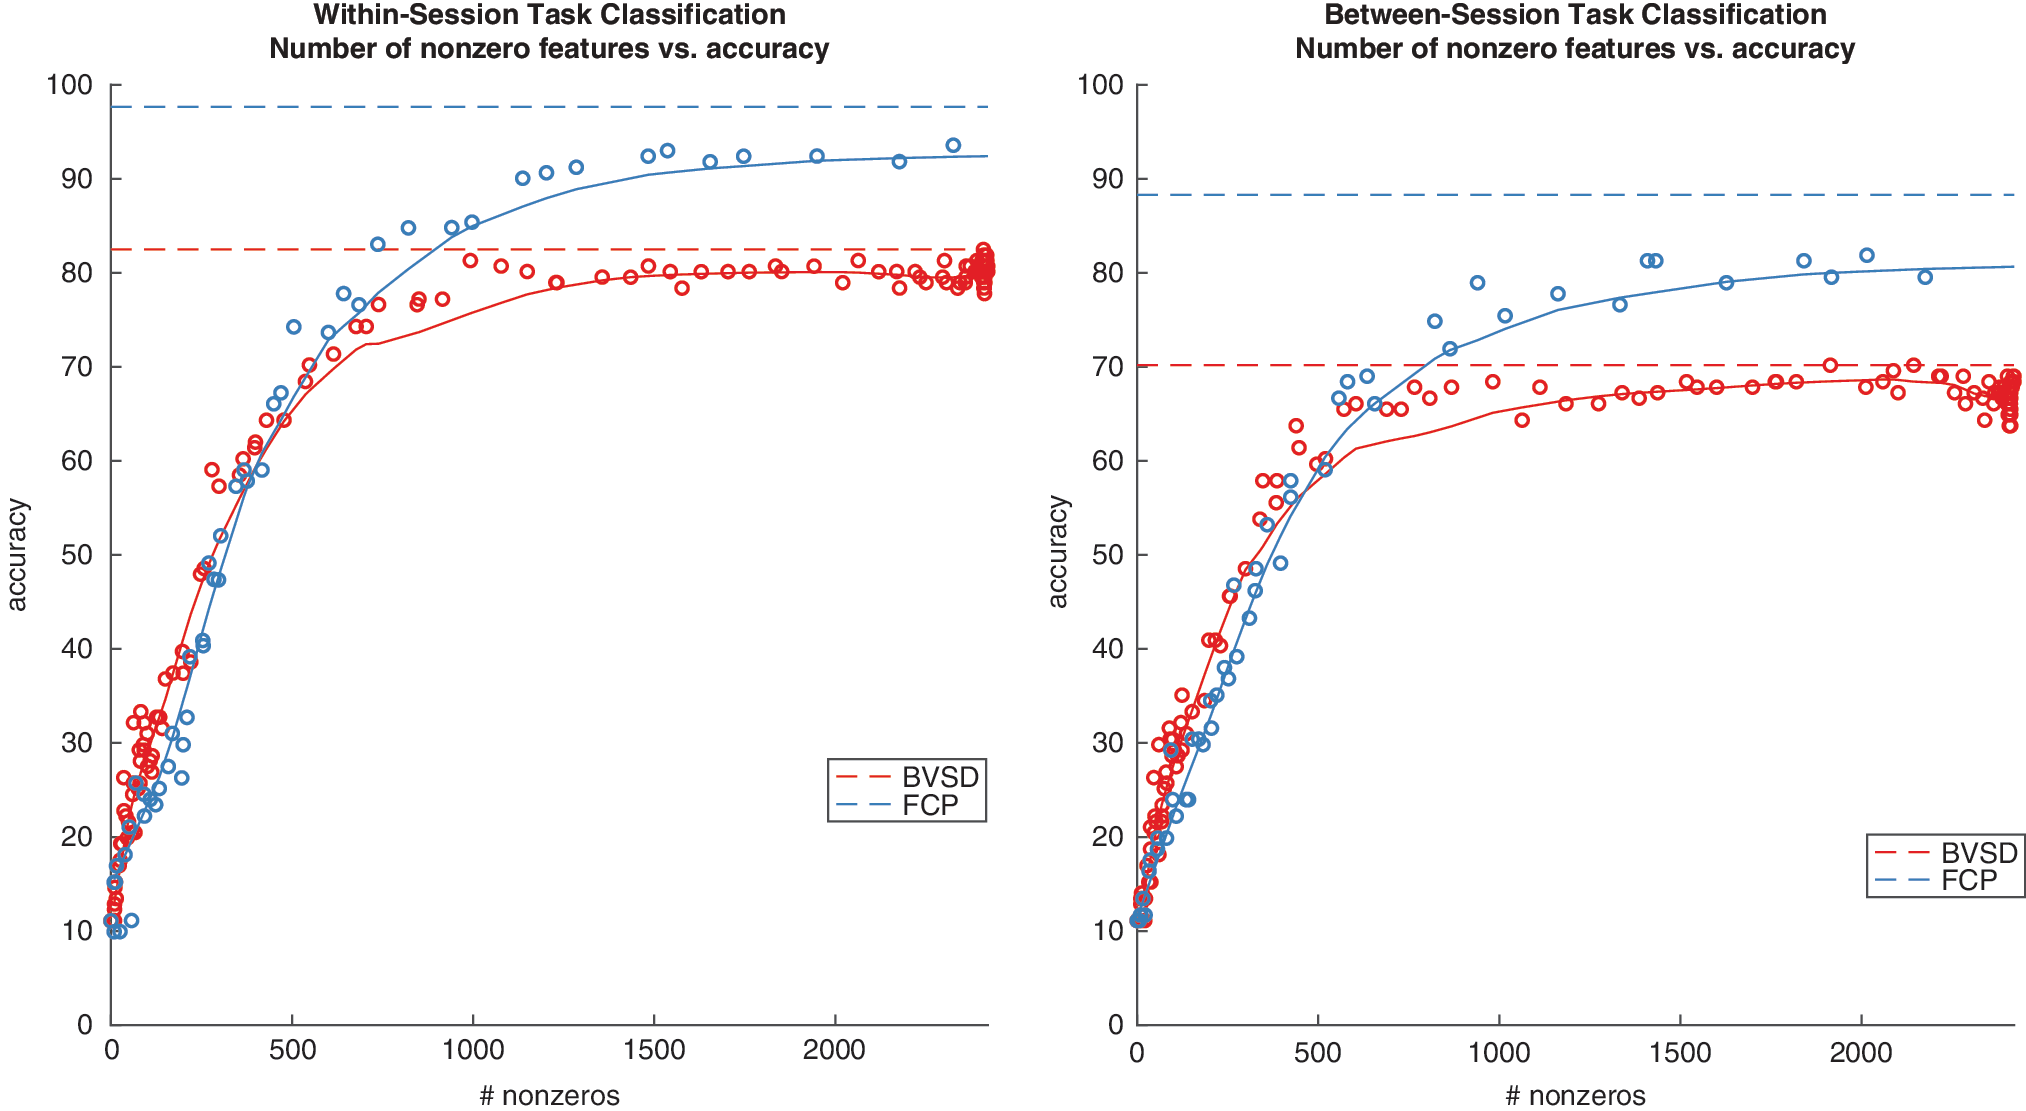
Scatter plot of task classification accuracy versus the number of nonzero features in L1 models. Each point represents a model that corresponds to a specific regularization parameter. The solid curves are the estimated LOWESS curves for the relationship between accuracy and nonzero features for BVSD (red) and FCP (blue). The dotted lines are the accuracies for the best performing models for BVSD (red) and FCP (blue). Note that as each of the 9 behavioral tasks is associated with 269 features, the maximum number of nonzero features is 9*269 = 2421. Color images are available online.
Subject identity prediction
Out-of-sample subject prediction accuracy and 95% credible intervals for the 1-NN models are reported in Table 2. Subject identity performance is high regardless of features used (chance performance is 1/174 = 0.57%). There is overlap in credible intervals for within-session overall accuracy for all feature types except for BVV and FCC, which perform significantly worse than the other methods examined. There is no significant overall within-session performance advantage for the other methods used. BVSD and FCCV significantly outperform the other methods at overall between-session prediction.
Subject Classification Predictive Accuracy
Subject classification predictive accuracy (percentage correct) and 95% credible intervals for the nearest neighbor models using different methods of computing FC and BV. For each model, accuracy is tested within-session and between-session. For between-session accuracy, we report whether the training and test image were selected from the same task, different tasks (including rest/task pairs), or from rest/rest pairs.
There are between-session performance differences based on whether the training and test images were recorded from the same task, from different tasks, or from rest. For all methods used to compute BV and FC, same task-to-same task accuracy is significantly higher than different task-to-different task accuracy (95% credible intervals do not overlap). For all methods, accuracy is significantly higher for same task-to-same task prediction compared with rest-to-rest prediction. Accuracy for different task-to-different task prediction is not significantly different than rest-to-rest accuracy. We suspect that given more rest-to-rest observations, this difference would become significant; the relatively low number of rest-to-rest outcomes (one per subject) compared with different task-to-different task outcomes (72 per subject) or same task-to-same task outcomes (8 per subject) leads to larger rest-to-rest credible intervals.
Pairwise subject identification accuracy
The primary purpose of using nearest neighbor models is to build on past results by Finn et al. (2015), who investigated how subject-specific FC is preserved across tasks. Figure 8 shows subject identity prediction accuracy as a function of training and test task. The x-axes show the training task and the y-axes show the test task. Prediction accuracy is averaged over subjects. The top panels and the lower panels correspond to BV and FC, respectively. The left panels and right panels correspond to between-session and within-session, respectively. Within-session accuracy is higher than between-session accuracy for both FC and BV, which is consistent with classifier results in Table 2. For between-session prediction, performance is best when generalizing between the same tasks.
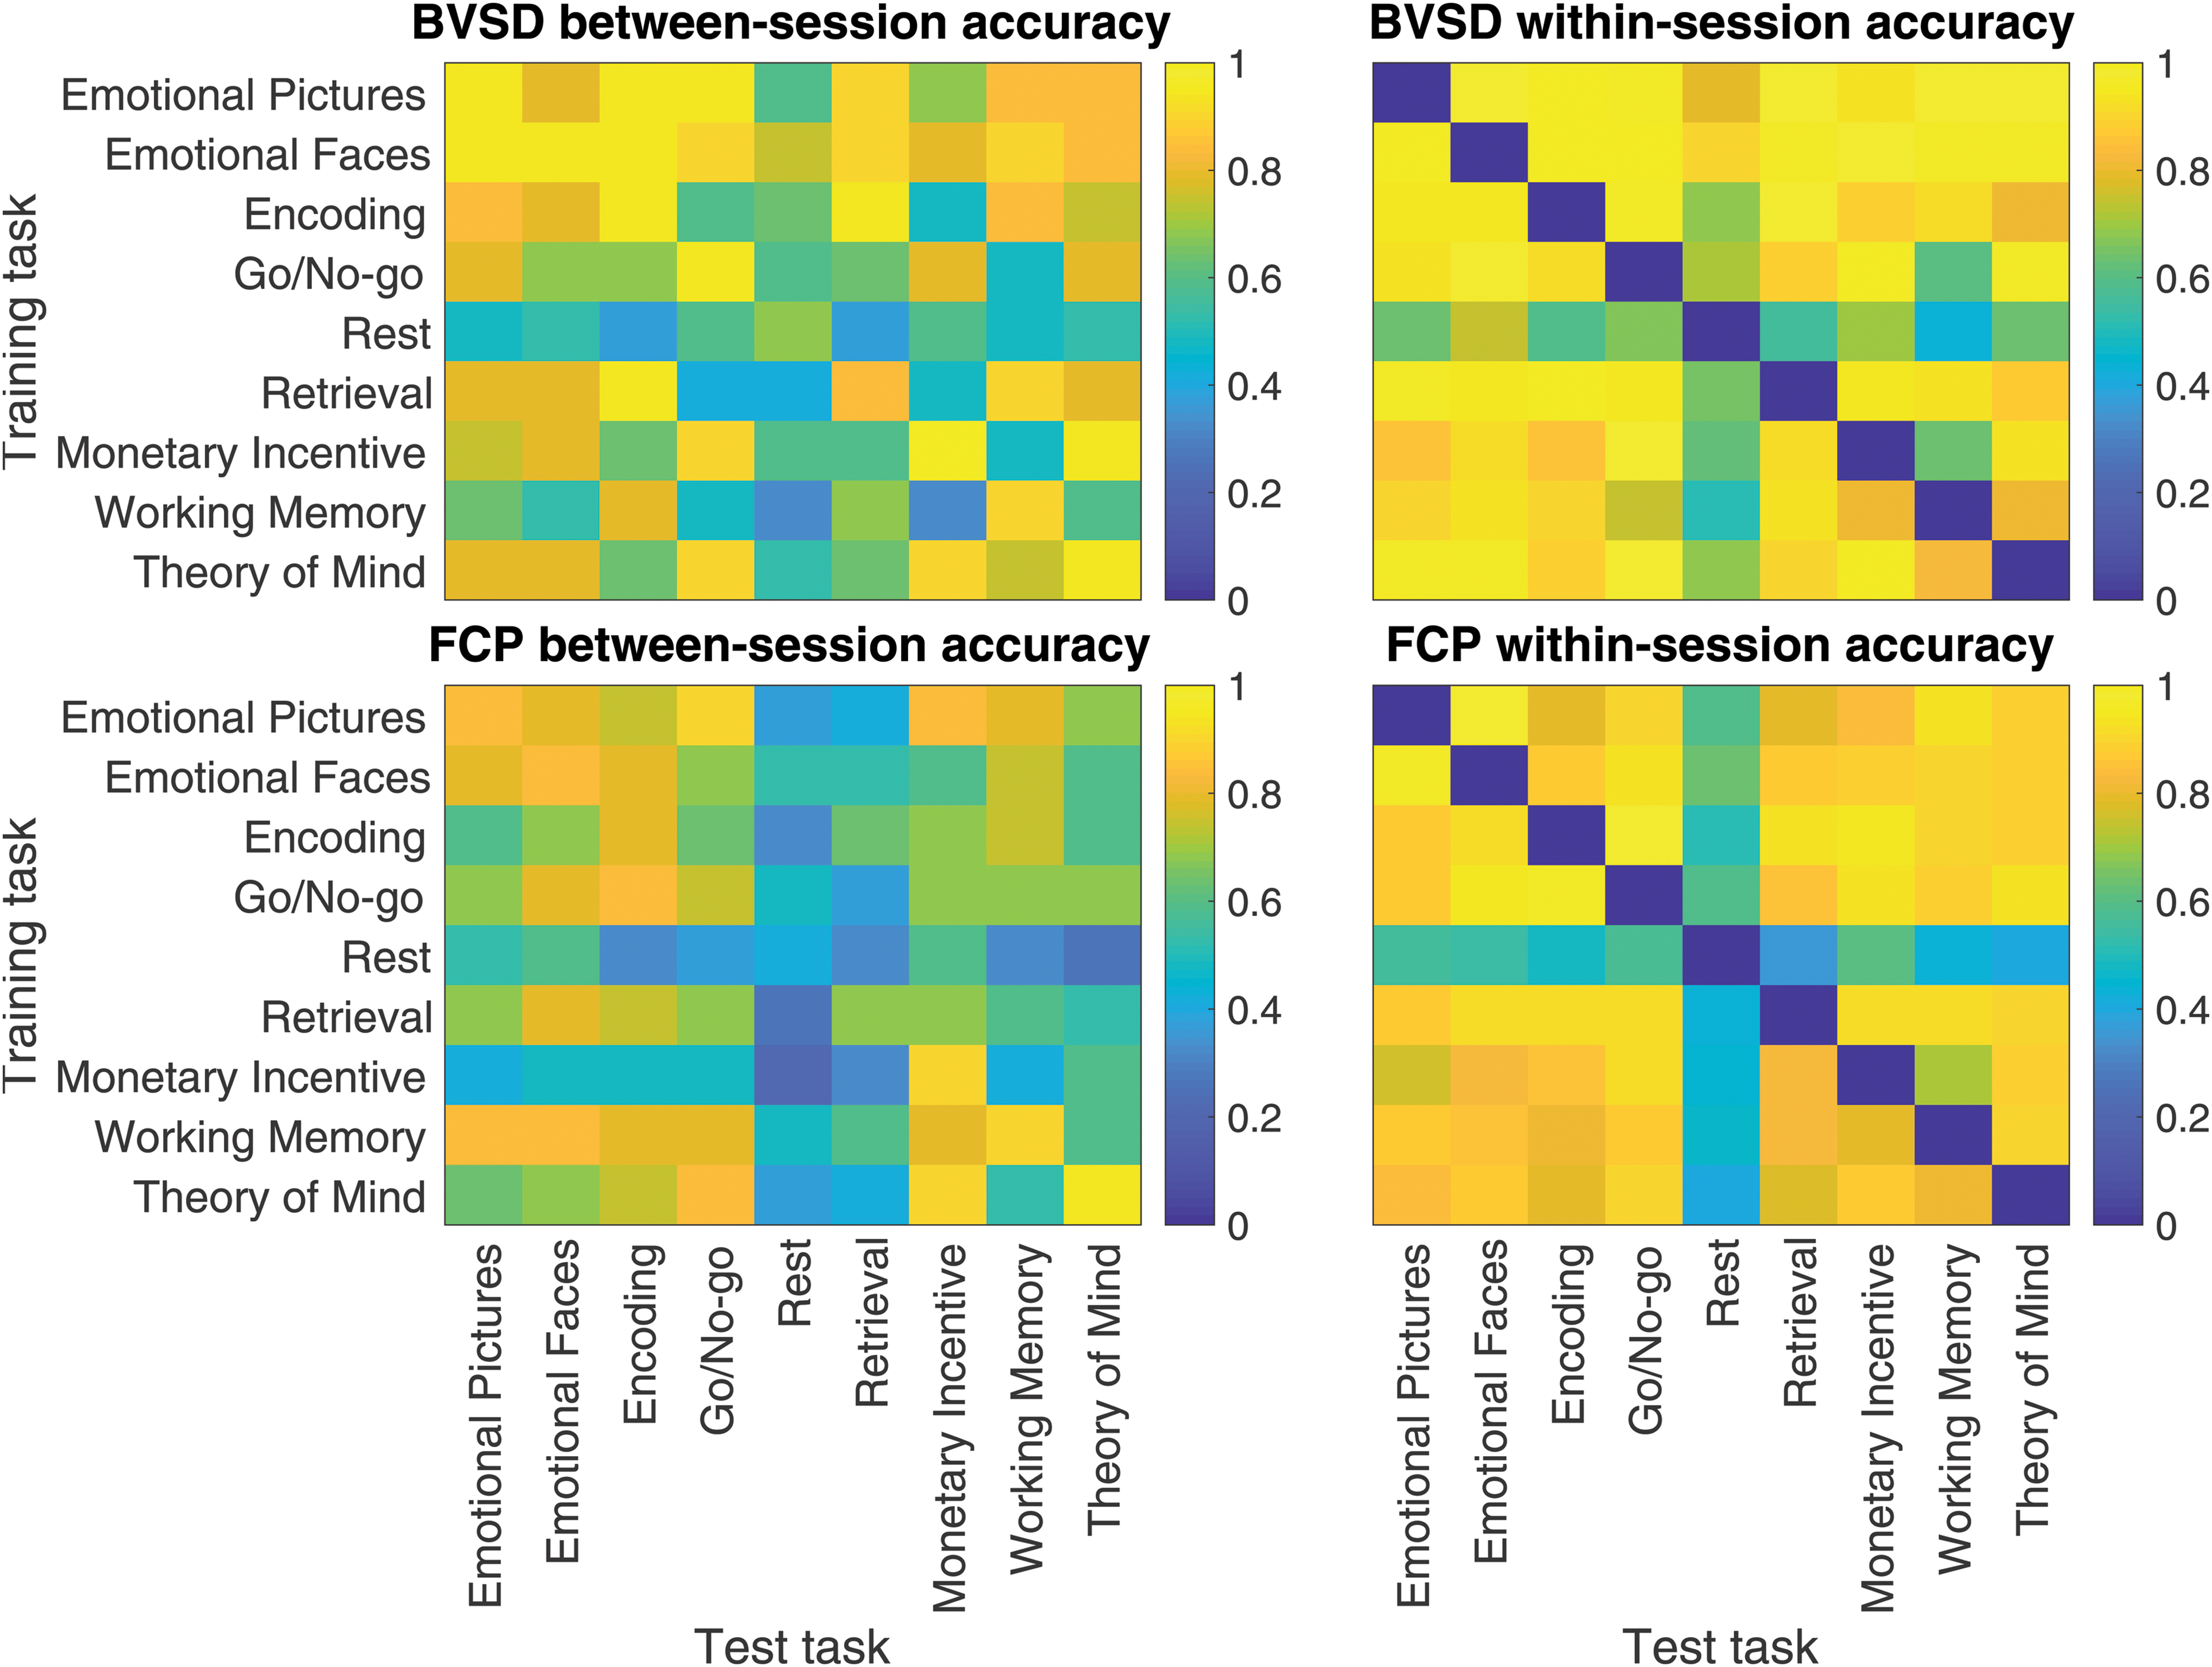
Heatmaps of between- and within-session average subject identification accuracy ordered by task. The x-axis shows the task from which test scans were taken and the y-axis shows the task used to predict subject identity. Color images are available online.
In the previous framework, Finn et al. (2015) compared nearest neighbor subject identity prediction performance across sessions using FCP. They used three types of train/test pairings: FCP from resting state, FCP from rest and another task, and FCP from two different tasks. They found that rest-to-rest prediction is most accurate (92.9%) and that accuracy rates ranged from 54.0% to 87.3% for other database and target pairs, including rest-to-task and task-to-different task comparisons. Our analysis includes the additional setting where the training and test sets are from data recorded from the same task. We find that FCP prediction performance is highest for the task-to-same task setting (83%), followed by task-to-different task (60%), and rest-to-rest (42%). Overall, our average accuracy is lower (62% vs. 82.1%), but the performance difference could be attributed to longer time between scanning sessions (2.8 years vs. 2 days), incorporating nondiscriminative data (data from 155 nontarget group subjects) into our framework, or scan length discrepancies (our scans were between 4 and 6 min, while HCP scans were between 4 and 30 min).
Robustness to preprocessing variations
To explore the effects of preprocessing options on the results, we created four different preprocessing variations from the HCP pipeline (details are presented in Supplementary Data, and Supplementary Table S2). The pipeline differed on (i) whether or not to perform ICA denoising, (ii) whether or not to regress out the experimental design, and (iii) to regress out cerebrospinal fluid (CSF) and WM or to perform MGT signal regression (Burgess et al., 2016).
We found that high predictive performance is largely robust to the choice of preprocessing pipeline (see Supplementary Tables S3, S4, S5, S6 and Supplementary Figures S2, S3, S4). Two notable exceptions were that (i) regressing out the experimental design decreased overall task prediction performance and improved overall subject classification performance and (ii) regressing out CSF and WM led to increased subject classification performance compared with regressing out MGT for BV, but not FC.
Brain areas predictive of task and subject identity
To better understand what brain regions are predictive of task or subject identity, Figure 9 visualizes the diagnosticity of different brain areas for BV (using BVV). Figure 9A shows for each brain region the absolute values of the BVV features from the LR model, summed across tasks. With this summary statistics, we capture not just which brain regions are predictive of a specific task, but what brain regions generally discriminate across all nine tasks. Other summary statistics such as the maximum of the absolute value or the mean produced similar results. The results show that the visual cortex, dorsal attention network, and part of the default mode network, among other regions, are predictive of task differences. Figure 9B show the corresponding visualization for subject identity prediction. To produce this visualization, we ran an LR model on the subject identity problem and averaged the absolute values of each region across all subjects. The results show that the cingulo-opercular network, thalamus, and dorsal attention network regions, among others, are diagnostic for discriminating between different subjects.
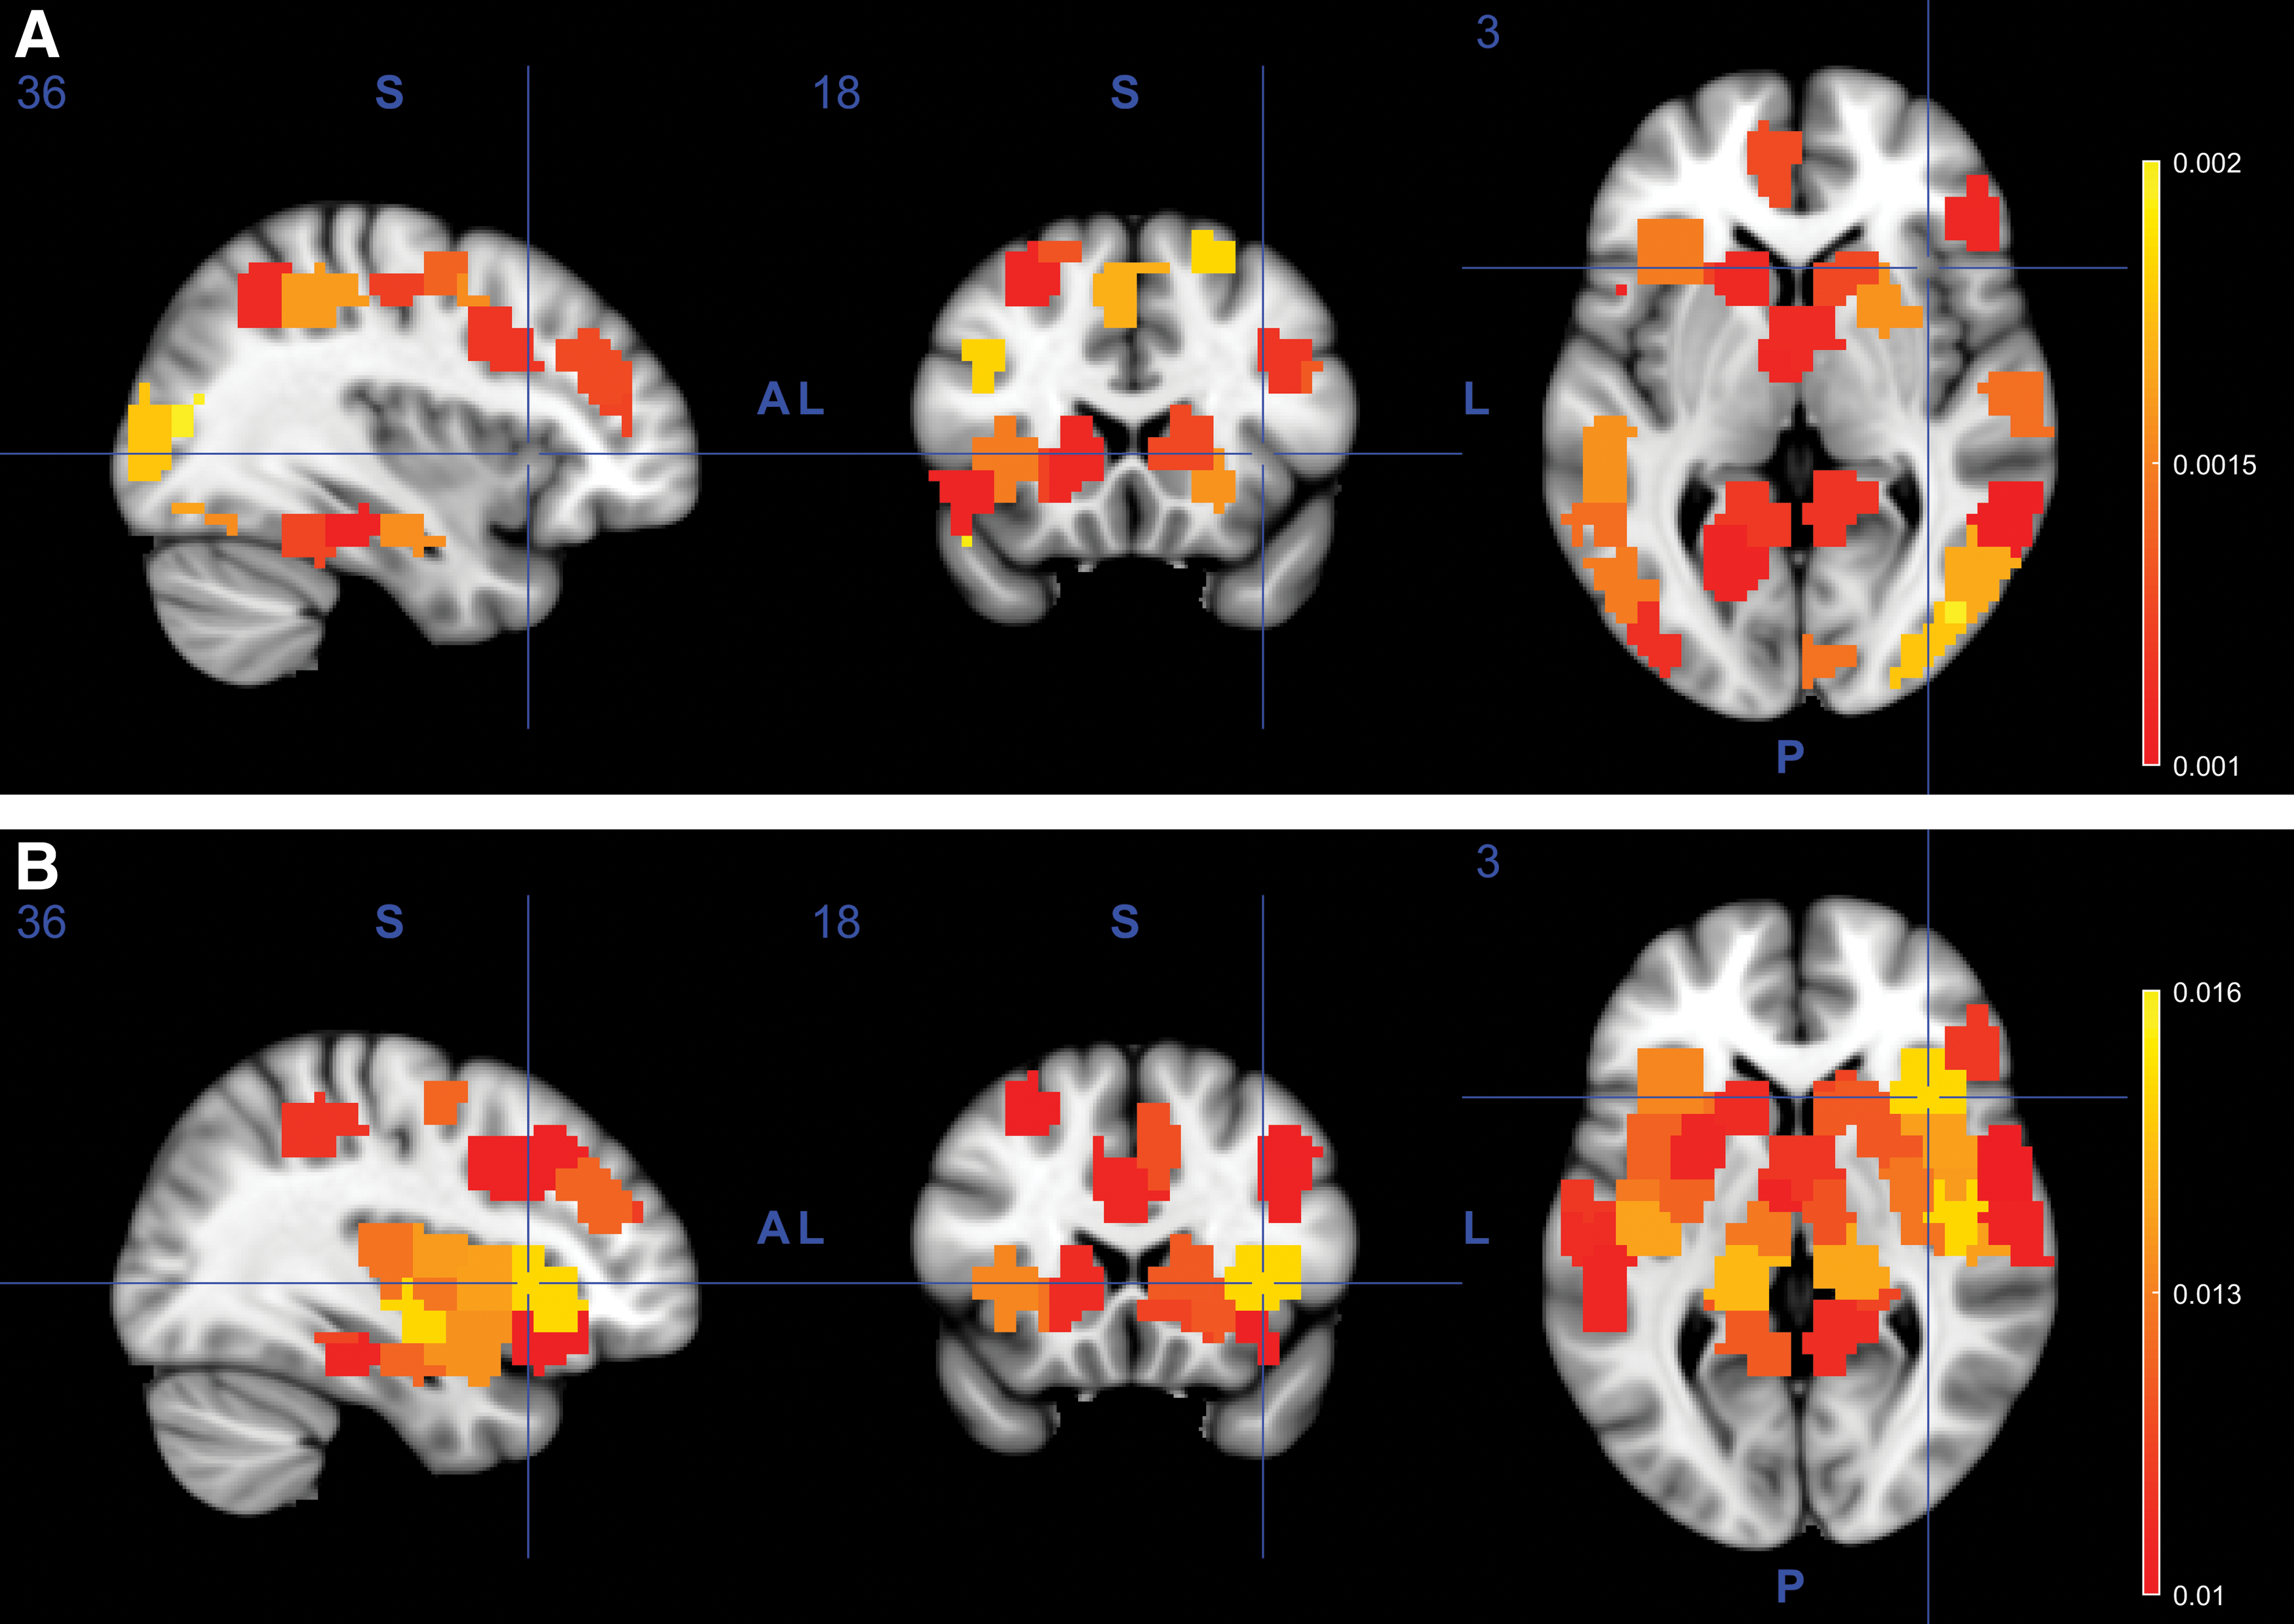
BV-based classification results for tasks
Discussion
Using two supervised machine learning approaches, we showed that both BV and FC significantly predict task and subject differences above chance levels. We also showed that the predictive models are robust across time periods on the order of 3 years, suggesting that subject- and task-specific FC and BV signatures are persistent across time. While FC leads to better predictive performance, there are two features of the BV approach worth highlighting. First, BV has a straightforward interpretation: BV is computed from each single brain region, and task- or subject-related BV changes can be attributed to specific brain regions. Second, BV is low dimensional, which leads to simpler computation, easier data visualization, and application of advanced modeling techniques (e.g., fully Bayesian inference) that can be challenging for more complex brain imaging measures such as FC.
Our results add to a growing body of results that look at statistics other than FC/synchronization. Another such statistics that looks at regional fluctuations is the amplitude of low-frequency fluctuations (aLFF), which is diagnostic of schizophrenia (Hoptman et al., 2010), Alzheimer's disease (Wang et al., 2011), and major depressive disorder (Wang et al., 2012). BV is similar to aLFF in that it looks at regional fluctuations, but is not frequency specific.
It is possible that our machine learning models could not adequately capture the valuable information present in FC, given the relatively small amount of training data. While a larger training set and more advanced models would improve the performance of both FC and BV, we expect that these changes would better leverage the high dimensionality of FC and lead to better performance gains than BV. Chen and Hu (2018) used a recurrent neural network to improve subject identification performance using short scans and we think that similar methods could be used to improve our modeling results. However, because the goals of this work were to compare the information contained in BV and FC, and not prediction in itself, we focused on simple machine learning models.
Our nearest neighbor prediction framework mirrors past analyses (Finn et al., 2015; Horien et al., 2018; Waller et al., 2017) that investigated the persistence of subject-specific FC signatures across pairs of tasks, but extends the framework by examining task-to-same task prediction. Our analysis found that, for both FC and BV, task-to-same task prediction performed best, and that rest-to-rest prediction performed worst. These results suggest that task engagement modulates the uniqueness of subject-specific BOLD responses in a way that increases subject discriminability. Finn et al. (2015) found that rest-to-rest prediction performed best, but showed in a follow-up study that scan length, known to affect FC computation (Birn et al., 2013; Noble et al., 2017), was the predominant driver of high rest-to-rest performance (Finn et al., 2017). As in Waller et al. (2017), our data set leads to reduced accuracy compared with subject identification for the original 126 subjects' HCP analysis (Finn et al., 2015). However, we perform better than a follow-up analysis with more subjects (716) who controlled for scan length (Finn et al., 2017). Taken together, these studies suggest than many factors (e.g., time between scanning sessions, number of subjects, number of tasks, scan length) impact predictive performance and will need to be further examined.
When we directly contrasted performance in subject identity prediction and task prediction, we found that out-of-sample subject identity prediction was more accurate than task prediction, even though a priori the subject identity task is a more challenging task (i.e., identifying 1/174 vs. 1/9). In addition, statistical tests of BV showed that all subjects had significantly different BV signatures, whereas the tasks did not. This provides further evidence that “the majority of the variance in [functional signature] is accounted for by who you are and not what you are doing” (Finn and Constable, 2016, p. 281). A recent study of task and subject FC expanded on this idea by showing not only was FC individuality a predominant factor in group-level FC variability but that task sensitivity could be improved by removing subject connectivity as well (Xie et al., 2017).
One potential concern is that past research showed that vascular effects are present in motor tasks and to a much lesser extent, cognitive tasks (Kannurpatti et al., 2010). This research suggests a potential confound for our results: vascular effects, rather than neural effects, lead to high predictive performance. We believe that this is not the case for the following two reasons. First, there were only moderate motor components to the cognitive tasks used in our experiment; the only motor components involved reporting answers using button presses. We can expect the vascular effects due to motor control to be less for these tasks compared with the finger tapping task used in the study by Kannurpatti et al. (2010). Second, the similarity between motor components of each task (i.e., infrequent button pressing) suggests that even if large vascular effects were present, these effects alone would not be sufficient to discriminate between nine separate tasks.
Another potential concern is that structural information contributes to the predictive performance in a way that is separable from functional information. It is possible that differences in gross brain morphology create artifacts in functional signatures during the registration process (Jenkinson and Smith, 2001) that affect both FC and BV measures. For the goal of predicting what cognitive task a subject is engaged in, only functional information can be used to distinguish between cognitive tasks. Therefore, the ability of the model to identify tasks demonstrates that both BV and FC contain diagnostic functional information, and that these functional signatures persist over time. For the subject identity prediction task, however, care has to be taken in interpreting the results. The identification of a person based on structural information is not an impressive outcome compared with the identification of a person based on FC or functional variability. For this reason, we did not use LR models for subject identification because they could easily overfit to a structural confound. The 1-NN classifier does not make use of any free parameters that can be tuned to particular ROIs, and therefore, the identification occurs on the basis of overall similarity between functional signatures and not any particular ROI. During preprocessing, we carefully ensured that high subject identification performance was not due to structural confounds: we removed edge voxels (i.e., those most likely to be misaligned) from our analysis, used nonlinear registration, and performed separate registration for each scanning session. Furthermore, brain parcellation was performed using a data set from a separate population, which reduces the probability that voxels were grouped into regions that a priori differentiate subject identity (i.e., that ROIs reflect subject-specific rather than task-specific functional differences). Therefore, even if structural information affects particular ROIs, it is unlikely that the classification results in the subject identification task are driven entirely by structural information. However, future research will investigate how structural information might contribute to classification performance.
Conclusions
Our results replicate the general findings that FC is predictive of both task and subject. We have shown that simple statistics such as BV also can capture information that is diagnostic of both task and subject. By establishing BV and FC patterns invariant to subject, we are better prepared to understand the impact of disease on these signatures. Future work will involve finding changes to these signatures that are related to individual health or behavior.
Footnotes
Acknowledgment
This work was supported by a National Sciences Foundation Integrative Strategies for Understanding Neural and Cognitive Systems Collaborative Research Grant (1533500 and 1533661).
Author Disclosure Statement
No competing financial interests exist.
Supplementary Material
Supplementary Data
Supplementary Figure S1
Supplementary Figure S2
Supplementary Figure S3
Supplementary Figure S4
Supplementary Table S1
Supplementary Table S2
Supplementary Table S3
Supplementary Table S4
Supplementary Table S5
Supplementary Table S6
References
Supplementary Material
Please find the following supplemental material available below.
For Open Access articles published under a Creative Commons License, all supplemental material carries the same license as the article it is associated with.
For non-Open Access articles published, all supplemental material carries a non-exclusive license, and permission requests for re-use of supplemental material or any part of supplemental material shall be sent directly to the copyright owner as specified in the copyright notice associated with the article.