
Abstract
The prognostic capacity of the diffusion tensor imaging measures fractional anisotropy (FA) and mean diffusivity (MD) to detect mild cognitive impairment (MCI) progression to Alzheimer's disease (AD) was assessed in 135 MCI patients and 72 healthy subjects over a median follow-up of 40 months. Forty-nine MCI patients (36.3%) developed AD. The factors MD left hippocampus, FA left cingulate, and FA left hippocampus emerged as predictors of progression. Age (hazard ratio [HR] 1.21), delayed text recall (HR 0.89), FA left uncinate (HR 1.90), FA left hippocampus (HR 2.21), and carrying at least one ApoE4 allele (HR 2.86) were associated with a high conversion rate. FA measures revealed the greatest discriminative capacity (Harrell's C = 0.73 versus 0.65 without FA; p = 0.034). The inclusion of FA structural connectivity data in our model improved discrimination between subjects with MCI progressing or not to dementia.
Introduction
Mild cognitive impairment (MCI) has been described as a prodromal stage between healthy aging (HA) and dementia (Petersen, 2004). While diagnostic and prognostic accuracy have been certainly improved by more precise clinical criteria, the description of different clinical subgroups, cerebrospinal fluid (CSF) biomarkers, and amyloid biomarker imaging, it remains unknown which specific subset of individuals will eventually develop Alzheimer's disease (AD) because of the difficulty in identifying cases of MCI attributable to underlying AD.
Several imaging techniques may be used to differentiate between HA, MCI, and AD, but these still do not solve the problem of an early diagnosis. Neither do they serve to clarify the pathophysiology of this disease. Investigations addressing the physiological basis of cognitive impairment due to AD and of AD itself have examined how information in the brain is segregated rather than how the different brain regions integrate information. This likely explains why the classic model cannot explain the pathophysiology of AD and fails to provide new diagnostic clues or account for the effectiveness of known treatments. Thus, so far AD has been considered a “disconnection syndrome,” as anatomical links are disrupted by neurofibrillary deposits, explaining cognitive symptoms and the decline produced in the ability to integrate information from multiple cognitive domains (Morrison et al., 1985; Tononi et al., 1994). According to this model, abnormalities in the involved networks should be present early on, as we propose for MCI caused by AD. In effect, anatomical (Walhovd et al., 2009) and functional (Zhou et al., 2008) neuroimaging techniques have identified differences in brain connectivity among MCI, AD, and HA (Van Straaten et al., 2016). However, while most studies have been based on a single-subject approach, new topology methods have shown an adequate capacity to identify underlying AD based on multiplex network concepts (Amoroso et al., 2017).
Recently, diffusion tensor imaging (DTI) has been used to examine the characteristics of brain white matter and its anatomical connectivity. However, so far the different authors have reported discrepant findings in MCI patients compared with AD patients and healthy aged subjects. Thus, Fellgiebel et al. (2004) reported no differences in diffusivity and anisotropy indices between healthy subjects and age-matched individuals with MCI, whereas Brueggen et al. (2015) argued that mean diffusivity (MD) has been superseded by structural imaging. Other authors have detected significant differences in measurements made in or connectivity between the entorhinal cortex, posterior occipital cortex, parahippocampal white matter, parietal supramarginal and frontal precentral gyri, thalamus, and posterior cingulated regions (Cho et al., 2008; Fonteijn et al., 2008; Huang et al., 2007; Rose et al., 2006; Zhou et al., 2008). However, it has also been shown that certain selection methods may lead to overestimation of results, and selection bias has been observed to affect classification performance giving rise to systematic errors (Maggipinto et al., 2017).
A question that needs to be addressed is how MCI patients retain their capacity for long distance communication when they show impaired white matter connectivity through DTI. In some reports (Huang et al., 2007; Medina et al., 2006), MCI patients have been described to show loss of axons in the temporal lobe and to a lesser extent in the parietal and frontal lobes. These authors also found substantial overlap of brain regions showing reduced fractional anisotropy (FA) in MCI and AD patients, indicating that white matter changes occur in MCI before the onset of dementia. But, while AD patients showed generally impaired white matter connectivity reducing functional efficiency, MCI patients showed some integrity of anatomical connectivity opening the possibility for long distance communication (Ikonomovic et al., 2007). However, it remains unclear whether this initial plasticity will allow for the formation of efficient memory networks and whether it could be used as a predictor of subsequent progression to AD.
This study sought to examine the capacity of DTI to discriminate multiple brain networks as a prognostic marker of progression from the early to the dementia stage of AD.
Materials and Methods
Study participants
For this prospective cohort study, 135 subjects aged 65–80 years were recruited among patients visiting the Memory Units of the Neurology and Psychiatry Departments of the Hospital Clinico San Carlos (Madrid, Spain) and the Madrid City Council's Center for the Prevention of Cognitive Decline.
As HA controls, we enrolled 72 subjects with no history of neurological or psychiatric disorders and normal memory function as determined by their scores in the Logical Memory II subscale (delayed paragraph recall) of the Wechsler Memory Scaled-Revised (maximum score is 25): (1) 10 or above for those who had received 16 or more years of education; (2) 6 or above for those receiving 8–15 years of education. Further requirements for controls were a Mini-Mental State Examination (MMSE) score between 24 and 30 (inclusive), and a Clinical Dementia Rating of 0 with a memory box score of 0 and no history of severe psychiatric episodes.
Individuals with MCI were diagnosed according to the criteria of Petersen et al. (2006; Grundman et al., 2004; Petersen, 2004). Inclusion criteria for these patients were as follows: (1) cognitive complaints confirmed by an informer (person in contact with the patient for at least half a day 4 days a week); (2) objective cognitive impairment, determined as delayed recall in the Logical Memory II subtest of the Wechsler Memory Scale Revised (cutoff scores ≤16 for those receiving ≥16 years of education; and ≤8 for those receiving ≥8 to 15 years of education [the maximum number of two paragraph items possible to correctly recall is 50]) and low scores in executive function tests; (3) performance in all measures of cognition <1.5 standard deviation (SD) units away from expected value (i.e., no more than mild impairment); (4) relatively preserved activities of daily living as revealed by the Lawton scale; and (5) not sufficiently impaired cognitively and functionally to meet criteria for dementia. The diagnosis of MCI was made by an experienced clinician from a memory unit independent of the selection and categorization of HA participants. According to the clinical and neuropsychological profile defined by these criteria, all participants in this group were considered to have amnesic MCI (single or multiple domain; memory and executive function impairment) since these patients are more likely to develop AD.
Participants were excluded if they had medical conditions with a high risk of associated cognitive symptoms such as severe head injury, any illness indicating a life expectancy of <2 years, alcoholism, or chronic use of psychotropics. Participants experiencing a transient ischemic attack (clinical event) were excluded if there were focal neurological symptoms or if they showed a focal lesion on magnetic resonance imaging (MRI). This was also indicated by the Hachinski scale score of >4. Participants with an Axis I psychiatric diagnosis were also excluded.
All participants underwent a general and neurological clinical evaluation, MRI with DTI and APOE polymorphism analysis. The study protocol was approved by the Review Board of the Hospital Clinico San Carlos. Written informed consent was obtained from each participant.
Neuropsychological testing procedures
A neuropsychological assessment was used to establish the initial cognitive status of each participant in multiple cognitive functions: memory impairment was assessed in the Logical Memory, digits, and Word List components of the Wechsler Memory Scale-III. For language functions, we used the Boston Naming Test; for executive function, we used the Trail Making Test (A and B), FAS (phonetic and semantic fluency), Rule Shift Cards Test, Clock Drawing Test, and BADS battery (Behavioural Assessment of the Dysexecutive Syndrome); and we tested imitation praxis tasks. Perception was tested in the silhouettes subtest of the Visual Object and Space Perception battery. For cognitive and functional status, we also used MMSE, the Global Deterioration Scale (GDS)/Functional Assessment Staging (Auer and Reisberg, 1997), and Functional Activities Questionnaire (FAQ). This extensive neuropsychological battery was used to adequately differentiate between MCI with only memory domain impairment and MCI with multiple affected domains and also to establish a baseline cognitive status in each participant so that subtle changes could be assessed over time.
According to test performance, participants were divided into the groups: HA controls (n = 72), amnesic MCI patients (MCIa, n = 45), and amnesic multiple domain MCI patients (MCIm, n = 90). Nonamnesic multiple domain MCI patients were excluded. An initial neuropsychological test battery and MRI/DTI neuroimaging were performed in both MCI groups. Neuropsychological testing was repeated every 6 months in both subjects with MCI and in controls.
MRI/DTI measures
MRI was acquired using a 1.5 Tesla scanner (General Electric Medical Systems, Waukesha, WI) with HDxt release 16.0 and an eight-channel high-resolution head coil. In addition to whole-head three-dimensional (3D) fast-spoiled gradient-echo T1-weighted 1 mm3 isotropic sequence, 3D CUBE FLAIR T2-weighted 1.6 mm thickness sequence, and two-dimensional gradient-echo T2 sequence, DTI images were also obtained. DTI acquisition parameters for the single-shot echo planar sequence were: repetition time (TR) = 12000 ms, echo time (TE) = 84.6 ms, b value = 900 s/mm2, 52 contiguous slices, 2.4 mm thickness, field of view (FOV) = 307 mm, matrix 128 × 128 (256 × 256 extrapolated), number of excitations = 3, total acquisition time for the DTI sequence = 15:48 (minutes:seconds). DICOM images were anonymized and converted to compressed NIFT files with the dcm2nii tool in the MRICRON software suite (Rorden, Neuropsychology Lab, Columbia, SC). We chose regions of interest that have demonstrated their predictive capacity in literature studies or have been related to the physiology of memory, executive, and attention functions or to the pathogenesis of AD. In each participant, FA and MD maps were generated with FMRIB's Diffusion Toolbox, and part of FSL Software Download from the Analysis Group at the University of Oxford, UK (Jenkinson et al., 2012; Smith et al., 2004; Woolrich et al., 2009), after eddy current distortions and head motion corrections. All subjects' FA data were then fed into the preparatory steps of a Tract-Based Spatial Statistics type analysis (Smith et al., 2006), meaning that they were aligned into a common space using the nonlinear registration tool FNIRT (Andersson et al., 2007a,b), which uses a b-spline representation of the registration warp field (Rueckert et al., 1999) in the FMRIB58_FA standard-space image; a mean FA image was then created and thinned to create a mean FA skeleton, which represents the centers of all tracts common to the group. Each subject's aligned FA data were then projected onto this skeleton. Registration data were used to create a similar streamlined projection of the MD data. From both skeletons, FA and MD values for the corpus callosum, and bilateral uncinate, cingulate, and hippocampus were extracted using standard space masks derived from the JHU White-Matter Tractography Atlas (Laboratory of Brain Anatomical MRI, Johns Hopkins University; Hua et al., 2008; Mori et al., 2005; Wakana et al., 2007).
APOE polymorphism
Genomic DNA was extracted from EDTA-anticoagulated whole-blood samples using standard DNA isolation methods. APOE haplotype was determined by analyzing single nucleotide polymorphisms (SNPs) rs7412 and rs429358 genotypes with TaqMan assays, using an Applied Biosystems 7900 HT Fast Real Time PCR machine (Applied Biosystems, Foster City, CA). A genotyping call rate over 90% per plate, sample controls for each genotype, and negative sample controls were included in each assay. Three well-differentiated genotyping clusters for each SNP were required to validate results. Intra- and interplate duplicates of several DNA samples were included.
Dementia diagnosis
During the follow-up period, participants were tested for dementia using the Diagnostic and Statistical Manual of Mental Disorders, Fourth Edition (DSM-IV) criteria or four to seven stages of the Reisberg GDS. Classification of dementia as AD type was based on the NINCDS-ADRDA criteria.
Statistical analysis
Statistical tests were performed using the software package Stata version 13.0 (Statacorp LP, College Station, TX). The Kolmogorov–Smirnov test was used to check the normality of data distributions. Quantitative data are expressed as the mean and SD, and qualitative data are expressed as absolute values and percentages. The chi-square test was used to assess associations among qualitative variables and Student's t-test for quantitative variables. Receiver operating characteristic (ROC) curves were constructed to determine cutoffs for FA and MD showing the best sensitivity and specificity. The maximum value of the product of the two cutoffs (sensitivity × specificity) was used to discriminate between MCI and AD. These values were considered in the univariate and multivariate analyses. Univariate effects were analyzed by means of hazard ratios (HRs) and their 95% confidence intervals (CIs). A Cox model was adjusted introducing those variables with a p value <0.05 in the univariate analysis and possible confounding variables. We started with a full model including the selected variables and then by backward elimination determined the impact of each variable on the C index. What we were aiming for was a model containing the minimum number of variables able to predict the event with greatest discrimination (higher C index). This model fulfils the principle of parsimony. Significance levels for selection and elimination were set at <0.05 and ≥0.10, respectively. To control for confounding factors, we compared the estimated variables of the full model with those of the final selected model. No difference between the estimated variables exceeded 10%.
No significant multicollinearity (assessed using variance inflation factors) was detected. The proportionality of hazard functions over time was assessed using “log-log” plots. To test the capacity of the prediction model to discriminate between individuals with and without AD, we used an overall C statistic (D'Agostino and Nam 2004; Pencina and D'Agostino 2004) expanding on a suggestion by Harrell et al. (1996). This C statistic is analogous to the area under the ROC curve (AUC). Briefly, two subjects are described as comparable if we can determine which one converted and concordant if their predicted probabilities of conversion go in the same direction, and we can define the overall C statistic as the probability of concordance. To compare both Harrell C indices, the method described by Newson (2010) was used. For internal validation of the model, the degree of overoptimism resulting from model assessment of the same data was estimated through bootstrap resampling of the original set (100 randomized samples). We assessed internal validity with a bootstrapping procedure for a realistic estimate of the performance of both prediction models in similar future patients. We repeated the entire modeling process including variable selection in 100 samples drawn with replacement from the original sample. We determined the performance of the selected prediction model and the simple rule arising from each bootstrap sample in the original sample (Moons et al., 2015). Optimism was calculated through the result of the Harrell C bootstrap index minus the Harrell C index of the full model. Pearson's correlation coefficients were used to correlate FA and neuropsychological test results. The correlation study with FA was conducted using the baseline neuropsychological examination, which was carried out at the same time as the DTI-MRI. All tests were two-tailed. p Values were not corrected for multiple comparisons. Significance was set at p < 0.05. Data are available for review if required.
Results
Of the initial 207 participants, 199 completed the study. After a median follow-up of 40 months (interquartile range 25.1–54.8), diagnostic criteria for AD were fulfilled by 13 MCIa (30.2%) and 36 MCIm (40.9%) patients (Fig. 1). Four patients were excluded due to an unknown final diagnosis, and four further patients were also excluded because they developed conditions other than AD. No cognitive decline was detected in any of the control HA subjects.
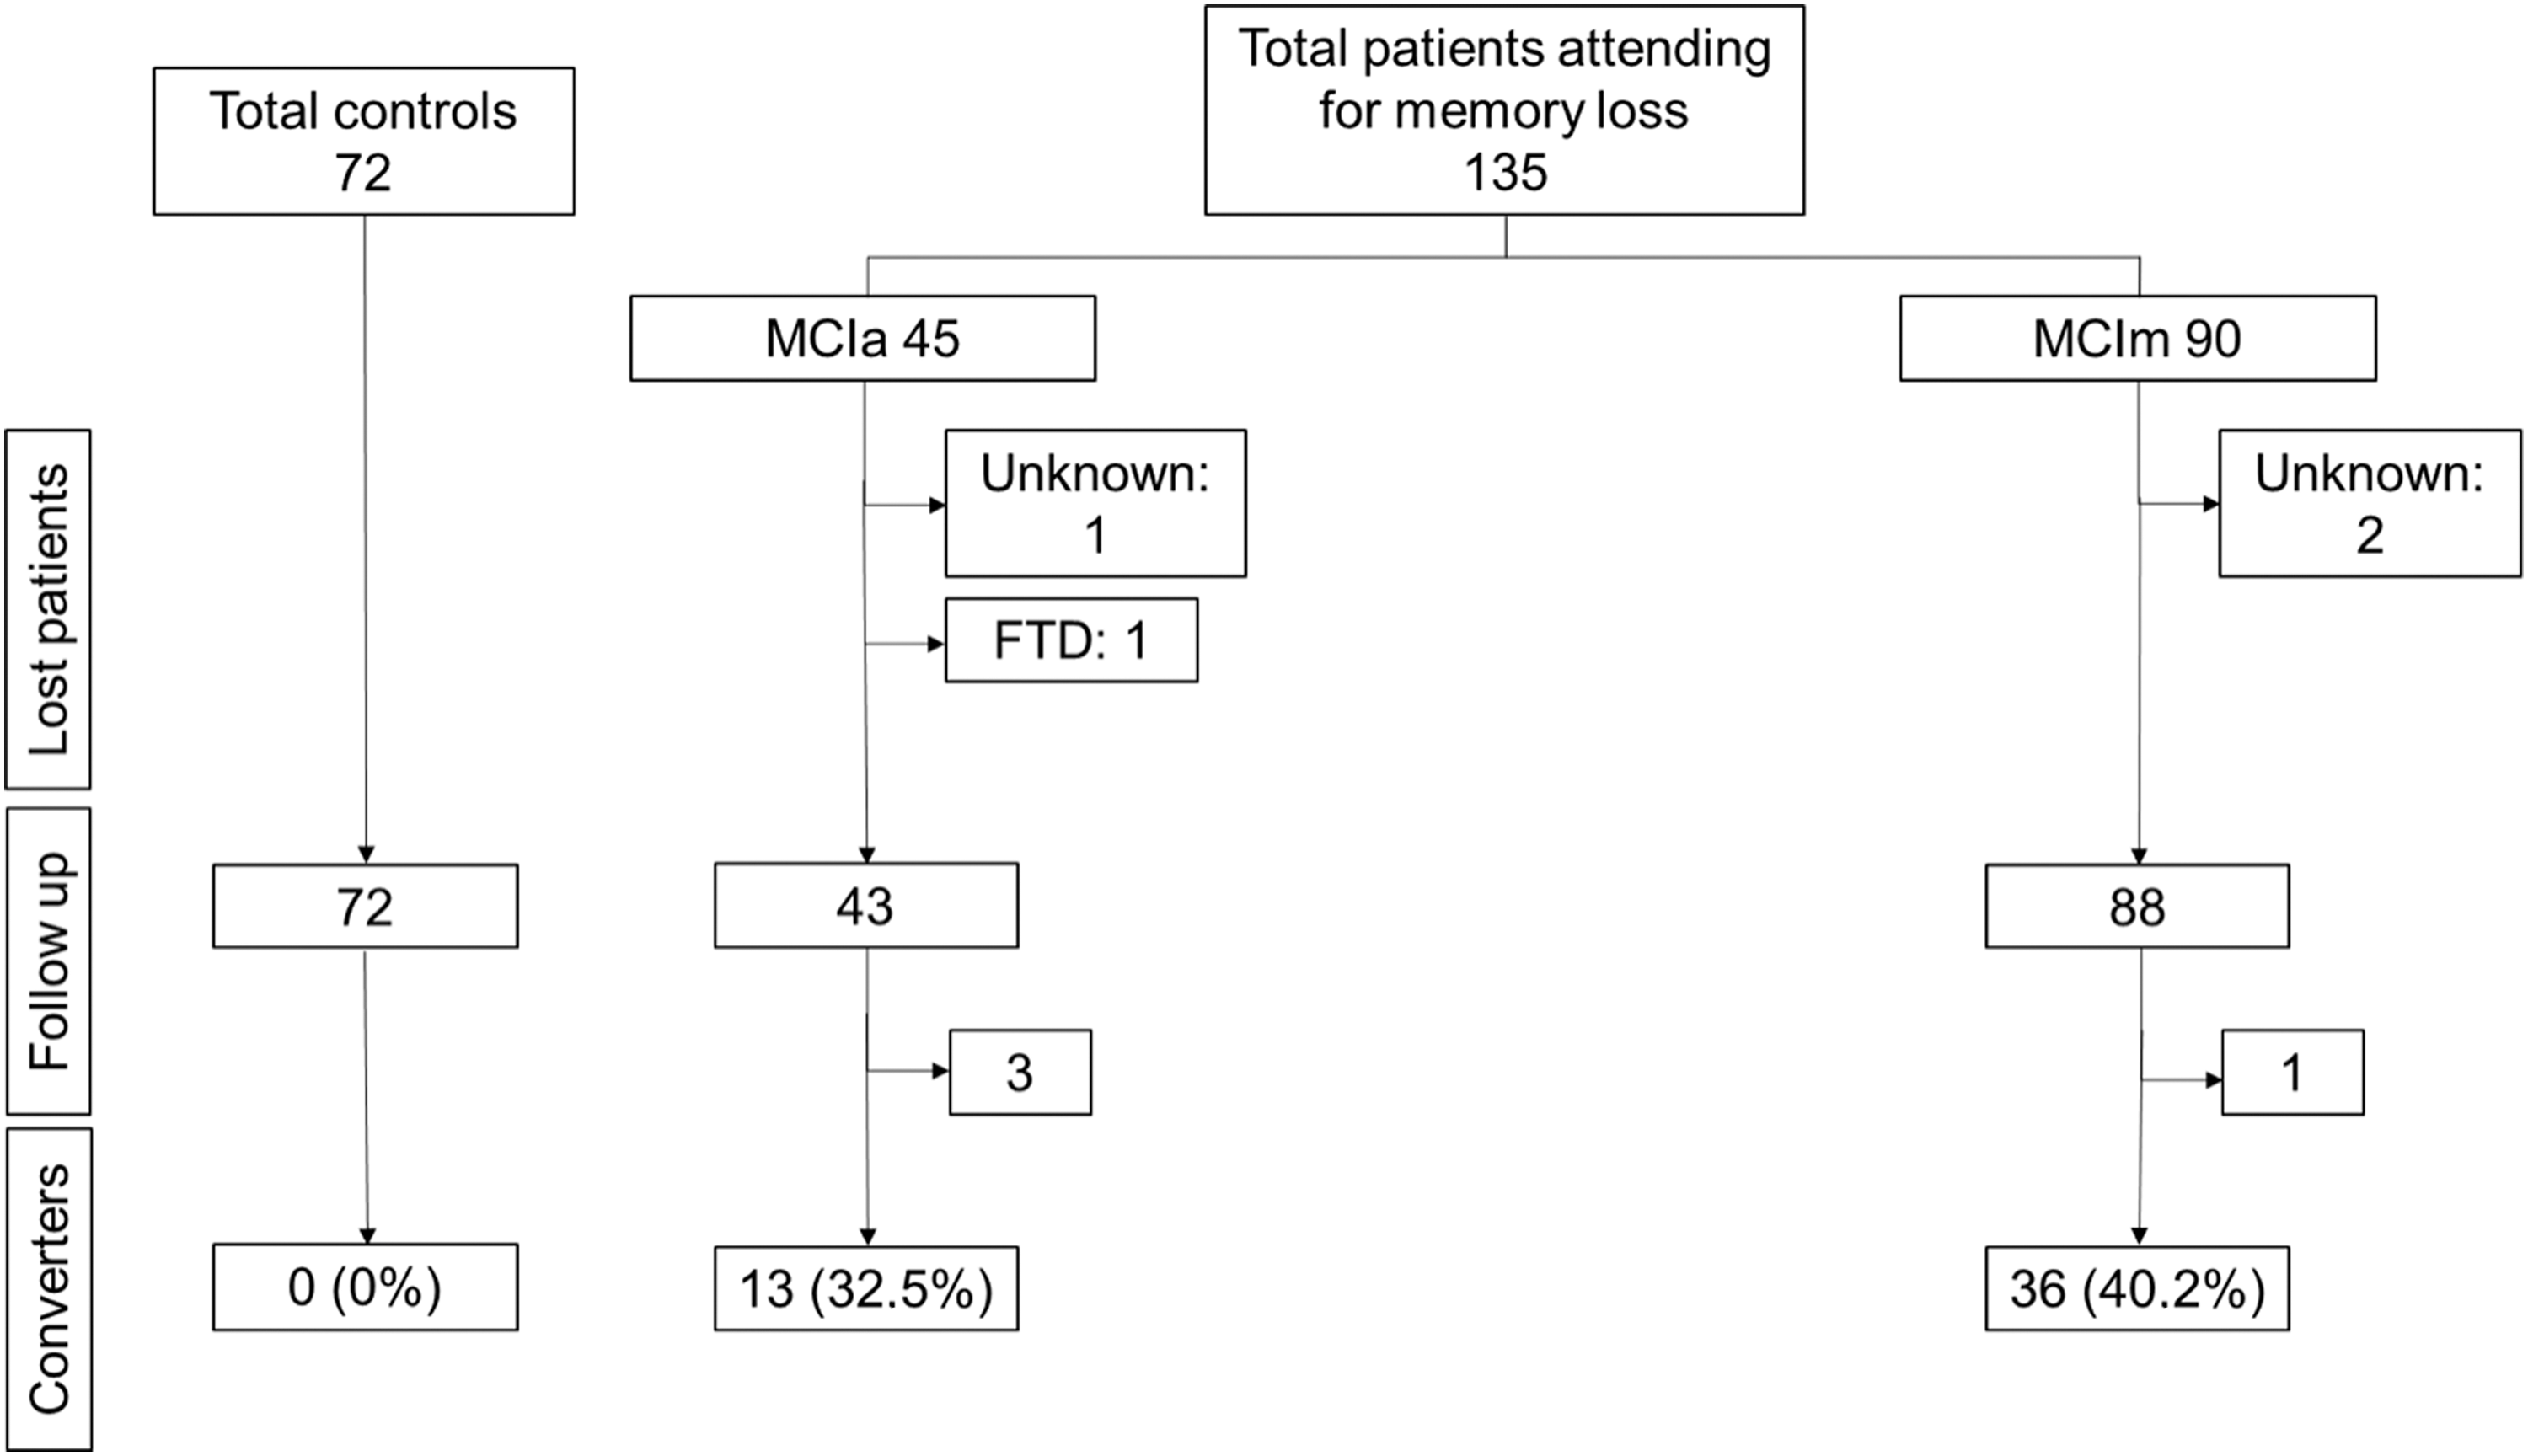
Flowchart showing the study protocol and results (STROBE guidelines). FTD, frontotemporal dementia; MCIa, amnesic mild cognitive impairment; MCIm, multiple domain amnesic mild cognitive impairment.
In Table 1, epidemiological characteristics and baseline neuropsychological and neuroimaging results are provided for the whole patient cohort by MCI diagnosis group. No clinical differences were detected between the two groups regarding age, occupation, or education levels. However, the proportion of women was higher in MCIm than in MCIa.
Baseline Characteristics of the 135 Patients Diagnosed with Mild Cognitive Impairment
Data are provided as mean and SD except when indicated otherwise.
BADS, Behavioural Assessment of the Dysexecutive Syndrome battery; BNT, Boston Naming Test; CLOCK, Clock Test; DIGITS, digit forward and backward span test; FA, fractional anisotropy; FAS, phonetic and semantic fluency; GDS, Global Deterioration Scale: L, left; MCIa, amnesic mild cognitive impairment; MCIm, multiple domain amnesic mild cognitive impairment; MD, mean diffusivity; MMSE, Mini-Mental State Examination; R, right; SD, standard deviation; TEXTS, text memory recall (immediate and delayed) in the Wechsler Memory Scale-III; TMT-A and TMT-B, Trail Making Test (A and B); VOSP, Visual Object and Space Perception battery.
AUCs were used to determine the capacity of the DTI measures and the other factors examined to assess progression to AD during follow-up (Table 2; Fig. 2). Variables showing AUCs >0.60 were MD left hippocampus, FA left cingulate, and FA left hippocampus. These areas ranged from 0.53 to 0.61 for MD and from 0.49 to 0.61 for FA, the largest area in both cases corresponding to the left hippocampus. Cutoff points showing the best sensitivity and specificity indicated adequate discriminative capacity for almost all FA measures except FA uncinate and none for MD.
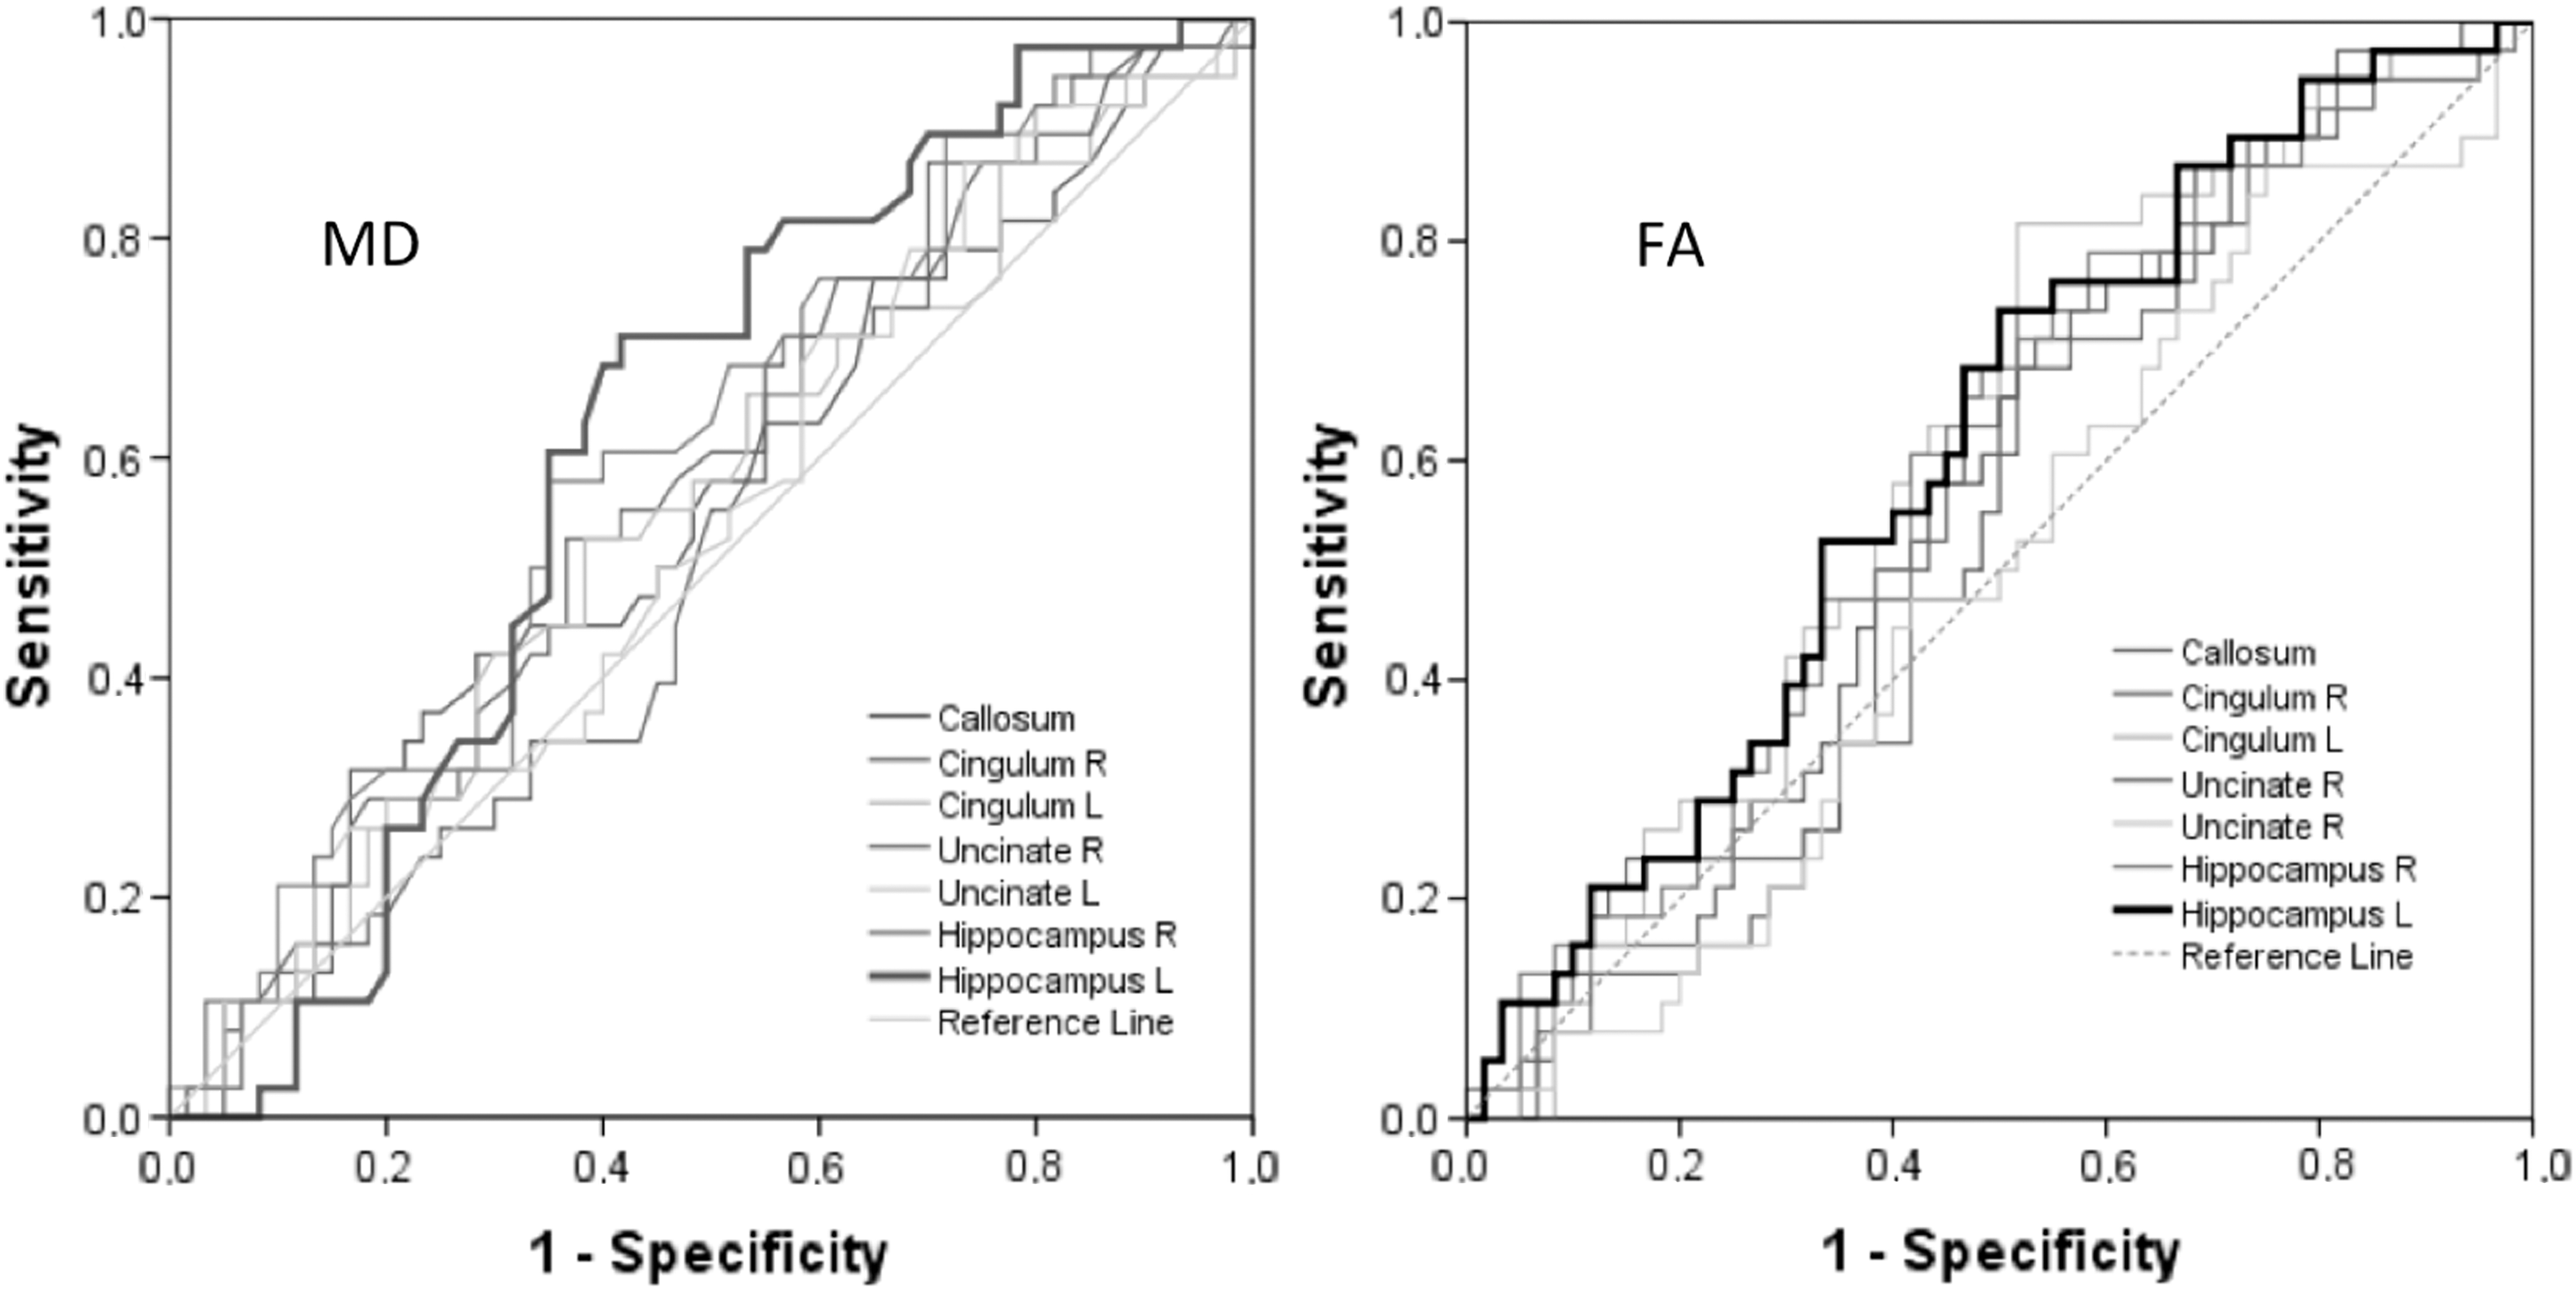
Discriminative characteristics of MD and FA used to predict Alzheimer's disease during follow-up. FA, fractional anisotropy; L, left; MD, mean diffusivity; R, right.
Discriminative Characteristics of Mean Diffusivity and Fractional Anisotropy Used to Predict Alzheimer's Disease During Follow-Up
AUC, area under the ROC curve; CI, confidence interval; FA, fractional anisotropy; ROC, receiver operating characteristic; SE, standard error.
In the univariate study (Table 3), all FA areas showing lower values as established by the AUCs were associated with higher rates of conversion to dementia with HRs >2.05. The remaining variables including epidemiological, neuropsychological, and MD factors showed no significance.
Univariate and Multivariate Relative Effect Size of Developing Alzheimer's Disease by Epidemiological Variables
Harrell's C index 0.73 (95% CI 0.69–0.80); without FA 0.65 (95% CI 0.55–0.72), p between 0.034; bootstrap error 0.03.
HR, hazard ratio.
In the multivariate model, age, delayed text recall, FA left uncinate, FA left hippocampus, and the presence of at least one ApoE4 allele emerged as prognostic factors for conversion to AD. The independent variables associated with a high conversion rate and risk of progression to dementia in MCI patients were: age (HR 1.21, 95% CI 1.08–1.34 for each year increase; p = 0.001), delayed text recall (HR 0.89, 95% CI 0.81–0.97 for each point increase; p = 0.010), FA left uncinate fasciculi <0.55 (HR 1.90, 95% CI 1.04–3.97; p = 0.043), FA left hippocampus <0.45 (HR 2.21, 95% CI 1.06–4.56; p = 0.038), and carrying at least one ApoE4 allele (HR 2.86, 95% CI 1.08–7.55; p = 0.034).
The Harrell's C index of discriminative classification ability between converting and non-converting patients was 0.73 (95% CI 0.69–0.80) when FA measures were included in the model and 0.65 (95% CI 0.55–0.70) without these FA measures confirming a major contribution of FA to the prognostic model (p = 0.034).
In our internal validation study, we obtained a bootstrap error of 0.03, indicating adequate validity of the prognostic model.
Significant Pearson correlation was detected between some neuropsychological test scores and FA measures (Table 4). Thus, text recall scores were found to correlate with FA measures in all brain areas except the right uncinate fasciculus, showing most significant correlation with FA for the left hippocampus.
Correlation Between Neuropsychological Variables and Fractional Anisotropy
Correlation significant at the 0.05 level (two-tailed). **Correlation significant at the 0.01 level (two-tailed). r, Pearson correlation value. p, Significance.
Discussion
Our findings reveal that several variables correlated with high conversion rates or risk of progression to dementia. Measures of FA showed the greatest capacity to discriminate between converting and non-converting MCI patients. This determined that the inclusion of structural connectivity FA data in our prognostic model improved the accuracy of identifying MCI patients who progressed to dementia stage AD.
Our group has previously examined functional connectivity in a similar approach. Neurophysiological methods such magnetoencephalography have proven to differentiate among MCI patients with a high risk of progression to dementia (Bajo et al., 2010; López et al., 2014b; Pineda-Pardo et al., 2014). Progressing MCI individuals showed more synchronization in the alpha band between the right anterior cingulate and temporal-occipital regions compared with stable MCI subjects (López et al., 2016). Although the diagnostic value of this marker added to others like hippocampal volumetry is indisputable, its discriminative capacity in isolation is not enough to ensure predictive prognosis certainty (López et al., 2014a).
The variability shown by usual diagnostic procedures such as structural neuroimaging or neuropsychology in their discriminative capacity for progression to dementia is probably influenced by factors such as cognitive reserve, age, occupational level, and the different underlying pathological entities that can cause dementia. The general consensus today is still that neuropsychological deficits in dementia are caused by specific-site injuries, without considering functioning of the brain's networks. In patients who progress to AD, memory loss is the main symptom caused by significant disruption of specific connections assessed by functional MRI (Wang et al., 2013). This functional disconnection must be driven by structural damage to the white matter that may be studied in vivo by measuring tissue integrity or connectivity strength between different brain regions. MRI plus DTI offers a noninvasive means with adequate capacity for spatial discrimination to examine the distribution of the main white matter tracts and their extent of anatomical integrity.
Given the lack of AD biomarkers, we included a control group of healthy subjects to ensure correct patient assignment to the MCI group by confirming a different proportion of subjects progressing to dementia in the two groups. In our cohort, the rate of conversion to dementia for the duration of follow-up was similar to the rates reported by others in the range of 10–15% per year for MCI and 1–4% per year for healthy controls (Petersen and Negash, 2008). This, together with our proportion of ApoE4 carriers, seems to indicate that the epidemiological characteristics of our sample are those expected and that the cognitive decline in our patients was mainly due to AD. Hence, we were able to confirm that our inclusion criteria were adequate through the observations: (1) none of the HA controls developed AD criteria, (2) the proportion of MCI subjects that did so was similar to that expected for cognitive decline due to AD, and (3) and the similar proportions of APOE carriers detected in the diagnosis groups.
Of all the neuroimaging variables tested for their prognostic capacity for conversion to dementia, only MD for the left hippocampus and FA for the left hippocampus and cingulate fasciculi showed adequate values in our study. This was confirmed in our univariate study and Harrell's C test in which FA measures below those of cutoff values were associated with a more than twofold risk of developing AD, and FA was the variable showing the greater independent discriminative capacity of the model.
According to prior work (Davatzikos et al., 2011; Pineda-Pardo et al., 2014), the brain connections that have most frequently helped distinguish between healthy control subjects and dementia patients are found in regions of the cingulate cortex. Similarly, we found that the connections of the limbic system and frontal lobe are crucial for stable cognitive performance in that these connections are first affected as indicated by memory function loss.
Structural neuroimaging has also provided data consistent with these observations. Pathological atrophy of the hippocampal cortex found in patients with early AD leads to alteration of anatomical connections from the posterior cingulum and hippocampus to the rest of the brain, which is also reflected by immediate memory recall deficit (Huang et al., 2002; Zhou et al., 2008). Like these authors, we also consider abnormalities in the posterior cingulate cortex as a fundamental part of the course of AD.
Our study has some limitations. We do not know whether the stable MCI patients in our sample will eventually convert to AD, so our model will lack predictive accuracy. Also, we have no data on postmortem pathologies, amyloid–tau determinations in CSF or positron emission tomography (PET) imaging. As benefits we could mention our study's similar proportions of MCI subjects converting to dementia and of ApoE4 carriers in the whole patient population with respect to other cohorts described in the literature. We added a control group of healthy subjects to minimize the heterogeneity of MCI and overlap with normal aging. Also, we applied strict inclusion criteria to subjects assigned to the MCI group to ensure they were clearly different from the HA group subjects. The longitudinal nature of the study with a long follow-up and a similar MCI to AD conversion rate to that reported for other cohorts means our MCI individuals were adequately differentiated from the healthy participants. In addition, during the follow-up visits every 6 months, no HA subject included met the clinical or neuropsychological criteria for MCI or dementia. It should be noted that we did not include MCI patients with nonmemory single domain or nonmemory multiple domain neuropsychological alterations to avoid cognitive impairments due to underlying non-Alzheimer's processes. The level of schooling was classified according to the years of schooling received, and our sample showed a similar distribution of schooling level to the general population. Participants with a level of education that did not ensure correct completion of the neuropsychological tests were excluded, and although some participants (10%) reported only a short period of schooling, their daily functionality was considered appropriate for the purpose of the study. In addition, the quantification of structural connectivity by a single DTI model can lead to errors due to fiber crossing, bending, or kissing. We tried to minimize this error using a limited number of encoding directions. Finally, there was no external validation, although this limitation may have been minimized as we analyzed two cohorts from two centers.
Conclusion
In summary, we show here that including structural connectivity data in a model of dementia progression improves the model's capacity to distinguish between MCI patients who progress and those whose MCI remains stable. Our findings also suggest that the clinical deterioration produced during the course of dementia reflects a loss of structural connectivity between certain brain areas as well as a loss of function of other brain regions or specific centers.
Footnotes
Acknowledgment
This work was supported by the Spanish Ministry of Science and Economy (Grant Nos. PSI2009-14415-C03-01 and PSI2012-38375-C03-01).
Author Disclosure Statement
No competing financial interests exist.