
Abstract
Studies of brain structure have shown that the cortex matures in both a linear and nonlinear manner depending on the time window and specific region studied. In addition, it has been shown that socioeconomic status can impact brain development throughout childhood. However, very few studies have evaluated these patterns using functional measures. To this end, in this study we used cross-sectional resting-state functional magnetic resonance imaging data of 368 subjects, age 3–21 years, to examine the linear and nonlinear development of brain connectivity. We employed a clustering approach to characterize these developmental patterns into different linear and nonlinear groups. Our results showed that functional brain development exhibits multiple types of linear and nonlinear patterns, and assuming that brain connectivity values reach a stable state after a specific age might be misleading.
Introduction
Drastic changes in brain structure and function occur during the first two decades of human brain development, and studies have shown that many clinical disorders begin during these early stages (Hazlett et al., 2017; Supekar et al., 2013). To understand how both normal brain development occurs and what changes may lead to vulnerabilities to developing mental illness, a number of studies have examined human brain development from early childhood to adulthood (Allen et al., 2011; Dosenbach et al., 2010; Faghiri et al., 2018). In addition, it has been shown that delayed stabilization of different brain connectivities might be related to different psychiatric disorders (Kaufmann et al., 2017).
Most studies have focused on changes in the activation of certain regions as children develop (Durston et al., 2006; Luna et al., 2001), although in recent years the development of functional connectivity and the resulting networks has received increasing attention. The prior functional magnetic resonance imaging (fMRI) studies can be categorized into two major groups: task based and resting state (rsfMRI). Although task-based studies have and continue to add important contributions to our understanding of brain connectivity development [for a recent review on this matter see, Stevens (2016)], we focus on rsfMRI in this work.
It is generally believed that the overall organization of the human brain is established at birth (Anderson and Thomason, 2013), but maturational changes throughout childhood and well into adulthood impact efficiency and specialization of the human neural system. For example, many studies have shown that there is a distinct change in the connectivity of brain networks from local to distal as children mature.
In one influential study, Fair et al. (2009) used graph theory to demonstrate this “local to distributed” developmental trajectory. In a later study, it was shown that throughout development, local connectivities decrease while more distant regions show stronger connections (Lopez-Larson et al., 2011). Beyond this change from local to distributed networks, other studies have focused on alterations in the strength of functional connections between different networks. For example, studies have reported changes in cortical–subcortical functional connectivity, including stronger connectivity between the cortex and dorsal/anterior parts of thalamus in adults compared with children (Fair et al., 2010). Several recent reviews highlight the current state of research in this area (Ernst et al., 2015; Somerville, 2016; Stevens, 2016).
It is worth noting that not all the findings in this area have been replicated. For example, an early study found that the connection between dorsal striatum and some cortical regions decreases with age (Supekar et al., 2009), while a more recent paper reported the opposite trajectory (van Duijvenvoorde et al., 2016). It is possible that some of the discrepancies arise because studies assume a linear change, while the effect is likely nonlinear (discussed in the following paragraph). Small sample sizes and differences in the actual age range studied can also contribute to the variability between studies.
Nonlinear developmental trajectories have been studied extensively in structural studies. The first study to report such nonlinear changes found that cortical gray matter volume increased in early childhood and then decreased in adolescence (Giedd et al., 1999). This study also reported that the peak occurs at different ages depending on the specific brain region, and this general finding has been replicated in several studies since (e.g., Wierenga et al., 2014).
The nonlinear functional maturation of the brain has been studied to a lesser extent, but there have been some studies. For example, McRae et al. (2012) reported a nonlinear relationship between age and activation in regions involved in social cognitive processing. Liu et al. (2016) reported linear decrease in pre-SMA activation, while observing nonlinear effect of age in dorsal anterior cingulate cortex. In another interesting study, Kaufmann et al. (2017) showed that “connectome distinctiveness” has a nonlinear increase with age. Pattwell et al. (2012) suggested that treatment response to cognitive behavioral therapy varies nonlinearly across age. Nonlinear change in amygdala functional connectivity was reported in another study including subjects from 3 months old to 5 years (Gabard-Durnam et al., 2018).
Although there are some limited studies that have examined nonlinear development of brain resting-state networks across the life span (Porter et al., 2015; Wang et al., 2012), to the best of our knowledge, our study is the first one to focus on the period from early childhood through adolescence and to use a relatively large sample. In contrast to the majority of existing studies, here we investigate both linear and nonlinear development of the brain, therefore allowing for both trends to appear in the results.
Environmental factors are also known to impact brain development, cognitive outcomes, and many other social measures. Gottfried et al. (2003) reported an association between higher performance in school and several of these environmental factors.
As we know, the difference between individuals seems to increase as subjects get older (Kaufmann et al., 2017). This ever growing difference might be caused by environmental factors (that are often quite different between subjects), therefore it is quite necessary to study these factors and their impact on the development of human brain (Farah, 2017). Therefore, in this article we have controlled for these effects in all our statistical analysis.
One such environmental factor is socioeconomic status (SES), which is widely known to impact cognitive measures such as IQ and literacy (Brooks-Gunn and Duncan, 1997). Recent studies have shown relationships between SES and brain development (Noble et al., 2015; Piccolo et al., 2016), as well as cognitive function across several domains, including executive function (Noble et al., 2007; Sheridan et al., 2012), language (Noble et al., 2006), and memory (Sheridan et al., 2013). For a review, see Farah (2017). It is worth noting that some large studies have not found any relationship between SES and brain development (Brain Development Cooperative Group, 2012). One important challenge when studying SES is its measurement, as there are many measures used to assess it (Cloutier et al., 2016); among them, two important ones are family income and education (McLoyd, 1998), which are used for this work.
In short, previous studies have shown that brain development across the lifespan follows a nonlinear trajectory in some, but not all brain regions, and a few studies have suggested that SES may have some impact on this trajectory. To further enhance our knowledge about functional brain development from childhood to early adulthood, this study examines a large cohort of youth using rsfMRI while controlling for the possible impact of SES on brain maturation. To our knowledge, this is the first study that has examined brain development across a broad span of early life development (3–21 years old) and used a clustering approach to find multiple nonlinear patterns of development.
Methods
Subjects and preprocessing
All of the data reported in this article are part of the Pediatric Imaging, Neurocognition, and Genetics (PING) database (
Household income and guardian education were recorded in this study, but unfortunately, we were unable to calculate income-to-need ratio because the number of family members was not available. For this specific study, we included all subjects with information about their household income and guardian education. This resulted in 373 subjects. Another five subjects were removed because of excessive motion. That is, framewise displacement was calculated, and all the volumes with >3 mm framewise displacement were flagged. Subjects who had >10% of their volume flagged were then removed. All the analysis was done on the remaining 368 subjects.
For preprocessing, we used the pipeline designed at the Mind Research Network, which utilizes the SPM software. Before running any preprocessing, to allow the signal to reach a stable state, the first four scans for every subject were removed. Next, the volumes were realigned and slice timing correction was performed using the middle slice as reference. All the EPI data were spatially registered to Montreal Neurological institute template using a nonlinear registration as suggested by Calhoun et al. (2017). Data were then smoothed using a Gaussian kernel (full width at half maximum [FWHM] = 10 mm). To increase the test–retest reliability of group independent component analysis (GICA) (Allen et al., 2010), data were intensity normalized to have a voxelwise mean of 100.
Group independent component analysis
GICA as implemented in the GIFT toolbox (
Table 1 includes the label (based on their peak locations) of each component and their respective domains. Static connectivity was then calculated for each subject by computing the Pearson correlation between each component time series. This resulted in 1128 (48 × 47/2) correlation values for each subject. To calculate the linear and/or nonlinear effect of age and household income on the connectivity of different component pairs, we built a regressor matrix by including age, age2, household income, and mean parental education as regressors of interest. It should be noted that household income and mean parental education were two separate regressors. We also included interactions between household income and mean parental education regressors and age. In addition, we included framewise displacement, gender, and acquisition site as nuisance regressors.
Component Labels
Component labels are selected based on the peak activation location (with coordinates in the right column).
Gender was included as a nuisance regressor as our initial focus was on studying linear and nonlinear patterns occurring at different ages (we revisit this point in the Discussion section). So, our primary model had six regressors of interest and three regressors for the nuisance variable. Regressor coefficients were then calculated for each one of the 1128 correlation values. If the coefficient for income/education and their interaction terms were not significant, they were removed from the model, and the coefficients were estimated a second time.
To correct for multiple comparisons, the Bonferroni correction for multiple comparisons was applied (p = 0.01/1128). To check the significance of age regressors, they were combined, and then their p-value was calculated. For the last step, all the fitted polynomials, which had significant partial correlation with static connectivity, were clustered based on their shape (i.e., their order and the location of their minimum/maximum relative to an age chosen to distinguish between childhood and adolescence). This step was performed to help summarize the results. Each cluster represents a specific relationship between age and connectivity between different component pairs.
Acquisition site impact on the results
As mentioned earlier, the data used for this article were acquired across seven different sites and three scanners. In addition to adding site index as a nuisance regressor in all of the statistical analysis, we performed additional analyses to show that the scanning site and scanner do not impact the results greatly. To show this, we calculated the linear correlation between age and static functional network connectivity (FNC) for subjects from different scanners. In addition, for each specific site, we removed the subjects acquired at that site, and calculated the linear correlation between age and static FNC for these subsamples. These correlation values were then correlated with the same values calculated from the whole dataset. This was done to show that set of subjects from a specific site does not change the age–FNC relationship greatly.
Finally, to show that FNC resulted from individual scanners does not differ from FNC resulted from data excluding that scanner, we employed a method inspired by bootstrapping (Johnson, 2001). For each specific site, we randomly selected 15 subjects. Next, from all other sites, we randomly selected another 15 subjects where the age of these newly selected subjects is not significantly different than that of the 15 subjects from the scanner in question. To find these second set of subjects, we simply used two sample t-test between the age of the two sets and if the resulting p-value was <0.01 we sample another 15 subjects from the dataset excluding the subjects from the specific site being tested. This step was repeated 100 times for each scanner and each time the correlation between the mean FNC resulting from the two sets was recorded. The reason we made sure that the age between the two sets is not significantly different is that in this article, we are suggesting that the brain connectivity maturation is nonlinear; therefore, different age ranges would result in different mean FNC matrices.
Results
Figure 1 shows the histogram for age, guardian income, and education. There was no significant difference between male and female participants in age, motion, household income, or mean guardian education (Table 2). In addition, we did not find any significant correlation between age and income (r = −0.08, p = 0.12). There was a significant relationship between age and guardian education (r = −0.11, p = 0.03). As expected, mean absolute framewise displacement had a very significant negative correlation with age (r = −0.35, p < 0.01). In contrast, mean absolute framewise displacement was not correlated significantly with parental education (r = 0.05, p = 0.3) and parental income (r = 0.08, p = 0.1). In addition, we could not find any significant correlation between site index and age (r = −0.05), parental education (r = −0.01), and parental income (r = −0.04).

Histogram of age, education, and income for subjects included in the study. Income and education were recorded for subjects' guardians, and the actual values were grouped into different groups.
Subject Demographic Information
As mentioned previously, GICA estimated 100 components, which were examined visually and 48 were selected. These 48 components were grouped into 8 connectivity domains (Fig. 2). These eight connectivity domains were labeled as follows: auditory (AUD), cognitive control (CC), default mode (DM), limbic (LIM), salience (SAL), subcortical (SC), somatomotor (SM), and visual (VIS). These network groupings were identified manually based on previous work (Allen et al., 2014), and static connectivity was then calculated for each subject and is shown in Figure 3. The partial correlation between static connectivity values and age was calculated controlling for household income and guardian education (with nuisance regressors included). The relationship between static connectivity and the interaction between regressors of interest were also examined. All p-values were corrected using the Bonferroni method (Dunn, 1961).
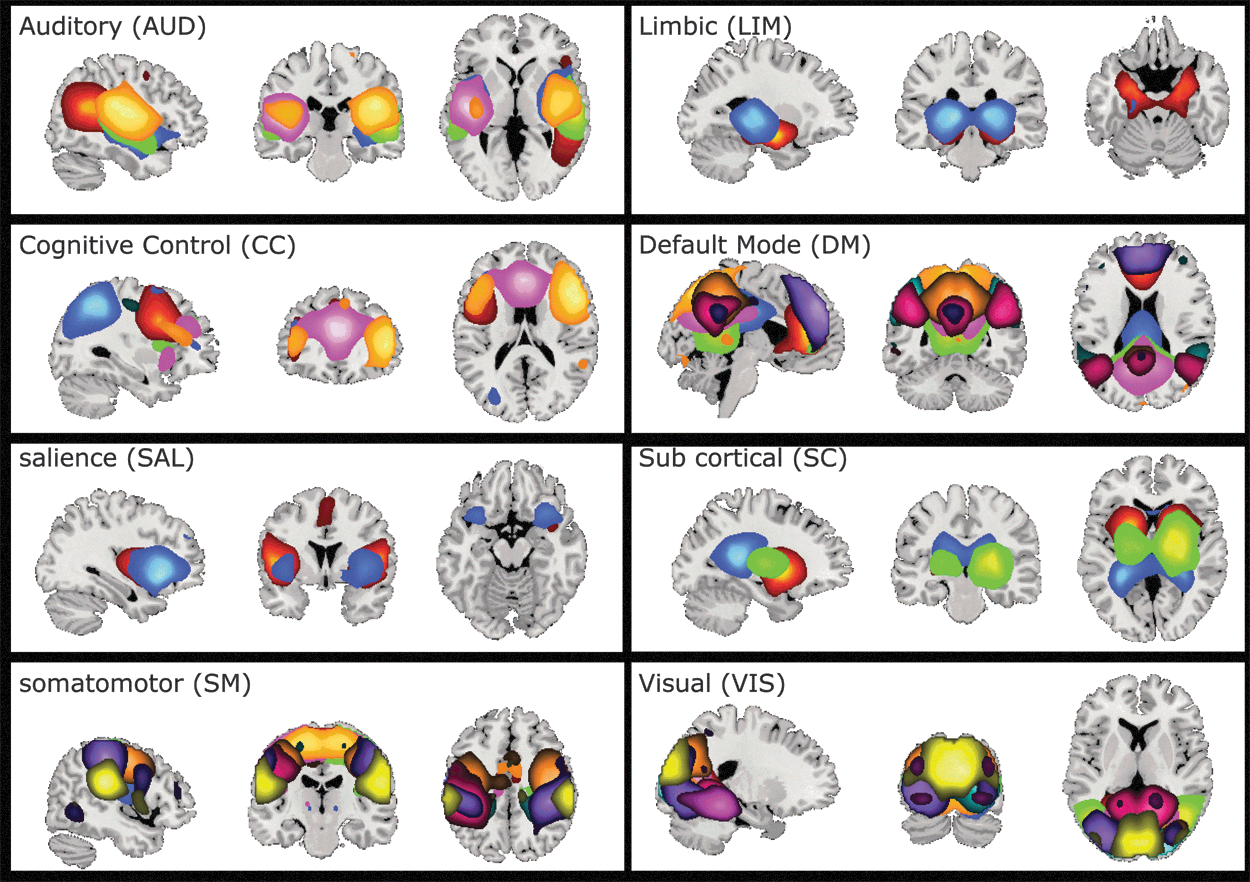
Functional domain spatial maps. All the components were visually inspected and 48 were selected, and then grouped into 8 functional domains. Some of the components spanned several domains. In these cases, the most prominent domain was selected. Each color represents one component (for a list of all components and their labels, see Table 1). Color images are available online.
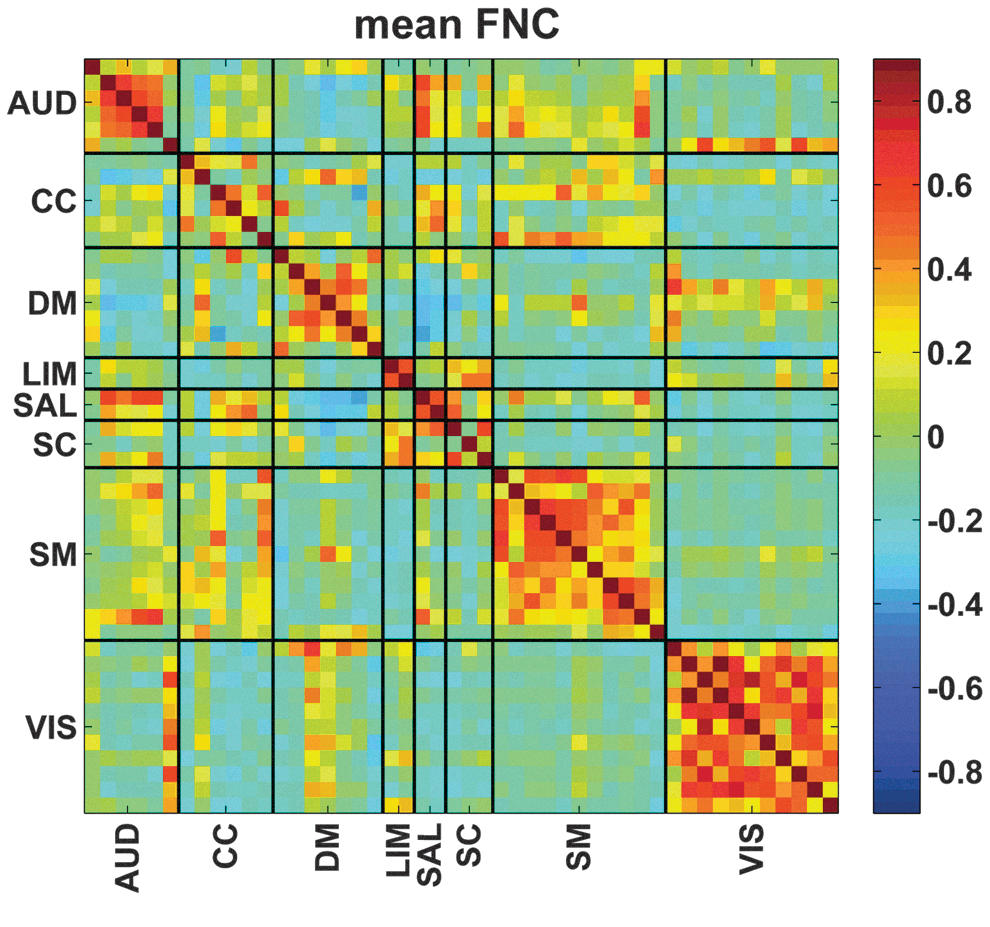
Mean functional connectivity across all subjects. AUD, auditory; CC, cognitive control; DM, default mode; LIM, limbic; SAL, salience; SC, sub-cortical; SM, somatomotor; VIS, visual. Color images are available online.
Since a significant interaction was not found between household income and guardian education with age, we dropped those two regressors from the final model. The final model included age, age2, household income, and mean guardian education in addition to nuisance regressors (representing gender, head motion, and scanner). Neither household income nor mean guardian education was significant for any connectivity pair after correcting for multiple comparisons, but we found 117 significant relationships between age and connectivity. Next, we combined the age regressors into a single function reflecting the age effect. To further summarize and characterize the results, we performed cluster analysis on these 117 polynomials, resulting in 6 different clusters (Fig. 4). Two of the clusters showed linear effects (clusters 1 and 2), while the remaining clusters showed quadratic patterns with age.

Developmental trajectory for different functional domains. Correlation matrix of the 48 components was used in a regression matrix with age and age2 as the main regressors. The significant correlations were then clustered based on their shape, which resulted in eight clusters. Clusters 1 and 2 demonstrated a linear trajectory, while the remaining four clusters were quadratic. The connectogram links indicate the correlation value between connectivity strength and the fitted age polynomial (therefore, all the correlations are positive as seen in the color bar at the bottom). Color images are available online.
We observed several different patterns across networks. For example, the majority of age-related changes in DMN showed a general trend of increase in connectivity with age, especially for young ages (clusters 2, 5, and 6; clusters 5 and 6 show decrease in connectivity for older subjects). The only exception to this general trend for DMN was with the connectivity between this network and some components of SM domain (cluster 1).
Unlike DMN, SAL connectivity relationship with age is present in all six possible patterns. SAL–SC connection relationship with age includes both decreasing and increasing trends (clusters 1 and 2), while SAL–Limbic relationship has an upward trend at early ages, but for older subjects the trend is decreasing. One last observation we can make here is that the connectivity between CC and SAL had a mostly decreasing trajectory with age (clusters 1 and 5; cluster 5 shows an initial increasing trend but it then shows decreasing pattern for more than half of the age range).
Similar to SAL connections, the correlation between SM and AUD domains was present in all clusters. In other words, these regions showed either an increasing or decreasing change (or a quadratic change with minimum/maximum in early or late adolescence) based on the actual component pairs.
In addition, connectivity in the AUD domain was represented by both linear and nonlinear patterns, in contrast to the largely linear pattern within the VIS domain (i.e., most significant links for VIS are present in cluster 2).
Finally, as explained in the Methods section, to demonstrate that the reported results are robust to scanner and site effect, we examined the relationship between age and static functional network connectivity (sFNC) values on different subsets of data grouped based on their scanner manufacturer or acquisition site (Fig. 5). Figure 5c shows that the age–sFNC correlation is quite similar in direction to the age–sFNC correlation of the entire dataset (Fig. 5a). In addition, despite the fact that the age of subjects acquired at different sites are not identical (Fig. 5b), if we exclude one scanner from the data and estimate the age–sFNC correlation (Fig. 5d), we get results similar to those obtained from the entire dataset (compare Fig. 5d with Fig. 5a). Finally, using bootstrapping we have compared the sFNC from one scanner with the sFNC resulting from all other scanners (Fig. 5e). As can be seen from this figure, all the correlation values are >0.9, which would mean that the results from one scanner are quite similar to results from other scanners (matching age between the two subsets).

The effect of site/scanner on the results.
Discussion
As mentioned above, we discovered a significant relationship between connectivity and age in 117 connectivity pairs revealing both linear and nonlinear patterns, which were grouped into 6 clusters based on their shapes.
We found a complex pattern of connectivity changes with age that differed both within and across domains. For example, links between DMN and other regions such as SAL, VIS, and AUD are stronger in older subjects compared with younger ones (cluster 2). In addition, we found that interconnectivity in DMN is mostly stronger in older subjects (cluster 2). This is in line with results obtained from other studies that have reported DMN to be more interconnected in older subjects (Fair et al., 2008; Sato et al., 2014). Because of the nature of our analysis, it is clear that this increase is not completely linear and starts to decay in subjects aged ∼15 years, thus showing that interconnectivity in DMN decreases after the initial increase in children (cluster 5). To explore this more, we need to analyze a dataset with a broader age range as this change might continue well into adulthood as suggested by some studies (Tamnes et al., 2010; Walhovd et al., 2005).
Our findings for the DMN suggest that DMN is moving from a more local network organization (interconnectivity) to more distal networks (connectivity between DMN and other domains). This is in line with what others have reported for different parts of the brain (Lopez-Larson et al., 2011).
As mentioned in the Results section, the connection between AUD and SM domains is present in most clusters, but a high proportion of links between these two domains are visible in the U-shaped clusters 3 and 4. In other words, some of the links between these two networks are strong in both children and older adolescents but weaker in individuals aged 10–14. The interaction between auditory and motor-related regions has been found by numerous studies previously [for a review on the matter, see Boulenger and Nazir, 2010)]. Many papers have reported connection between auditory networks and motor networks in children (James and Maouene, 2009) and adults (Antognini and Daum, 2017; Dekker et al., 2014).
To the best of our knowledge, this is the first work highlighting a U-shaped pattern for these relationships as found by our study. The U-shaped pattern suggests that different connectivities develop at different rates (Colver and Longwell, 2013). One speculation is that in midadolescence, the connectivities between different parts of the brain become weaker. This may explain some of the aspects of adolescent behavior and emotion, but we were not able to directly test this point (Konrad et al., 2013).
SAL and DMN connectivity has been reported to be stronger in adults compared with children (Uddin et al., 2011). We did find an increase in connectivity strength with increasing age between these two domains (cluster 2). In the same study, it was reported that connectivity between CC and SAL is also stronger in adults compared with children. In our study, we found that this connectivity is stronger for subjects in the middle of their teens compared with young or older subjects.
Apart from the effect of different analyses on the results, we can think of two reasons for these differences. One reason may be a difference between the spatial maps that each study associated with these domains. Although studies generally try to choose similar maps for domains to facilitate comparison across studies, major differences in the dataset and methods limit the ability to match regions perfectly across studies. Another possible contributor is the different age ranges. In their study, they have used subjects with age ranges 7–9 to represent children and subjects with age ranges 19–22 to represent adults. This approach may cause some brain development trajectories to go undetected.
In our study, by using a dataset with a broad age range (3–21) and fitting a quadratic polynomial (instead of linear polynomial), we discovered nonlinear maturation of different functional connections. This might suggest that the specific differences between children and adults will differ depending on the age ranges used.
While the above results suggest a general trend in connectivity patterns within and between domains, the primary finding of this study is that different components within domains demonstrated different connectivity patterns with age. For example, while VIS is reported as largely representing increasing connectivity with increasing age, the VIS domain was represented in all six clusters. Apart from cluster 5, which only represented within VIS domain connectivity (representative of decreases in connectivity with increasing age), the remaining clusters demonstrated age-related changes both within and between domain connectivity. The strongest change in between domain connectivity was represented by increasing connectivity between VIS and DMN (cluster 2).
Another way our results can be viewed is that brain maturation is a complex notation that has both linear and nonlinear trends, which occur distinctly across different parts of the brain. This complexity makes the definition of maturity state for the brain quite challenging. This view is in line with a recent article that makes the point that defining an age number as threshold to group individuals' brains into mature and not-mature state is not particularly straightforward (Somerville, 2016). We hope this work will provide guidance for future studies of this complex and important topic.
Limitations
There were several limitations to this study. First, our study was cross-sectional; to thoroughly explore brain development, a longitudinal study should be performed. Gender has been shown to modulate different aspects of development (Rubia et al., 2013; Spielberg et al., 2015). In this initial analysis, our focus was on the linear and nonlinear effects across multiple networks/components, which were already fairly complex without incorporating interactions with gender. However, gender is an important factor to consider, and we plan to focus on differences in male versus female linear and nonlinear changes in a future project.
Another limitation unique to age-related studies is the use of a single MNI atlas to normalize all subjects to a common template. In a recent study, Kundu et al. (2018) showed that the component number reduces for older subjects. We are aware of this limitation, but to be able to investigate brain connectivity development, we decided to use the same number of components and a common map for all subjects to avoid inducing an age-related bias into the analysis.
Another limitation of this study was that to acquire the data, different scanners were used in different sites. Different scanner parameters were optimized to make the data from different sites similar to each other (Jernigan et al., 2016). We also included site as confounding regressors in all our statistical analysis. In addition, we have done several other analyses to check that the scanner site does not impact the results greatly as explained in the Methods section (Fig. 5). Based on the results, we can see that if we exclude one scanner from the data and calculate age–sFNC relationship the results do not change greatly (the correlation values are all >0.96, which is very high). In addition, using bootstrapping we showed that single scanner results are quite similar to results from other subset (with matched age range to the specific scanner).
Finally, the impact of motion on the results in any neuroimaging study cannot be denied (Power et al., 2012). Considering this limitation is of great importance in any neuroimaging study including children and adolescents as younger subjects tends to move more in the scanner compared with the older ones. We have tried to reduce the impact of motion on the results at several different steps.
First, subjects with excessive motion were removed. In addition, using ICA has enabled us to remove the motion-related components from the analysis. As a last step, the motion was included in all the statistical models as a nuisance regressor. In addition, PING dataset used PROMO approach that has been shown to reduce the impact of motion artifact on the raw brain images.
As an additional step, to evaluate the impact of motion, we ran an analysis using a more stringent motion threshold (for omitting subjects). We calculated the static FNC of the new subsample of data and correlated the results with age for each component pair. Figure 6 summarizes the results between the main subjects (mean framewise displacement threshold was 3 mm) and the new subsample of subjects (mean framewise displacement threshold was 0.5 mm). As we can see in Figure 6, the correlation of sFNC with age is quite similar between the two sets of subjects, giving us confidence that motion does not impact the general conclusions of this study.
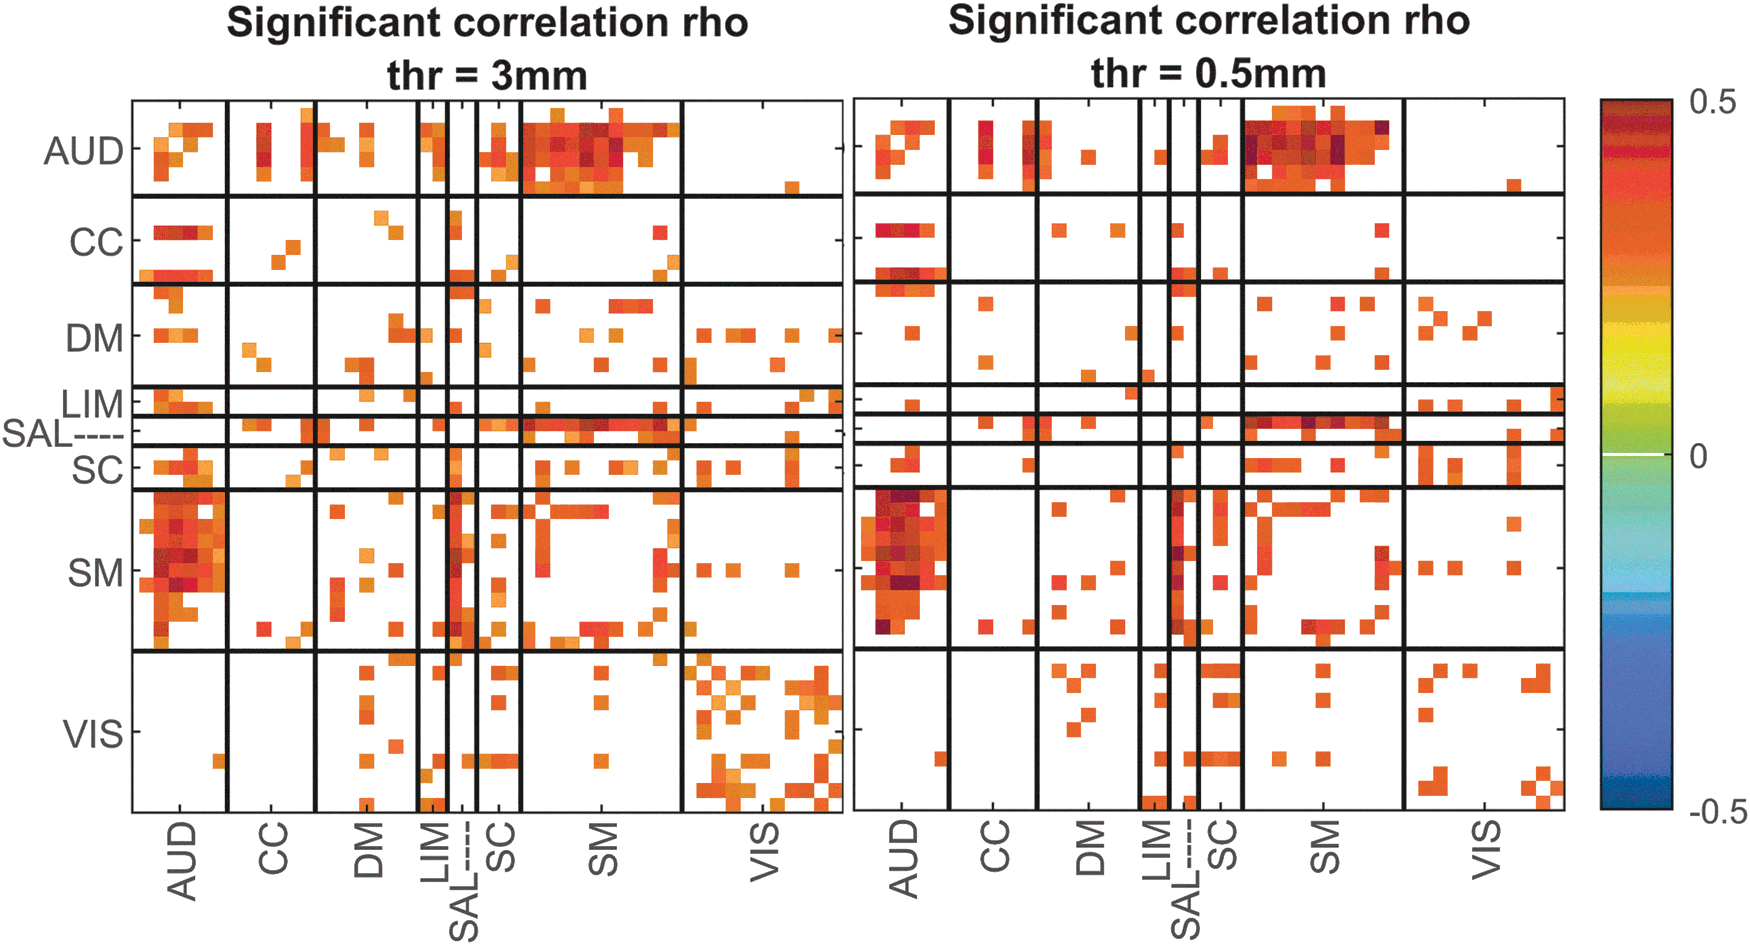
Significant correlation values between age predictor and static FNC using two threshold values to omit subjects with high motion. Color images are available online.
Conclusion
In this study, we used a large dataset with a broad age range and examined the nonlinear development of connectivity in resting-state networks. The primary result of the study is that connectivity between different functional domains of brain shows a broad array of developmental patterns both within and across cognitive domains. Although our findings largely agree with previous results reported in the literature, some of our findings were inconsistent with the previous literature. We believe that the reason for these differences might be our broad age range of youth participants and the use of quadratic curve fitting. Such an approach enabled us to demonstrate that connectivity patterns change dynamically throughout childhood, and that connectivity patterns are highly dependent on the regions assessed.
We found that the developmental trajectory of functional brain connectivity from childhood to early adulthood has both linear and nonlinear patterns; therefore, by using either approach in isolation, specific patterns will be missed. Finally, while we cannot rule out any influence of SES on brain development, the current results support the conclusion that age is a contributor to connectivity variation when controlling for SES effect.
Footnotes
Author Disclosure Statement
No competing financial interests exist.
Funding Information
This work was funded in part by National Institute of Health grants P20GM103472/5P20RR021938, R01EB005846, 1R01DA040487 and the National Science Foundation grants 1539067 and 1631819. Data collection and sharing for this project were funded by the Pediatric Imaging, Neurocognition and Genetics Study (PING) (National Institutes of Health Grant RC2DA029475). PING is funded by the National Institute on Drug Abuse and the Eunice Kennedy Shriver National Institute of Child Health & Human Development. PING data are disseminated by the PING Coordinating Center at the Center for Human Development, University of California, San Diego.