
Abstract
Brain neocortex is usually dominated by visual input (with eyes open [EO]), whereas this visual predominance could be reduced by closing eyes. Cutting off visual input from the eyes (with eyes closed [EC]) would also benefit other sensory performance; however, the neural basis underlying the state-switching remains unclear. In this study, we investigated the brain intrinsic activity of either the EO or EC states by using the resting-state functional magnetic resonance imaging data from 22 healthy participants. The 10 resting-state networks (RSNs) of these participants were explored by the independent component analysis method. Within each RSN, various network parameters (i.e., the amplitude of low-frequency fluctuation, the voxel-wise weighted degree centrality, and the RSN-wise functional connectivity) were measured to depict the brain intrinsic activity properties underlying the EO and EC states. Taking these brain intrinsic activity properties as discriminative features in a linear classifier, we found that the EO and EC states could be effectively classified using the intrinsic properties of the sensory dominance networks and the salience network (SN). Further analysis showed that the brain intrinsic activity within the sensory dominance networks was constantly overwhelmed during the EC state relative to that in the EO state. The SN might play a key role as a switcher between state-switching. Therefore, this study indicated that the brain intrinsic activity in the sensory dominance networks would be enhanced with EC, which might improve other sensory-relative task performance.
Introduction
The operation of brain neocortex exhibits multisensory properties, in which the visual modality is essentially of predominance (McGurk and MacDonald, 1976). Other sensory-relative task performances could be improved as this visual predominance reduced (Bavelier and Neville, 2002; Colavita, 1974; Merabet et al., 2008; Zubek, 1969). Although the obvious modulation effect of visual modality on brain function has been observed, the underlying neural essence remains unclear.
Brain intrinsic connectivity networks (Seeley et al., 2007) or resting-state networks (RSNs) (Greicius et al., 2003) are highly self-organized brain functional systems and can be characterized in terms of various network properties. Notably, previous studies have shown that the brain activity is response to task performances within a module (Cordes et al., 2000; Greicius et al., 2003). During the resting state, the brain intrinsic activity within or between RSNs has been demonstrated to highly resemble the brain activity during task state (Fox et al., 2006; Mantini et al., 2007; Zuo et al., 2010). Despite this, extensive evidence suggested that the interactions between RSNs exhibit functional implications, which embody the resource integration from different brain intrinsic networks (Bullmore and Sporns, 2012; Cole et al., 2013).
Regarding the brain intrinsic organization, many previous studies have indicated that the intrinsic brain activity properties are affected by the situation whether the subjects have their eyes open (EO) or eyes closed (EC) (Liang et al., 2014; Yan et al., 2009; Yang et al., 2007). Switching between the EC and EO states could alternate the brain intrinsic activity in many RSNs, such as the visual (Yang et al., 2007), the sensorimotor (Liang et al., 2014; Marx et al., 2004), and the default-mode network (DMN) (Yan et al., 2009; Yang et al., 2007). In addition, previous researches have observed the influences of switching between the EC and EO states on functional connectivity (He et al., 2009; McAvoy et al., 2012; Wu et al., 2010; Yan et al., 2009; Zou et al., 2009) and network topological organization (Jao et al., 2013; Xu et al., 2014). More importantly, the brain intrinsic activity properties could be effectively used to distinguish the EO and EC states (Zhang et al., 2015).
The present study aimed to systematically investigate the modulation effect between the EC and EO states on an aspect of the brain RSNs by using a linear classifier discrimination approach. To this end, we collected the resting-state functional magnetic resonance imaging (rs-fMRI) data from 22 healthy participants under the EO and EC states, and we adopted the independent component analysis (ICA) to identify in total of 10 RSNs. Then, the intrinsic activity properties, that is, the amplitude of low-frequency fluctuation (ALFF), the voxel-wise weighted degree centrality (WDC), and the functional connectivity strength (FCS) of each RSN were measured. These RSN properties were used as classification features in a linear classifier discrimination analysis to distinguish the EC and EO states and to determine the contributions of each RSN on discrimination.
Materials and Methods
Participants
We recruited 22 right-handed healthy voluntaries (11 males/11 females, 20 ± 2.74 years) from the Beijing Normal University for the present study. This study was approved by the institutional review board of the Beijing Normal University Imaging Center for Brain Research. Written informed consent was given by each participant. All the participants were paid as compensation for their participation. Participants were instructed about the two conditions (i.e., EO and EC) before the fMRI scanning. To prevent the participants from falling into sleep while scanning, participants were instructed to perform a “pseudo” arithmetic judgment task in which the arithmetic question presented in an auditory form. Participants would press the left button when the question was correct, otherwise, would press the right button. This procedure was designed to make sure that these participants stayed awake during the EO and EC states. However, there were actually no tests during the real scanning procedure so as to retain the purity of the resting-state data.
Data acquisition
All participants were scanned on a 3T Siemens Trio TIM MR scanner equipped with a 12-channel, phased array receiver-only head coil at the Imaging Center for Brain Research, Beijing Normal University, using a gradient-echo echo planar imaging (EPI) sequence with the following parameters: TR = 2000 ms, TE = 30 ms, 33 transverse slices, slice thickness = 3.5 mm, gap = 0.7 mm, flip angle = 90°, FOV = 224 × 224 mm, matrix = 64 × 64, and 240 volumes covering the whole brain. The rs-fMRI scans of the EC (lasting for 8 min) and EO (lasting for 8 min) conditions from each participant were obtained in the same session. The acquisition order of the EC and EO scan data were counterbalanced across all participants. In addition, this study also collected a high-resolution 3D brain structural image for each participant using the MP-RAGE sequence with the implementation of the parallel imaging scheme GeneRalized Autocalibrating Partially Parallel Acquisitions (GRAPPA) (Griswold et al., 2002) and an acceleration factor of 2.
Data preprocessing
Data preprocessing was performed using the GRETNA toolbox (Wang et al., 2015) and SPM8 (
Spatial ICA
We used GIFT (
Brain intrinsic activity metrics
Amplitude of low-frequency fluctuation
The ALFF (Yang et al., 2007) is applied to measure the spontaneous neural activity within each voxel of the whole brain by using the preprocessed data. ALFF is defined as the total power within the frequency range between 0.01 and 0.1 Hz and thus indexes the strength or intensity of low-frequency oscillations (Yu-Feng et al., 2007).
In this study, the ALFF calculation was carried out using GRETNA. The preprocessed time series of each voxel was first transformed to the frequency domains by using fast Fourier transform. Then, the square root was calculated at each frequency of the power spectrum, and the averaged square root was obtained across 0.01–0.1 Hz, which was taken as the ALFF. Finally, the ALFF of each voxel was divided by the global mean ALFF value in each participant for normalization.
Voxel-wise WDC
The voxel-wise WDC based on graph theory was used to quantify the functional integration of each voxel with others in a network. Degree centrality (DC) is the number of edges connecting to a node. For a weighted graph, it is defined as the sum of weights from edges connecting to a node or the node strength. DC can be computed as the formula:
All nodes are defined 1 ≤ i ≤ N, 1 ≤ j ≤ N, and
The functional integration was measured using the FCS indicated by the Pearson correlation coefficients of the BOLD (blood oxygen level-dependent) signals between each specific voxel and the rest of other voxels. All the selected voxels were masked by the grey matter probability map in SPM8 (threshold = 0.2). A threshold procedure was used to remove the spurious weak correlations, in which the statistical significance was set at the level of p < 0.05 (Bonferroni corrected). Particularly, only the positive correlation was included into the calculation because of the ambiguous interpretation and detrimental effects of the negative correlation on test–retest reliability (Fox et al., 2009; Murphy et al., 2009; Wang et al., 2011; Weissenbacher et al., 2009). And a distance threshold was set at 75 mm to classify the long and short functional connectivity (He et al., 2009); thus, there were three types of WDC (i.e., long-degree-centrality [LDC], short-degree-centrality [SDC], and DC) acquired for each participant. Based on these metrics, the values of the DC at each voxel indicated the different functional integrations over the whole brain. Of note, the WDC was normalized within each individual by translating to Z-scores using the GRETNA toolbox.
RSN-wise FCS
The mean time series of each RSN were extracted to calculate the inter- and intra-RSN FCS. Pearson correlation coefficients between the mean time series of any possible pair of the 10 RSNs were calculated, which led to a 10 × 10 correlation matrix for each subject. Finally, the average correlation of each RSN with other RSNs was measured using a previous method (He et al., 2009; Jiang et al., 2004). In this method, the FCS between two RSNs was equally divided into the two RSNs.
Discriminative analyses
A maximum uncertainty linear discriminant analysis (MLDA) (Thomaz et al., 2004, 2007) was used to classify the EC and EO states. A previous study suggested that the MLDA approach seeks a set of projection directions that maximize the between-class margin and simultaneously minimize the within-class compactness (Dai et al., 2014). Based on this classifier, the EC and EO label can be mapped onto the discrimination hyperplane, and the amount of discriminative feature can be quantified using the coefficients of the discrimination hyperplane. A leave-one-out cross-validation approach was adopted to optimize the feature selection by reducing the data dimensions (p < 0.05, paired two-tailed t-tests, FDR correction). The feature selection was performed only in the training data so as to keep the independence of the training data and the test data. By using a linear classifier, the contribution of the single RSN property (e.g., WDC) to discrimination was evaluated, independently. After classification, we explored whether the classification accuracy was significantly above the random level by using an approach, which randomly disturbed the order of category labels to repeat the classification process (n = 100).
Besides the single linear classifier approach, a multi-classifier approach (each RSN property corresponding to a linear classifier) was applied to investigate the concatenate effect of all these RSN properties (i.e., ALFF, LDC, SDC, DC, and FSC) on the classification performance. In this multi-classifier discrimination process, a weighted voting method was used to evaluate the contribution of these RSN properties to classification. Notably, using this approach, the weight of each RSN property on classification was first evaluated with each single linear classifier (one RSN property related to a linear classifier), and then, the weight of these RSN properties from different classifiers was further calculated by using a voting approach (for details, see Dai et al., 2012). And finally, the significance of the multi-classifier discrimination results was evaluated using the approach as the single linear classifier.
To date, the multi-classifier method has been successfully used to identify Alzheimer's disease (AD) patients from normal controls (Dai et al., 2012) and to distinguish the resting-state and task-state fMRI (Gao et al., 2017). The more detailed information of this method could also be found in these previous studies (Dai et al., 2012; Gao et al., 2017).
Results
Resting-state networks
We identified 10 brain functional RSNs by using the spatial ICA method. These RSNs include the anterior DMN, the auditory network, the central executive network, the dorsal attention network, the high-level visual network (HVN), the posterior DMN, the primary sensory-motor network (PSMN), the primary visual network (PVN), the salience network (SN), and the ventral motor network (VMN) (Fig. 1 and Table 1).
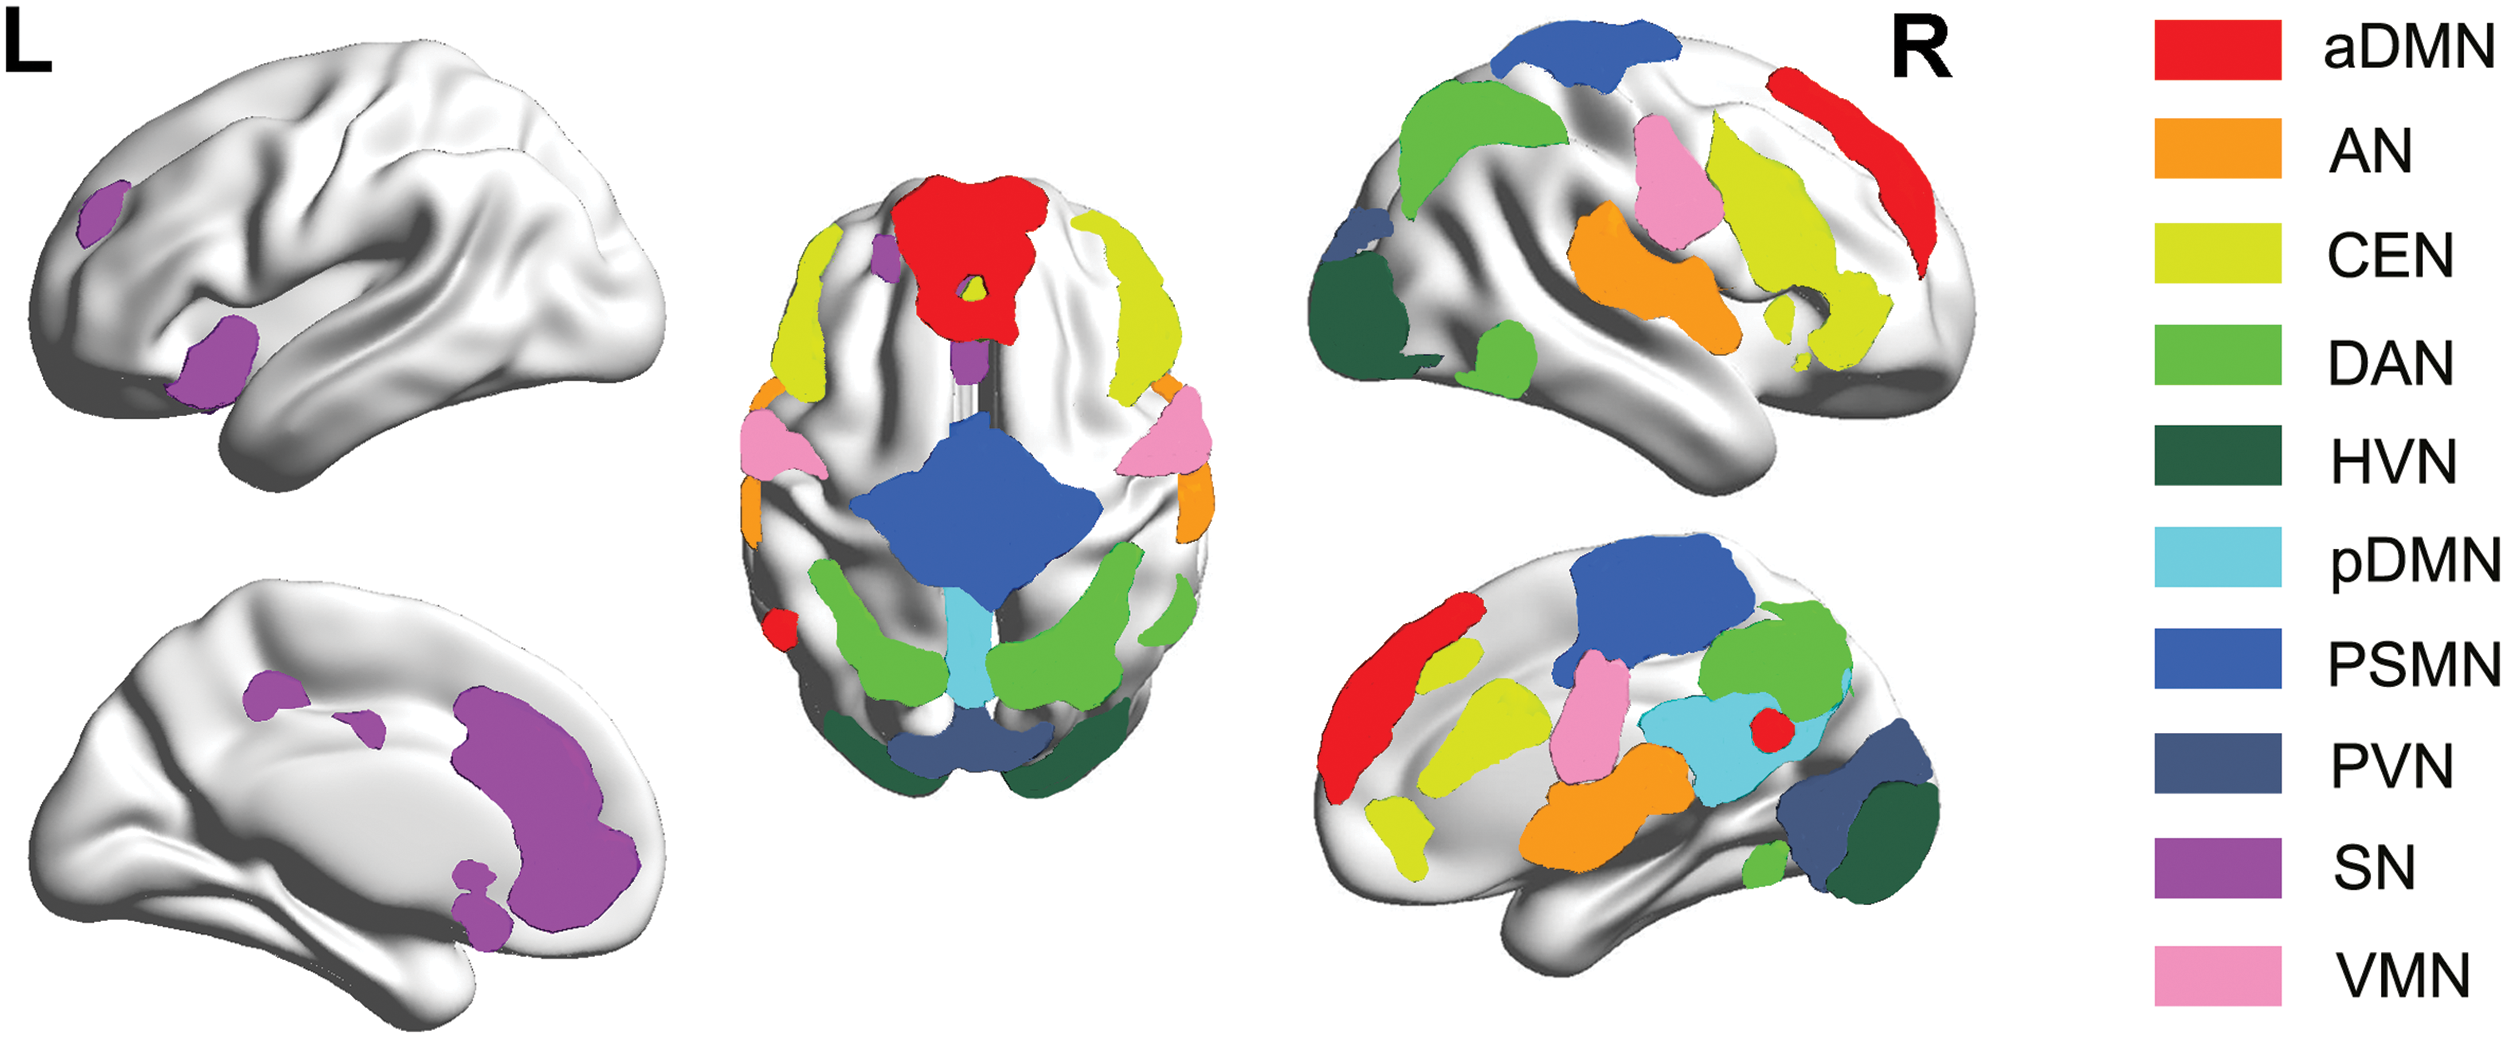
RSNs derived from the spatial ICA analysis. aDMN, anterior default-mode network; AN, auditory network; CEN, central executive network; DAN, dorsal attention network; HVN, high-level visual network; ICA, independent component analysis; pDMN, posterior default-mode network; PSMN, primary sensory-motor network; PVN, primary visual network; RSNs, resting-state networks; SN, salience network; VMN, ventral motor network. Color images are available online.
Details of the Selected Resting-State Networks
The coordinates are the peak voxel value of each RSN in MNI space. The regions are those in which the peak voxels were located at. The t-value indicates the scores of the one-sample t-test (p < 0.001, FDR corrected).
aDMN, anterior default-mode network; AN, auditory network; CEN, central executive network; DAN, dorsal attention network; FDR, false discovery rate; HVN, high-level visual network; L, left hemisphere; MNI, Montreal Neurological Institute; pDMN, posterior default-mode network; PSMN, primary sensory-motor network; PVN, primary visual network; R, right hemisphere; RSN, resting-state network; SN, salience network; VMN, ventral motor network.
Brain intrinsic activity metrics
We also calculated the voxel-wise ALFF, LDC, SDC, and DC metrics and RSN-wise FCS metric of these 10 brain RSNs for each participant under the EC and EO states, separately (Fig. 2).

The maps of ALFF, LDC, SDC, DC, and FCS across 10 RSNs of EC and EO.
Univariate comparisons of RSN intrinsic activity
By using a paired two-tailed t-test, we statistically compared all the brain intrinsic activity properties of each RSN we measured between the EO and EC states. The results showed that the ALFF under the EC state was significantly higher than that in the EO state in the PSMN (p = 0.0061, FDR) and the VMN (p = 0.0062, FDR). Higher LDC in the EC state than in the EO state was observed to be statistically significant in the PVN (p = 0.0001, FDR), the HVN (p = 0.0004, FDR), the PSMN (p = 0.0005, FDR), and the VMN (p = 0.0039, FDR). However, the EO state exhibited a higher LDC than the EC state in the SN (p = 0.0029, FDR). The SDC of the PSMN (p = 0.0006, FDR) in the EC state was higher than that in the EO state. The EC state obtained a higher DC in the HVN (p = 0.0077, FDR), the PSMN (p = 0.0002, FDR), and the VMN (p = 0.0213, FDR), but a lower DC in the SN compared with the EO state. On an aspect of FCS, the EC state exhibited a higher functional connectivity integration in the PVN (p = 0.0026, FDR) and the HVN (p = 0.0061, FDR) than the EO state (Table 2).
Results of Comparisons of Resting-State Network Intrinsic Activity Between Eyes Closed and Eyes Open
Delta value = EC − EO.
p < 0.05; ** p < 0.01.
ALFF, amplitude of low-frequency fluctuation; DC, degree centrality; EC, eyes closed; EO, eyes open; FCS, functional connectivity strength; LDC, long-degree-centrality; SDC, short-degree-centrality.
Discrimination performance
By using MLDA, this study found that the selected RSN properties exhibited a discriminative power to distinguish the EC and EO states (Table 3). The discriminative accuracy of the classifier with each of the RSN properties (i.e., ALFF, LDC, SDC, DC, and FCS) as features was significantly above the random level (all p < 0.05), respectively. More importantly, by using a multi-classifier approach, the present findings showed that the concatenate effect of these RSN properties could obviously improve the classification accuracy (Table 3).
The Classifier Performance in Discriminating the Eyes Closed and Eyes Open Conditions
Concatenate feature, all the above features used for classification, * p < 0.05.
Contribution of RSNs in discrimination
By using these RSN properties as classification features, the present study used the MLDA classifier to discriminate the EO and EC states. All the selected features and their relative weights in each classifier are shown in Figure 3. We found that the well-identified features are mainly located at the visual network, the sensorimotor-related network, and the SN. It should be noted that the spontaneous activity amplitude (ALFF) and the functional connectivity strength (DC, LDC, SDC, and FCS) contributed differently in the classification performance. On an aspect of ALFF, we found that the sensorimotor-related networks (i.e., the PSMN and the VMN) took important roles in classification of the two states. As to the FCS, the visual network and the SN as well as the sensorimotor network were essential as features to discriminating the two states. Furthermore, the different types of RSN properties performed differently on discrimination. For details, the short-term functional connectivity (SDC) of the PSMN could effectively discriminate the two states, but the visual network, the sensorimotor network, and the SN were more sensitive to long-term functional connectivity (LDC) for the classification. In addition, the voxel-wise functional connectivity and the RSN-wise functional connectivity carried discriminative information in classification of the EO and EC states. The visual network performed well on the RSN-wise functional connectivity, whereas the visual network and the sensorimotor network achieved classification performance from the voxel-wise functional connectivity features.
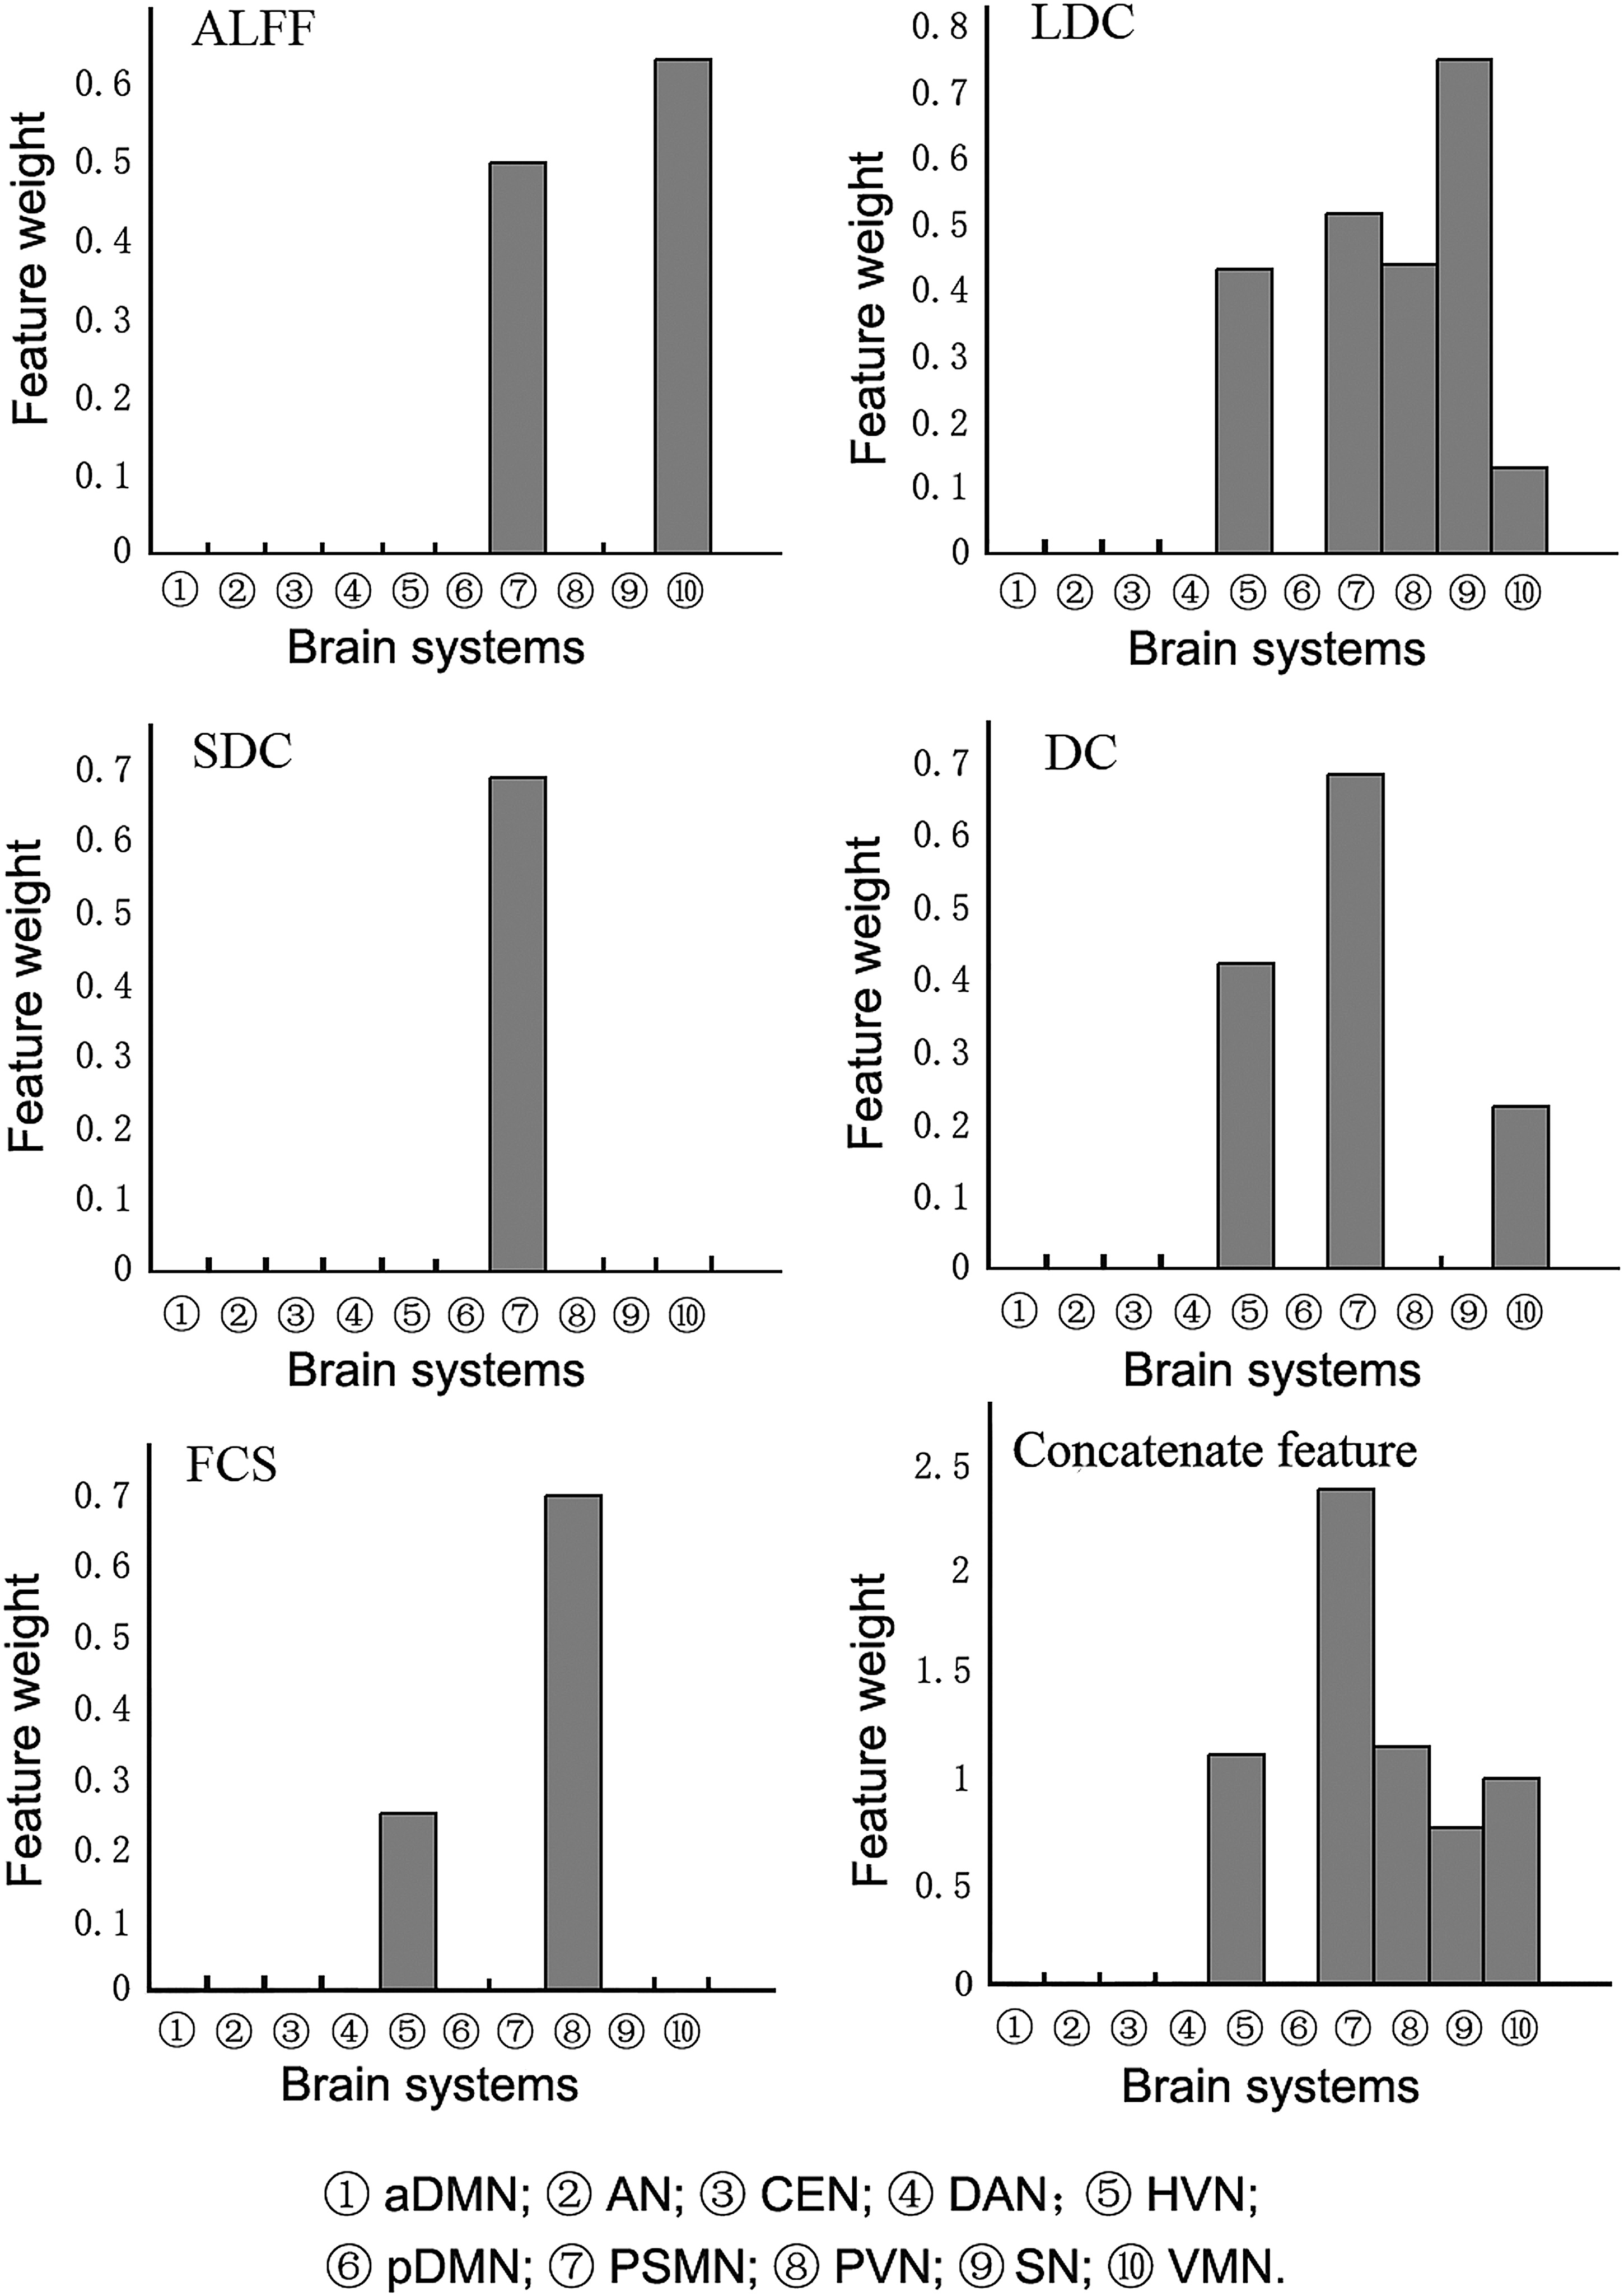
The features for classification with discriminative power related to 10 RSNs.
Discussion
By using MLDA, our study explored the alternation of the brain intrinsic activity between the EC and EO states. The main findings can be summarized as follows: (i) the intrinsic activity of sensory dominance networks (i.e., sensorimotor and visual networks) was significantly modulated by switching between the EC and EO states; (ii) the SN may play an important role when the spontaneous amplitude activity and the functional integration of sensory dominance networks were altered between the EC and EO states; (iii) the brain intrinsic activity in the sensory dominance networks enhanced during the EC state compared with the EO state.
Previous studies have documented that there are distinct mental states between the EO and EC states (Marx et al., 2003; Mazard et al., 2005). There is an “exteroceptive” mental activity state that includes the ocular motor and attention activity during EO, and an “interoceptive” mental activity state of multisensory and imagination activity during EC (Marx et al., 2003, 2004). Previous electroencephalography (EEG) studies also indicated that the distinct oscillatory signatures have been identified in the alpha-band at prestimulus that relates to an upcoming visual stimulus process (Fox and Raichle, 2007; Foxe and Snyder, 2011). Similarly, these findings suggested that the alpha-band power increased on the EC states (Fox and Raichle, 2007). In other words, it suggested that the neural spontaneous fluctuation activity constitutes a visual operation mode that is activated automatically even without retinal input.
It should be noted that the exteroceptive and interoceptive states may be related to specific brain activity patterns (Marx et al., 2003, 2004). Correspondingly, many previous studies have provided experimental evidence that the eye behavioral states (e.g., the EO and EC states) modulate the brain spontaneous fluctuation activity within several systems, including the sensorimotor network (Assaf et al., 2006; Mazard et al., 2002, 2005), the visual network (Yang et al., 2007), and the DMN (Yan et al., 2009). Our previous study, using the support vector machine, found that the spontaneous fluctuation activity of the sensorimotor network could directly classify the EO and EC states (Zhang et al., 2015). Furthermore, the present study also showed that the fluctuation amplitude pattern related to the sensorimotor and visual networks could accurately distinguish the EC and EO states. The well-identified features for the classification were primarily derived from the intrinsic properties in the primary visual cortex, the high visual cortex, the VMN, and the PSMN.
Beyond this, we also found that the functional interaction properties of the sensory-motor network (SMN) and the visual network (VSN) performed well in the classification of the two states. In particular, our study showed that the voxel-wise and the RSN-wise FCS contributed differently to the classification. On the RSN-wise FCS, we found that the visual network (i.e., PVN and HVN) took important role in the classification. While, on the voxel-wise FCS, the HVN and the sensorimotor network (PSMN and VMN) exhibited great power in classification. More importantly, we also found that the different types of voxel-wise FCS performed differently. On the short-term voxel-wise FCS, we found that the PSMN is a core network to classify the two states; but on an aspect of the long-term FCS, we found that the visual network (PVN and HVN), the sensorimotor network (PSMN and VMN), and the SN converged to show great power in the classification. Of note, we observed that the spontaneous activity of sensorimotor network was associated with that of the PVN when participants stayed in the EC state (Wang et al., 2008). This observation may show that the mental imagery-related pattern is an important aspect of the difference of the EC and EO states. Moreover, the SN may take an important role in this process. Previous studies have demonstrated that the SN plays a role that may reflect dynamic switching between large-scale networks (Beaty et al., 2015; Seeley et al., 2007). Similarly, a previous study of our group showed that the functional connectivity directionality of the SN within a Bayesian network could effectively discriminate the two states (Zhang et al., 2015). In this study, we also found that the concatenate effect of the salience, sensorimotor, and visual networks in classification. Potentially, the mental imagery-related neural activity underlying the modulation of the SN is a characteristic of the change between the EC and EO states. Nevertheless, these findings will help to understand the neural substrate of brain functional reconfiguration underlying the switch between the EC and EO states.
Although the involved regions were distinct in terms of different types of features, all these observed features were predominately located at the SMN and VSN and were consistently improved in the EC state compared with the EO state. It should be noted that the visual deprivation may improve performance of other-modal perception, and even the immediate visual deprivation (e.g., eye closure) can enhance somatosensory processing sensitivity (Stronks et al., 2015). Corresponding to these observations, this study also figured out the improvement of the intrinsic activity of sensorimotor network in terms of the ALFF and FCS. Besides this, our study found that the intrinsic activity of the VSN was also improved during the EC state when compared with that of the EO state. These findings were highly corresponding to many previous studies which found that the BOLD signal variability was significantly improved during the EC state when compared with that of the EO state (Bianciardi et al., 2009; Fukunaga et al., 2006; Horovitz et al., 2008; Jao et al., 2013; Liang et al., 2014). An important issue should attracted attention is that the level of glucose metabolism in visual regions was significantly decreased during the EC state (Riedl et al., 2014) as well as the change of regional cerebral blood flow (Zou et al., 2015). That is, there is a low level of energy metabolism during the EC state related to the EO state; the physiological findings may provide new evidence to support the Chinese old sayings that “to conserve energies by closing the eyes.” Despite this, the intrinsic activity measured by the BOLD signal was significantly improved not only in the visual networks but also in other sensory dominance networks such as the sensorimotor network, and the higher intrinsic activity may be corresponding to a specific mental state in which the imagination process is of importance, which may be related to the vividness imagery occurring in the resting mind especially during the EC state.
Conclusion
This study employed a linear classifier discriminative approach to identify the brain intrinsic activity in classification of the EC and EO states. We found that the spontaneous amplitude activity and the functional integration properties of the sensory dominance networks (i.e., sensorimotor and visual networks) and the SN were significantly stronger during the EC state compared with the EO state. The results support the proposition that the EC state may induce a specific mental state with enhanced intrinsic activity of sensory dominance networks underlying the modulation of the SN. Our findings might help understand the neural substrate of the brain functional reconfiguration that underlies the alternation between distinct mental states (i.e., the EC and EO states).
Footnotes
Acknowledgment
This work was supported by the Natural Science Foundation of China (No. 31600907).
Author Disclosure Statement
No competing financial interests exist.