
Abstract
Slow wave oscillation is a synchronous oscillatory mechanism that is a characteristic wave type of the cerebral cortex during physiological deep sleep or anesthesia. It may play an important role in cortical analysis of sensory input. Our goal was (1) to develop optimal conditions for the induction of this slow rhythmic activity in adult rat cortical slices, (2) to identify connections through which the activity propagates between coupled cortical regions, and (3) to study the pattern of horizontal and vertical flow of activity developed spontaneously in cortical slices. Experiments were performed on intact or differently incised rat cortical slices. According to our results, spontaneous cortical activity develops reliably in slightly modified artificial cerebrospinal fluid, first in the entorhinal cortical region of horizontally cut slices and then it spreads directly to the perirhinal (PRh) cortex. The activity readily generated in layer 2/3 of the entorhinal cortex then quickly spreads vertically to upper layer 2–3 in the same area and to the neighboring regions, that is, to the PRh cortex. Synchronization of activity in neighboring cortical areas occurs through both callosal connections and layer 2–3 intrinsic network, which are important in the propagation of spontaneous, inherent cortical slow wave activity.
Introduction
Understanding the role of oscillatory network activity, especially in the neocortex, may be important for clarifying the functional connections between single-unit activity and more complex functions such as behavior (Buzsaki and Draguhn, 2004). Synchronous oscillatory mechanisms underlie slow wave oscillation (SWO, frequency smaller than 1 Hz), which is one of the most characteristic wave types of the cerebral cortex, manifesting synchronously in the whole cortex during physiological deep sleep or anesthesia (Cunningham et al., 2006; Steriade et al., 1993b). In the meantime, on the cellular level the membrane potential of principal cells spontaneously fluctuates between an active phase, when the plasma membrane is depolarized, and action potentials are readily generated; and an inactive, quiet phase, when the plasma membrane is hyperpolarized.
In fact, oscillation is generated by synchronous excitation among large networks of cortical pyramidal neurons; then, presumably disfacilitation interrupts ongoing network activity, resulting in network silence, mostly due to activation of fast spiking GABAergic interneurons (Sanchez-Vives and McCormick, 2000; Tahvildari et al., 2012); however, the exact background of this process is still debated.
SWO may play an important role in maintaining synaptic homeostasis. It helps the stabilization of changes in synaptic plasticity and enhances the formation of hippocampus-dependent memory engrams (Marshall et al., 2006; Tononi and Cirelli, 2006).
Corticocortical and intracortical neuronal connections play a basic role in initiation, maintenance, and propagation of synchronized slow cortical rhythmic activity (Sanchez-Vives and McCormick, 2000). An inherent characteristic of these networks is the capability of developing rhythmic activity, which might be influenced by some subcortical inputs, the most important of which is the thalamic input (Crunelli and Hughes, 2010; Lemieux et al., 2014). These cortical networks consist of neurons that are activated synchronously and more or less simultaneously via their functional connections (Shepherd, 2011). Network activity is mostly generated by excitatory cells; however, inhibitory interneurons may modulate the excitatory network activity, as seen in the case of SWO (Kirkcaldie, 2012; Tahvildari et al., 2012).
Cortical slab or ex vivo brain slice preparations serve as suitable models for studying the inherent cortical network activity (Timofeev et al., 2000; Vilagi et al., 2001). Although loss of the majority of inputs is inevitable, the intrinsic activity of local cortical networks can be studied without any confounding factors, such as subcortical structures (i.e., thalamus), hormones, or the biological clock (Anderson, 1981; Carter and Shieh, 2010).
It is already known that adult ferret, cat, or mouse cortical slices (Frohlich and McCormick, 2010; Reig and Sanchez-Vives, 2007; Tahvildari et al., 2012) or young rat cortical slices (Wester and Contreras, 2012) readily generate slow rhythmic activity (SRA), which propagates as network activity in the cortex. However, in adult rat cortical slices, it is a poorly investigated phenomenon; thus, in the present experiments, our goal was to develop optimal conditions—including the orientation of the slice cutting (coronal, transversal, or horizontal) and the composition of the artificial cerebrospinal fluid (ACSF)—for the induction of SRA in rat cortical slices. Hereafter, we wanted to identify the region of initiation of SRA along with the direction and distance of propagation in cortical slice preparation. Our further goal was to identify connections through which the activity propagates between coupled cortical regions and also to determine the pattern of interlaminar vertical flow within distinct regions.
In our experiments, we used slice preparations of the parahippocampal region. These horizontal brain slices contained entorhinal (ERh) and perirhinal (PRh) cortices, the regions of which readily developed SRA spontaneously while incubated in proper, modified ACSF (mACSF). We found that SRA is generated in the deep layer 2/3, which then spreads to the upper layers. In addition, extracortical and/or supragranular connections may play an essential role in the horizontal propagation of SRA between coupled cortical regions and the synchronization of the cortical areas mentioned earlier. Using different cortical sectioning—spanning across different layers—between ERh and PRh, we tested the contribution of different connections in the horizontal propagation of SRA.
Materials and Methods
Animals
Experiments were performed on adult, male Wistar rats weighing 140–220 g (Toxicoop Ltd., Budapest, Hungary). Experimental design conformed to the rules of European Communities Council Directive of 24 November 1986 (86/609/EEC), and the study was approved by the Animal Care and Use Committee of Eötvös Loránd University and Budapest Animal Health Care Authority (
Slice preparation
In vitro experiments were performed on rat cortical slices (53 slices from 47 rats) by using standard procedures. Animals were decapitated in deep chloral-hydrate (Hungaropharma, Budapest, Hungary) anesthesia, and the brain was quickly removed from the skull. A block was dissected and 400-μm-thick horizontal slices were cut with vibratome (EMS-4000; Electron Microscopy Sciences, Fort Washington, PA) in ice-cold standard ACSF, the composition of which was in mM: 126 NaCl; 26 NaHCO3; 1.80 KCl; 1.25 KH2PO4; 1.3 MgSO4.7H2O; 2.4 CaCl2.2H2O; 10 glucose, pH 7.2–7.4 and was saturated with carbogen (95% O2, 5% CO2). The slices were incubated at room temperature for an hour in slightly modified mACSF to induce spontaneous low-frequency activity in the slices. The mACSF contained (in mM): 126 NaCl; 26 NaHCO3; 3.25 KCl; 1.25 KH2PO4; 0.8 MgSO4.7H2O; 2.0 CaCl2.2H2O; and 10 glucose, pH 7.2–7.4. In the recording chamber, slices were maintained at 33°C ± 0.5°C in a humidified, carbogenated gas atmosphere, and they were also perfused with mACSF. Recordings were performed from ERh and PRh cortices.
Recording procedures
Extracellular recordings were performed either on intact slices or on slices that were cut between the ERh and PRh cortices in different ways. Five types of incisions were applied perpendicularly to the pial surface, made with a surgical knife in the recording chamber before the activity recording (Figs. 2d and 4b). The corpus callosum (CC), or the supragranular layers (layers 1–3, SG), or the infragranular layers (layers 4–6, IG) of the cortex, or the entire cortex (EC); or the entire cortex together with the corpus callosum (EC+CC) were cut through. In case of the EC and EC+CC groups, incisions were performed either before or after the development of SWO.
The recording of spontaneous low-frequency events was carried out with 2 extracellular glass microelectrodes filled with 1 M NaCl (5–15 MΩ), positioned according to two recording paradigms (Fig. 1d inset). In one case, one recording electrode was positioned in the layers 2–3 of medial ERh and the other was in the layers 2–3 of PRh. In the other case, one of the electrodes was also in the layers 2–3 of medial ERh, whereas the other was positioned in layer 5 of PRh. Data of ERh L2/3 from the two recording paradigms usually were analyzed separately—where direct comparison of PRh recording with its own ERh recording was necessary—but if it was possible then we pooled them. In the Results section, it is always noted. Signals were amplified by a Supertech Signal Conditioner (Supertech Ltd., Pécs, Hungary); band-pass filtered between DC and 5 kHz, 1000 × , sampling rate: 20 kHz; and digitized by an NI-6023E A/D card (National Instruments, Austin, TX) for off-line analysis.

General characteristics of SFPs and single-unit activity.
After the stabilization of spontaneous activity, 20-min-long recordings were made in each recording paradigm. After every recording, photos were made of the positions of the electrodes that were later used for determining the exact position and distance of the electrodes for calculating velocity of propagation.
Following glass electrode recordings, a linear, 16-channel platinum-iridium multielectrode (40 μm electrode diameter, 125 μm distance between neighboring leads; Neuronelektród Ltd., Budapest, Hungary) was positioned perpendicularly to the pial surface of the slices, and 10-min-long recordings were made from the lateral and medial ERh. Signals were filtered, amplified by a 16-channel Supertech BioAmp amplifier (Supertech Ltd., Pécs, Hungary; band-pass filtered between 0.16 and 10 kHz, 1000 × , sampling rate: 10 kHz), and digitized by an NI-6023E A/D card (National Instruments) for off-line analysis. Data recording and further analysis were performed with Mathworks Matlab-based custom-written software. Data acquired from 53 slices were included in the final analysis.
Histology
To verify that the incisions were made in the proper layers, histological sections stained with gallocyanin dye were prepared from the slices previously used for recording (Figs. 2d and 4b). The 400-μm-thick slices were fixated in 4% paraformaldehyde overnight and then cut further into 50-μm-thick slices. The dyeing was performed as follows: 16–24 h gallocyanin, 10 min distilled water, 5 min 50% alcohol, 5 min 70% alcohol, 2 × 5 min 96% alcohol, 2 × 5 min 100% alcohol, 10 min xylene, and mounting with Depex mounting solution.
Vertical spread of activity within the ERh.
Data analysis
Detection of spontaneous field potentials
Spontaneous field potentials (SFPs), recorded with glass microelectrodes in mACSF, were digitally filtered by 300–5000 Hz band-pass filter to extract multiunit activity (MUA); then, continuous MUA root mean square (MUA-RMS) was calculated and smoothed with a 11-point filter. Median value of the whole MUA-RMS signal was calculated; then, 1.25–1.5 × the median was used as minimum threshold for the detection of MUA deflections related to SFP events. Where MUA-RMS deflection crossed the threshold, it was referred to as initiation time of SFP; termination point of SFP was determined similarly. The result of automatic detection was verified manually. Field recordings were used to characterize the SFPs by determining the amplitude (mV) and frequency (Hz) of the activity at the two recording sites. The time elapsed between the appearance of the first peak of each SFP recorded simultaneously in ERh and PRh cortices was also determined and defined as latency (ms). Using the calibrated photos of the electrode positions, exact electrode distance was measured, and on the basis of latency, velocity of propagation (mm/sec) was calculated. In case of the multichannel recordings, SFPs were detected with findpeak.m Matlab function; first, peaks of SFPs were detected based on thresholding and were manually further verified. The selected field potentials were further analyzed with spline inverse current source density (iCSD) analysis (for details see below). Data from the ERh of slices with incisions (recorded with the multielectrode array) were also involved in the analysis of multichannel recordings.
Spike detection and clustering
After extracting MUA with a 300–5000 Hz band-pass filter, spike detection and clustering were made for the characterization of the spikes (amplitude, shape). Spike detection and superparamagnetic clustering were made by semiautomatic wave_clus software (Quiroga et al., 2004). Threshold of detection was 7 × SD of the filtered signal. Automatically generated clusters were manually verified based on the interspike-interval (ISI) histograms, and manual changes were performed where it was necessary to avoid overclustering.
Spline iCSD analysis
One-dimensional current source density (CSD) was calculated as the (negative) second spatial derivative of the measured potential. Using the Pettersen toolbox, one matrix (F) was generated from the field potential and peak data (Φ) by using the standard electrostatic theory; then, the CSD (C) was estimated by using the inverse of this matrix (F
−1) according to the following equations:
The spline iCSD method assumes a smoothly varying CSD between the activation registered in separate electrode contacts (Pettersen et al., 2006).
The detection of the initiation time of SFPs based on CSD distribution was made by a thresholding method. CSD traces were calculated for 16 virtual channels by using iCSD matrix data. Threshold value for detection was defined as ±5% of the maximal absolute CSD value. The first intersection point of CSD trace and the threshold values in negative and positive direction were determined; the earliest value was used as initiation time for that channel. The earliest initiation time among all the channels was used as SFP initiation time, and the corresponding layer was also determined based on cortical depth of the given channel.
High-intensity sink and source locations on calculated CSD distribution were detected by a custom-written Matlab script—using 2D peak detection; then, cortical depth and timestamp values were stored in a database for further analysis.
To get group data for CSD patterns using the previously calculated CSD distributions, we collected cortical depth profile of CSD activity at the highest current intensity segments with the following method, using a Matlab-based script: The highest absolute values of current sources/sinks were localized in CSD data; then, ±10 ms of CSD data from this time location at each cortical depth was averaged. These averaged curves were calculated for each slice, normalized to its highest absolute value, and finally plotted separately for incision groups as individual lines in Figure 2f. Group mean profile was also plotted as a black line.
Statistical analysis
For statistical analysis, variance was calculated from the data of every measurement group with F-test; then, using these variance values, paired t-test was performed on all possible data pairs. Level of significance was p < 0.05. All data are presented as mean ± standard error of the mean.
Results
Analysis of activity registered with glass microelectrodes
General characteristics
In the preliminary experiments, we tried to find proper slice orientation and solution (mACSF) in which spontaneous slow oscillation develops in the rat neocortical slices. In our mACSF, K+ concentration was slightly increased; whereas Ca2+ and Mg2+ were slightly decreased, which mimics “physiological conditions,” and spontaneous cortical activity can develop in the ERh region of horizontally cut slices. This SRA developed 1.5–2 h after the placement into the recording chamber and was stably recordable for several hours (Fig. 1a). The SRA appeared with low frequency (<1 Hz), together with related MUA and single-unit activity. Single-unit activity was absent in both cortices between the active states (Fig. 1a) and showed a cortical region-specific firing pattern during SRAs (Fig. 1b, c). In the ERh, there were two time windows for firing during SRA events (Fig. 1b) according to the peri-event time histogram (PETH), with a high variance for timing precision of firing. This behavior resulted in two local maxima of PETH; the higher variance of cell firing is also clearly visible on the auto-correlogram of the same cell. In the PRh, single-unit activity was also restricted to SRA events, with a similar biphasic firing pattern; however, cell firing had a more precise timing, resulting in two narrow time windows (Fig. 1c). SRA recorded from layers 2–3 of the ERh and from layers 2–3 and layer 5 of the PRh were characterized in detail; ERh L2/3 recordings of the two recording paradigms were averaged separately (Fig. 1d and Table 1). In intact slices, the frequency of the SRA developed in ERh was in all cases similar to SRA developed in PRh that were simultaneously registered from the two areas. As expected, we did not observe any significant difference in the occurrence of the episodes of SRA in the ERh and PRh cortices. However, the amplitude of ERh and PRh SRA differed significantly in both recording groups: PRh SRA had smaller amplitude than ERh SRA. The mean firing rate of cells in the recording areas also showed differences, and ERh cells had higher firing rates. Latency time of first single-unit activity compared with underlying SFP event had no significant difference among cortical regions. However, in the PRh, single-unit activity was less detectable; almost the same number of cells were activated during the SRA than in the ERh (ERh: 64 cells, PRh: 60 cells).
General Characteristics of Spontaneous Field Potentials
Relevant averaged data of SFP events grouped according to recording protocols for ERhC and PRhC. The values are given as mean ± SEM.
Indicates significant differences at p < 0.05.
AP, action potential; ERhC, entorhinal cortex; PRhC, perirhinal cortex; SFP, spontaneous field potentials; SEM, standard error of the mean.
Vertical propagation of the activity in ERh of intact and transected slices
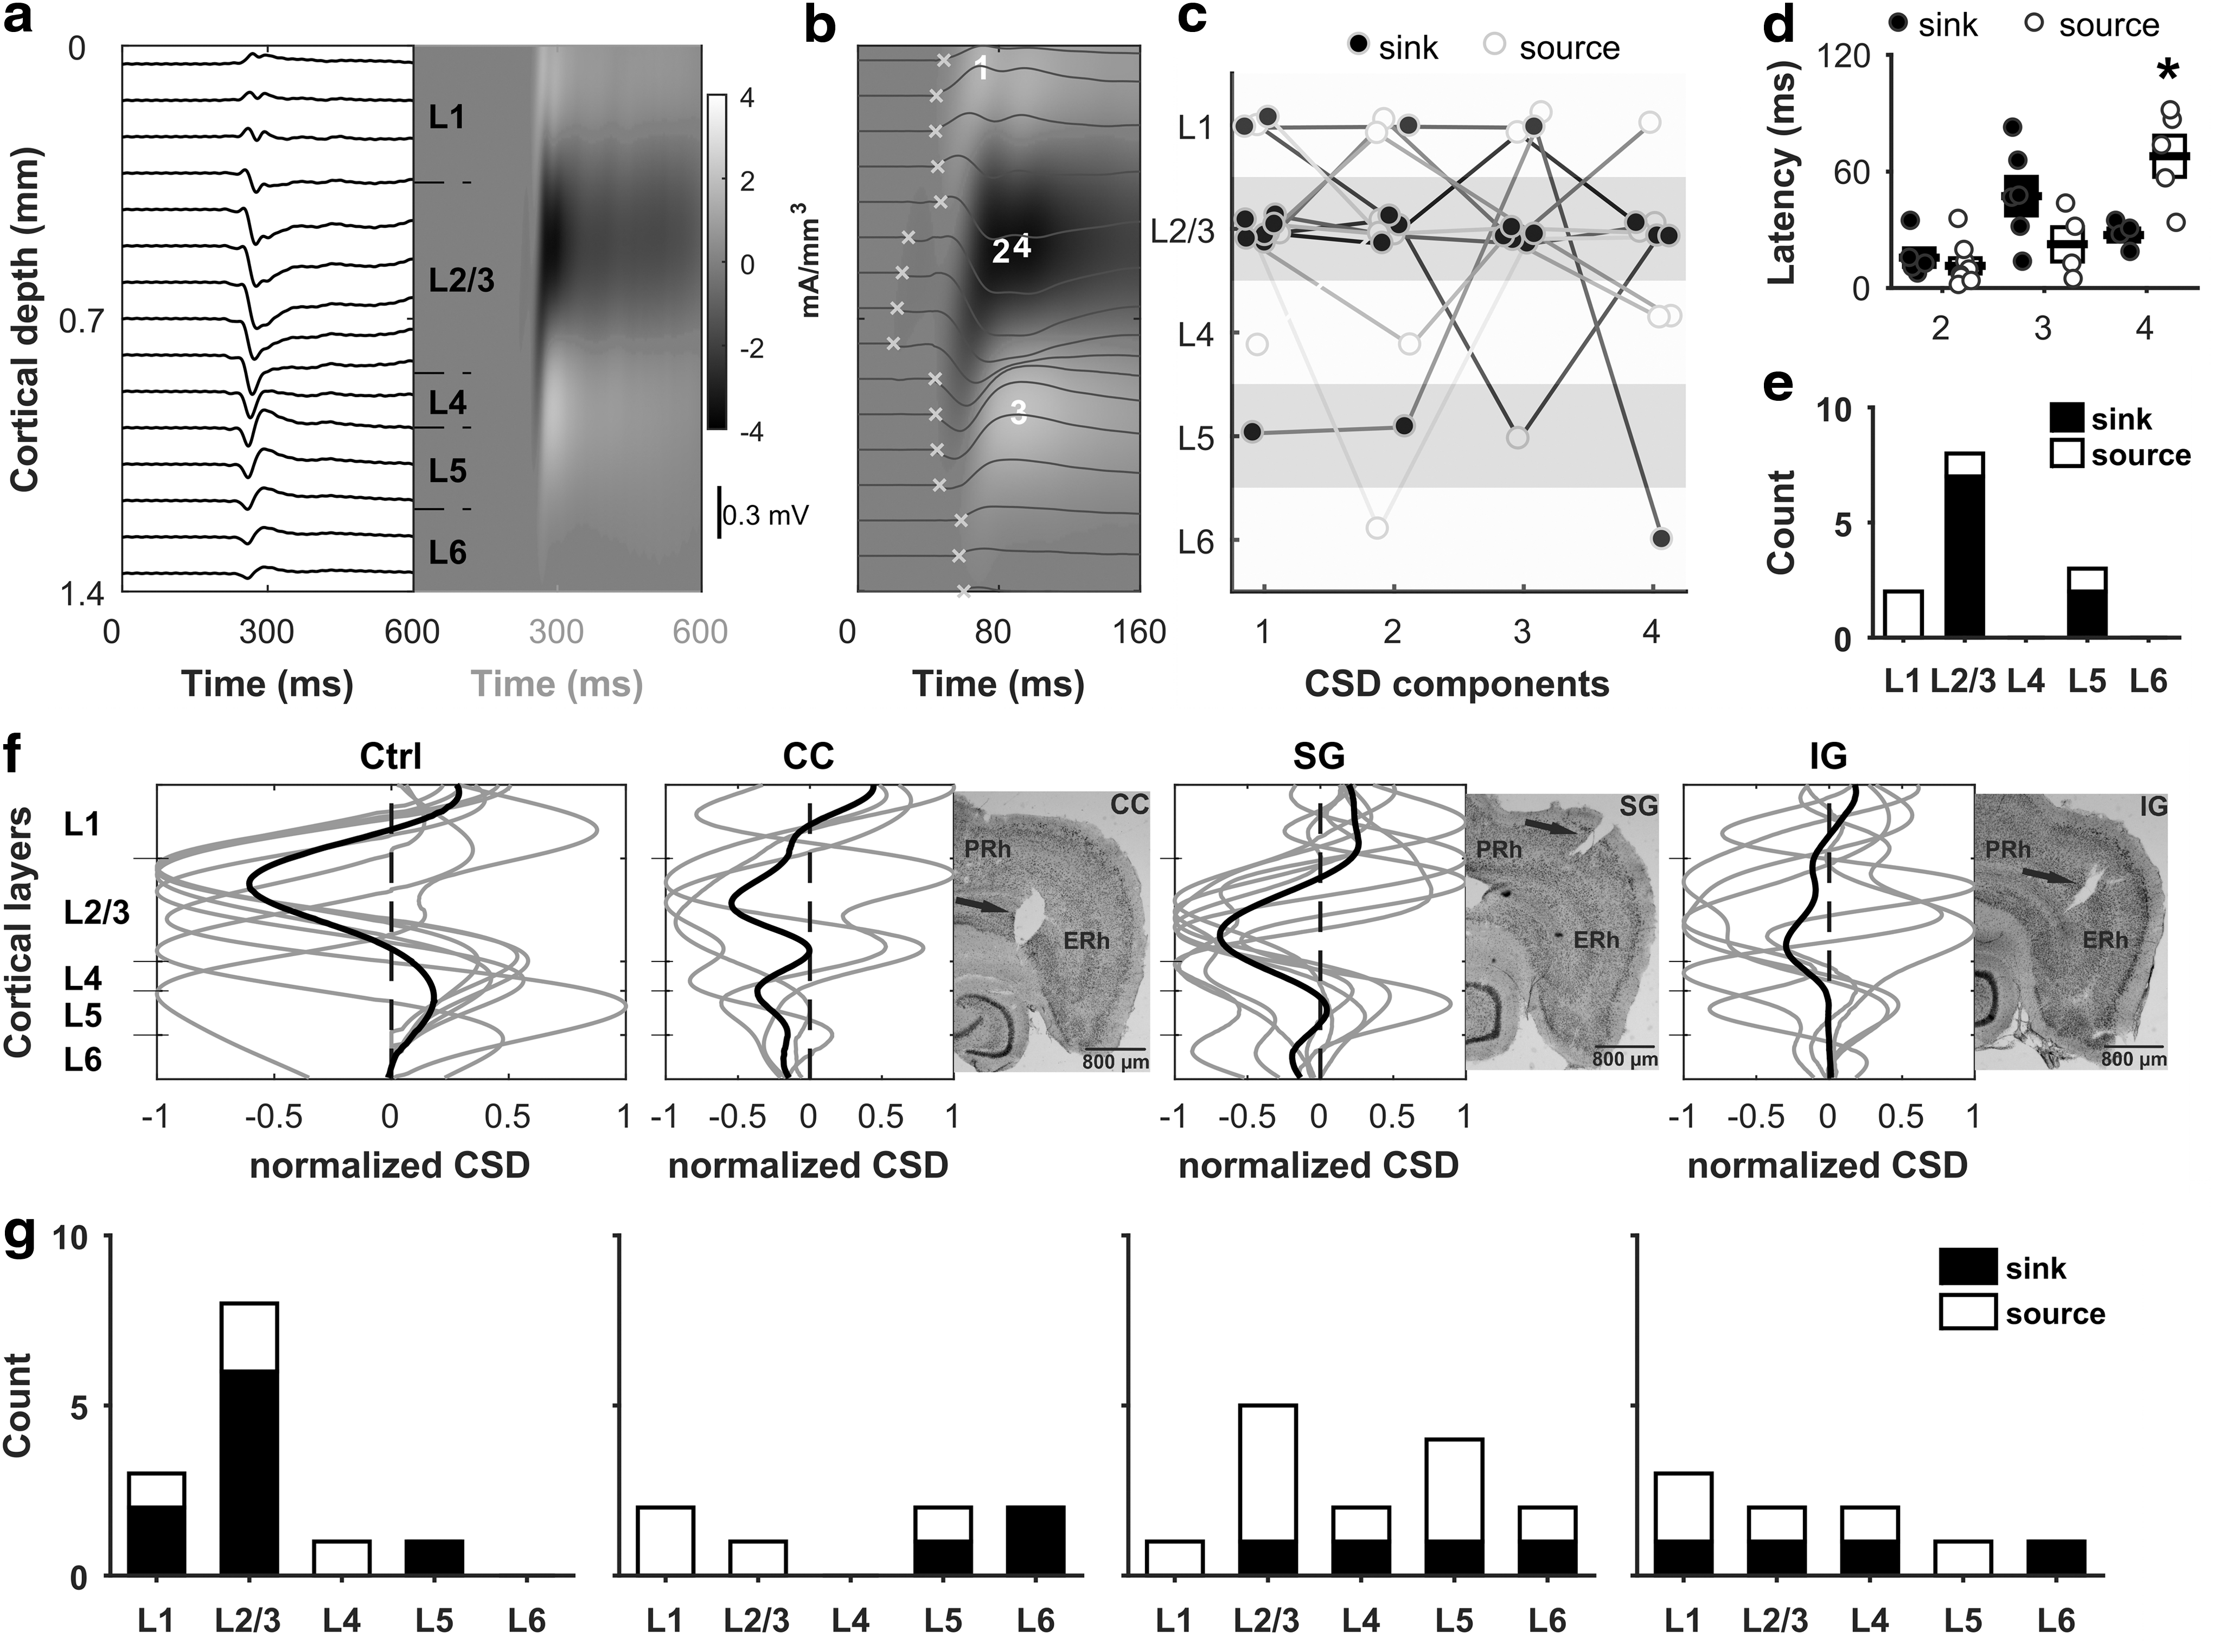
Multichannel recordings were made from the ERh. The spontaneous activity was detectable in the entire thickness of the cortex (Fig. 2a, b). Episodes of SRA were usually initiated with a current sink in deep layer 2/3, which rapidly spread into the upper layer 2/3 (Fig. 2a, b). Then, higher latency current sources were found in layers 1, 4, and 5. Black traces on Figure 2b show CSD curves of SFPs; the cross marks are the initiation time points of CSD events on each channel. The earliest initiation point was regarded as the initiation time of SFP; the distribution of initiation sites (the corresponding cortical layers) of these points is summarized in Figure 2e for all control slices (n = 13), showing that SFPs were mostly initiated in L2/3 with a current sink; however, with lower probability they could be triggered in L5 or with a current source in L1, 2/3, or 5 (Fig. 2e).
The automatic 2D peak detection (white numbers on Fig. 2b) was performed on CSD patterns of 13 slices (Fig. 2c). In nine slices, the first huge CSD component was a current sink and in six out of nine slices the sink appeared in L2/3 (Fig. 2c, g first panel). The following CSD components were mostly current sinks in SGs; whereas in IG layers, usually current sources were detected (Fig. 2c). Latency time of huge sink/source components related to the first huge CSD event was also summarized (Fig. 2d). First and second components were found in every slice, whereas the third and fourth components were present only in 10 and 9 of 13 slices, respectively. Note that spatial distribution of CSD initiation events (Fig. 2e) and of huge first CSD components (Fig. 2g first panel) shows minor differences.
To determine the most characteristic current sink/source cortical distribution, we calculated the normalized CSD (Fig. 2f) for the time segment of SFP where the highest intensity sink/source was found [for details see Borbély et al. (2018)]. Usually, in control slices, a current sink appeared in layer 2/3, whereas a current source was found in IG layers. In CC slices, the IG activity was strongly reduced; sinks and sources appeared in SG layers with equal chance. The SG slices showed a similar pattern as was found in intact slices; however, the current sink shifted to deeper layer 2/3 and the occurrence of sources in SG layers increased. In IG slices, relevant sink/source activity was found only in SG layers.
The cortical distribution of the first relevant CSD events was analyzed in detail in the different incision groups (Fig. 2g). In most control slices, the first event of SFP was a sink in layer 2/3; however, other ways of initiation were also found with lower probability. This characteristic pattern was altered in every incision group.
Analysis of connections between ERh and PRh cortices
To determine the role of callosal and intracortical connections in the horizontal propagation and synchronization of SRA, three types of incisions were performed: Either the CC or the SG or the IG layers was transected (Fig. 2d).
The frequency of SFPs recorded from the ERh (pooled data) of the four groups differed significantly between the intact and CC slices (p = 0.0002), between the intact and SG slices (p = 0.007), between the CC and IG slices (p = 0.002), as well as between SG and IG slices (p = 0.039; Fig. 3a and Table 2).

Horizontal propagation between adjacent regions.
Frequency Changes of Spontaneous Field Potentials in Sectioning Groups
Data for SFP frequency in either intact, corpus callosum (CC), supragranular (SG), infragranular (IG) layers, or entire cortex but not the corpus callosum (EC) or entire cortex and corpus callosum (EC+CC) transected slices. The values are given as mean ± SEM.
In intact slices, activity propagated horizontally from ERh to the direction of PRh (Fig. 3b). We did not find any intact slice where the activity was initiated in the PRh. The frequency of the SRA s was always less than 1 Hz in both areas (Figs. 1d and 3a) and was always identical between the ERh and PRh cortices in each measurement. In a fraction of transected slices, the activity was initiated in PRh (Fig. 3c). There were also significant differences between the SRA frequencies registered from layers 2–3 of the PRh in intact and CC slices (p = 0.0003); as well as in intact and SG slices (p = 0.016). We found no significant differences between frequencies registered from layer 5 of the PRh in any of the recording groups (Fig. 3a).
Analyzing the difference in latency of the SRA recorded simultaneously in ERh and PRh cortices of intact and cut slices, we divided slices according to the direction of activity propagation (ERh to PRh and PRh to ERh; ERh L2/3 recordings were separated according to the recording protocols, so each PRh recording was compared with its own ERh recording; Fig. 3d). In intact slices, the activity initiated in the ERh in all cases and then propagated to the direction of the PRh. The activation of the PRh preceded the activation of the ERh in 1 out of 16 cases in the CC slices, 10 out of 19 cases in the SG slices, and 3 out of 18 cases in the IG slices (Fig. 3d). There was no significant difference between the groups, but one cannot fail to observe that transecting the SG layers had notable effects on the stability of the neural network of the slices.
Regarding the velocity of propagation between the two cortical regions, groups with reversed propagation direction were not separated in the analysis. Comparing the different incision groups and recording protocols, we did not find any significant difference (Fig. 3e).
Synchrony between coupled cortical regions
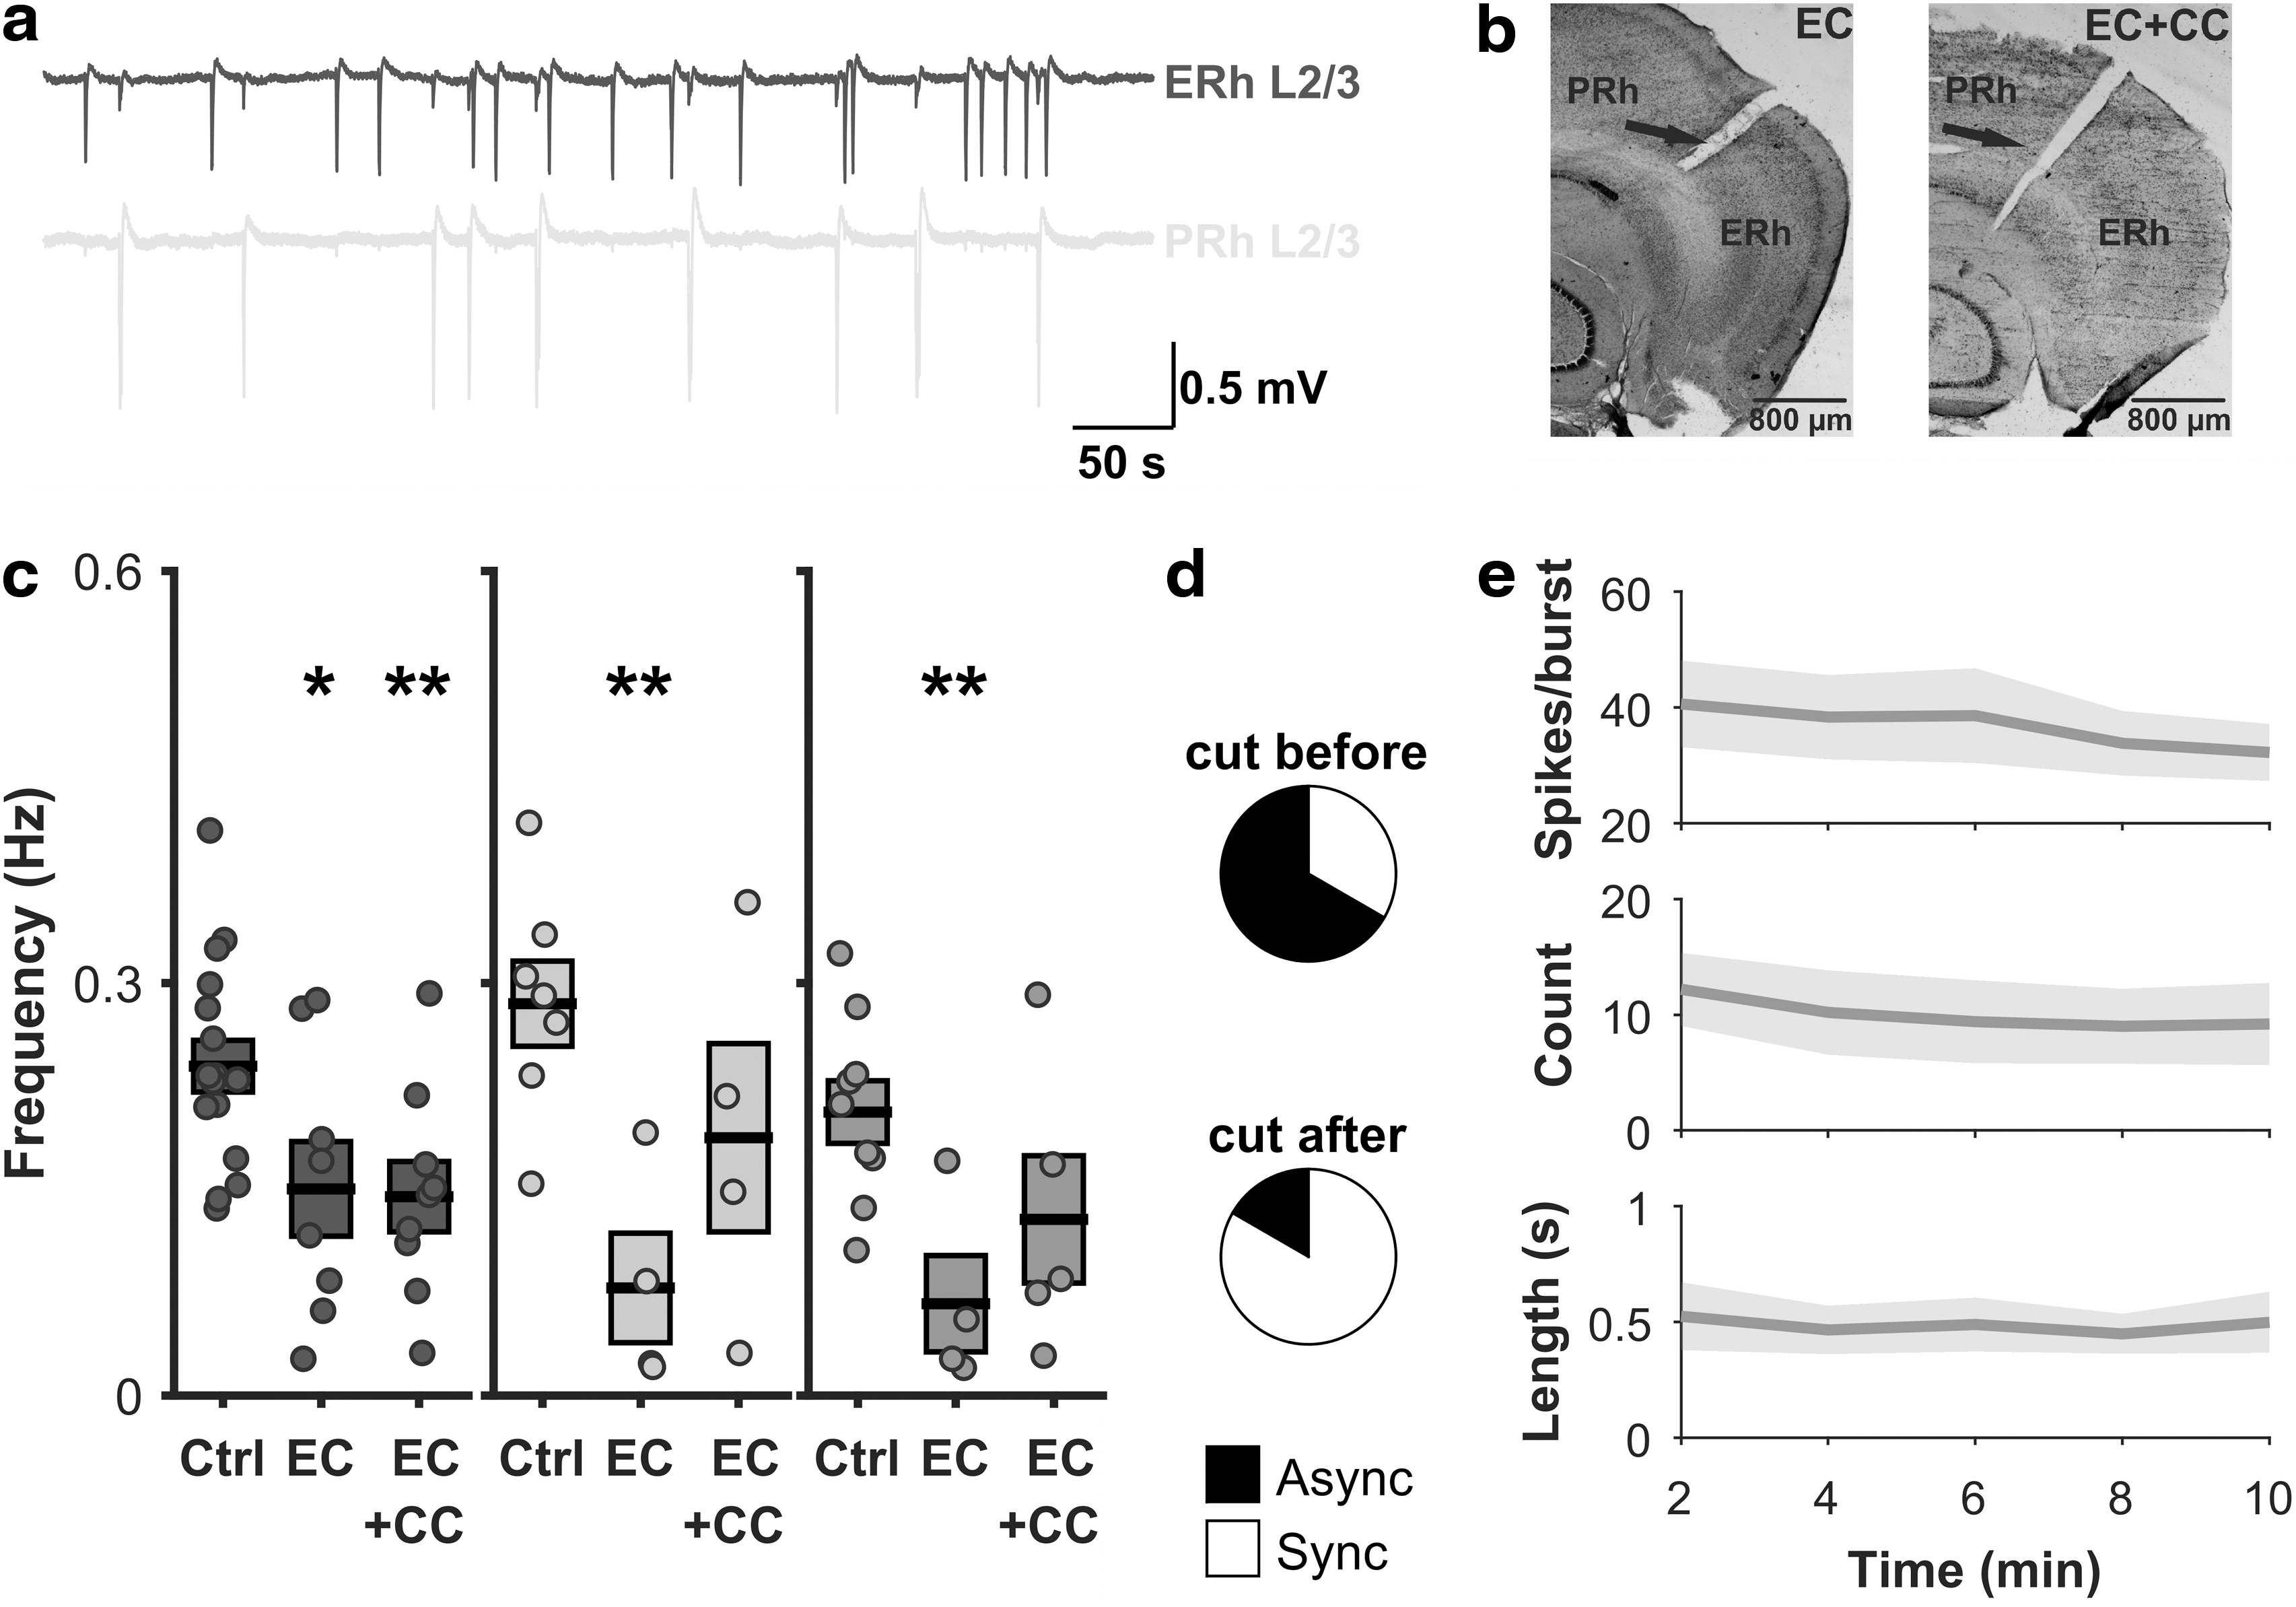
To further analyze the synchronization of the activity and interregional spread between ERh and PRh cortical networks, we created two additional dissection groups, each in two fashions. We isolated the two regions by cutting either through the entire cortex but not the corpus callosum (EC) or the entire cortex along with the corpus callosum (EC+CC; Fig. 4b). There was also a variation in the time of the incisions: The cut was made either at the time of putting the slices in the recording chamber, before the development of SRA, or after the development of the low-frequency oscillation (Fig. 4a). When analyzing the frequency of the activity, we did not take into account the time of the incision; data of slices cut before and after the development of SRA were pooled.
Synchrony between coupled cortical regions.
In all cases, frequency of the SFPs was less than 1 Hz (Fig. 4c). In the EC as well as the EC+CC slices, the frequencies registered from the ERh decreased significantly with respect to the values registered in intact slices. There was no significant difference between the EC and EC+CC groups in case of ERh frequency (p = 0.895).
However, frequencies registered from layers 2–3 of the PRh in EC slices were also significantly smaller than those registered from layers 2–3 of the PRh in intact slices (p = 0.003). There was no significant difference between the EC and EC+CC groups (p = 0.217).
Finally, frequencies registered from layer 5 of the PRh in EC slices were also significantly smaller than those registered from layer 5 of the PRh in intact slices (p = 0.006). There was no significant difference between the EC and EC+CC groups (p = 0.347).
The fact that the frequency of activity in EC and EC+CC slices did not differ significantly from each other shows that the two groups can be treated as one group in the following analysis. Although the standard error of the dataset is big, the reason of this variability is as follows. In some cases, the synchrony of the activity of the ERh and PRh cortical regions was eliminated and the activity of the PRh completely disengaged from the activity of ERh (Fig. 4a). Thus, in these asynchronous slices, this disengaged activity had lower frequency compared with the ERh activity in the same slice. This asynchronous pattern was mainly seen in case of those slices that were cut at the time of putting the slice in the recording chamber, thus before the development of the low-frequency oscillation.
Latency and velocity of the propagation could not be analyzed because of the previously mentioned asynchrony. Two out of three slices cut before the development of SWO produced asynchronous activity, whereas one out of six slices of the other group (cut after the development of the activity) showed asynchronous activity (Fig. 4d).
To verify the stability of the established activity, we used the spike data from the multichannel recordings to analyze the temporal changes in the number and length of bursts, as well as the number of spikes in one burst. We did not find significant changes in these parameters, which confirms the stability of the developed activity (Fig. 4e).
Discussion
In vivo studies on urethane anesthetized cats found 0.3–0.5 Hz (Crunelli and Hughes, 2010; Steriade et al., 1993a and 1993b), and under ketamine anesthesia 0.6–1 Hz (Crunelli and Hughes, 2010; Steriade et al., 1993c) SWO; whereas in natural deep sleep of humans, a 0.7–0.9 Hz oscillation was found to be a characteristic network activity (Achermann and Borbély, 1997). Evidence supports the fact that similar SRA may develop also in isolated brain slice preparation of ferret or mouse (Sanchez-Vives and McCormick, 2000; Tahvildari et al., 2012), and similar to the in vivo activity, it is characterized by an active (UP) and an inactive (DOWN) state. In our rat cortex slice model, the frequency of SRA developed in mACSF is similar to the previously mentioned SWO and single-unit activity was restricted to SRA episodes (Chauvette et al., 2010). The activity is first detectable in deep layer 2/3 of ERh; then, it spreads to upper layers, and via horizontal connections to neighboring cortical areas, mainly to PRh. Based on our results, for the appropriate propagation of SRA, both intact callosal connections and SG networks are required. Any injury in horizontal network connections might result in the appearance of a new initiation site, for example, the PRh.
The presence of SFP events in cortical brain slices is not typical in normal ACSF. But, after the application of convulsant agents such as bicuculline-containing or zero Mg2+ perfusion solution, spontaneous, synchronized epileptiform activity develops with characteristic time and frequency parameters (Avoli et al., 2002; Borbély et al., 2006; Chervin et al., 1988; Dulla et al., 2018; Gulyas-Kovacs et al., 2002; Pinto et al., 2005). On the other hand, a slight decrease of Ca2+, Mg2+ and an increase of K+ concentration of the perfused ACSF (mACSF) can induce slow, spontaneous, and synchronous rhythmic activity (Castro-Alamancos and Rigas, 2002; Cossart et al., 2003; McCormick et al., 2003; Sanchez-Vives and McCormick, 2000; Shu et al., 2003; Tahvildari et al., 2012) distinct from epileptiform seizure-like events (SLE) in ex vivo brain slices (Antonio et al., 2016; Wester and Contreras, 2012; Wu et al., 1999). It is known that an extracellular concentration of different ions largely influences the excitability of neurons. By decreasing the [Ca2+]o, the difference between the outer and inner charge of the membrane decreases, which affects the threshold of voltage-activated ion channels in general and the excitability of the neurons increases (Massimini and Amzica, 2001). Decreased [Mg2+]o contributes to activation of NMDA receptors, whereas increased [K+]o shifts the membrane potential to a more positive level, which also contributes to increased excitability (Antonio et al., 2016). It was previously proved that mACSF, which might slightly increase the excitability of neuronal networks, can induce SRA in ferret (McCormick et al., 2003; Sanchez-Vives and McCormick, 2000; Shu et al., 2003) or mouse (Castro-Alamancos and Rigas, 2002; Cossart et al., 2003; Tahvildari et al., 2012) cortical slices. Nevertheless, demonstrations of these types of activity from rat cortical slices are quite sporadic (Cunningham et al., 2006; Sanchez-Vives and Mattia, 2014). Since large amounts of experiments in connection with the neuronal network activity are performed on rat brain models, the main purpose of our project was to introduce a comparable rat ex vivo SRA model to characterize underlying mechanisms of pure cortical slow network activity. In our preliminary study, we optimized experimental conditions to induce SRA in rat brain slices, taking into consideration that the ionic composition of the perfusion solution has to be similar to the in vivo extracellular fluid (Sanchez-Vives and McCormick, 2000). We also planned to determine whether SRA can spread between adjacent cortical regions in our experimental conditions, and to identify the most important trajectories through which the synchronization processes occur. On the basis of data derived from other cortical regions (Kawaguchi, 2017), we supposed that both intracortical networks and callosal connections may have a role in the synchronization processes.
The parahippocampal region, consisting of the PRh, postrhinal, and ERh cortices, is an important transitional region of information flow between the hippocampus and the neocortex, to which areas it is linked via reciprocal connections (Canto et al., 2008; Jones, 1993; van Groen, 2001). Parahippocampal regions are, however, not just passive relay stations but also active participants in information processing, which is indicated by the fact that their integrity is essential in memory functions (de Curtis and Pare, 2004). According to former experiments, the parahippocampal area proved to be a rather excitable brain region, and SRA can easily be induced in brain slices prepared from these structures (Canto et al., 2008; Jones, 1993; van Groen, 2001).
Based on our results, we can say that in mACSF, horizontal slices of rat ERh generate SRA, which is different from SLEs. Epileptiform seizures typically develop in the presence of different convulsants. Application of bicuculline or 4-aminopyridine into the perfusion solution or omitting Mg2+ from it results in spontaneous SLEs in brain slices (Avoli et al., 2002; Borbély et al., 2006; Dulla et al., 2018). The synchronized spontaneous network events could be classified on the basis of a variety of parameters such as latency of appearance, frequency of occurrence, amplitude, duration, complexity and structure of individual discharges, or on the velocity of propagation. The basic characteristics of epileptiform discharges are different from those of SRA events, although the so-called interictal activity somewhat resembles it. In our acute brain slice preparation, SRAs occurred synchronously in ERh and PRh with a frequency less than 0.3 Hz and the length of each event was about 0.5 sec. In agreement with previous observations (Castro-Alamancos and Rigas, 2002; McCormick et al., 2003; Shu et al., 2003), we also found a strict correlation between field events and single-unit activity: Action potentials could just be observed during the active state of SRAs, but not during the silent periods. Taking it all round, SRA may develop in rat acute slice preparations of ERh and PRh cortices and its most important properties, the characteristic (<1 Hz) repetition frequency and the strict correlation between field events and single-unit activity, confirm its similarity to the activity measured in vivo during urethane anesthesia, and ex vivo in ferret visual cortex slices. Thus, our findings suggest that it may be considered an ex vivo rat brain slice model of low-frequency recurrent network activity.
We also demonstrated that in intact slices SRA is initiated in the ERh; then, it spreads to the PRh and temporal cortices via both SG and callosal projections. The CSD analysis of SRA shows that the activity is generated in deep layer 2/3 of the ERh and the more superficial layers are strongly activated afterward. This vertical propagation of activity in our rat horizontal cortical slices resembles data gained from occipital cortical areas of ferret (Sanchez-Vives and McCormick, 2000) and mouse (Neske et al., 2015) neocortical slices, as well as in vivo data observed in rat auditory cortical regions (Sakata and Harris, 2009). Seemingly, in contrast with the CSD results is the existence of layer 5 pacemaker cells that usually initiate similar network activities. Nevertheless, in this case as well, the main activity initiator in the background might be a layer 5 pyramidal cell; however, it can quickly activate some layer 2/3 neurons through their local network, which results in field potential changes that are detectable with the extracellular electrodes. Anatomical studies confirm that different principal cell types are present in layer 5 of ERh: A subpopulation of them sends axons to SG layers, which make the spreading of activity possible to upper layers (Canto et al., 2008; Jones and Lambert, 1990). Electrical stimulation of layer 5 can also induce single SRA events (Shu et al., 2003), which supports our result that a population of layer 5 pyramidal cells may be important in inducing SRA via the activation of vertical cortical columns.
The ERh and PRh cortices are connected with reciprocal connections, which may allow SRA to propagate between the two regions (Swanson and Kohler, 1986). Afferents from deep layers of the ERh innervate cells in layers 1 and 5 of the PRh, whereas the principal cells in layer 2 of the PRh send monosynaptic projections to layers 2 and 3 of the ERh (De Villers-Sidani et al., 2004). In the present experiments, in intact slices, the activity first developed in the ERh; we have not found any intact slice where the activity was initiated in the PRh. After initiation, the activity propagated horizontally from the ERh toward the PRh. Based on our results in horizontal rat brain slices, we suggest that similar to epileptic seizures, the initiation region of SRA is the ERh (D'Arcangelo et al., 2005). The frequency of the SRA was always less than 1 Hz in both areas and was always identical between the ERh and PRh cortices in each measurement. This suggests strict functional coupling between the two studied areas. The velocity of horizontal propagation of SRA was about 80 mm/s. This is higher than what was found in the visual cortex slice of ferret, where a velocity about 6 mm/s was detected (Capone et al., 2019; Sanchez-Vives and McCormick, 2000). In brain slices, the propagation velocity of the activity considerably depends on species, brain region, orientation of the slices, method of induction, and also on the type of anesthetics used during the surgery. For example, in the barrel cortex of adult rat, the mean horizontal propagation velocity proved to be 32.7 mm/s (Reyes-Puerta et al., 2016). However, in some other cortical slices, the propagation velocity of the synchronized activity may vary between 80 and 130 mm/s (Csicsvari et al., 2007; Wu et al., 2008). In young age, the propagation velocity is usually slower and becomes faster during maturation (Maeda et al., 1995; Wester and Contreras, 2012). Several imaging and immunohistochemical studies (Calamante et al., 2012; Kawaguchi, 2017) support the theory that the propagation of synchronized activity occurs both via callosal- and intracortical network pathways (Telfeian and Connors, 1998; Zingg et al., 2014). Although with anterograde and retrograde axonal tracing methods the connectivity of ERh and PRh was investigated in detail (Deacon et al., 1983; Köhler, 1986), we have not found any data specifically regarding the callosal relationship. So in the present investigations, the importance of the connections that take part in the activity propagation was studied in detail with different cortical incisions. Thus, to determine the role of callosal and intracortical connections in the horizontal propagation and synchronization of SRA, either the CC or the SG or the IG layers were transected. Neither of these incisions prevented fully the propagation of the SRA; however, the frequency of the SRAs recorded in the ERh was significantly decreased in the CC and SG slices compared with the intact and IG slices. These results suggest that both callosal and intracortical (mainly layers 2–3) connections take part in the propagation of SRA, and the existence of reciprocal connections can be presumed. Regarding the latency between the appearance of the first peaks of the SRAs recorded simultaneously in the ERh and PRh cortices, we found no significant differences between the groups; however, in 53% of the SG slices, the area of the initiation changed, namely activation in the PRh cortex preceded the activation of the ERh. The transition of initiation area and differences of the SRA repetition frequency between the incision groups suggest that dissecting the SG layers caused instability in the neural network between the two studied areas, which further supports the idea that SG layers may be fundamentally important in the propagation of SRA.
To further analyze the simultaneity of the spontaneous activity in ERh and PRh cortical networks, we cut either just all the intracortical connections (EC group) or all intracortical and callosal connections (EC+CC group) between the two investigated areas. The frequency of the SRA in ERh and PRh usually decreased significantly both in EC and in EC+CC slices compared with intact ones. Further, when incisions were made before SRA induction, at the time of putting the slice into the recording chamber, in most cases the activity of ERh and PRh was asynchronous, and the activity of the PRh completely disengaged from that of the Erh. In these asynchronous slices, the activity in the PRh had a lower frequency compared with the ERh activity in the same slice.
We can suppose that in a perfusion solution that contains elevated K+ and decreased Ca2+ and Mg2+, the excitability of spontaneously active, layer 5 pacemaker pyramidal cells is increased (Jones and Lambert, 1990). These pyramidal cells very effectively stimulate a neuronal population in layer 2/3, which are interconnected cells forming an active columnar cell assembly (Ohara et al., 2018). This underlies detectable network activity that can propagate toward the neighboring brain regions, such as the PRh. Activity propagates through synaptic activation of the local network, which contains both excitatory and inhibitory elements (Tatti et al., 2017). Propagation may be rather fast, because axons running in layer 2 also take part in forwarding information (Burgalossi et al., 2011). However, the role of some ephaptic effects cannot be excluded from these processes (Agnati et al., 2010). On the basis of the activity observed in transected slices, we can suppose that pacemaker cells of the ERh possess a slightly higher frequency of activity, so they control the PRh activity. If spontaneous rhythmicity develops in a larger neuronal network, it might become self-supporting. Eliminating the connections between the smaller network elements does not necessarily interrupt the rhythmicity that already previously developed. Otherwise, PRh is also capable of the generation of spontaneous activity, the rhythmicity of which might be independent from the ERh activity in the absence of interconnections. Results showed that intact callosal connections are essential in the aligned synchronized activity; nevertheless, the most important players in the propagation of SRA seem to be the intact SG local network connections.
Our experimental results suggest that slight mACSF sensitizes horizontally cut parahippocampal brain slices that are capable of forming SRA. The ERh cortex seems to be the most susceptible area, and spontaneous cortical activity develops reliably first in this region. The activity appears in the Erh 2/3 cortical layer; then, it quickly spreads vertically in the same area and then to the neighboring regions, that is, to the Prh. Synchronization of activity in neighboring cortical areas occurs through both callosal connections and the layer 2–3 intrinsic network, which are important in the propagation of spontaneous, inherent cortical slow wave- and seizure activity.
Footnotes
Acknowledgments
S.B. was supported by the János Bolyai Research Scholarship of the Hungarian Academy of Sciences and by the Hungarian Scientific Research Fund (NKFIH PD121307).
Ethical Approval
All applicable international, national, and/or institutional guidelines for the care and use of animals were followed. This article does not contain any studies with human participants performed by any of the authors.
Informed Consent
Informed consent was obtained from all individual participants in the study.
Author Disclosure Statement
No competing financial interests exist.