
Abstract
This study proposes an approach to understand the effect of task engagement through integrated analysis of modulations in functional networks and associated changes in their neurovascular underpinnings at every voxel. For this purpose, a novel approach that brings reorganization in acquired task-functional magnetic resonance imaging information based on hemodynamic characteristics of every task stimulus is proposed and validated. At first, modulations in functional networks of visual target detection task were estimated at every voxel through proposed methodology. It revealed task stimulus dependency in the modulation of default mode network (DMN). The DMN modulated as task negative network (TNN) during target stimulus. On the contrary, it was not entirely TNN during nontarget stimulus. The frontal-parietal and visual networks modulated as task positive network during both task stimuli. Further, modulations of neurovascular underpinnings associated with engagement of task were estimated by correlating the hemodynamically reorganized task blood oxygen level dependent information with simultaneously acquired electroencephalography frequency powers. It revealed the strong association of neurovascular underpinnings with their modulation of functional networks and the associated neuronal activity during task engagement. Finally, graph theoretical parameters such as local, global efficiency and clustering coefficient were also measured at the specific regions for validating the results of proposed method. Modulation observed in graph theory measures clearly validated the activation and deactivation of functional networks observed by the proposed method during task engagement. Thus, the voxel-wise estimation of task-related modulation of functional networks and associated neurovascular underpinnings through proposed technique provide better insights into neuronal mechanism involved during engagement in a task.
Introduction
Cognitive task and the associated neuronal activity modulate the functional connectivity of resting-state networks. Estimation of the task-induced modulations in resting-state networks and associated neurovascular underpinnings can reveal more insight into the functional dynamics of the brain.
Many researchers have studied the task-related modulations of functional networks using neuroimaging techniques. Raichle and associates (2001) have assessed the nature of intricate modulation in resting-state network caused by the task, and proposed a baseline state for understanding network dynamics. Fox and associates (2005) observed the anticorrelation between default mode network (DMN) and attention network during attention-demanding cognitive task. These anticorrelated networks such as DMN and attention networks were labeled as task negative network (TNN) and task positive network (TPN), respectively. Similarly, the anticorrelation of DMN was also observed with other TPNs such as visual and motor networks (Arbabshirani et al., 2013; Calhoun et al., 2008; Di and Biswal, 2014; Esposito et al., 2018; Gao and Lin, 2012; Manelis and Reder, 2014; Sala-Llonch et al., 2012; Tommasin et al., 2017). Subsequently, volume of research demonstrates the existence of different TPNs during various tasks (Binder et al., 1999; Raichle and Gusnard, 2005) and their modulation from resting state (Calhoun et al., 2008; Gordon et al., 2011; Newton and Morgan, 2011; Spadone et al., 2015).
On the contrary, many researchers (Andrews-Hanna et al., 2010; Buckner and Carroll, 2007; Bush and Shin, 2006; De Luca et al., 2005; Ino et al., 2011; Xu et al., 2016) observed that the tasks such as autobiographic memory retrieval, self-generated thoughts, mind wandering, and absence of the external goal-directed tasks revealed positive modulation of DMN, which thus makes the DMN as TPN.
However, Nathan Spreng (2012) has cautioned the use of terminology such as TPN and TNN. Furthermore, it is argued that both networks could be simultaneously engaged during tasks. For example, DMN may be coactive as well as functionally coupled with frontal-parietal control network during task. Many studies observed coactivation of these two networks, in particular during problem-solving task (Gerlach et al., 2011), devising the plan to achieve personal goals (Spreng et al., 2010), and working memory encoding and retrieval (Piccoli et al., 2015) tasks. Similarly, several studies have reported the coactivation of DMN with TPNs during many of the cognitive tasks (Beaty et al., 2015; Koshino et al., 2014; Newton et al., 2011; Piccoli et al., 2015; Vaina, 2014; Vatansever et al., 2017; Walz et al., 2014). Hence, the task-related engagement of DMN and its modulation is still poorly understood. These ambiguities motivated us to study the task-related modulation of functional networks.
For this purpose, this study presents the methodology that estimates the modulations of functional networks during task engagement and associated changes in neurovascular underpinnings at voxel level. The neurovascular underpinnings provide better understanding of task-related modulations. Esposito and associates (2006), Klimesch (2012), Kujala and associates (2014), and Uusberg and associates (2013) have revealed that there is a strong interplay between neurovascular underpinnings during task and the hemodynamical changes caused by neuronal activity. Hence, integrated analyses of modulation of functional networks and neurovascular underpinnings are capable of revealing more insight, which will clarify the ambiguities associated with task-related neuronal dynamics. However, the existing functional connectivity measures such as graph theory and dynamic causal model are region of interest (ROI) based techniques, and thus limit the possibility of analyzing task-evoked modulations at the voxel level. This further limits their utility in comparing these observations with neurovascular underpinning modulations at every voxel. Hence, a method that estimates modulation of functional networks during task engagement and compares them with their neurovascular underpinnings at the voxel level would be helpful in addressing the ambiguities of task-associated modulations.
Various voxel-level approaches have been used to estimate task as well as resting network. Shine and associates (2015) have implemented independent component analysis (ICA)-based method by calculating the temporal derivative of each component time course and estimated moment-to-moment functional coupling during visual hallucination tasks. Sambataro and associates (2017) estimated dynamics during rest as well as in the cognitive task by using multivariate analysis and estimated brain voxels with independent component loadings across all intrinsic networks. Arbabshirani and associates (2013) explored the use of spatial ICA in investigating functional connectivity during task to the network level. Schlösser and associates (2008) investigated the task-related effective connectivity using dynamic causal modeling (DCM) analysis, where stroop task was used as event-related paradigm. Rowe and associates (2010) have implemented DCM model and identified the changes in the effective connectivity in Parkinson's disease using finger tapping task. Although these methods reveal voxel-wise modulations of functional networks, they are not capable of facilitating the integrated voxel-wise analysis of modulations of functional networks and their associated changes in neurovascular underpinnings.
Hence, this study aims to understand task-related modulations through the integrated voxel-wise analysis of functional connectivity modulation with their associated changes in neurovascular underpinnings during visual target detection task. A novel approach of reorganizing the blood oxygen level dependent (BOLD) information has been proposed for this purpose, and results are validated through graph theoretical approach at the selected regions. The reordered BOLD information was first subjected to the estimation of voxel-wise modulation of DMN, frontal-parietal and visual networks associated with both target and nontarget task stimuli. Further, these functional network modulations were compared with modulations of neurovascular underpinnings associated with target and nontarget task engagement. The neurovascular underpinnings were estimated by correlating the proposed reorganized BOLD information with simultaneously acquired electroencephalography (EEG) frequency powers. Finally, task functional magnetic resonance imaging (fMRI) data were processed through the conventional general linear model (GLM) to identify the significant neural correlates of both target and nontarget stimuli, and the results are compared with modulations of both functional network and neurovascular underpinnings.
Materials and Methods
Participants
Twenty healthy right-handed volunteers (13 males and 7 females) aged between 20 and 32 years (mean age: 24 years) participated in this study. All participants gave informed consent after the presentation of the study. The exclusion criteria were comprised of any history of psychiatric and neurological disorder, head injury, and use of medication affecting the cognitive performance. The vision of participants was corrected using magnetic resonance (MR)-compatible lenses whenever required. The purpose of the study was explained to the participants before the experiment. The results from two of the volunteers were not considered due to extreme head motion and minimum criteria of corrected answers.
Task paradigm presentation
Participants performed the target detection task by visual search, through collections of colored geometric shapes shown in the slides. The task paradigm used during experiment is described in Figure 1. Volunteers were instructed to respond upon identification of target among the collection of objects by pressing the buttons. The collection of objects was changed every 3 sec. After each object, a slide consisting of single cross in the center was shown as a fixation block for 3 sec. Among the 94 blocks of objects shown, only 32 blocks had target objects embedded. Target and nontarget blocks were mixed in random manner to avoid prediction by volunteers. Stimuli were projected onto MR-compatible lenses fitted on the head coil inside MR.
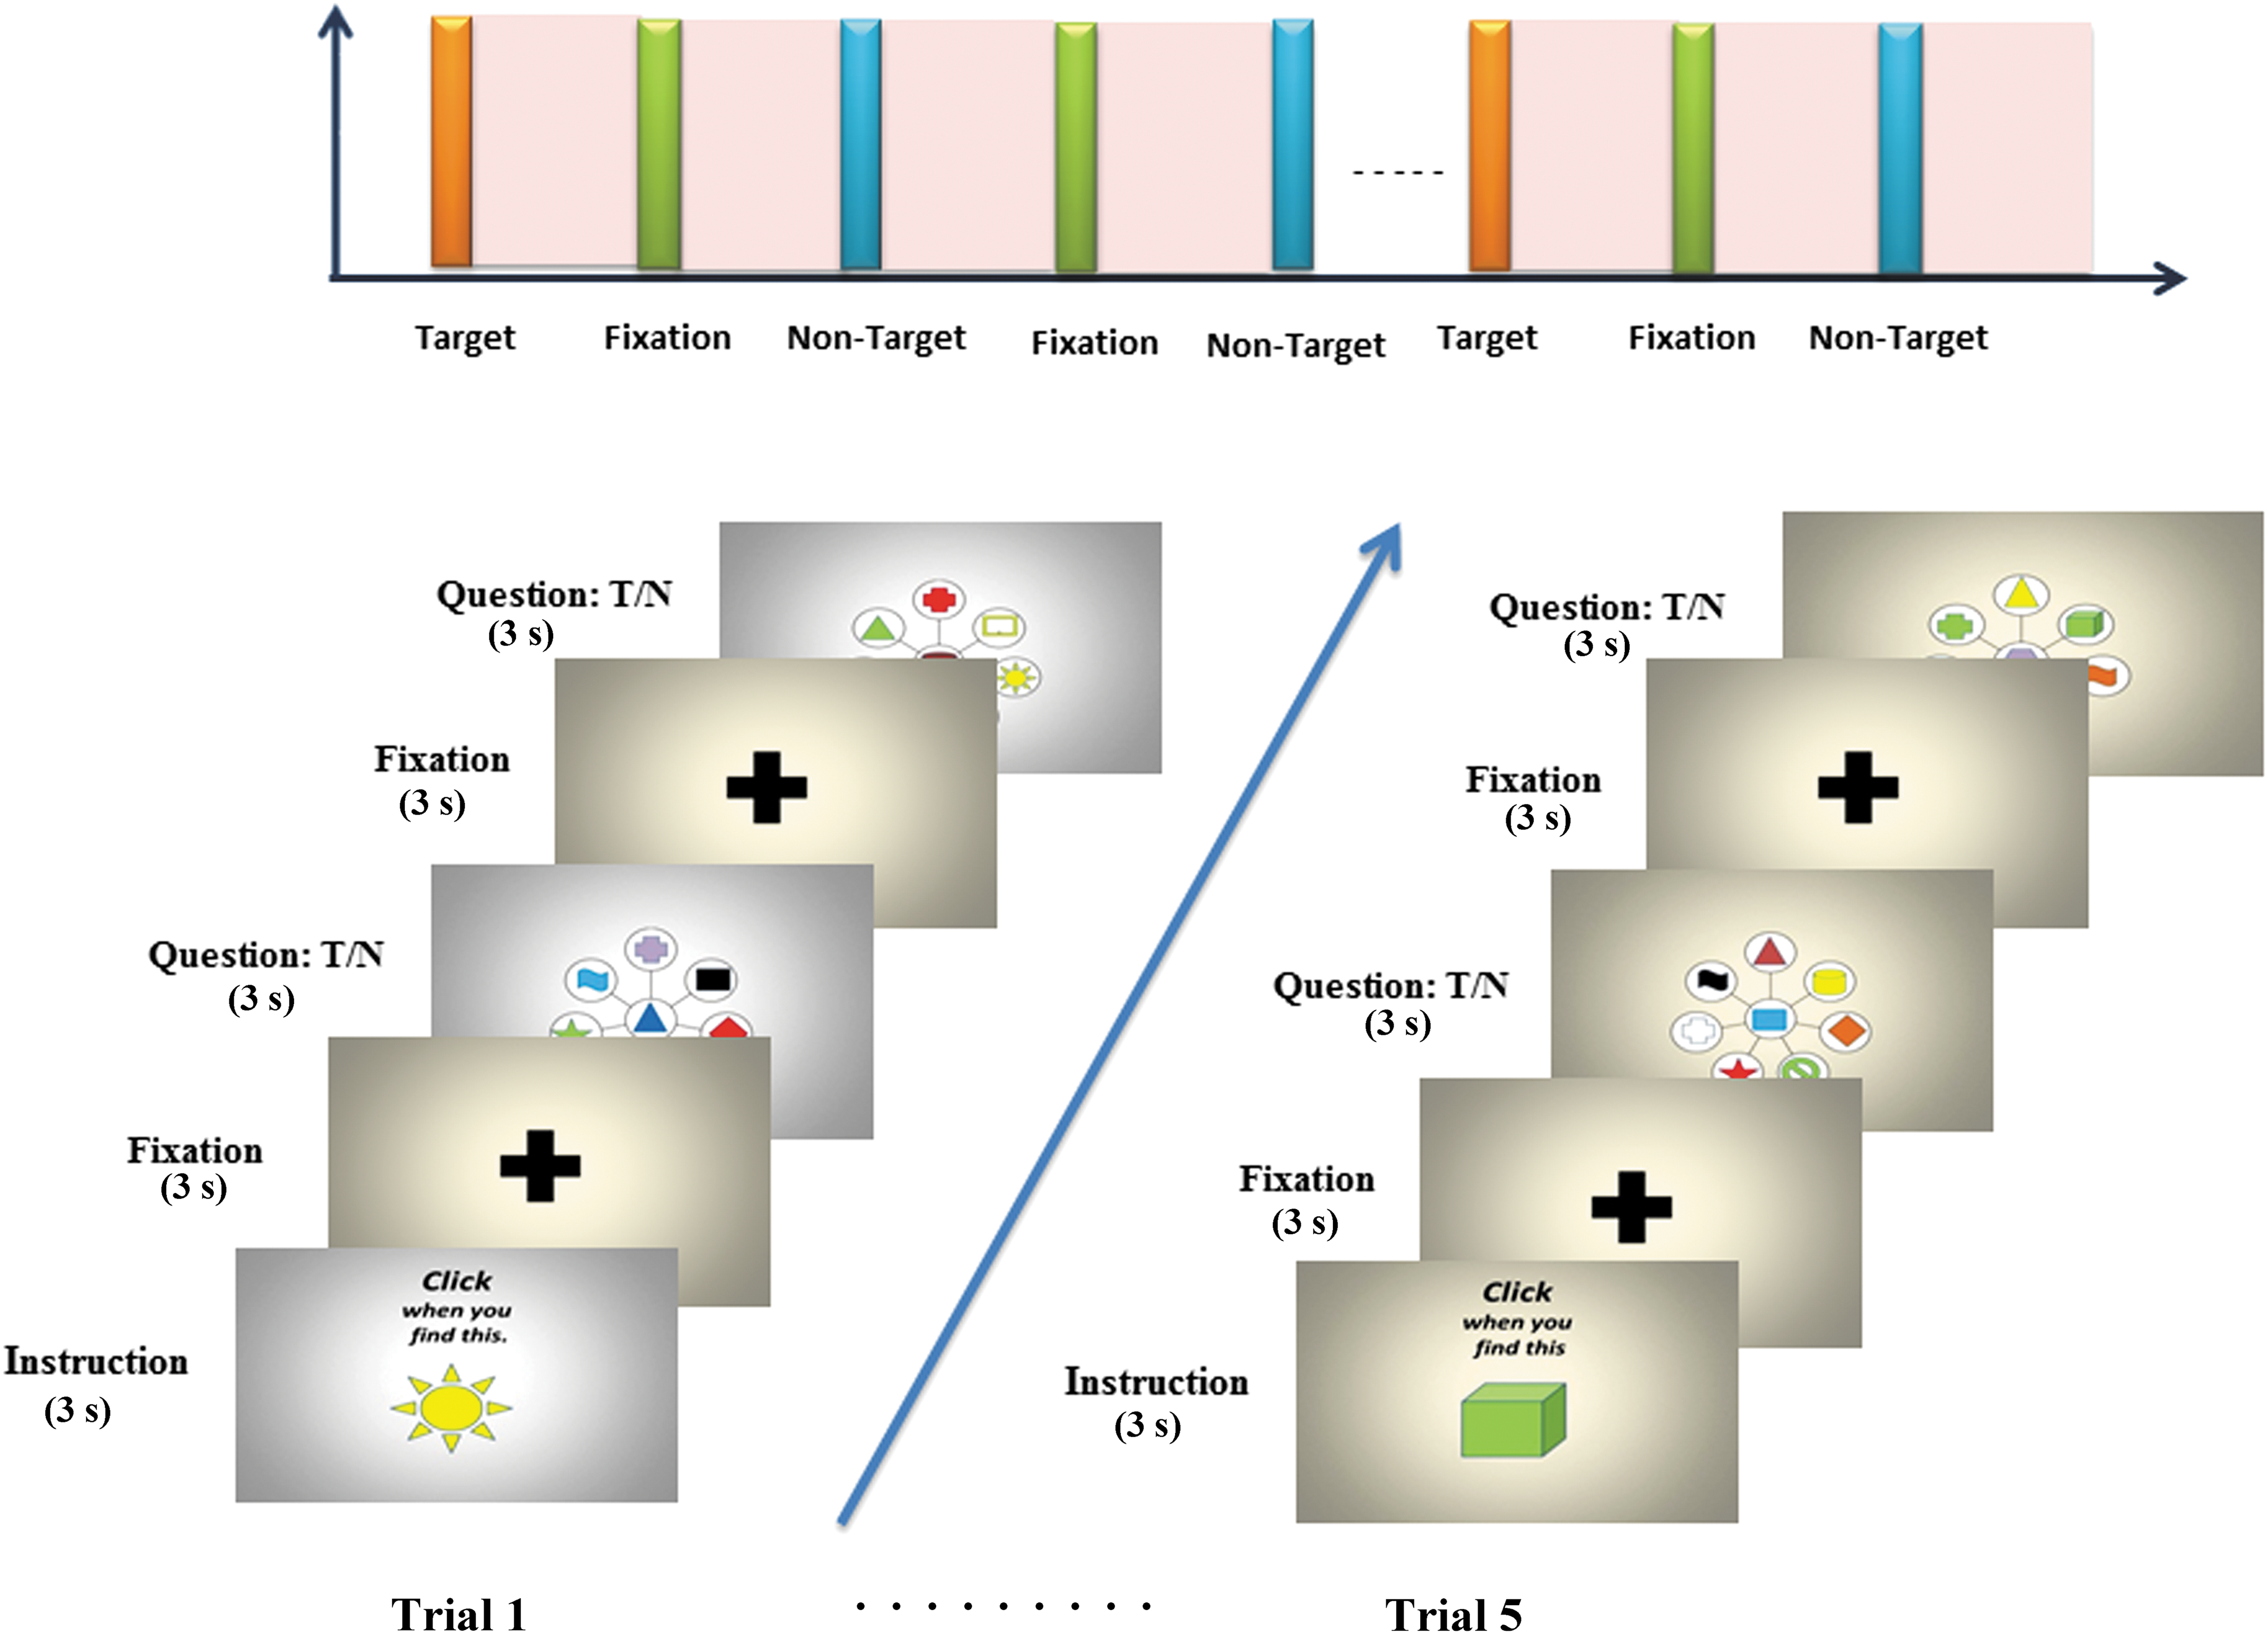
Schematic illustration of experimental task paradigm: visual target detection task. Five trials with different target objects were used. Each trial consisted of sequence of images, representing collection of objects for 3000 ms followed by subject response. Color images are available online.
Data acquisition with simultaneous EEG-fMRI
Data acquisition of both task and resting-state fMRI was performed using a simultaneous EEG-fMRI technique. The MRI acquisition was performed using 3T Siemens Magnetom Skyra scanner. The fMRI data were acquired using Eco Planer Imaging sequence with TR = 3000 ms; TE = 36 ms; voxel size = 3.6 × 3.6 × 3.0 mm; matrix = 64 × 64; FoV read = 230 mm; flip angle = 90°, 36 axial slices. The axial slices were acquired parallel to Anterior-Posterior (AC-PC) line in interleaving manner with slice thickness of 3.0 mm. The high-resolution structural images of the brain were acquired using T1 magnetization prepared rapid acquisition gradient eco sequence with parameters, voxel size = 1.0 × 1.0 × 1.0 mm; TR = 2000 ms; flip angle = 90°; FoV = 240 mm; matrix = 512 × 512; slice thickness = 1.0 mm, 160 axial slices. Before the task fMRI acquisition, resting-state fMRI acquisition was carried out keeping TR = 2000 ms, TE = 30 ms; voxel size = 3.8.0 × 3.8 × 5.0 mm; matrix = 64 × 64; FoV read = 240 mm; flip angle = 90° volumes = 205. The axial slices were acquired parallel to Anterior-Posterior (AC-PC) line in interleaving manner with slice thickness of 5.0 mm. During rest acquisition, volunteers were instructed to close their eyes, but stay awake and remain as still as possible during acquisition.
The EEG data of volunteers were acquired simultaneously during both resting and task fMRI using 32 channel MR-compatible Brain Amp differential amplifier. The Ag/Agcl electrodes integrated in cap were positioned on scalp following 10–20 system with reference electrode in between Fz and Cz. The ground electrode was placed in between Cz and Pz. The electrocardiogram electrode was placed to measure the cardiac effect for the artifact corrections. The impedance of all the scalp electrodes was maintained <5 kOhms. EEG data were acquired at 5 kHz sampling rate.
Reorganization of BOLD information in task fMRI data
In the functional MRI, the task stimulus induces changes in the neuronal activity, which results in variations in the hemodynamic response over space and time. This is observed in the changes of BOLD signals over the time. Although there is no direct relationship between neuronal activities of task stimuli and the hemodynamic response function (HRF) parameters of evoked BOLD responses, Logothetis (2003) showed that these HRF parameters correlate highly with postsynaptic activity. In addition, various researchers (Vazquez et al., 2006; Wager et al., 2005) observed that HRF response of neural activity to be sluggish and spread over the time depends upon the intensity and duration of neural activity. It typically rises after ∼2 sec from the onset of task stimulus and reaches the peak at ∼3 to 5 sec, and finally reaches the plateau after ∼6 sec (Kwong et al., 1992). However, changes in BOLD activity varies with types of task stimulus and regions of activity. In most of the fMRI connectivity models, this temporal BOLD information is directly used and convolved with standard HRF. But the standard HRF function does not precisely explain the changes caused by the different stimuli and regions where neuronal activity occurs. The time the blood takes to travel from arteries to capillaries and draining veins during neuronal activity is different in different regions. This study quantifies this differential nature of BOLD activity, and then uses it to reorganize the BOLD information (Fig. 2). At first, quantification of changes in BOLD activity at every voxel caused by task stimulus is carried out by assessing their HRF parameters such as amplitude (A), time to peak (TTP), and width (W). Then, this information is used to reorganize the BOLD temporal data. The following section explains these operations in detail for both target and nontarget stimuli at every voxel.
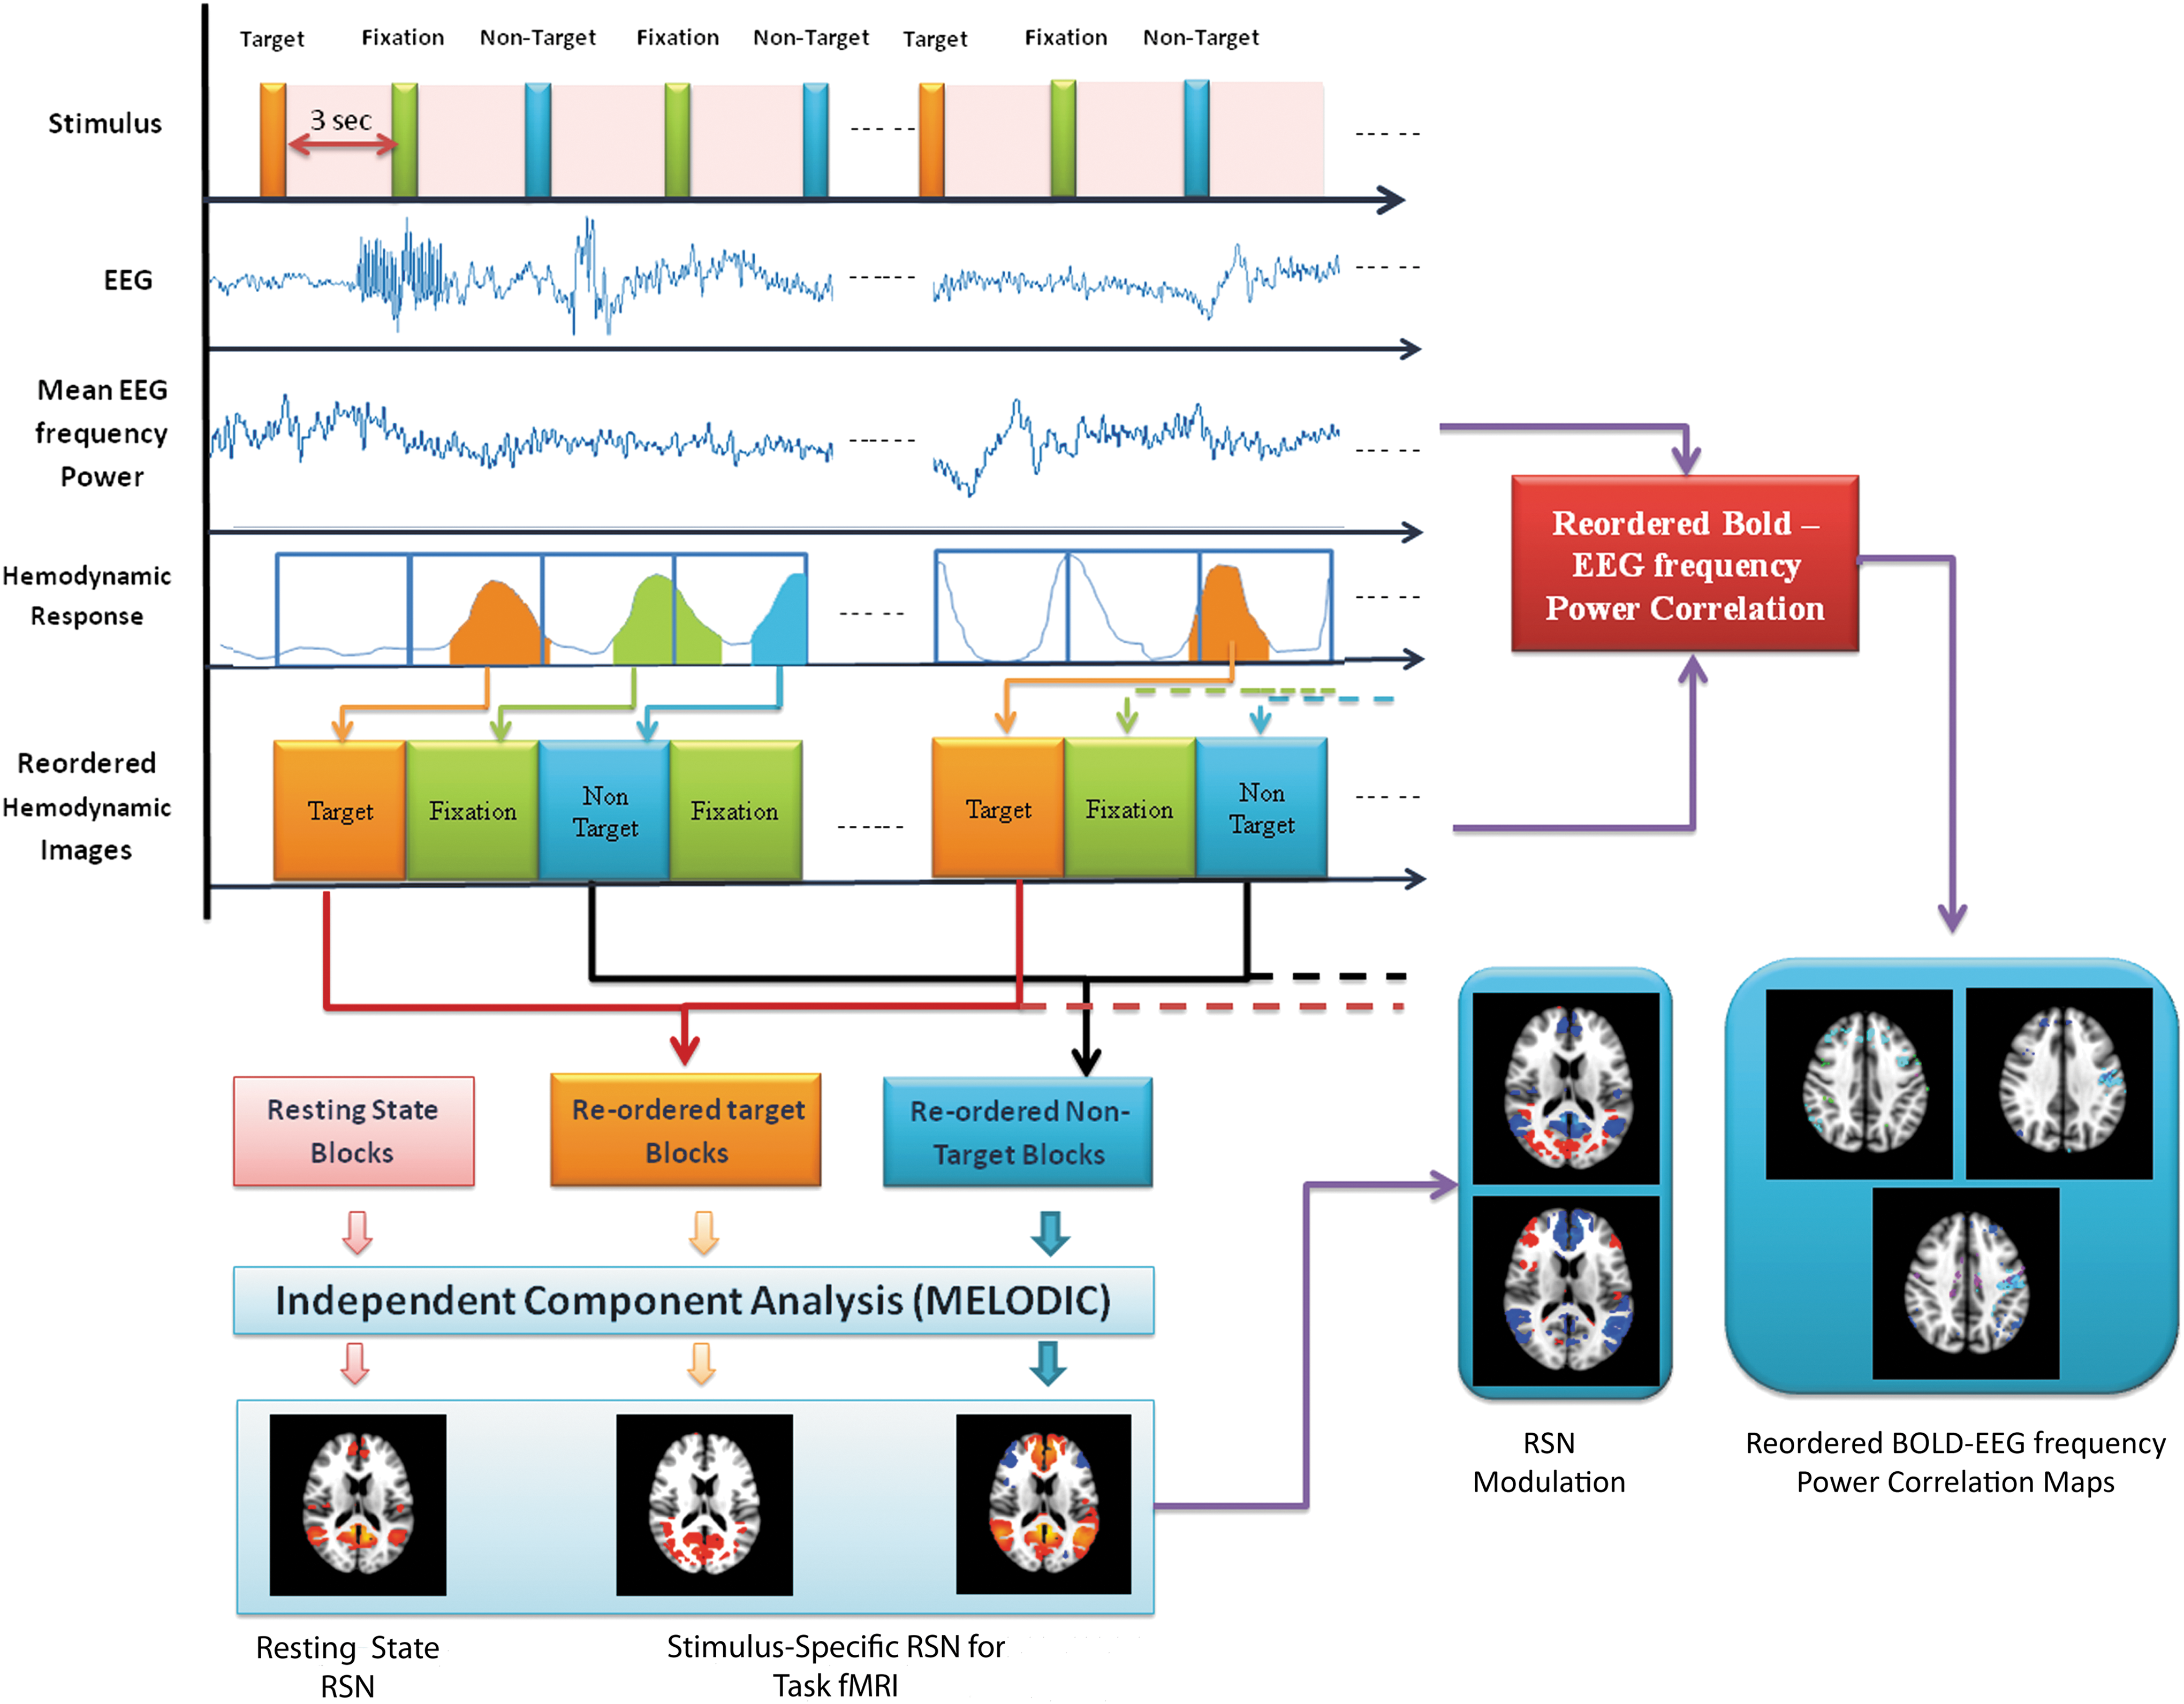
Hemodynamically reorganized BOLD approach for estimation of modulation in functional networks and their neurovascular underpinnings during task engagement. BOLD, blood oxygen level dependent. Color images are available online.
At first, task fMRI data were preprocessed using SPM 12 for artifact removal. Then, the data were corrected for slice timing, realigned, and registered to the MNI template space. The data were first motion corrected by applying rigid body transformation. All the images were then smoothed using Gaussian kernel of 5 mm. The preprocessed task fMRI dataset was subjected to the estimation of characteristics of HRF of every voxel associated with task stimulus. In this study, HRF parameters such as amplitude (A), time to peak (TTP), and width (W) have been estimated as a potential measure of response, latency, and duration of neuronal activity associated with each voxel and stimulus.
A brief methodology used for this purpose is shown in Figure 2. The reconstructed task fMRI data
where r, c, and s represent the row, column, and slice of voxel in the acquired task fMRI dataset
where
The
Assessment of functional connectivity in task fMRI data
Reconstructed task fMRI data
Besides the functional connectivity approach using ICA, task data were processed using GLM using FSL FEAT with the effect of time and dispersion derivative by considering the different stimuli as conditions with one-sample t-test using the cluster threshold of z = 2.56 (p < 0.05).
Assessment of functional connectivity in resting fMRI data
The preprocessing of resting fMRI data was performed using FSL version 5.0.9. The data were first motion corrected using MCFLIRT by applying rigid body transformation. Further, slice time-corrected images were imposed for extraction of nonbrain matter using Brain Extraction Tool. Spatial Smoothening was done to remove the noise without affecting the valid activation in data and normalized by grand mean scaling at a value of 5 mm full-width half-maximum Gaussian kernel. Temporal filtering using high pass filtering cutoff of 100s was done to remove the low-frequency artifacts from the data. The preprocessed resting-state data were then analyzed using MELODIC (FSL) for the characterization of resting-state networks by multiple concatenations across group data. Extraction of resting-state networks across noise was done by masking the resting-state networks with gray matter mask. Masked networks were then labeled and further, modulations in functional networks across DMN, FP and visual networks were carried out.
Selection of ROIs
The study primarily focuses on assessing the modulation of functional network during task engagement and the associated changes in neurovascular underpinnings. For this purpose, the method based on reorganization of hemodynamic information is proposed, and the modulations in DMN, frontal-parietal and visual networks were estimated. The DMN revealed modulation in medial prefrontal cortex (MPFC), lateral parietal (LP right and left), and posterior cingulate cortex (PCC). Visual network has revealed high modulations in medial visual cortex (MVC), primary visual cortex (PVC), and lateral visual cortex (LVC right and left). Finally, frontal-parietal network has revealed significant modulations in lateral prefrontal cortex (LPFC right and left) and posterior parietal cortex (PPC right and left). The detailed results are presented in the Results section. To validate these observations of the proposed method, the modulations observed in these regions have been cross-validated through graph theoretical approach. Hence, these regions are considered as ROIs during the analysis of graph theoretical approach.
Graph theory measures
The measures of graph theory were computed using functional connectivity (CONN) toolbox (Whitfield-gabrieli and Nieto-castanon, 2012) implemented in MATLAB. In this ROI-based analysis, temporal correlations for the resting-state and task-specific stimuli's BOLD signal time series were examined for the seed regions of DMN, frontal-parietal and visual networks for each subject. Functional connectivity maps of all the ROIs were further derived from Fisher's r-to-z transformation. For the group-level analysis, one-sample t-test was conducted to detect brain regions showing significant functional connectivity across participants. The group-level functional connectivity maps were further corrected for multiple comparisons using false discovery rate (FDR) correction with a corrected threshold of p < 0.05. The graph theory parameters such as global efficiency, local efficiency, clustering coefficient, and degree were then calculated for concerned ROIs.
Preprocessing of EEG data
The simultaneously acquired cortical EEG information of both resting and task was subjected to the following preprocessing procedures before estimations of modulations in neurovascular underpinnings during task engagement. The acquired EEG raw data were processed for MR-related artifact correction using Brain Vision Analyzer, Brain product through adaptive artifact subtraction method. The effect of pulse beats and cardioballistic is removed using CB correction by using peak detection method. Subsequently, data were down sampled to 250 Hz, and digitally filtered between 0.5 and 100 Hz. ICA was used for the attenuation of ocular and the residual imaging artifacts using the filtered EEG recordings. These preprocessed EEG data were subsequently processed through EEGLAB, Mathworks for the estimation of EEG frequency powers.
Estimation of neurovascular underpinnings
The neurovascular underpinning brings better insight into the coupling between task-induced neuronal activity and their hemodynamic information. This hemodynamic information as assessed by BOLD relies on parameters that affect neuronal activities such as cerebral blood flow, cerebral blood volume, and metabolic consumption of oxygen.
In this study, the assessment of these neurovascular underpinnings was carried out in two stages: at first, the mean EEG frequency powers pertaining to every stimulus block (both target and nontarget stimuli) were estimated. For this purpose, artifact-corrected EEG data of every stimulus block were band-pass filtered ranging from 1 to 100 Hz. Then, they were subjected to the estimation of EEG time-locked frequency matrix (Ω) for both target and nontarget stimuli as
where
Then, hemodynamic parameters associated with every stimulus were quantified and used for reorganization of BOLD information as explained in the Reorganization of BOLD Information in Task fMRI Data section. This reordered BOLD information
where
Results
This study aims to understand the modulation of functional networks during task engagement and the associated changes in neurovascular underpinnings during visual target detection task. For this purpose, the hemodynamic-based reorganization method is proposed and validated through graph theoretical approach at selected regions. The proposed method revealed task-related network modulations (Figs. 3 and 4) and the associated neurovascular underpinnings (Figs. 5 and 6) at every voxel. Table 1 summarizes the modulations in networks and the corresponding neurovascular underpinnings.
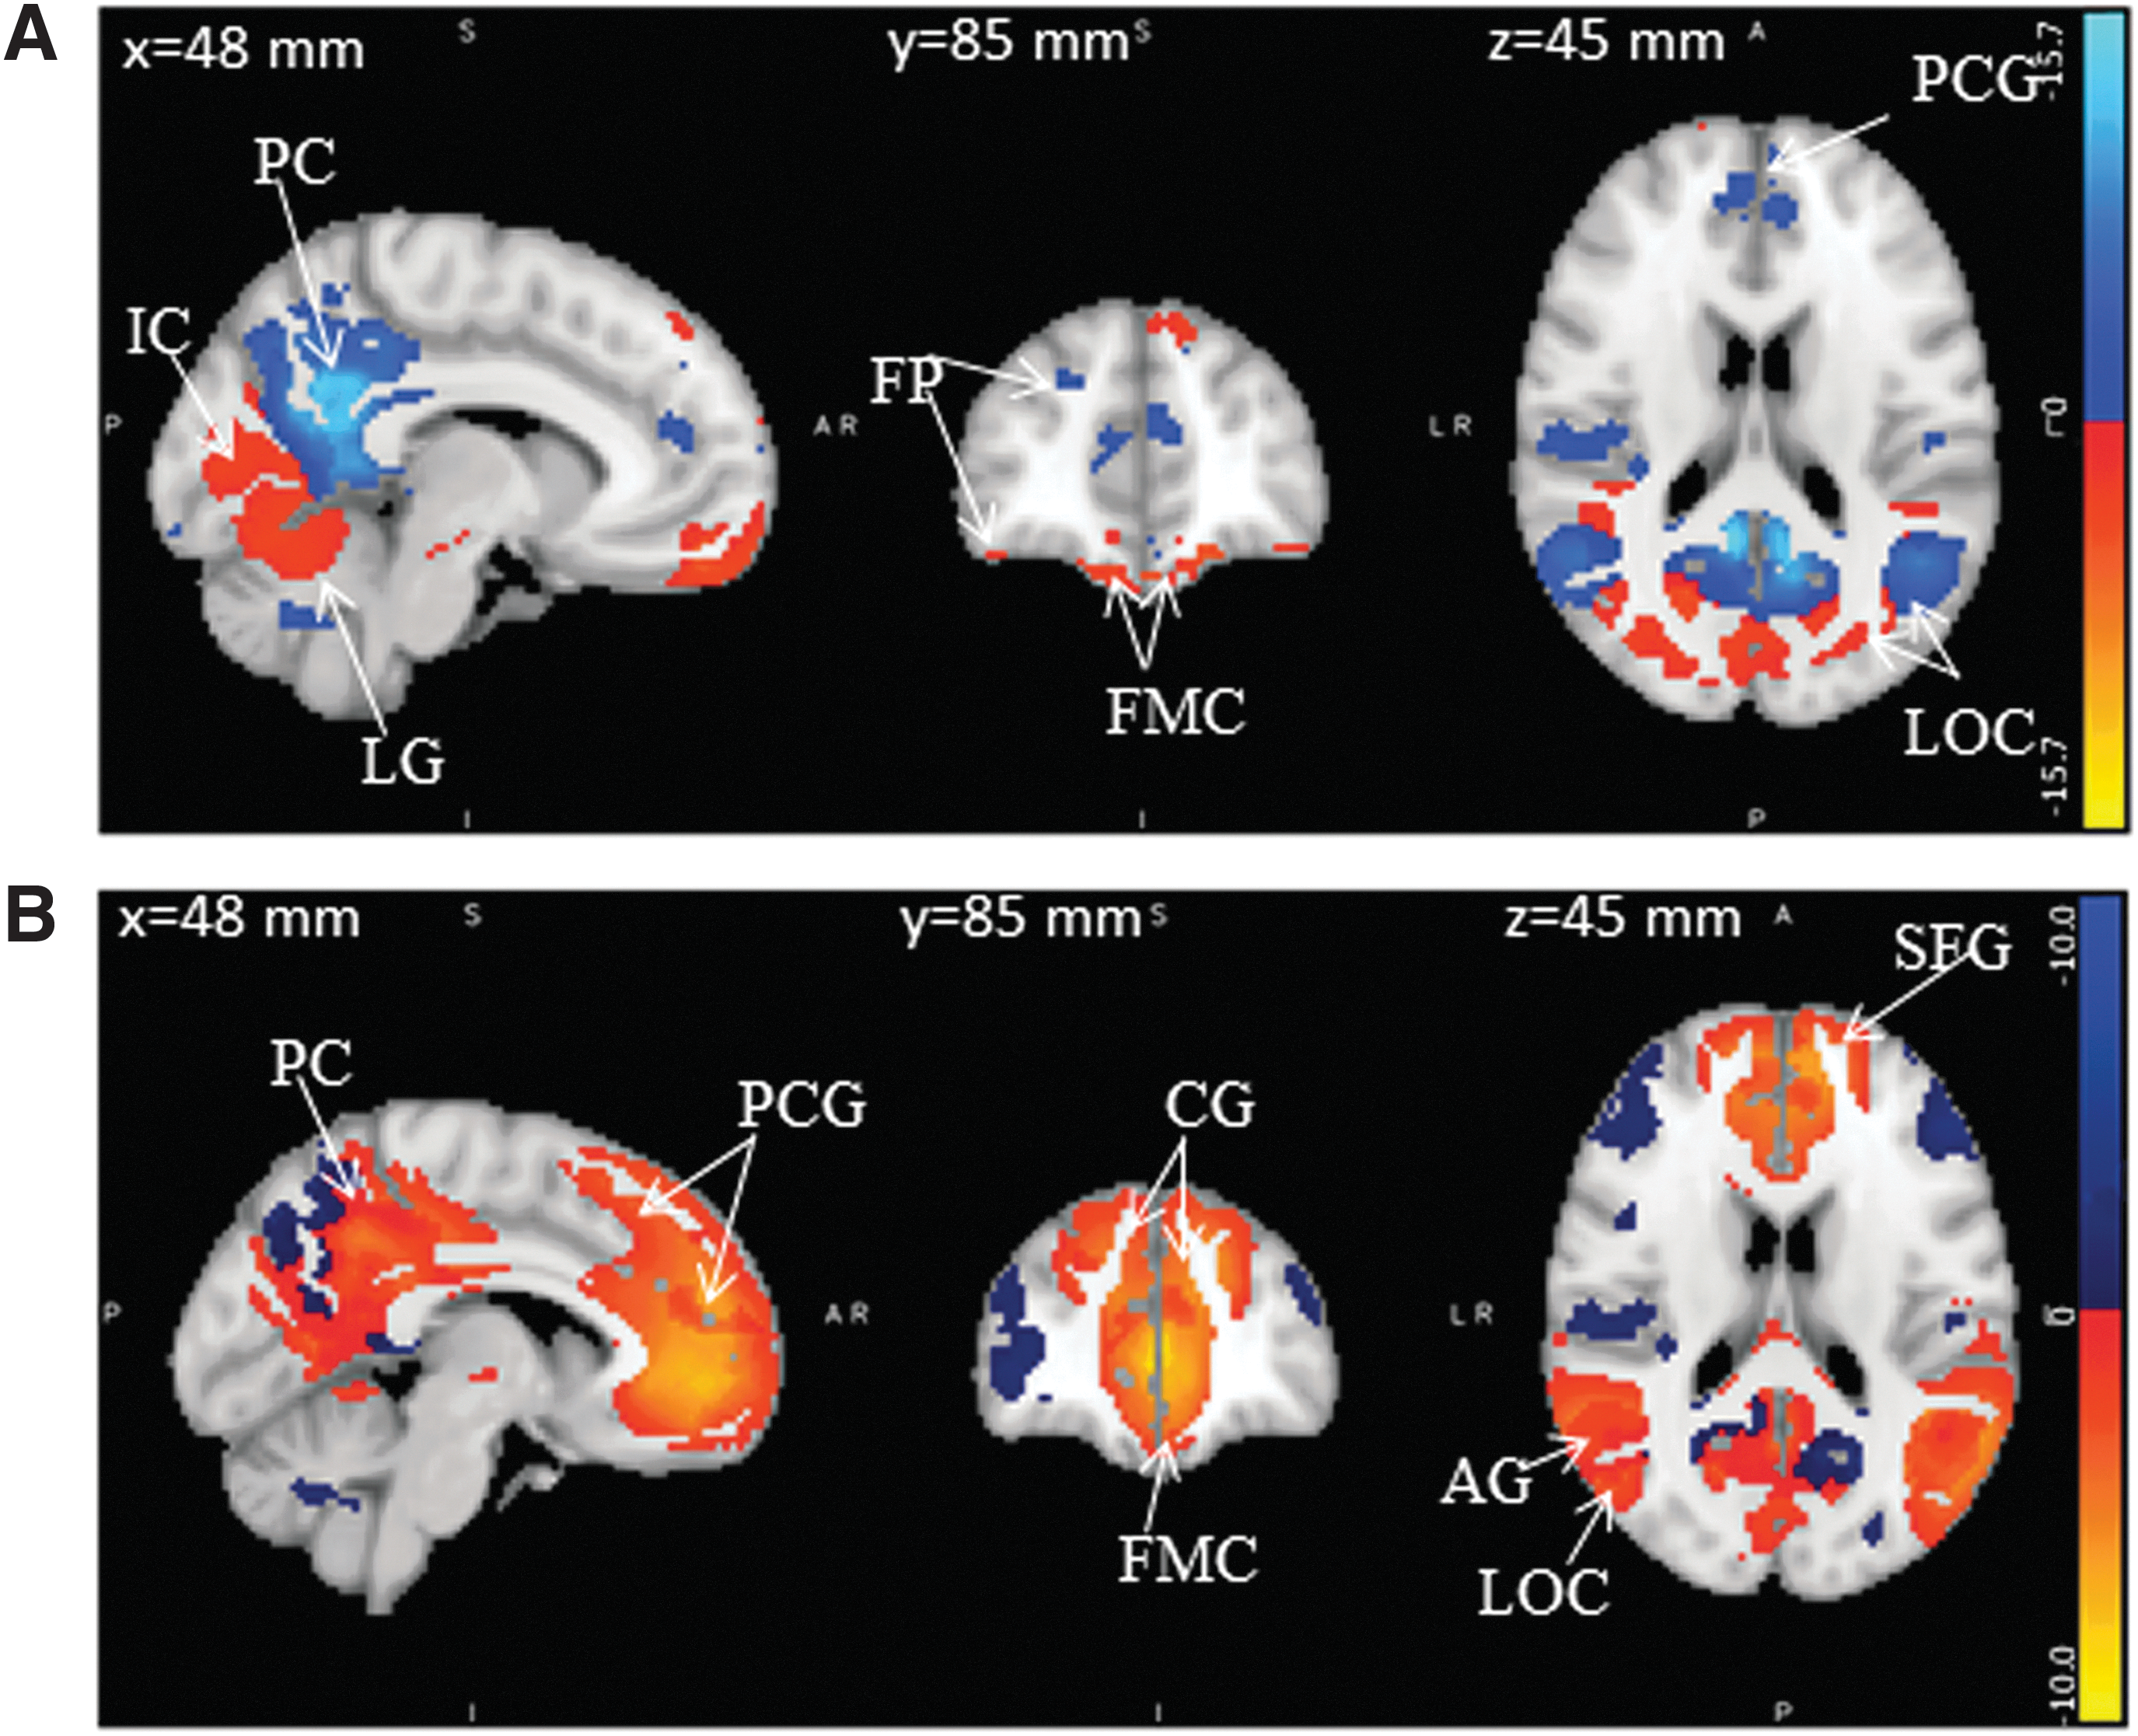
Illustrations of DMN modulation during task engagement (deactivation: blue, activation: red):
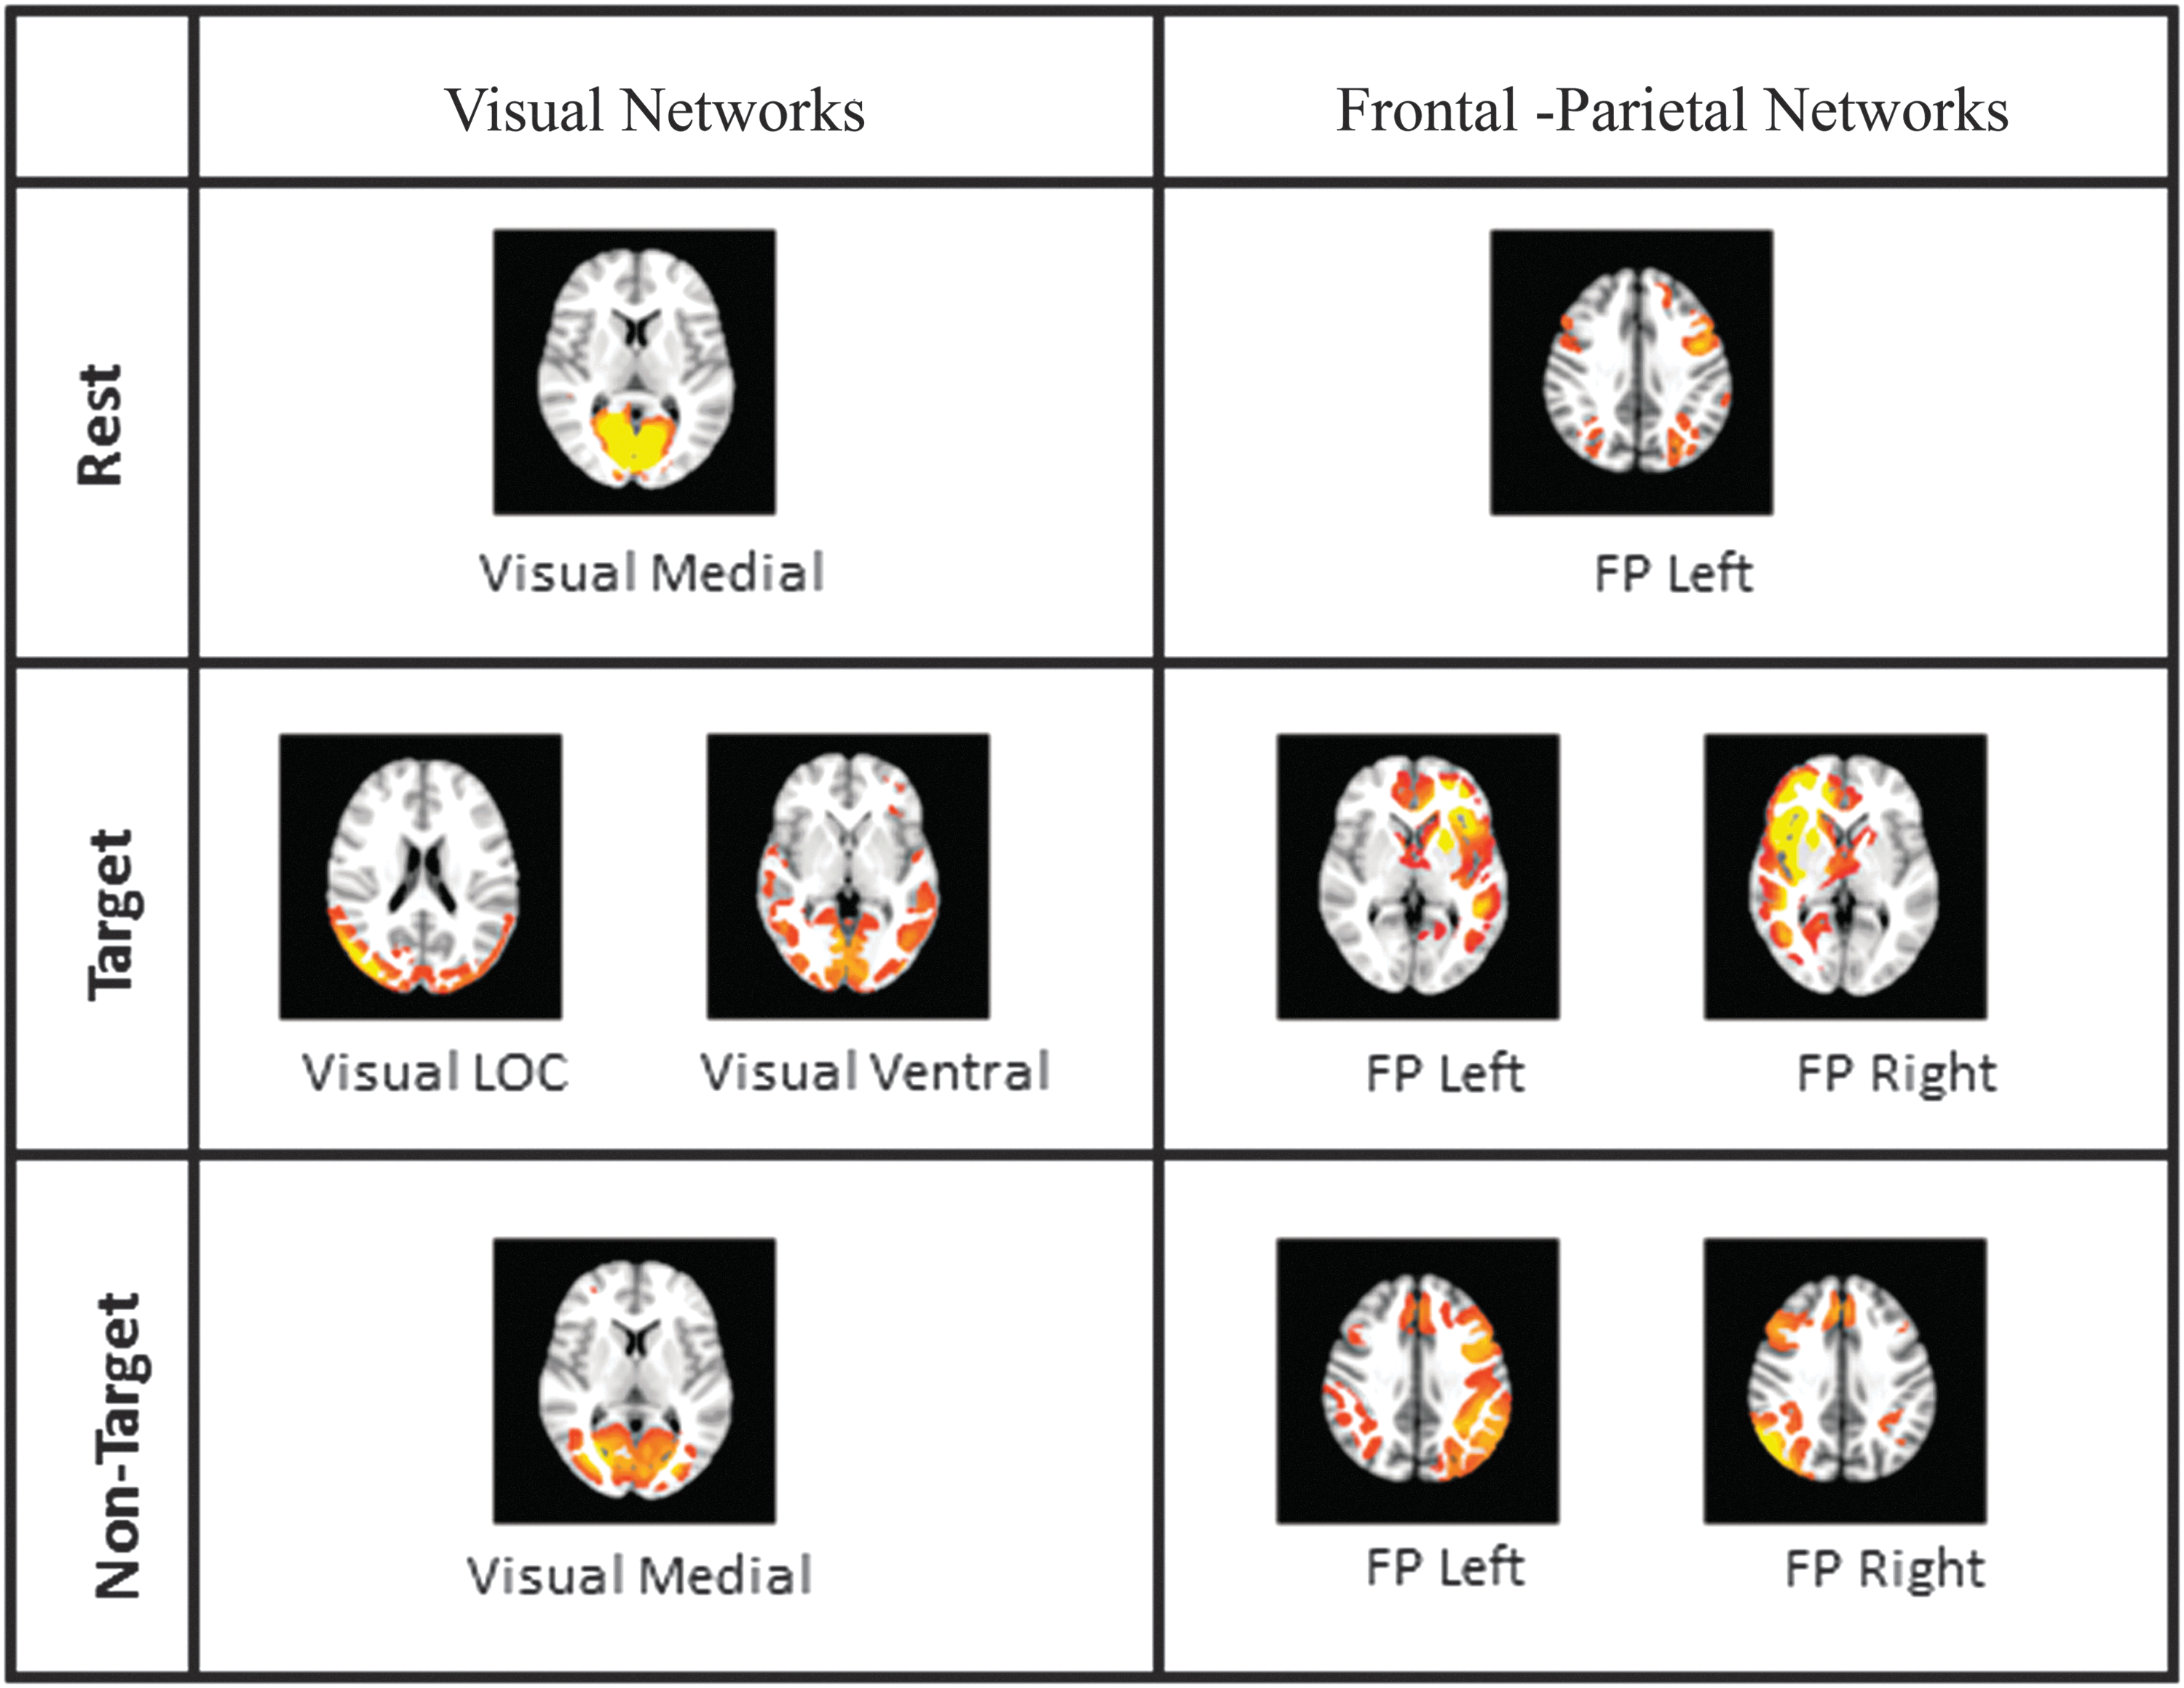
Illustrations of modulation in visual and frontal-parietal networks. Color images are available online.
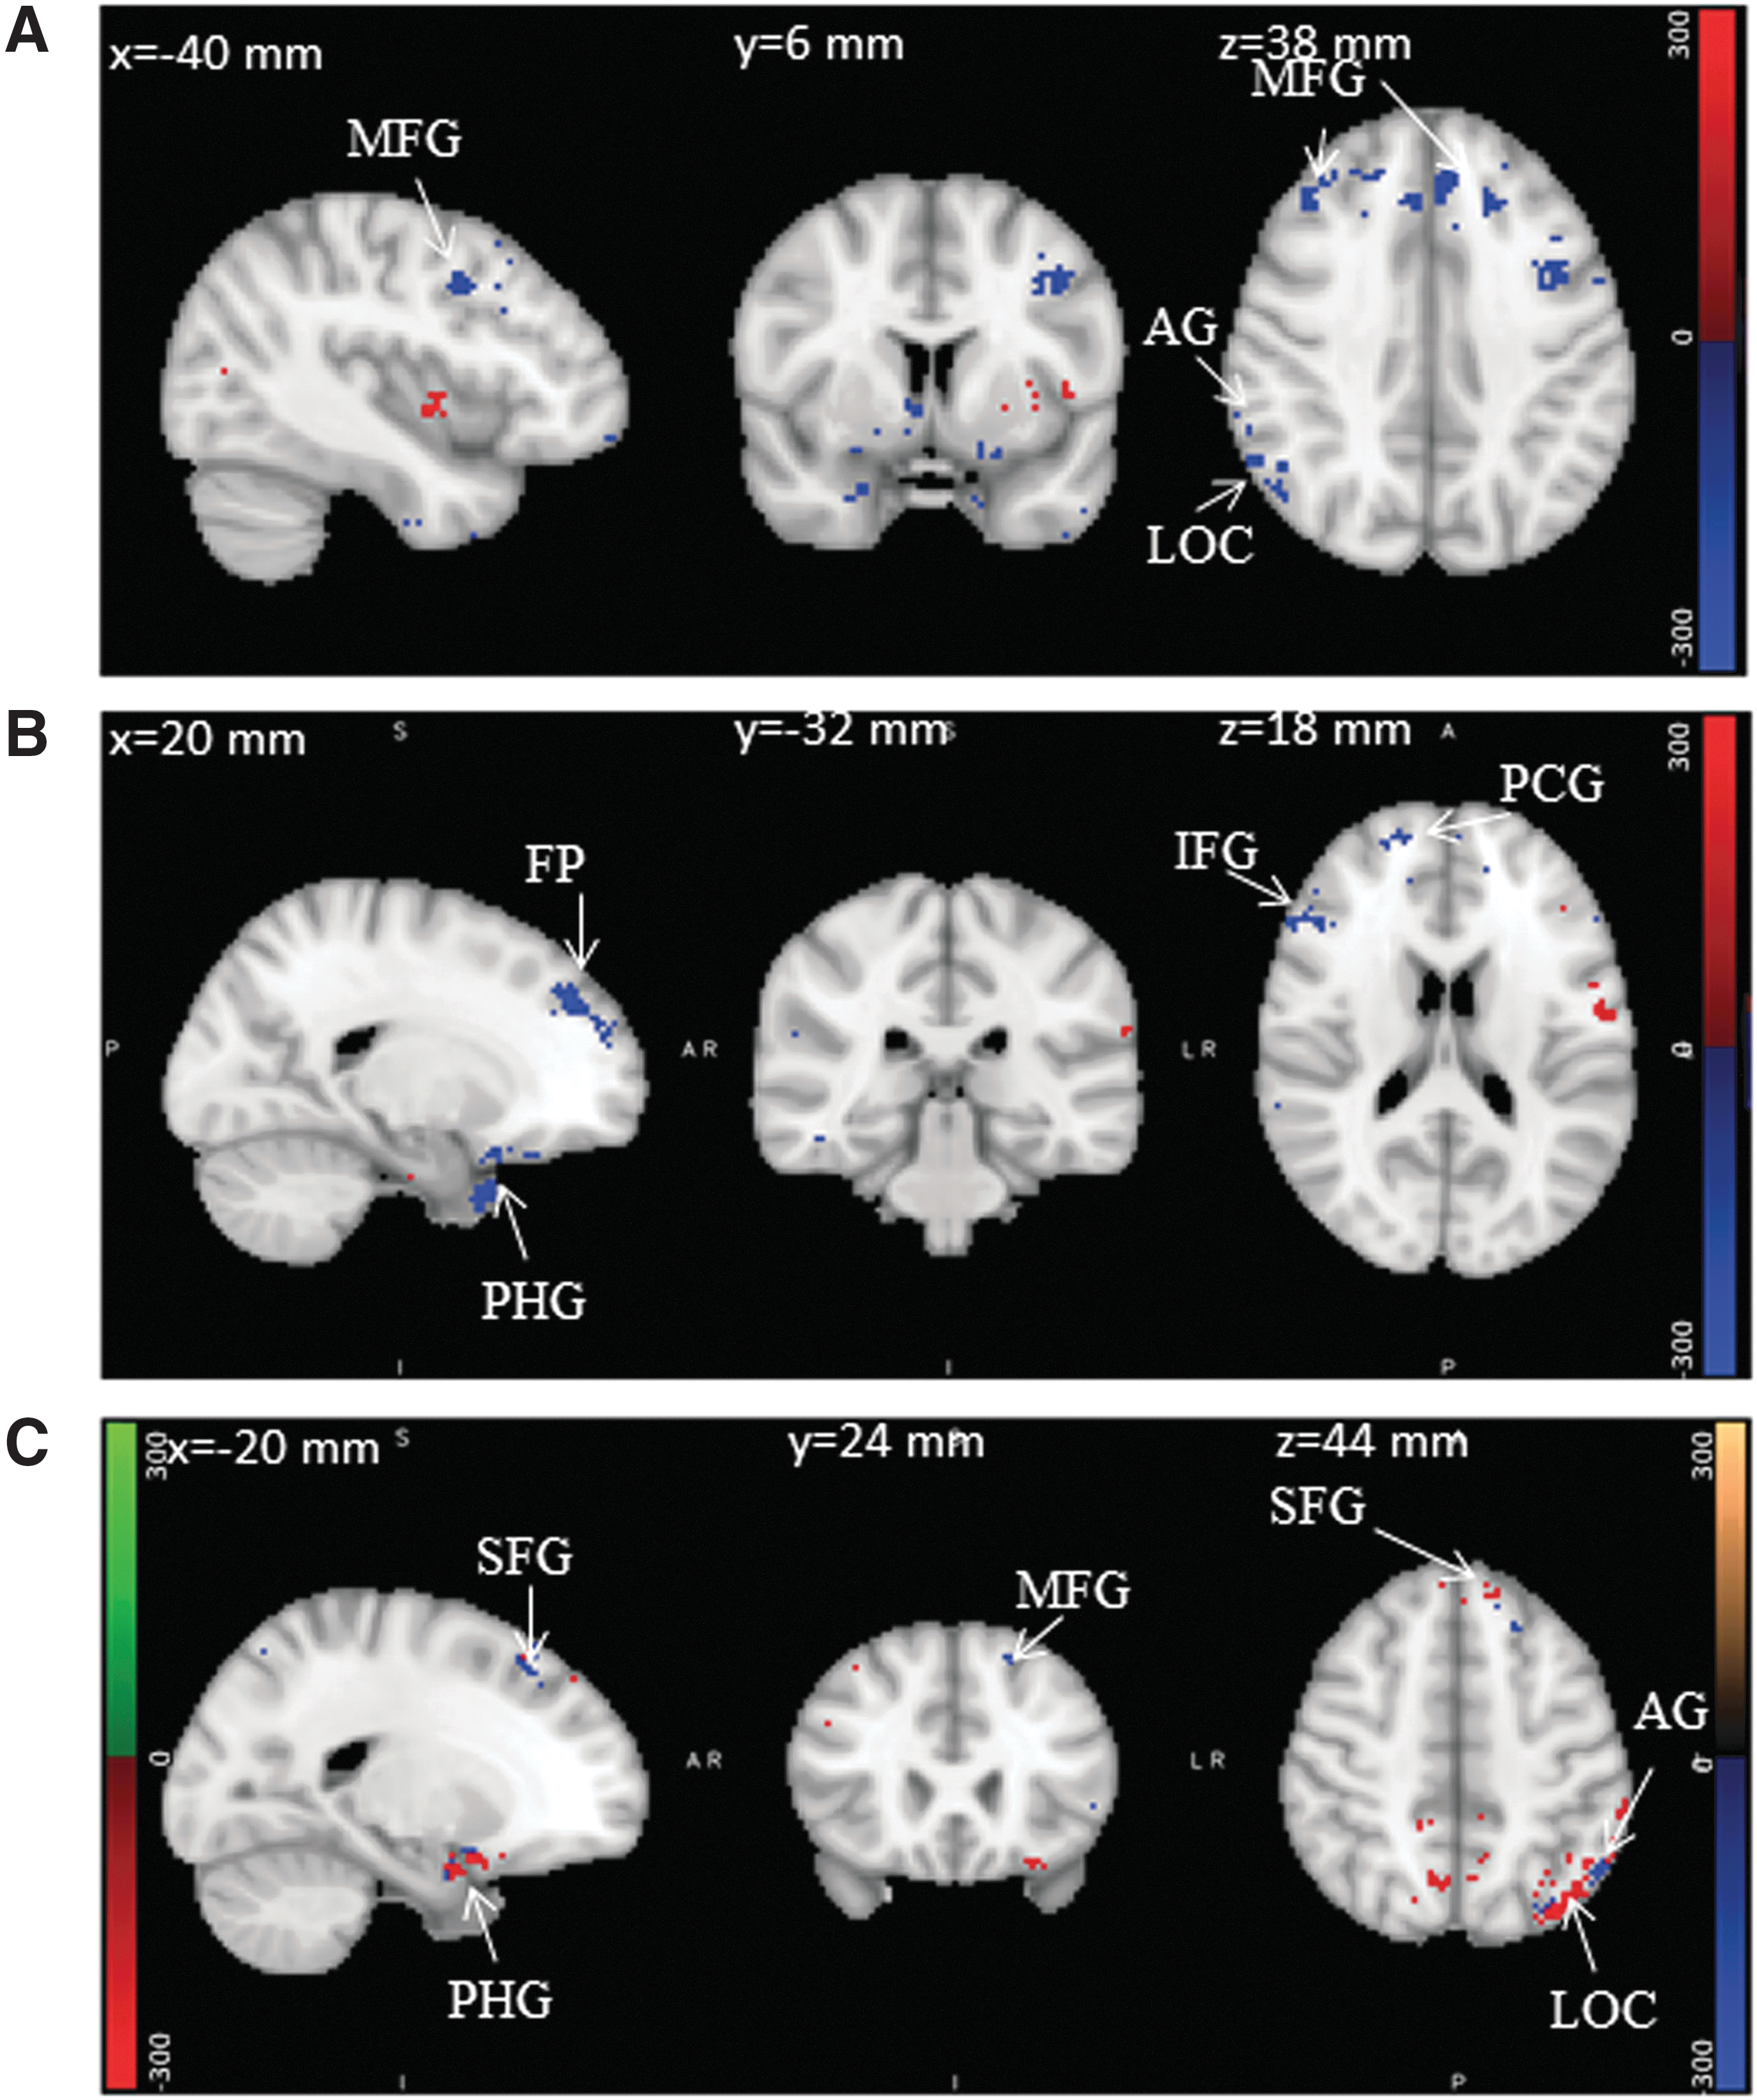
Neurovascular underpinnings of target stimuli:

Neurovascular underpinnings of nontarget stimuli:
Comparison Results Between the Proposed Approach and Graph Theory
The results are summarized as modulations in functional connectivity of brain for visual target detection task from resting state, associated GLM activity with corresponding neurovascular underpinnings, for both stimuli using proposed approach. Every cluster is represented in the following order: [Type of correlation whether Activation (A) or Deactivation (D) (Laterality whether left (L) or right (R)]. Results of graph theory analysis are summarized as variation in measures with respect to resting state, and thus positive values denoted the increment, and negative values denoted the decrement in the variation ratio.
BOLD, blood oxygen level dependent; EEG, electroencephalography; GLM, general linear model; LP, lateral parietal; LPFC, lateral prefrontal cortex; LVC, lateral visual cortex; MPFC, medial prefrontal cortex; MVC, medial visual cortex; PCC, posterior cingulate cortex; PPC, posterior parietal cortex; PVC, primary visual cortex.
Task modulations in functional networks and neurovascular underpinnings
Target stimuli
Figure 3A illustrates the modulations in DMN for the true positive target stimuli, and regions are summarized in Table 1. The regions cingulate gyrus, paracingulate gyrus, frontal medial cortex, and parahippocampal gyrus, which are part of MPFC, have revealed negative modulation in both hemispheres during target stimuli. Similarly, angular gyrus and middle temporal cortex that are part of LP cortex and PCC that belongs to precuneus cortex was also deactivated during target stimuli. However, in addition to the deactivation, some portions of frontal medial cortex and parahippocampal gyrus in the left hemisphere, part of MPFC, were seen activated. From neurovascular underpinnings analyses, alpha and beta powers correlated negatively (Fig. 5) with reordered BOLD in MPFC and LP. Similarly, gamma power was correlated negatively in LP and PCC. Hence, these negative modulations of DMN are accompanied by significant neuronal activation observed through GLM in MPFC and LP. These observations explain the established hypothesis that DMN is a TNN during target stimuli. It is also supported by the negative correlation of alpha power with BOLD during target stimuli in this study.
The visual network has also presented (Fig. 4) task-related modulation during target stimuli. The occipital pole, lingual gyrus that are part of PVC, and supracalcarine and intracalcarine cortex, the part of MVC, deactivated during target stimuli. On the contrary, inferior lateral occipital cortex, part of LVC, was modulated positively. These modulations observed in the visual network are supported by significant neuronal activity observed through GLM in visual cortex. Further, it is strengthened by the positive and negative correlations of alpha power observed in the deactivated and activated regions, respectively. This association of negative correlation of alpha power and BOLD with activation in visual network regions justifies the hypothesis that visual network is a TPN during target stimuli.
In frontal-parietal network (Fig. 4), positive modulation was observed in the middle frontal gyrus and inferior frontal gyrus that are part of LPFC. A similar trend was seen in angular gyrus and superior lateral occipital cortex, part of PPC. Both LPFC and PPC revealed significant neuronal activity as seen in GLM. They also revealed negative correlation of alpha, beta, and gamma powers with BOLD. This in turn supports the hypothesis that frontal-parietal network is a TPN during target stimuli.
Nontarget stimuli
Figure 3B illustrates the modulation observed in DMN for the true positive nontarget stimuli, and regions are tabulated in Table 1. Bilateral activation of DMN was observed in MPFC, LP, and PCC. However, some portion of PCC has revealed deactivations in the left hemisphere (Fig. 6). On the contrary, none of the DMN modulations except in MPFC found associated with any statistically significant neuronal activity through GLM. Similarly, no significant alpha correlation with BOLD was observed except in LP. The LP revealed negative correlation of alpha with BOLD. However, positive beta power correlation was seen in MPFC and LP. Gamma power correlated positively with reordered BOLD in PCC and LP and negatively in MPFC. These observations suggest that DMN is not completely manifesting as TNN during nontarget stimuli.
The visual network revealed deactivations in MVC and PVC. On the contrary, bilateral activations were observed in LVC. All these modulations of visual network were accompanied by significant neuronal activity through GLM. However, the deactivation of visual network in MVC and PVC was supported by positive correlation of beta power instead of alpha power. Negative alpha power correlation was found associated with activation observed in LVC. This clearly suggests that visual network is TPN during nontarget stimuli. However, beta power correlated with BOLD during deactivation than alpha power. Further, gamma power correlated negatively with BOLD in MVC, PVC, and LVC.
In frontal-parietal network, bilateral activation was observed in LPFC and PPC. However, left LPFC and PPC have shown significant neuronal activity. In addition, the negative alpha correlation was observed in PPC. These results suggest that frontal-parietal network behaves as TPN during nontarget stimuli. Gamma power showed negative correlation in PPC, and the beta power correlated positively in LPFC.
Graph theory analysis for the validation of modulation in functional networks
As explained in the Graph Theory Measures section, the graph theory was performed on the selected ROIs for resting-state, target, and nontarget stimuli independently, and results are shown in Figure 7. The modulations of graph theory measures during task engagement are tabulated in Table 1. The global efficiency, local efficiency, clustering coefficient, and degree were estimated as graph theory measures in this study.

Graph theory analysis:
The local efficiency and clustering coefficient revealed significant increase in all those regions where deactivation of DMN was observed. Similarly, global efficiency and degree have shown significant increase in MPFC and left LP. However, this trend was not seen in PCC. Graph theory measures of nontarget stimuli revealed increase in all DMN regions. In particular, the global efficiency observed in DMN during nontarget stimuli is much higher than target stimuli. This justifies the absence of TNN trend in DMN modulation in nontarget stimuli. Activation of TPN is associated with increase in global efficiency (Hwang et al., 2018; Ma et al., 2018; Voss et al., 2013).
The TPN such as visual and frontal-parietal networks for both task stimuli revealed increase in graph theory measures. Local efficiency and clustering coefficient have shown more sensitivity toward the activation of network. Similarly, the deactivation observed in TPN has revealed decrease in graph theory measures, in particular local efficiency and clustering coefficient.
Discussion
In this study, modulation of functional connectivity during the visual target detection task and their neurovascular underpinnings was estimated through hemodynamically reorganized BOLD method. Further, the results of the proposed method have been validated at specific regions through graph theory.
To date, several studies investigated the functional connectivity to explore the dynamic interaction of brain regions in resting state. Arbabshirani and associates (2013), Desalvo and associates (2014), and Rosazza and associates (2012) have reported the modulation in functional connectivity and reorganization caused by tasks. However, our study presents a simple approach that enables us to visualize task-related modulations of functional connectivity and associated changes in neurovascular underpinnings at the voxel level. The following sections present the observations concluded from this study.
Association of functional network modulation with neural correlates of the task
Task induces the significant activation in engaged brain regions, which causes deactivations in DMN. Hence, DMN has always been referred to as a TNN. However, in this study, DMN revealed dual nature of task-related modulation. During target stimuli, DMN modulated as TNN. On the contrary, it was not entirely TNN during nontarget stimuli. This is possibly due to desynchronization of the task neuronal correlates with the DMN modulation during nontarget stimuli. Specifically, deactivation of DMN was associated with significant neural activity estimated through GLM in most of the regions except PCC during target stimuli. But this association was not observed during nontarget stimuli. Hence, the results revealed the stimuli dependency of DMN modulation during task. Similar results were also observed by many researchers. Newton and associates (2011) and Wenderoth and associates (2005) have reported the correlation between fluctuation in modulation of DMN during distinct cognitive tasks. Simony and associates (2016) have also reported the reconfiguration of DMN during narrative comprehension task. Mayer and associates (2010) have observed DMN deactivation within parts of DMN region, and concluded that they are dependent on specific characteristics of attention and working memory components of the task stimuli. This explains the dual nature of DMN modulation during both target and nontarget stimuli.
Further, the visual and frontal-parietal networks are known as TPN as it reveals positive modulation during task engagement. Hence, TPN associates the activation of networks with significant neuronal activity caused by the task. This trend was clearly evident in modulation of visual and frontal-parietal networks during both target and nontarget stimuli. These observations of the proposed method clearly establish the fundamental interplay between neuronal activity and modulations of TPN and TNN.
Functional inhibition in alpha band reflects the task-relevant neuronal activity
Several studies reported the inhibition of alpha band activity during the task engagement (Esposito et al., 2006; Foxe and Snyder, 2011; Klimesch, 2012; Uusberg et al., 2013). In this study, negative correlation of alpha power with reordered BOLD reflects the inhibition of alpha power during task engagement.
In general, alpha inhibition is associated with significant neuronal activity at the region. Hence, deactivation in TNN as well as activation in TPN will be presenting the inhibition of alpha power at that region. In this study during target stimuli, alpha inhibition was observed in deactivated regions of DMN except in PCC. Similarly, activated regions of frontal-parietal and visual networks also revealed alpha inhibition. Further, significant neuronal activity was found in alpha-inhibited regions of DMN, frontal-parietal and visual networks. This is consistent with the observation of Klimesch and associates (2007) and Min and Park (2010), whose work suggested the active role of alpha band during cognitive task as an inhibitory control. However, during nontarget stimuli alpha inhibition was only associated with activated regions of visual network. No such relationship between alpha inhibition and modulation in DMN and frontal-parietal network was observed during nontarget stimuli.
Hence, the observed dissociation of alpha inhibition in DMN during nontarget stimuli might be connected with its absence of TNN modulation. Moreover, this study is inadequate to strongly conclude on this aspect of observed result. More focus into this dual nature of DMN modulation might bring intricate insight into the neuronal dynamics.
Cross-frequency of alpha/beta neurovascular underpinnings
The decline in alpha/beta activity was found associated with drop in the synchrony of the underlying neural populations suggesting the task-related neuronal activity. The degree of desynchronization is connected with enhanced neuronal activity quantitatively, and found reflected as augmented BOLD signal (Yuan et al., 2010).
Results of proposed method have revealed the desynchronization of alpha and beta powers with their reordered BOLD in addition to their association with significant neuronal activity. For target stimuli, alpha/beta bands correlated negatively with reordered BOLD in MPFC, LP, LVC, LPFC, and PPC. Further, these regions were associated with significant neuronal activity estimated through GLM. However, no such task-relevant desynchronization was observed in alpha/beta powers with reordered BOLD for nontarget stimuli.
Cross-frequency coupling of alpha/gamma neurovascular underpinnings
Synchronized activity is the resultant of competition (via inhibition) and cooperation (via excitation) of individual or set of neurons or large neuronal assemblies. This results in neuronal oscillations for different frequencies. This brought scientific community to observe the cross-frequency coupling of low and high frequency (Bauer et al., 2014; Bonnefond and Jensen, 2013, 2015; Buffalo et al., 2011; Fries et al., 2001; Osipova et al., 2008; Poch et al., 2014; Roux and Uhlhaas, 2014; van Kerkoerle et al., 2014; Voytek, 2010).
In this study, the proposed method reveals more insight into the synchronization of alpha/gamma bands and their correlation with reordered BOLD. Task-related desynchronization of alpha/gamma power with reordered BOLD was observed for target stimuli in LP, LVC, LPFC, and PPC, in addition to their significant neuronal activation. However, PCC exhibited desynchronization of gamma power with reordered BOLD. For nontarget stimuli, desynchronization of both alpha/gamma powers with reordered BOLD was observed merely in visual regions PVC and LVC. However, synchronization of gamma power with reordered BOLD was observed in LP, PCC, and PPC.
These observations of the proposed method are supported by the observation of Kujala and associates (2014) that BOLD signal not necessarily needs to exhibit positive correlation with high-frequency and negatively with low-frequency neuronal activity. This relationship is also observed to be varying across other cortical areas pertaining to higher cognitive functions as well as based on task stimuli. The results of this study support the same hypothesis.
Validation of proposed approach with graph theory analysis
The modulations observed in graph theory measures clearly support and validate the proposed method's observations. Engagement of task influences both local and distant functional connectivity in the regions that are involved in performing the tasks. This is seen as activation in the TPN during task engagement in the regions where significant neuronal activity is observed (Cole et al., 2016). However, the deactivation is generally associated with significant neuronal activity in the TNN (Takeuchi et al., 2011). Hence, regions that are deactivating in TNN and activating in TPN would increase both local connectivity and interaction with the distant regions (Sepulcre et al., 2010). This is observed through graph theory as positive modulation of local and global efficiency and clustering coefficients (Bolt et al., 2017; Cao et al., 2014; Moussa et al., 2011). This trend is observed in the modulation of functional network as assessed by both proposed method and graph theory measures.
Earlier studies also found that higher global efficiency of the network corresponds to fast global information communication, and local efficiency supports faster local information processing (Sporns, 2011; Wig, 2017).
In this study, increase in local efficiency observed in the regions of task engagement was in line with the present understanding of small worldness. Further, small worldness of functional networks demonstrates the task-related integration of brain regions. Dosenbach and associates (2007) revealed the small-world features of the subnetwork of the task-control system, analogous to the whole-brain network. Wang and associates (2018) highlighted the higher functional connectivity and network efficiencies due to greater cognitive demand. Similarly, the insignificant variation of global efficiency observed in this study in most of the regions is in line with the observation of earlier studies (Buckner et al., 2009). Lin and associates (2017) have observed dynamic alteration in DMN prior, during and post working memory task. In their study, the DMN has revealed high activation in the frontal regions during task, which was in turn observed as lower graph theory measure. This supports our observations of dual nature of DMN and its stimuli dependency. Thus, graph theory observations justify the modulations in functional connectivity as assessed by the proposed method.
Conclusion
In this study, the integrated analysis of modulations in functional networks and the associated changes in neurovascular underpinning were carried out through the proposed method at every voxel. The results of the proposed method were further validated with graph theoretical approach at the selected regions. The integrated analysis brought better insight into neuronal dynamics during task engagement. They are as follows: The deactivation and activation of DMN were specific to nature of task stimuli. In this study, DMN was TNN during target stimulus. However, it was not entirely TNN during nontarget stimulus. On the contrary, frontal-parietal and visual networks remained as TPN during both target and nontarget stimuli. There exists a strong association of the deactivation/activation of DMN with its significant neuronal activity during task engagement. However, this association was not strictly seen for nontarget stimulus. The task-specific alpha inhibition and its association with significant neuronal activity and synchronization of visual and frontal-parietal networks observed throughout this study. However, desynchronization of DMN was seen associated with these variations. The association of desynchronized alpha/beta activity with significant neuronal activity during task engagement is clearly observed in this study.
Thus, the proposed approach of integrated voxel-wise analysis of modulation of functional networks and the associated changes in neurovascular underpinning was found useful and helps us in bringing better understanding of neuronal mechanisms during task engagement.
Footnotes
Author Disclosure Statement
No competing financial interests exist.