
Abstract
Coherent oscillatory activity across brain regions provides a variety of individual-specific characteristics, sometimes referred to as a neural fingerprint. This information, however, may not be directly retrieved from raw functional magnetic resonance imaging (fMRI) time series. In this study, we examined the data of 205 participants who completed two resting-state fMRI scanning sessions, separated by an average of 2.63 years. In the first step, we tested the long-term reliability of functional connectomes derived from amplitude-based functional connectivity (the conventional method) and found that they remained accurate markers (>85%, p < 0.001, permutation test) for identifying individuals, even after a period longer than 800 days. Using the same data set, we further expanded our exploration of the extent to which two analytic components of oscillatory activity (amplitude envelope and instantaneous phase) may function as reliable fingerprints. Both analytic signals—in particular, the instantaneous phase—were identified as useful indices in shaping functional connectivity fingerprints (86%, p < 0.001, permutation test). Connectivity profiles derived from the ventral attention, frontoparietal, and default mode networks were the largest contributing factors to identification. The current results suggest that neural synchronization tapped by analytical signal from a low-frequency resting-state fMRI blood oxygen level-dependent oscillation could be a reliable and useful fingerprint for identifying individuals and might provide an alternative method for characterizing dynamic functional connectivity profiles.
Introduction
The connections characterizing the human brain consist of patterns that are distinct from one brain to another (Passingham et al., 2002). Due to this unique feature of neural connections, they are sometimes referred to as neural fingerprints. In a pioneering study, Miranda-Dominguez et al. (2014) demonstrated that resting-state functional connectivity can be used to identify a so-called “connectotype” in human and monkey brains. Finn et al. (2015) further demonstrated the value of functional connectivity as a “fingerprint” capable of identifying individuals out of a pool of adults, with a 92.9% rate of accuracy, and that specific connectivity profiles could predict individual differences in fluid intelligence. Waller et al. (2017) explored the sensitivity, specificity, and generalizability of connectome fingerprinting and concluded that although connectomes share a certain degree of similarity, they possess important unique variance from which the discipline of precision psychiatry may be able to draw valuable inferences. Rosenberg et al. (2016) demonstrated the viable use of whole-brain functional network connectivity as an applicable neuromarker for predicting individual differences in sustained attention. Furthermore, delayed adolescent individualization of functional connectivity patterns was shown to correlate with reduced mental health in early adulthood (Kaufmann et al., 2017).
Functional connectivity, as derived from the correlation of temporal activity patterns between brain regions, has been investigated in a wealth of neuroimaging studies within the last 15 years (Dijk et al., 2010). This amplitude-based functional connectivity holds promise for translation into the clinical setting (Fox and Greicius, 2010). However, recent studies suggest that neuron synchronization patterns observed through neuroimaging can be studied at different levels and that each level may represent a discrete behavioral trait (Glerean et al., 2012; Hellyer et al., 2014, 2015).
One approach to measuring neuronal synchronization involves the estimation of their analytical representation (Glerean et al., 2012; Pedersen et al., 2018). Analytical representation allows for the transformation of a one-time function—a magnetic or electric signal recorded over time—into two time functions with meaningful mathematical properties: the instantaneous phase and instantaneous envelope (Lachaux et al., 1999).
Investigating neuronal synchronization using analytic signals has several strengths. First, the temporal resolution of hemodynamic signals increases, taking each time-point as a unit (Glerean et al., 2012; Pedersen et al., 2018), which then becomes a powerful exploratory and data-driven mode of analysis for task-driven blood oxygen level-dependent (BOLD) activity (Bolt et al., 2018). Second, there is excellent correspondence between analytic signals derived from BOLD activity and brain structure (Ponce-Alvarez et al., 2015), which offer a new window into understanding the association between brain structure and function. Third, analytic signals offer a partial explanation of deficits in brain function that give rise to psychiatric and/or neurological disorders (Hellyer et al., 2015). Fourth, unlike a correlation-based sliding windows analysis, they avoid the mandated (semi-)arbitrary choice of window length and window overlap (Pedersen et al., 2018). Finally, analytic signals may bridge the gap between brain cognition and neuron activity communication by examining different neural populations at specific frequencies (Fries, 2005, 2015).
Despite the high stability of functional connectivity based on analytic signals from magnetoencephalography and electroencephalography having been investigated (Colclough et al., 2016; Näpflin et al., 2007), the extent of the stability of functional connectivity derived from analytical signal using functional magnetic resonance imaging (fMRI) data remains unclear. To address this question, we studied the longitudinal changes in neural fingerprints in a large sample of 226 subjects from a connectome typing perspective. All subjects underwent two sessions of fMRI scanning, separated by an average interval of 2.63 years (805–1232 days). We constructed functional connectivity profiles using two methods: (1) the conventional method, defined by amplitude-based functional connectivity, and (2) the analytical representation by means of an instantaneous phase and instantaneous envelope. After generating functional connectivity profiles, we identified individuals across different sessions through a Pearson correlation. We hypothesized that (1) patterns of functional connectivity are useful fingerprints for identification and that (2) functional connectivity within higher-order resting-state network(s) would provide the largest proportional connections with the largest differential power (DP) for identification.
Methods
Data acquisition
Data came from 226 healthy participants (age range: 18–22 years, 135 female/91 male) who completed two scanning sessions using a 3.0-T Siemens Trio MRI scanner (Siemens Medical, Erlangen, Germany) at Southwest University Center for Brain Imaging, Chongqing, China. These data were obtained from the open-access data set (Southwest University Longitudinal Imaging Multimodal, SLIM data). The average interval between scans was 960 days (range: 805–1232 days). The resting-state BOLD signals were acquired as an 8 min scan of 242 contiguous frames. Data acquisition parameters were as follows: slices = 32; repetition time/echo time = 2000/30 ms; flip angle = 90°; field of view (FOV) = 220 × 220 mm; thickness/slice gap = 3/1 mm; and voxel size = 3.4 × 3.4 × 4 mm3. T1 weighted anatomical images were collected, with a recorded repetition time of 1900 ms, an echo time of 2.52 ms, an inversion time of 900 ms, a flip angle of 90°, a FOV of 256 × 256, slices of 176 mm, a thickness of 1.0 mm, and a voxel size of 1 × 1 × 1 mm3. The data collection was approved by the Research Ethics Committee of the Southwest University. For further details of the data set, refer to Liu et al. (2017).
Data preprocessing
Spatial preprocessing of functional images included slice timing correction, realignment, and normalization using the functional connectivity toolbox CONN. Participants were excluded if the translation and rotation of head motion in any direction exceeded 2 mm or 2° This resulted in the exclusion of 21 subjects, leaving a final data set of 205 subjects (122 female/83 male; age range: 18–22 years). To address potentially spurious correlations in resting-state networks due to head motion, we applied a procedure for identifying problematic time points with Artifact Detection Tools (ART; Whitfield-Gabrieli et al., 2016). An image was defined as an outlier if the head displacement in the x, y, or z direction exceeded 0.5 mm of the value of displacement in the previous frame or if the global mean intensity of the image exceeded 5 standard deviations from the mean image intensity for the entire resting scan. The anatomical T1 weighted image was segmented into areas that represented gray matter, white matter, and cerebral spinal fluid, and the resulting masks were eroded (one voxel erosion) to minimize partial volume effects. Head motion parameters (three rotation and three translation parameters, derived from the steps of realignment, along with another six parameters representing their first-order temporal derivatives) and artifactual covariates (one covariate per artifactual time point), BOLD time series within white matter (five principal component analysis [PCA] parameters), and cerebral spinal fluid (five PCA parameters) were regressed.
Mean time series within a region were further extracted from the preprocessed data under a high-resolution atlas that included 1024 regions (AAL1024; Zalesky et al., 2010; Fig. 1b), which featured a reasonable scale for mapping the brain's functional connectivity (Wang et al., 2009). Critically, the atlas was restricted within an intersection between a study-specific echo-planar imaging mask and a gray matter mask based on the probability map in SPM8 (threshold ≥0.2). Next, extracted time series were band-pass filtered with a narrow band from 0.04 to roughly 0.07 Hz to reduce the effects of low-frequency drift and high-frequency noise (Fig. 1d). A narrow frequency band, such as 0.04–0.07, has been shown to be the most reliable frequency band with the most widespread spatial distribution of reliable voxels and is thus optimal for the estimation of functional connectome topology properties (Zuo et al., 2010). Furthermore, this narrow frequency band has been shown to be optimal for exploring the analytical signal patterns from BOLD-fMRI activity (Glerean et al., 2012; Pedersen et al., 2018).
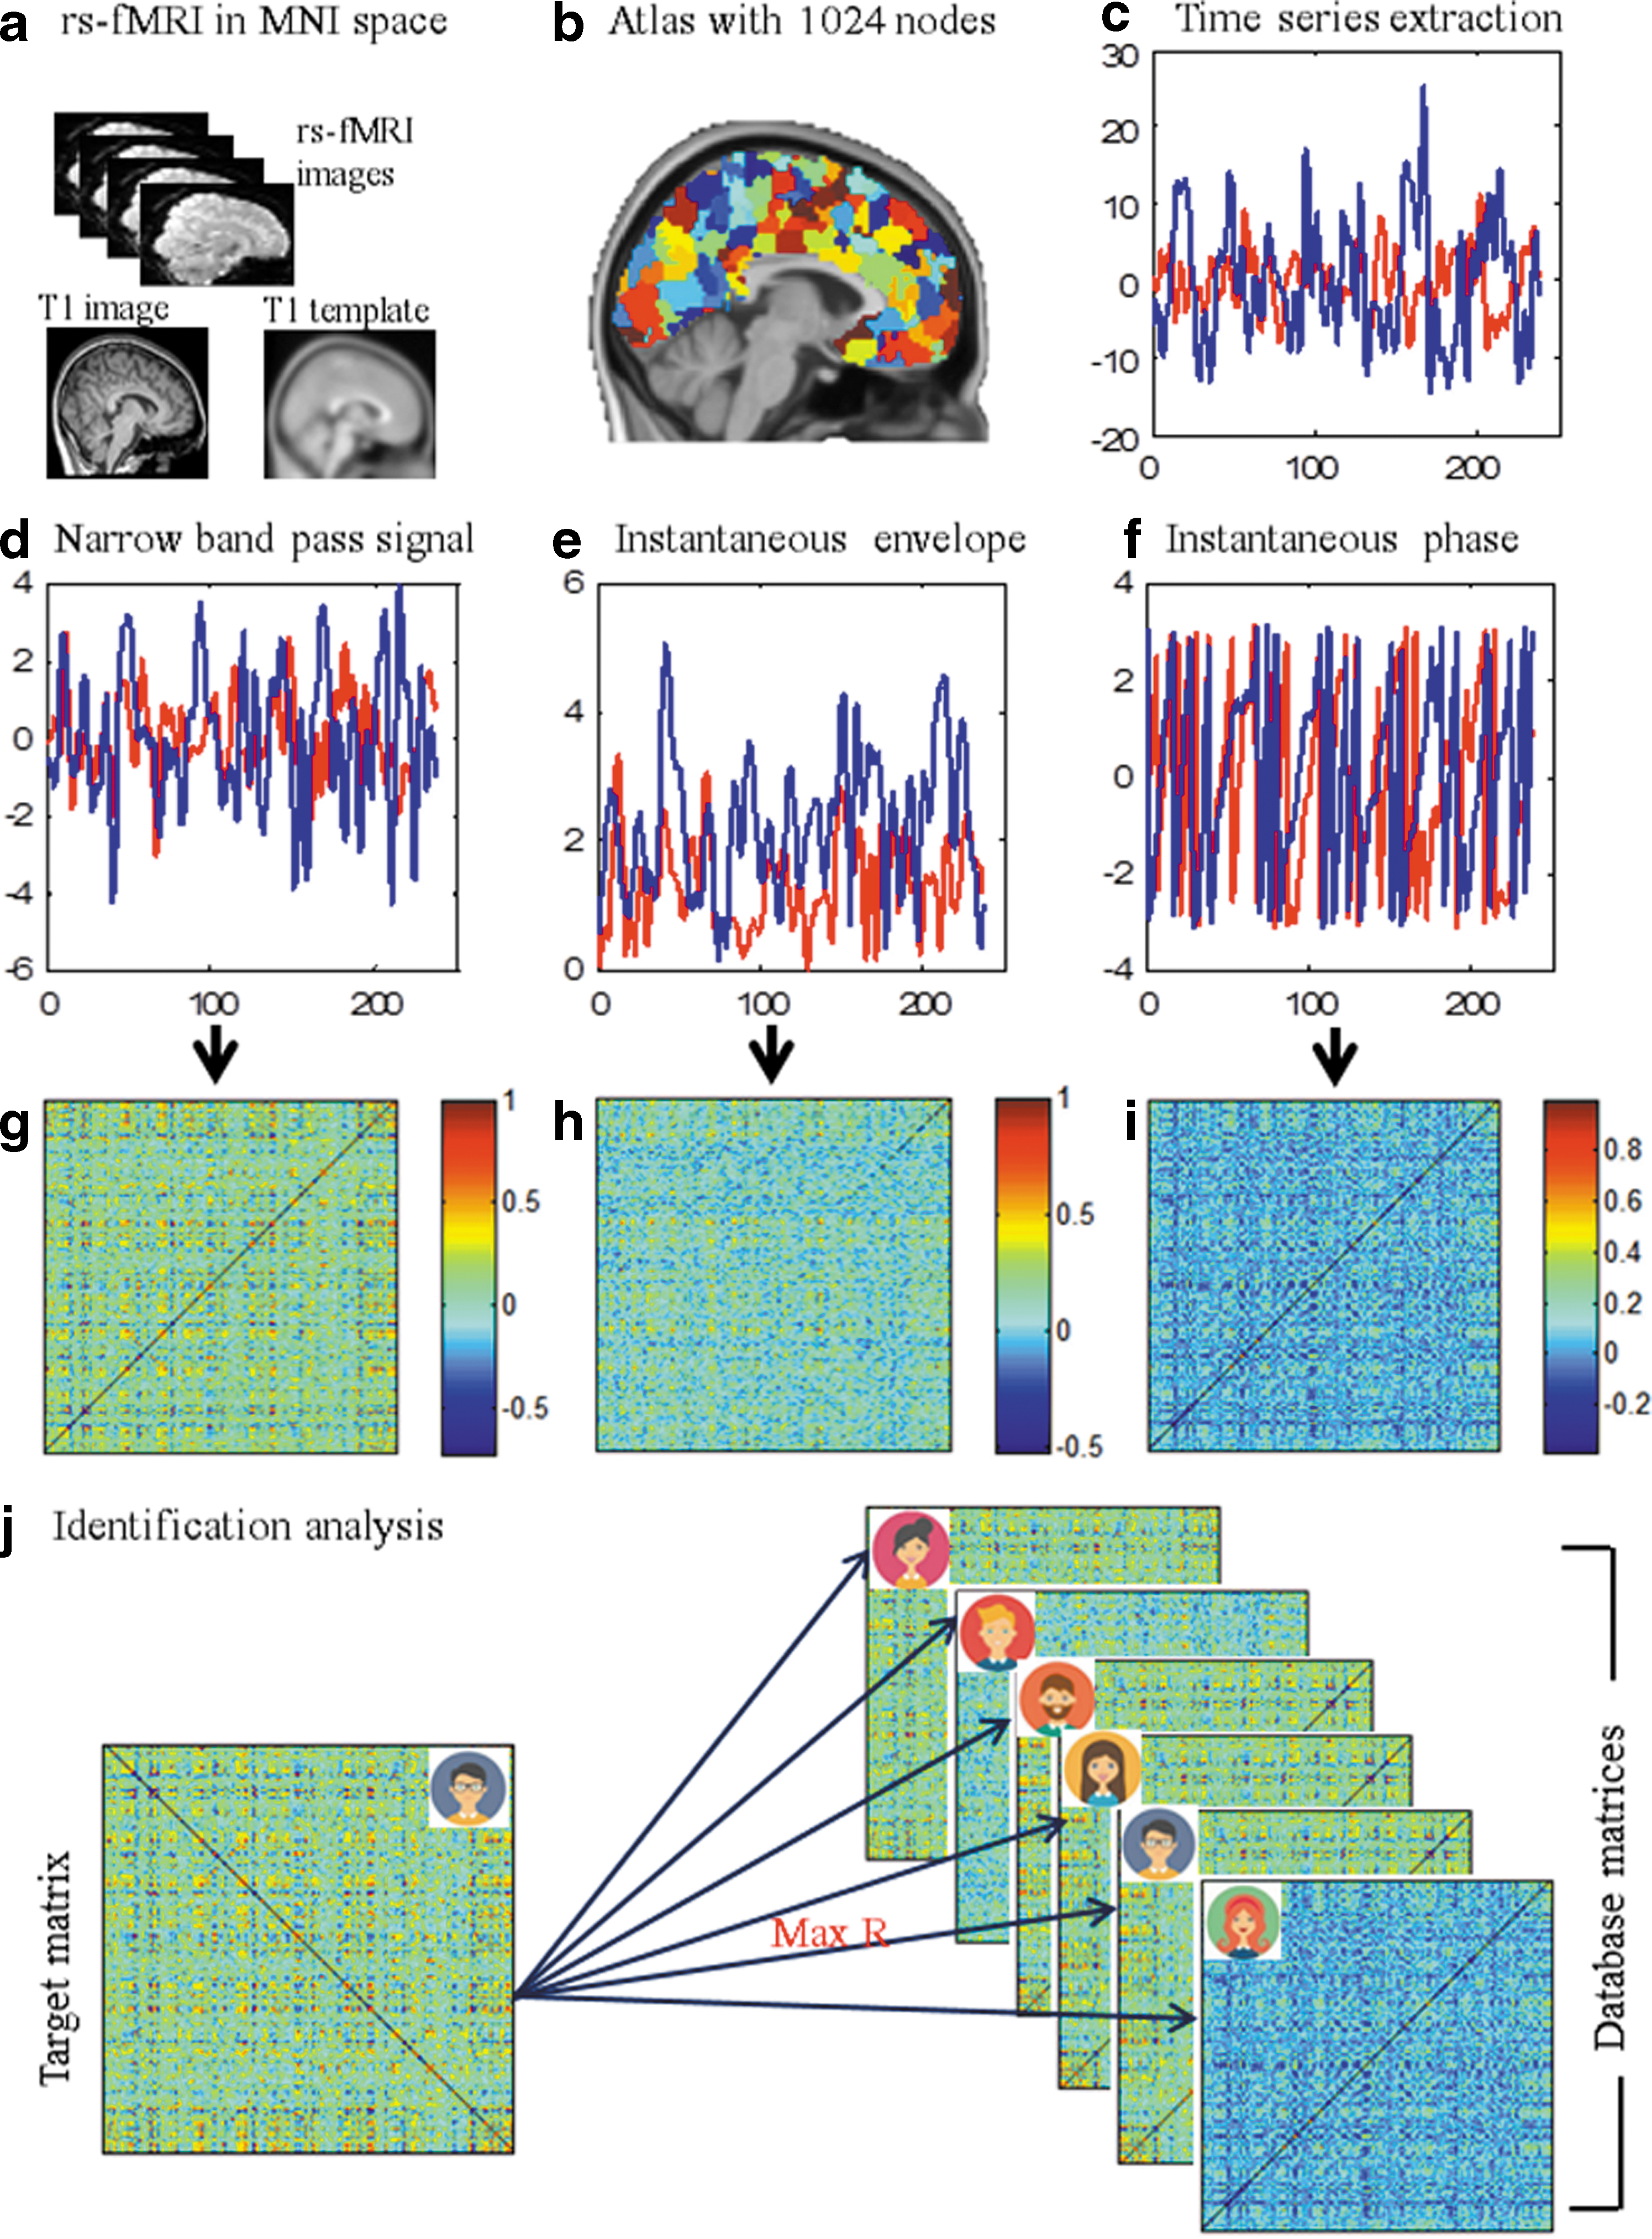
Flowchart of the construction of functional connectome and identification analysis.
Subnetwork definition
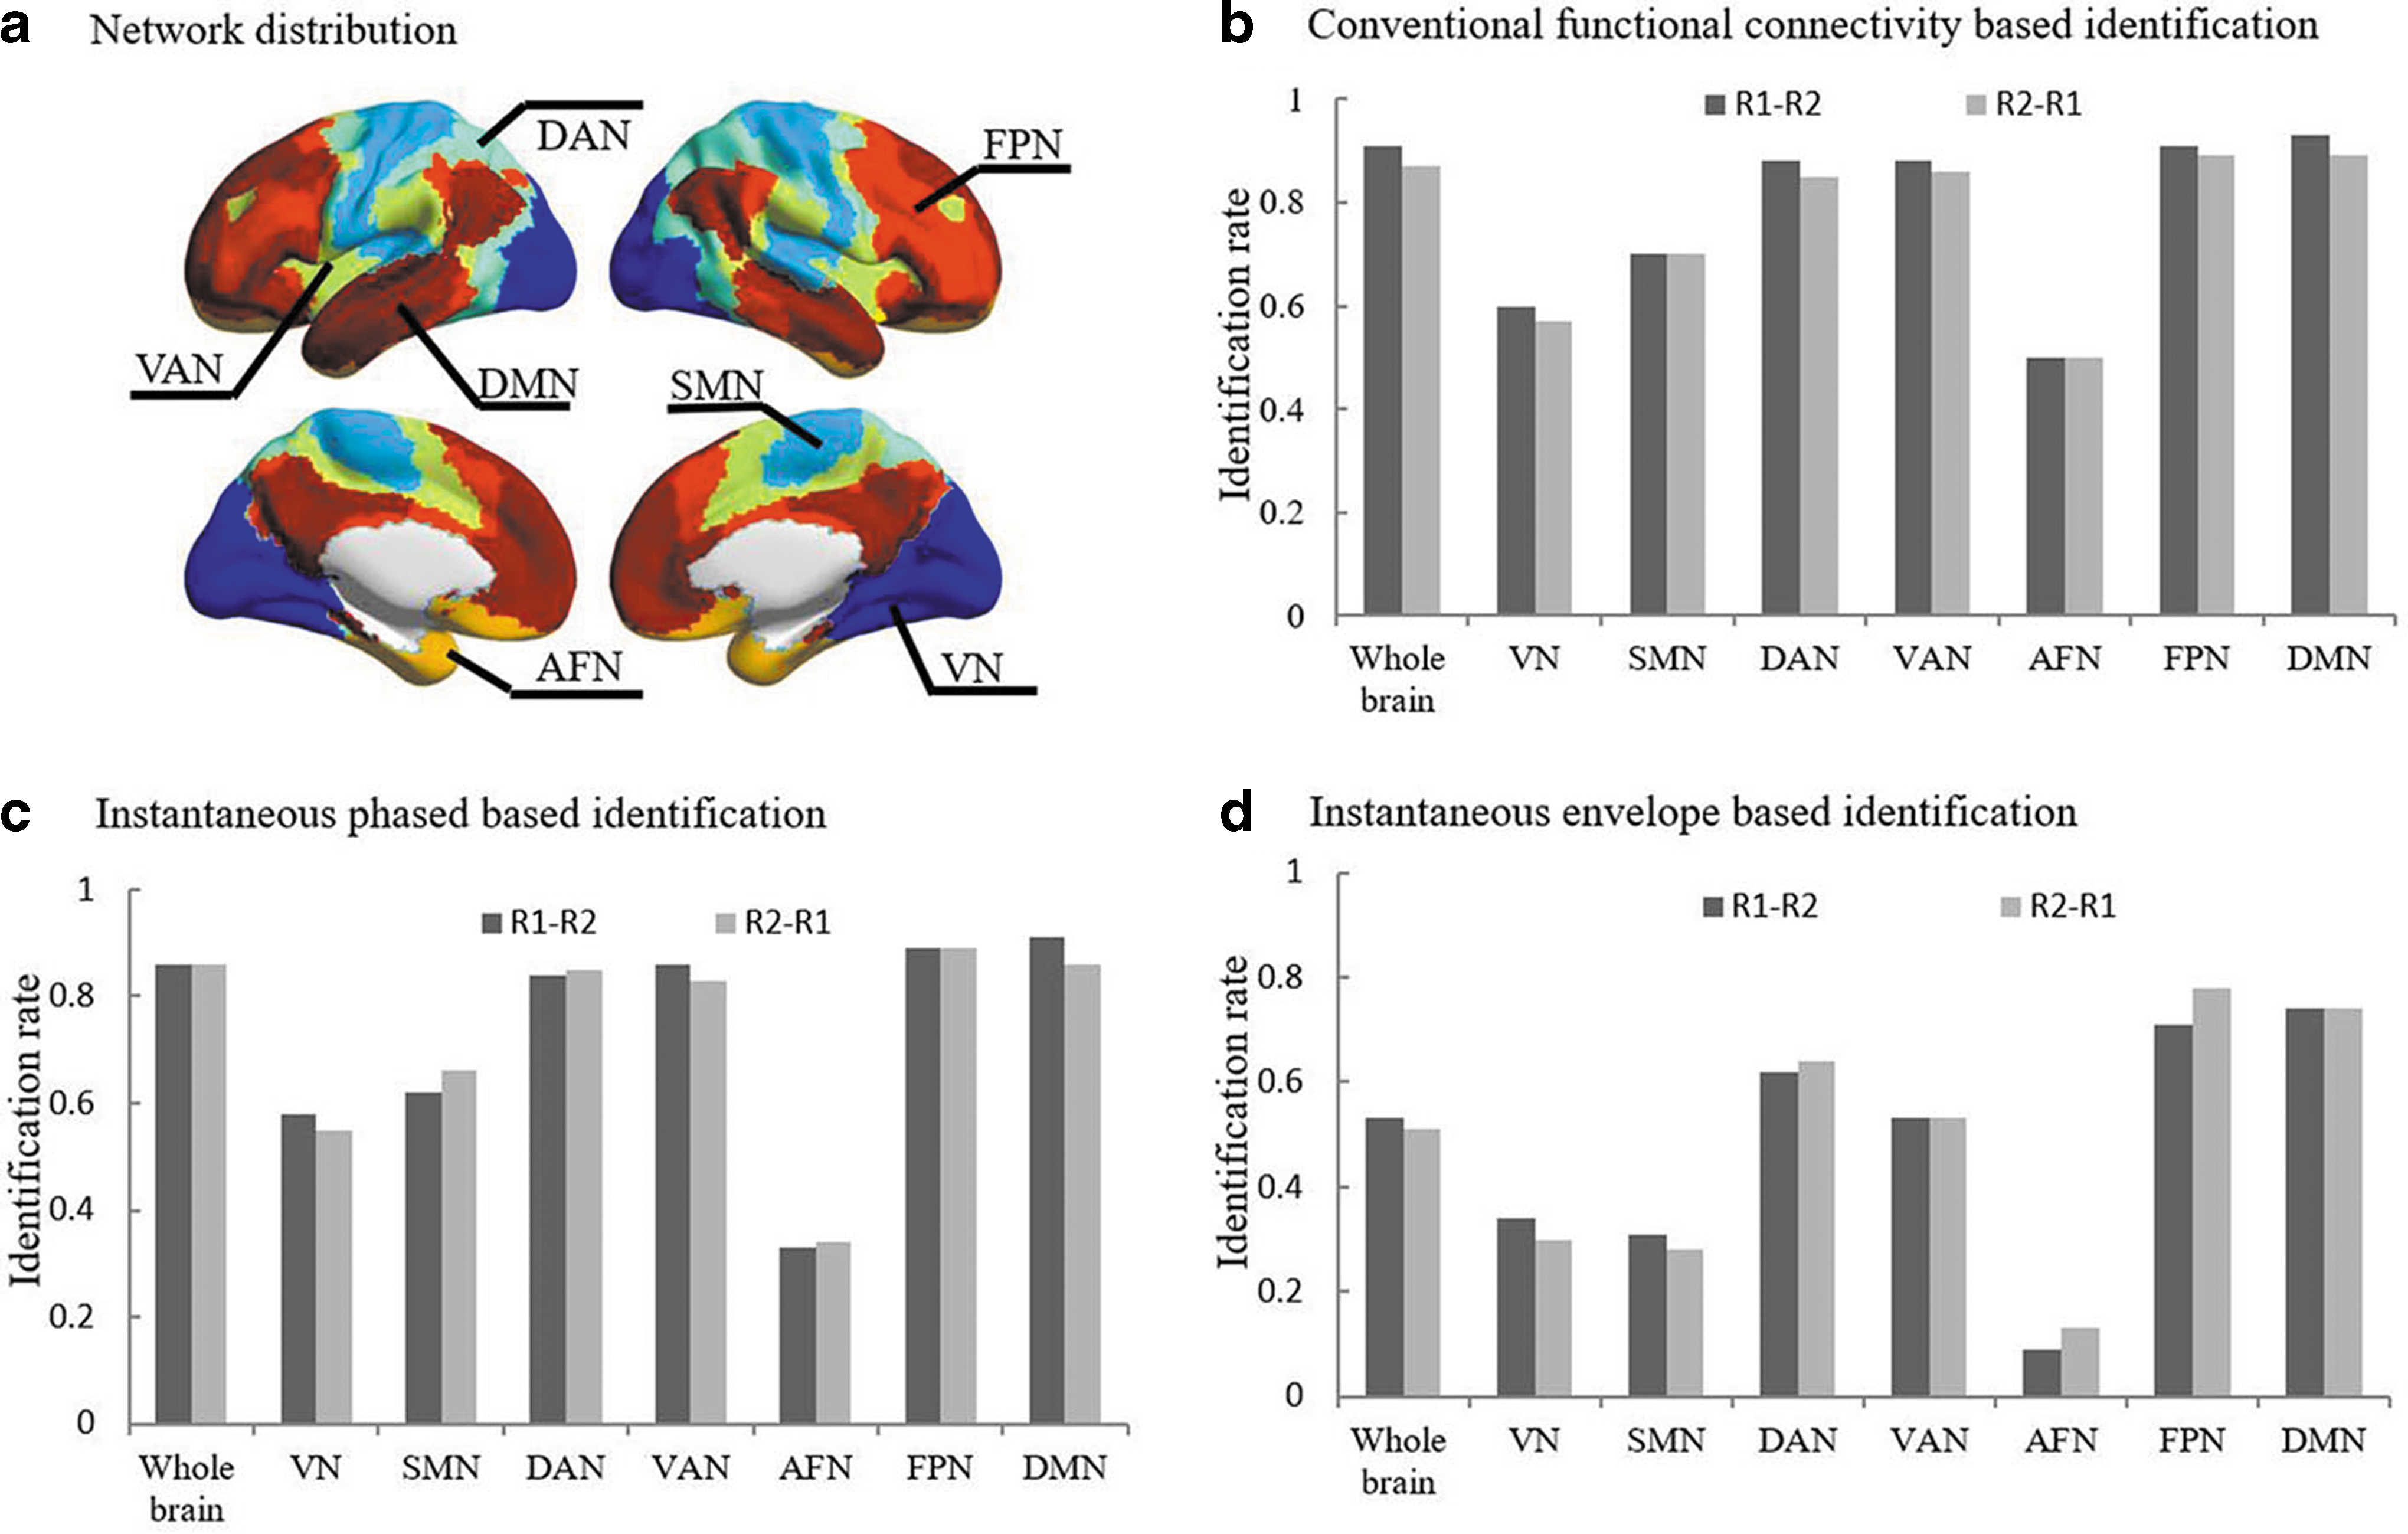
We divided the AAL1024 atlas into seven resting-state functional network templates that were established in previously published work. As Yeo's networks only included cortical areas, we included the striatum, as done previously by Choi and colleagues (2012). Network labeling was done pursuant to Yeo et al.'s (2011) networks by mapping each node to a network template and counting the number of voxels that belonged to each network. We then identified the network with the largest number of voxels, which represents the primary network label of the given node (Fig. 2a). The default mode network (DMN), frontoparietal network (FPN), affective network, ventral attention network (VAN), dorsal attention network (DAN), somatomotor network (SMN), and visual network (VN) were composed of 262, 148, 84, 111, 101, 164, and 151 nodes, respectively (Supplementary Table S1).
Identification results across whole brain/subnetwork.
Functional connectivity network estimation
Three different methods were applied to determine the functional connectivity based on the band-pass-filtered time series: amplitude-based functional connectivity (the conventional method), analytic signal-based functional connectivity (instantaneous phase and instantaneous envelope), and functional connectivity joining the conventional method and analytical signal.
For the amplitude-based functional connectivity (the conventional method), Pearson correlations and a partial correlation were computed between the time series of each node for each participant to characterize the coherence between each node pair (Fig. 1g). We then obtained a 1024 × 1024 symmetric correlation matrix representing the functional connectivity between each node pair. We used Fisher's z transform to normalize the correlation matrix. Moreover, a minimum partial correlation was used to scale the functional connectivity derived from the partial correlation, which is a parameter-free measure for the skeleton of functional connectivity (Nie et al., 2017). A minimum partial correlation is the minimum of absolute value of the partial correlations and is achieved by controlling all possible subsets of other regions. The code for a minimum partial correlation is offered by Dr. Nie.*
Analytic signal-based functional connectivity (instantaneous phase and instantaneous envelope) was computed pursuant to previously published methods (Glerean et al., 2012). To briefly explain, each real valued band-passed (0.04–0.07 Hz) BOLD time series was converted into analytic signals using the Hilbert transformation, which can be expressed using the following formula:
In this study, we used
Instantaneous phase coupling matrices C(t) were then calculated using the phase differences normalized between 0 and 1, thereby representing perfect antisynchronization and perfect synchronization, respectively, such that
To determine whether joining the conventional method and analytical signals increases fingerprinting accuracy, we performed two separate combinations. First, we combined all three features—conventional amplitude, instantaneous phase, and instantaneous envelope—comprising a 3072 × 3072 functional connectivity matrix for each individual. Second, we only included conventional amplitude and instantaneous phase, resulting in a 2048 × 2048 functional connectivity matrix for each individual.
Identification analysis
Whole brain and subnetwork-wise analysis
For this analysis, we used the same methods as Finn et al. (2015). To briefly describe these methods, we created a database, including all individual participants' connectivity profiles from Time 1 (i.e., Rest1),
In addition, to clarify the contributions of individual networks (see the Subnetwork definition section) and to identification accuracy, we used submatrices, each of which corresponded to a single network. Nodes of the predefined networks defined the submatrix of a network (1 … j = 7), and only connections within the selected network were included for an identification analysis (Fig. 2a).
Edge contribution to identification
To determine which edge(s) represented the largest contribution to identification, we used an edgewise product. A Pearson correlation was used to estimate the similarity between the target matrix and the database, and the matrix with the largest correlation coefficient was assigned a subject identifier. Given that vectors are z-scored normalized, the Pearson correlation of the vectors is the sum of the element-wise product. As such, with two z-scored normalized matrices, Xi
and Yi
, in two sessions, the edgewise product can be defined as follows:
Validation analyses
Time course effect
To test whether the scanning duration affected the identification accuracy using analytic signals, we varied the scan time between the first and the last time point within a defined time, ranging from 4 to 8 min, using 60 sec increments. We repeated the identification analysis using the same steps described above and generated a reestimation of the identification accuracy rate.
Anatomical differences
Despite the functional nature (i.e., BOLD) of the data used, subtle anatomical variability may lead to a preference for the same subjects across different sessions (days/years). To reduce the bias introduced by registration, pursuant to a previous study (Finn et al., 2015), we re-extracted the time series, using data smoothed out with different-sized smoothing kernels (4, 6, and 8 mm) and ran the identification analysis again. Using higher kernel size has been found to eliminate or reduce any potential bias for the same subject's brain relative to a different brain during registration (Finn et al., 2015).
Results
Conventional method
Using the conventional functional connectivity matrix with a full correlation, we observed success rates of 91% and 87% based on the target database of Rest1–Rest2 and the reverse, Rest2–Rest1, respectively (Fig. 2b). While using the conventional functional connectivity matrix with a partial correlation, we observed success rates of 88% and 87% based on the target database of Rest1–Rest2 and the reverse, Rest2–Rest1, respectively. Accuracy rates were highly significant (p < 0.00001), as determined using nonparametric permutation testing (10,000 times). The results are in line with previous studies (Finn et al., 2015; Miranda-Domínguez et al., 2018; Waller et al., 2017) and suggest that functional connectivity is a stable and reliable fingerprint for discriminating among individuals.
Analytic signal-based functional connectivity
Whole brain identification
The connectivity matrix derived from instantaneous phase, instantaneous envelope, and variability of instantaneous phase coupling demonstrated good identification accuracy (success rates >50%; Table 1). In particular, the functional connectome based on instantaneous phase had success rates of 86% and 86% based on a target database of Rest1–Rest2 and the reverse Rest2–Rest1, respectively (Fig. 2c, d). Nonparametric permutation testing (10,000 times) showed that the identification accuracy across various strategies of connectivity construction had a value of p < 0.00001.
Identification Results Across Whole Brain/Subnetwork
Note: R1–R2 identification analysis based on a target database of Rest1–Rest2; R2–R1 identification analysis based on a target database of Rest2–Rest1.
AFN, affective network; DAN, dorsal attention network; DMN, default mode network; FPN, frontoparietal network; SMN, somatomotor network; VAN, ventral attention network; VN, visual network.
Subnetwork identification
We further tested which functional network(s) represented a greater contribution to the project of individual identification and found that higher-order functional networks, especially the FPN and VAN, demonstrated high rates of identification accuracy either based on a target database of Rest1–Rest2 or the reverse Rest2–Rest1 (accuracy range = 83–89%; Fig. 2c, d; Table 1). Moreover, we found that the DMN also demonstrated excellent identification accuracy among different brain connectivity profiles with the accuracy score ranging between 74% and 91%.
Edgewise contribution to identification
As with the subnetwork identification, we found that the functional brain connectivity fell into the 99.9th percentile of DP when located in the FPN, VAN, and DMN, or interconnected among these three networks (Fig. 3a; Supplementary Table S5). Furthermore, the results were found to be stable across different percentile thresholds (99th percentile and 99.5th percentile; Supplementary Tables S3 and S4). These results confirmed our results from the subnetwork identification analysis and demonstrated that connections involving a higher-order association cortex with rich cognitive involvement are the most typical features shaping individual brains. In addition, we found that among different strategy-derived brain connections, brain connectivity with high
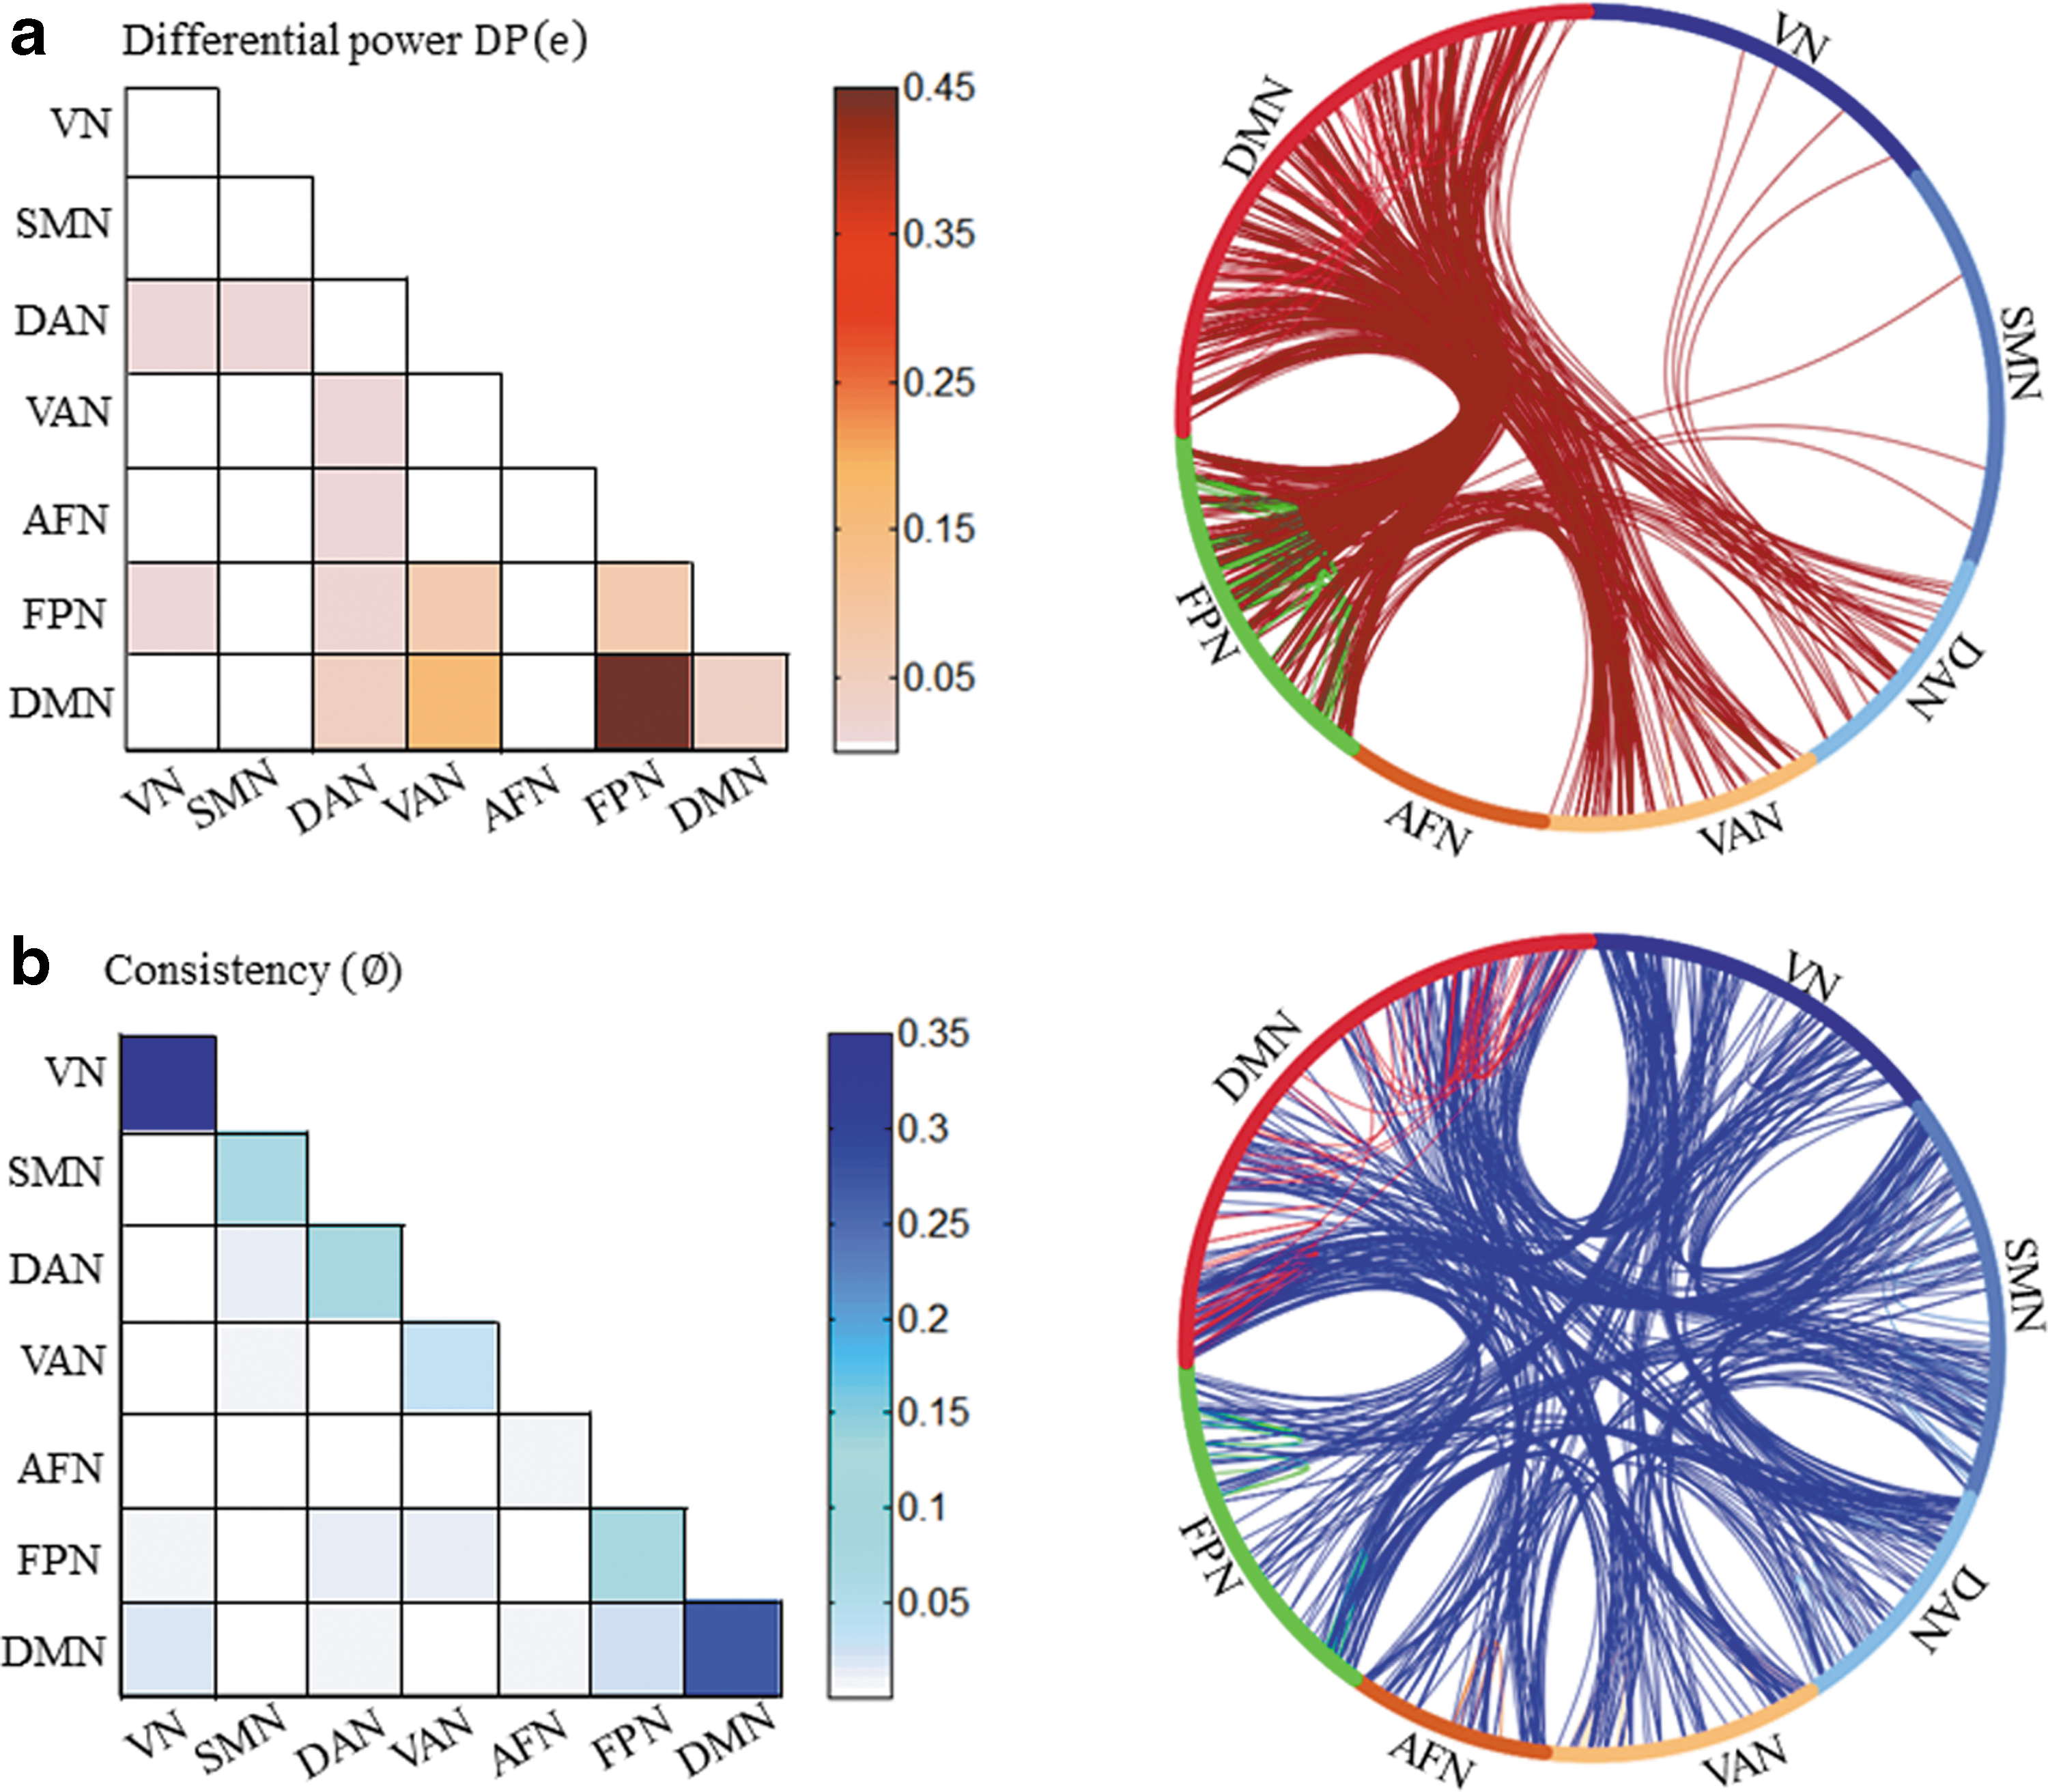
Connectograms for the edges contributed for identification analysis.
Identification analysis combining conventional amplitude and analytic signal-based functional connectivity
Combining conventional amplitude, instantaneous phase, and instantaneous envelope decreased the identification accuracy. Instead, combining conventional amplitude and instantaneous phase resulted in a higher/similar identification accuracy compared to accuracies using the two features separately (Table 1). On a subnetwork level, combined identification analysis showed that high-order functional networks (e.g., FPN and DAN) showed high rates of identification accuracy, irrespective of whether the analysis is based on a target database of Rest1–Rest2 or Rest2–Rest1 (accuracy range = 86–91%; Table 2).
Identification Results by Fusing the Conventional Method and Analytical-Based Signal
Note: R1–R2 identification analysis based on a target database of Rest1–Rest2; R2–R1 identification analysis based on a target database of Rest2–Rest1.
Validation analyses
Global signal effects
We found that when the global signal was regressed out, the identification accuracy remained fairly high; however, it did show some decline compared to those results for which the global signal was not regressed out (Supplementary Fig. S1a; Supplementary Table S2).
Anatomical differences
Identification accuracy slightly dropped with increased smoothing kernel but remained highly significant, even at a kernel size of 8 mm (Supplementary Fig. S1; Supplementary Table S2). The DMN, VAN, and FPN, however, remained the most powerful features contributing to the identification analysis (Supplementary Fig. S1; Supplementary Table S2).
Time course effects
Identification accuracy remained significantly greater than random efforts at identification, regardless of the scanning length, although identification accuracy scores increased as scanning times grew longer (Supplementary Fig. S2). This suggests that resting-state fMRI data scanned over 4–8 min does not significantly affect identification, based on brain connectivity patterns.
Discussion
The findings of this study confirm that analytic signals derived from functional connectivity (i.e., instantaneous phase and instantaneous envelope) demonstrated good accuracy in identifying individuals from a large sample over an average longitudinal time span of 818 days. This suggests that neural synchronization from low-frequency resting-state fMRI BOLD oscillation is reliable and may be a useful neural fingerprint for identifying individuals. Our findings support previous findings (Finn et al., 2015; Miranda-Domínguez et al., 2018; Waller et al., 2017), which demonstrated that functional connectivity originating from amplitude is a reliable fingerprint for distinguishing between individuals, even after a period of more than 2 years. Together, these findings confirm the long-term consistency of functional connectomes derived from the use of two different techniques (amplitude and analytic signals) to promote the identification of individuals and highlight their potential importance for precision psychiatry.
Previous work indicated the importance of analytic signals in explaining individual differences in higher order functioning (Fries, 2005, 2015) and demonstrated a high degree of correspondence between brain structure and function (Ponce-Alvarez et al., 2015). Our results significantly add to this knowledge by showing that brain functional connectivity that originates from these analytic signals is a stable and reliable feature discriminating individuals. Our results may have clinical significance. Indeed, previous studies illustrated that analytic signals are meaningful indices for characterizing brain deficits associated with neuropsychiatric disorders and the impact of genetic effects on depression (Córdova-Palomera et al., 2015, 2016). Hence, approaches that use these signals may even provide new insights into tailored interventions for psychiatric and neurological disorders (Arbabshirani et al., 2017).
From a methodological perspective, the phase-based dynamic functional approach has several advantages relative to conventional approaches to identification. First, using the instantaneous phase allows for the identification of full temporal dynamics without the need for time-windowed averaging (Glerean et al., 2012), and as a nonlinear measure it may be more suitable for identifying complex dynamic processes in the brain (Pereda et al., 2005). Second, this approach has been established as having good stability across a long time span; the findings of this study further validate this. Third, instantaneous phase-based functional connectivity could be applied to characterize unique time-varying connectivity networks, or “chronnectome” fingerprinting (Calhoun et al., 2014). Chronnectome is used to describe connectivity metrics allowing a dynamic view of coupling. For example, Liu et al. (2018) found robust individual variability in human brain chronnectome that predicted individual differences in cognitive performance. Compared with amplitude-based functional connectivity, instantaneous phase-based functional connectivity does not mandate a (semi-)arbitrary choice of window length and window overlap, thus increasing the sensitivity of the functional dynamic (Pedersen et al., 2018). Hence, instantaneous phase-based functional connectivity offers a new and promising tool for chronnectome fingerprinting. This is supported by our identification analysis based on the variability of instantaneous phase coupling, which showed high identification accuracy either based on a target database of Rest1–Rest2 or the reverse Rest2–Rest1 (Table 1). Together, this work highlights the importance of considering different components of neuronal activity waves (i.e., instantaneous phase and instantaneous amplitude) as “fingerprints” for identification. Thus, analytic signals, especially instantaneous phase, may provide a useful alternative tool for studying dynamic functional connectome architecture and individual differences in cognition, potentially in clinical outcomes (Hutchison et al., 2013; Tewarie et al., 2018; Uhlhaas and Singer, 2006).
Furthermore, our results indicate that only functional connectivity based on instantaneous phase but not based on instantaneous envelope shows identification accuracies that are comparable with the conventional method. Indeed, instantaneous envelope is always discarded from an analytical signal because it is uncorrelated with the actual phase dynamics (Glerean et al., 2012). Moreover, Daffertshofer and van Wijk (2011) found that instantaneous envelope contaminates the instantaneous phase-based functional connectivity if two connected regions have different magnitudes in amplitude. Testing the magnitude of whole brain nodes is beyond the scope of this study. However, we found decreased identification accuracy in our data when combining conventional amplitude, instantaneous phase, and instantaneous envelope, compared to when only combining conventional amplitude and instantaneous phase.
The findings of this study need to be considered in light of several limitations. First, all participants in this study were adults whose brains were relatively mature and therefore likely subject to minimal functional changes. Several studies have, however, suggested that factors such as illness (Woodward and Cascio, 2015) and cognitive training (Voss et al., 2010) may impact functional connectivity profiles. As such, it is important that future research explores the extent to which such factors only shape the general profile of brain connectivity or whether they also shape more specific connectivity organization profiles.
Second, functional connectivity is severely affected by head motion artifacts, which have been shown to modulate the relationship between functional connectivity and behavioral measures, such as fluid intelligence, weight, and so on (Satterthwaite et al., 2019; Siegel et al., 2016). Although the cutting-edge data processing strategies we applied largely reduced the influence of head motion (i.e., 12 head motion parameters and artifactual covariates detected by ART as regressors; Power et al., 2012), it is impossible to eliminate the head motion effects entirely. Future research may consider systematically exploring head motion effects on the functional connectivity derived by analytic signal to further understand this relationship.
Third, limited by the data resources, we were unable to address any association between brain and behavior. Previous studies suggested that static and dynamic functional connectivity (tapped by a sliding window approach) can predict cognitive performance (Finn et al., 2015; Liu et al., 2018). Whether neural synchronization characterized by analytical signal can serve as a predictor of cognitive performance needs to be addressed in a future study.
Conclusion
Our findings confirm that functional connectivity based on resting-state fMRI can be used to map individual brain differences. Furthermore, we have demonstrated that analytic signal-derived functional connectivity, in particular the instantaneous phase, is also a useful “fingerprint” for identifying individuals. This may represent an alternative mode for characterizing the dynamic functional connectivity organization profile and provide different individual specific information relative to the conservative method commonly used.
Footnotes
Acknowledgments
The SLIM data were provided by Functional Connectomes Project International Neuroimaging Data-Sharing (Principal Investigators: Jiang Qiu and Qinglin Zhang). This project was supported by The University of Hong Kong May Endowed Professorship in Neuropsychology and Science and Technology Program of Guangdong (2018B030334001). No funding partner played a role in study design, data collection, data analysis, data interpretation, or writing the report.
Author Disclosure Statement
The authors declare that they have no conflict of interest.
Supplementary Material
Supplementary Figure S1
Supplementary Figure S2
Supplementary Table S1
Supplementary Table S2
Supplementary Table S3
Supplementary Table S4
Supplementary Table S5
*
References
Supplementary Material
Please find the following supplemental material available below.
For Open Access articles published under a Creative Commons License, all supplemental material carries the same license as the article it is associated with.
For non-Open Access articles published, all supplemental material carries a non-exclusive license, and permission requests for re-use of supplemental material or any part of supplemental material shall be sent directly to the copyright owner as specified in the copyright notice associated with the article.