
Abstract
Resting-state (RS) functional magnetic resonance imaging (fMRI) has been used to investigate networks of activity within the brain, as well as the brainstem (BS) and spinal cord (SC). While previous research has shown coordinated resting state networks (RSNs) in the BS/SC, their function is still unclear. The aim of this study was to investigate the function of RSNs across these regions, by examining how these networks change when participants are experiencing different cognitive states (RS, listening to an audio presentation, or watching a video). RS blood oxygenation-level dependent fMRI data were obtained from the human cervical SC and BS in 20 healthy participants (14 women, 6 men), at 3 tesla, with T2-weighted single-shot fast spin-echo imaging. Functional connectivity was investigated within the entire three-dimensional region by means of temporal correlations between anatomical regions and by structural equation modeling (SEM). Both correlational analyses and SEM showed extensive connectivity within and across BS and SC regions, and 37% to 40% of significant connections were consistent across study conditions. However, significant differences in connectivity between specific regions of the BS and SC were also identified which depended on the study conditions. The results indicate that connectivity across the RS SC/BS is influenced by a person's cognitive/emotional state. The known anatomical functions of the regions involved support the conclusion that this RS network may play a role in the integration of homeostatic autonomic functions.
Introduction
Resting-state (RS) functional magnetic resonance imaging (fMRI) research has revealed much about the brain's coordinated networks in the absence of a task or external stimulus, such as the default mode network. As functional MRI of the brainstem (BS) and spinal cord (SC) has become established, RS fMRI studies have expanded into these areas as well. This expansion is expected to provide important new insights into central nervous system function. Studies to date have demonstrated that spontaneous blood oxygenation-level dependent (BOLD) signal fluctuations occur in the SC in the absence of a stimulus and that these likely represent coordinated resting-state networks (RSNs) (Barry et al., 2014, 2016; Bushnell et al., 2013; Conrad et al., 2018; San Emeterio Nateras et al., 2016; Wei et al., 2010). Most studies to date have used a limited number of transverse slices through the cervical SC. For example, Kong et al. described intrinsically organized networks within and across cervical SC segments, but the connections were limited to short-range connections (Kong et al., 2014). Conrad et al. investigated intrinsic functional connectivity of SC regions in multiple-sclerosis patients and showed that this connectivity was similar to healthy controls and also that focal abnormalities in connectivity can be detected around MS lesions (Conrad et al., 2018).
Acquisition of fMRI data in this region is affected by a number of technical challenges as a result of the small cross-sectional dimensions of the cord, poor field homogeneity, and physiological noise (Bosma and Stroman, 2014; Figley and Stroman, 2007; Figley et al., 2008). This raises concerns as to whether RS coordinated signals can indeed be attributed to BOLD effects. In a recent study we acquired data from healthy participants, and from cadavers as a reference, and demonstrated that we are able to remove a large proportion of the physiological noise (Harita and Stroman, 2017). The results confirmed that after the bulk of the noise is removed robust RS BOLD fluctuations can be detected (Harita and Stroman, 2017). This finding is supported by previous studies that also aimed to confirm that physiological noise cannot explain the observed coordination of RS signal fluctuations in the SC (Barry et al., 2014; Bushnell et al., 2013). As a result of the studies to date there is considerable evidence of BOLD signal variations and coordination of SC regions in the RS, but the function of these networks is yet to be investigated.
The objective of this study is to investigate the effect of cognitive/affective tasks on RSNs in the BS and SC, to begin to investigate the function of these networks. We hypothesize that a person's cognitive/affective state influences connectivity in resting state networks (RSNs) across the BS and SC. Our hypothesis is based on the expectation that continuous descending modulation of SC neurons determines the SC receptive state, and fluctuations may occur with a person's mental state (Stroman et al., 2016a). In the present study we use audio-video presentations, audio-only presentations, and viewing of a fixed image, to vary the cognitive/affective state. Previously it was demonstrated that similar BOLD time-series signal variations occur in cortical regions across participants viewing the same movie (Naci et al., 2014). Kornelsen et al. also showed that RS BOLD signals in the thoracic SC can vary when participants view negatively- or neutrally-valenced images (Kornelsen et al., 2015). Negatively-valenced images coupled with participants giving a button-press response about the contents of the image were observed to be the most likely to elicit a change in BOLD response. We propose that if a person's mental state can be shown to influence RS BOLD signal fluctuations in the BS and SC, then we can conclude that at least one function of the RSNs is to regulate the excitability of SC neurons.
Materials and Methods
All methods were approved by the institutional human research ethics review board. Informed consent was obtained in writing from each participant before the beginning of the study.
Participants
RS spinal fMRI studies were carried out with 20 healthy participants (14 women, 6 men) ranging from 18 to 27 years old (average age 21 ± 2 years). Participants had no history of brain injury, SC injury, or neurological disorders. Participants were not considered if the MRI posed a risk to their safety (such as with recent surgery or metal implants).
Experimental design
Functional MRI scans were carried out on a Siemens 3 tesla MRI system (Siemens Magnetom Trio, Erlangen, Germany). Participants were positioned supine with foam supports under their knees and arms for comfort and to minimize body movement during the scan. They were able to hear instructions and the audio presentation through foam earbuds. The posterior half of a 12-channel head coil, a posterior 4-channel neck coil, and the upper elements of a spine coil array (3 channels) were used in conjunction to obtain images of the entire BS and cervical SC. A mirror positioned above the participants' eyes allowed them to view a rear projection screen, which displayed the video and picture during fMRI runs. The peripheral pulse was recorded by means of an optical sensor attached to the participant's left index finger. All participants were provided with a squeeze ball to signal the experimenter in the event of an emergency (no scans were interrupted during the data collection of this study).
After setup, participants entered the bore of the MRI head-first and supine and were instructed to remain relaxed and as still as possible. During the study, participants experienced three different experimental conditions. For the “Picture” condition, participants viewed a static image of a tree for the duration of the fMRI acquisition with no other external or auditory stimuli present (i.e., RS). This condition was presented twice to each participant. The image of a tree was chosen as opposed to a fixation cross because this condition is to be compared with a dynamic movie condition with both audio and video components, and the condition difference is intended to be dominated by the dynamic nature and salience as opposed to the absence of color or information. In addition, the tree picture enables us to compare the results with prior studies during which participants viewed a color pain-rating scale (Bosma et al., 2015, 2016; Stroman et al., 2016a, 2016b).
For the “Audio” condition, participants viewed the same static image of a tree while listening to an audio recording composed of preselected music, followed by a 40 sec pause, and then spoken-word poetry. The pause between audio clips was used both so that the length of the total audio recording matched the length of the videos and so that participants would not experience a transition directly from music to spoken-word poetry and become confused by the transition. The audio clips were compiled for the study from freely-shared samples and were chosen to engage the listener's attention. The pieces were selected to have interesting word play to be engaging, without having any strong political or emotional themes to avoid participants having negative reactions to the music.
All participants experienced the same picture and the same audio and video clips. Two different selections of music and poetry were presented, one for each of two Audio conditions in the study. During the “Video” condition, participants viewed a video with corresponding audio for the entirety of the scan. Two different selections of videos were presented, consisting of a card magic performance and a technology demonstration for a video game system. Again, pieces were chosen to be engaging but not overly emotional or political in theme. One video was presented for each of two Video conditions in the study. All participants listened to the same audio presentations and viewed the same videos. All participants completed six functional scans (two Picture, two Audio, and two Video conditions), the order of which was randomly assigned for each participant.
Functional MRI data acquisition
Localizer images were acquired in three planes to provide a reference for subsequent slice positioning. Consistent with previous SC fMRI studies, images of the entire BS and cervical SC were acquired using a half-fourier single-shot fast spin-echo (HASTE) sequence with BOLD contrast (Bosma and Stroman, 2014). This method has been demonstrated to provide optimal image quality in the SC and BS, as well as BOLD sensitivity. The three-dimensional (3D) imaging volume spanned from the first thoracic vertebra to the thalamus, and parameters included an echo time of 76 msec for optimal T2-weighted BOLD sensitivity and a repetition time (TR) of 6.75 sec per volume (Bosma and Stroman, 2014; Bosma et al., 2015, 2016; Dobek et al., 2014; Harita and Stroman, 2017). Data were acquired in nine sagittal slices, 2 mm thick, with a 280 × 210 mm field of view and a 192 × 144 matrix, resulting in 2 × 1.5 × 1.5 mm spatial resolution (R/L × A/P × H/F), with an anterior/posterior phase-encoding direction. A total of 62 volumes were acquired to produce a time-series spanning 6 min 57 sec. The peripheral pulse was recorded continuously throughout each run by means of an optical sensor attached to the participant's left index finger. The pulse sensor is incorporated into the Siemens MRI system.
Data preprocessing
SC and BS fMRI data were preprocessed and analyzed using custom-written software, “spinalfmri8” (
Statistical analysis
Cluster-based connectivity analysis
Connectivity was identified between regions based on the temporal correlation between BOLD signal fluctuations in each participant. Averages over clusters of voxels were used to increase the signal-to-noise ratio over single-voxel analyses and to reduce the number of statistical comparisons to be made. To define the clusters to be analyzed, 41 regions of interest (ROIs) were first identified using a previously-established anatomical region map (Bosma et al., 2015, 2016; Khan and Stroman, 2015). The regions included the hypothalamus, periaqueductal gray matter (PAG), parabrachial nucleus (PBN), locus coeruleus (LC), nucleus tractus solitarius (NTS), nucleus raphe magnus (NRM), nucleus gigantocellularis (NGc), dorsal reticular nucleus of the medulla (DRt), pontine reticular formation (PRF), and four quadrants of each SC segment from C1 to C8. The spatial definitions of these regions were compiled from several anatomical atlases and published articles (Lang, 1993; Lang and Bartran, 1982; Naidich et al., 2009; Talairach and Tournoux, 1988; Williams et al., 1995). Each ROI was divided into seven clusters based on the voxel time-series using k-means clustering. Therefore, the total number of resulting clusters was 287 (i.e., 41 × 7).
This method enhances the spatial precision of the results by dividing the clusters based on their functional characteristics and has been previously used to investigate RSNs in the BS and SC (Harita and Stroman, 2017). Clusters that had 25% or more of the voxels within 1 mm of the cerebrospinal fluid (CSF) space were marked as “edge” clusters and were removed from the analysis because they are more prone to physiological noise arising from cardiac motion, CSF flow, cord motion, etc. (Figley and Stroman, 2009). With this process, edge voxels with high noise and nonresponding voxels were separated and distinguished from groups of voxels with significant BOLD responses. The clusters within each ROI were defined based on the BOLD signal time courses across all participants, and the same definition was used for all analyses, in all participants, for consistency.
The correlation between BOLD time-series variations was calculated between each pair of clusters, for each participant in the study, for each run type. Correlations were not computed between pairs of adjacent clusters (defined as having any voxels immediately adjacent in any direction). The two runs of each type were concatenated along the time dimension for analysis to increase the statistical power for detecting any effects of the Audio or Video presentations. Thus, the comparison groups to be analyzed were Video (with the two video conditions combined into one 14 min long run), Audio (with the two music conditions combined), and Picture (with the two presentations of the picture grouped together). Correlation grids for each individual for each comparison group were calculated, resulting in three sets of 20 individual correlation grids.
Statistical thresholds for inferring significance were determined by first converting correlation R-values to Z-values, which have continuous distributions, by means of Fisher's Z-transform:
The similarity or difference between connectivity values was investigated based on the distribution of Z-values across participants for each connection. Connectivity values were compared across study groups by means of a paired sample t-test to identify significant differences in the Z-value distributions. A connection was inferred to be significantly different between two groups if the paired t-test resulted in a Bonferroni-corrected p corrected < 0.05 (corresponding to an uncorrected p < 0.05/Nclusters). Consistency between groups was identified by determining if the distributions of Z-values for two study conditions were equivalent. A connection was concluded to be consistent if the mean Z-values differed by less than half of the pooled standard error (SE).
Structural equation modeling
Structural equation modeling (SEM) was also used, as in previous studies, because the coordination of activity across a complex network of regions may not be fully identified by cluster-to-cluster correlations (Khan and Stroman, 2015; Stroman, 2016; Stroman et al., 2016a). SEM requires a predefined anatomical model of plausible connections to constrain the number of possible results. We have previously described a model based on known pain-related neuroanatomy as shown in Figure 1 (Millan, 2002) that describes which source regions are sources of input for which target regions. For the present analysis the model included the 10 BS regions described above and the four quadrants of the fifth and sixth cervical cord segments (R/L and V/D). The clusters of voxels in each region were defined in the same way as in the correlation-based analyses, resulting in the same ROIs for these regions as used in the previous analyses. We chose to analyze only the C5 and C6 segments of the SC as being representative of the BS-cord connectivity to limit the number of results to be compared and to probe long-distance connections in these RS networks and facilitate comparison of these results to our current and future studies.
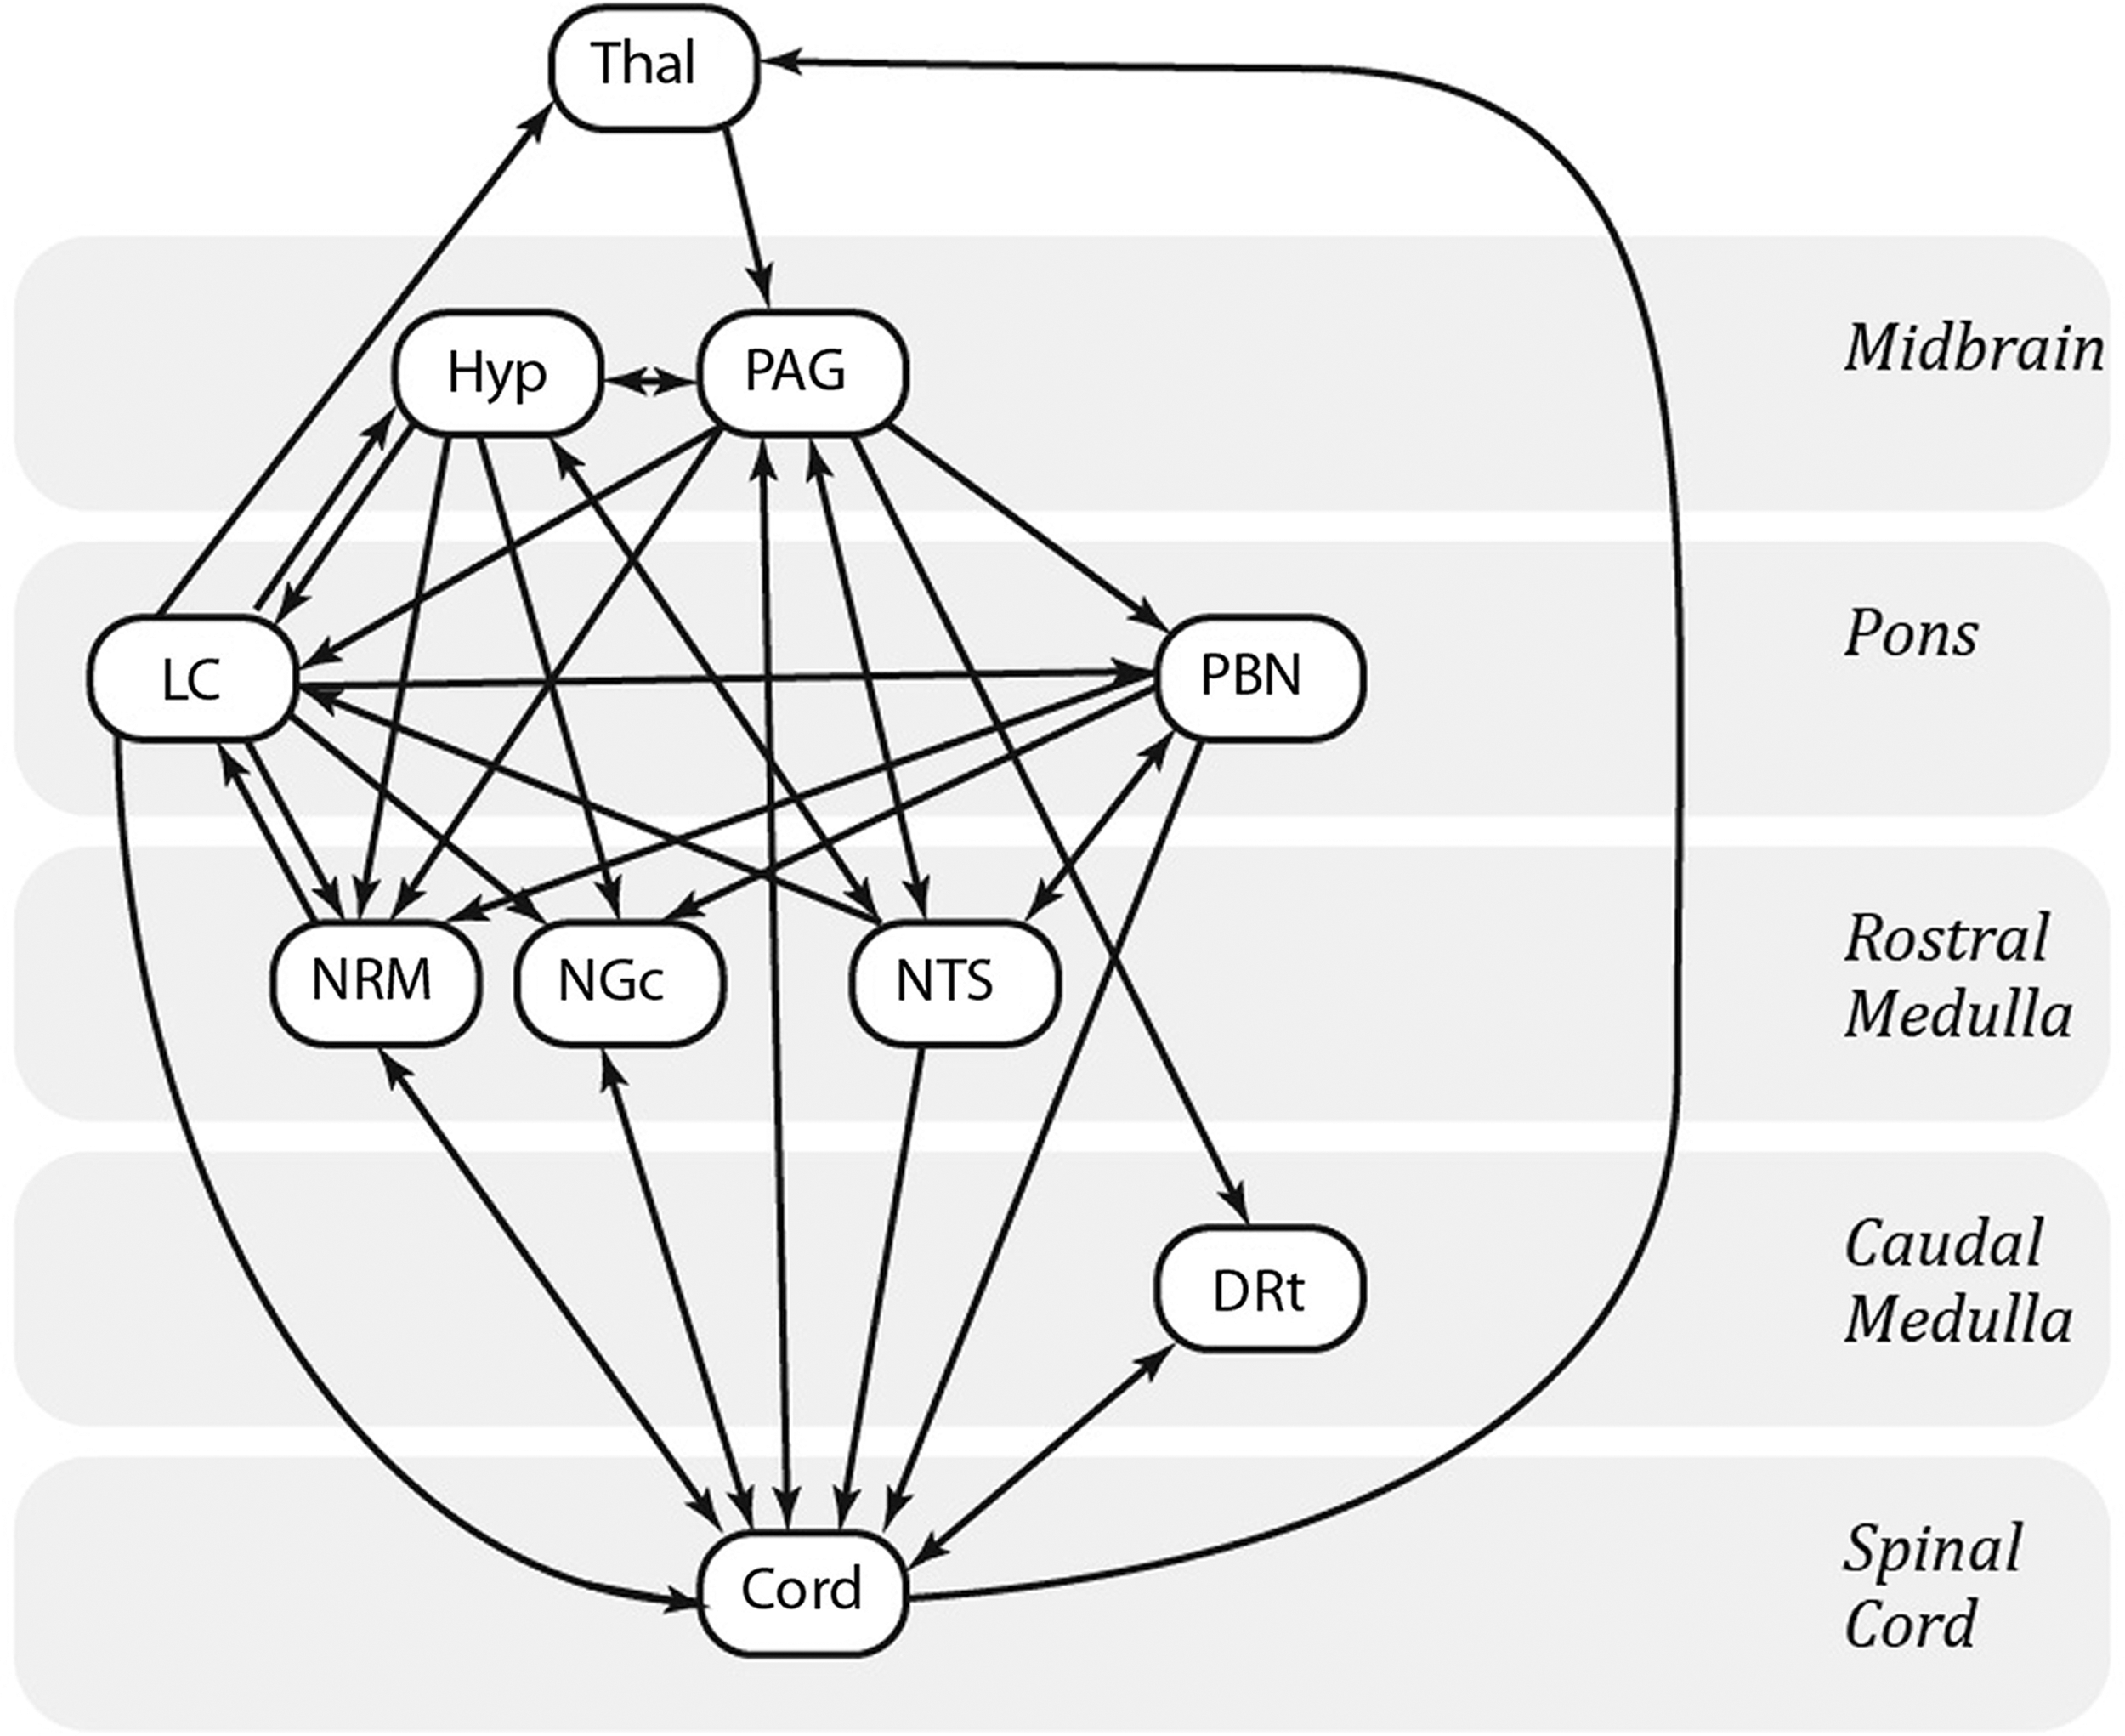
Anatomical model of the regions and connections used for the structural equation modeling analyses. DRt, dorsal reticular nucleus of the medulla; Hyp, hypothalamus; LC, locus coeruleus; NGc, nucleus gigantocellularis; NRM, nucleus raphe magnus; NTS, nucleus tractus solitarius; PAG, periaqueductal gray matter; PBN, parabrachial nucleus; Thal, thalamus.
SEM was carried out by means of GLM fits for each “target” region in the network receiving input from multiple “source” regions, using all of the time-series data across participants, separately for each run type (Stroman, 2016). The connectivity weighting factors (β-values) determined by means of the GLM fit reflect the relative contribution of each source region to a given target region. The combinations of source and target regions are based on the model described in Figure 1. For example, if a network component consists of region A receiving input signaling from regions B and C, and the BOLD signal time-series responses in these regions are SA , SB , and SC , respectively, then SA = βAB SB + βAB SB + eA , where eA is the residual signal variation that is not explained by the fit (Stroman, 2016). Networks were investigated for every combination of anatomical subdivisions of each region (i.e., the clusters defined above) to identify the subdivisions that resulted in the best fits to the data. This results in the β-value for a connection being calculated multiple times, with different combinations of other sources in the same network component (the portion of the network that describes multiple sources of input to one target region).
The goodness-of-fit was determined by calculating the amount of variance in each target region that is explained by the fit, expressed as the R 2 value. The significance of the fit was estimated by converting R-values to a Z-score by means of Fisher's Z-transform. As an additional check, the fitting was repeated with one source region at a time omitted from the network to identify any terms that did not uniquely account for a significant component of the variance in each target region (computed with an F-test). A cutoff value of F(1,∞) > 3.845 was used, which corresponds to p < 0.05. Any terms that did not account for a significant component of the variance were not included in the results.
The significance of each network component was determined based on previously established probability distributions (Stroman, 2016). These distributions depend on the model parameters, and significance thresholds were determined to account for the family-wise error rate. Network components were inferred to be significant at a family-wise error corrected p fwe < 0.05. The significance of β-values within this component was determined based on the estimated SE of the β-value. Significance was inferred at a family-wise error corrected p fwe < 0.05, which accounted for the total number of network combinations that were tested across combinations of anatomical subdivisions. Note that in order for a particular connection to be shown as significant in the results, it also had to meet the condition of accounting for at least 5% of the variance of the respective network component.
The “best fit” network was identified for each run type by identifying the combination of source regions with the highest Z-value for each network component. This was done on a regional level, meaning that for each network component, the set of clusters with the highest Z-value was chosen. These network components were then compiled into one “best fit” model, which represents the best explanation of the BOLD signal variations in the ROIs, based on the known anatomical connections. Connections with nonsignificant Z-values or that did not explain at least 5% of the variability in that network component (measured with the R-value) were not included. The resultant “best fit” models for each condition were then compared by selecting the connections that were determined to be significant in at least one condition and applying paired-samples t-tests to the β-values across conditions. Significance was inferred at a family-wise error corrected p fwe < 0.05, which accounted for the total number of comparisons made between connections for each model.
Results
Cluster-based correlational analysis
Significant connectivity was detected in all three study groups within/between a number of BS and SC regions (Fig. 2). The majority of significant correlations identified were positive, although negative correlations were also identified between and within BS and cord regions. Out of 23,770 connections tested, 4896 significant connections (21%) were detected during the Picture runs, 4791 during the Audio runs (20%), and 4531 during the Video runs (19%). A large proportion of the significant connections observed were also consistent between the three comparison groups (Table 1). When directly comparing two runs of the same study condition, 37% to 38% of connections were consistent. Furthermore, 37% to 40% of connections were consistent between groups (Table 1), when only nonzero connections are considered (connections whose average Z-values across participants were significantly different from zero).
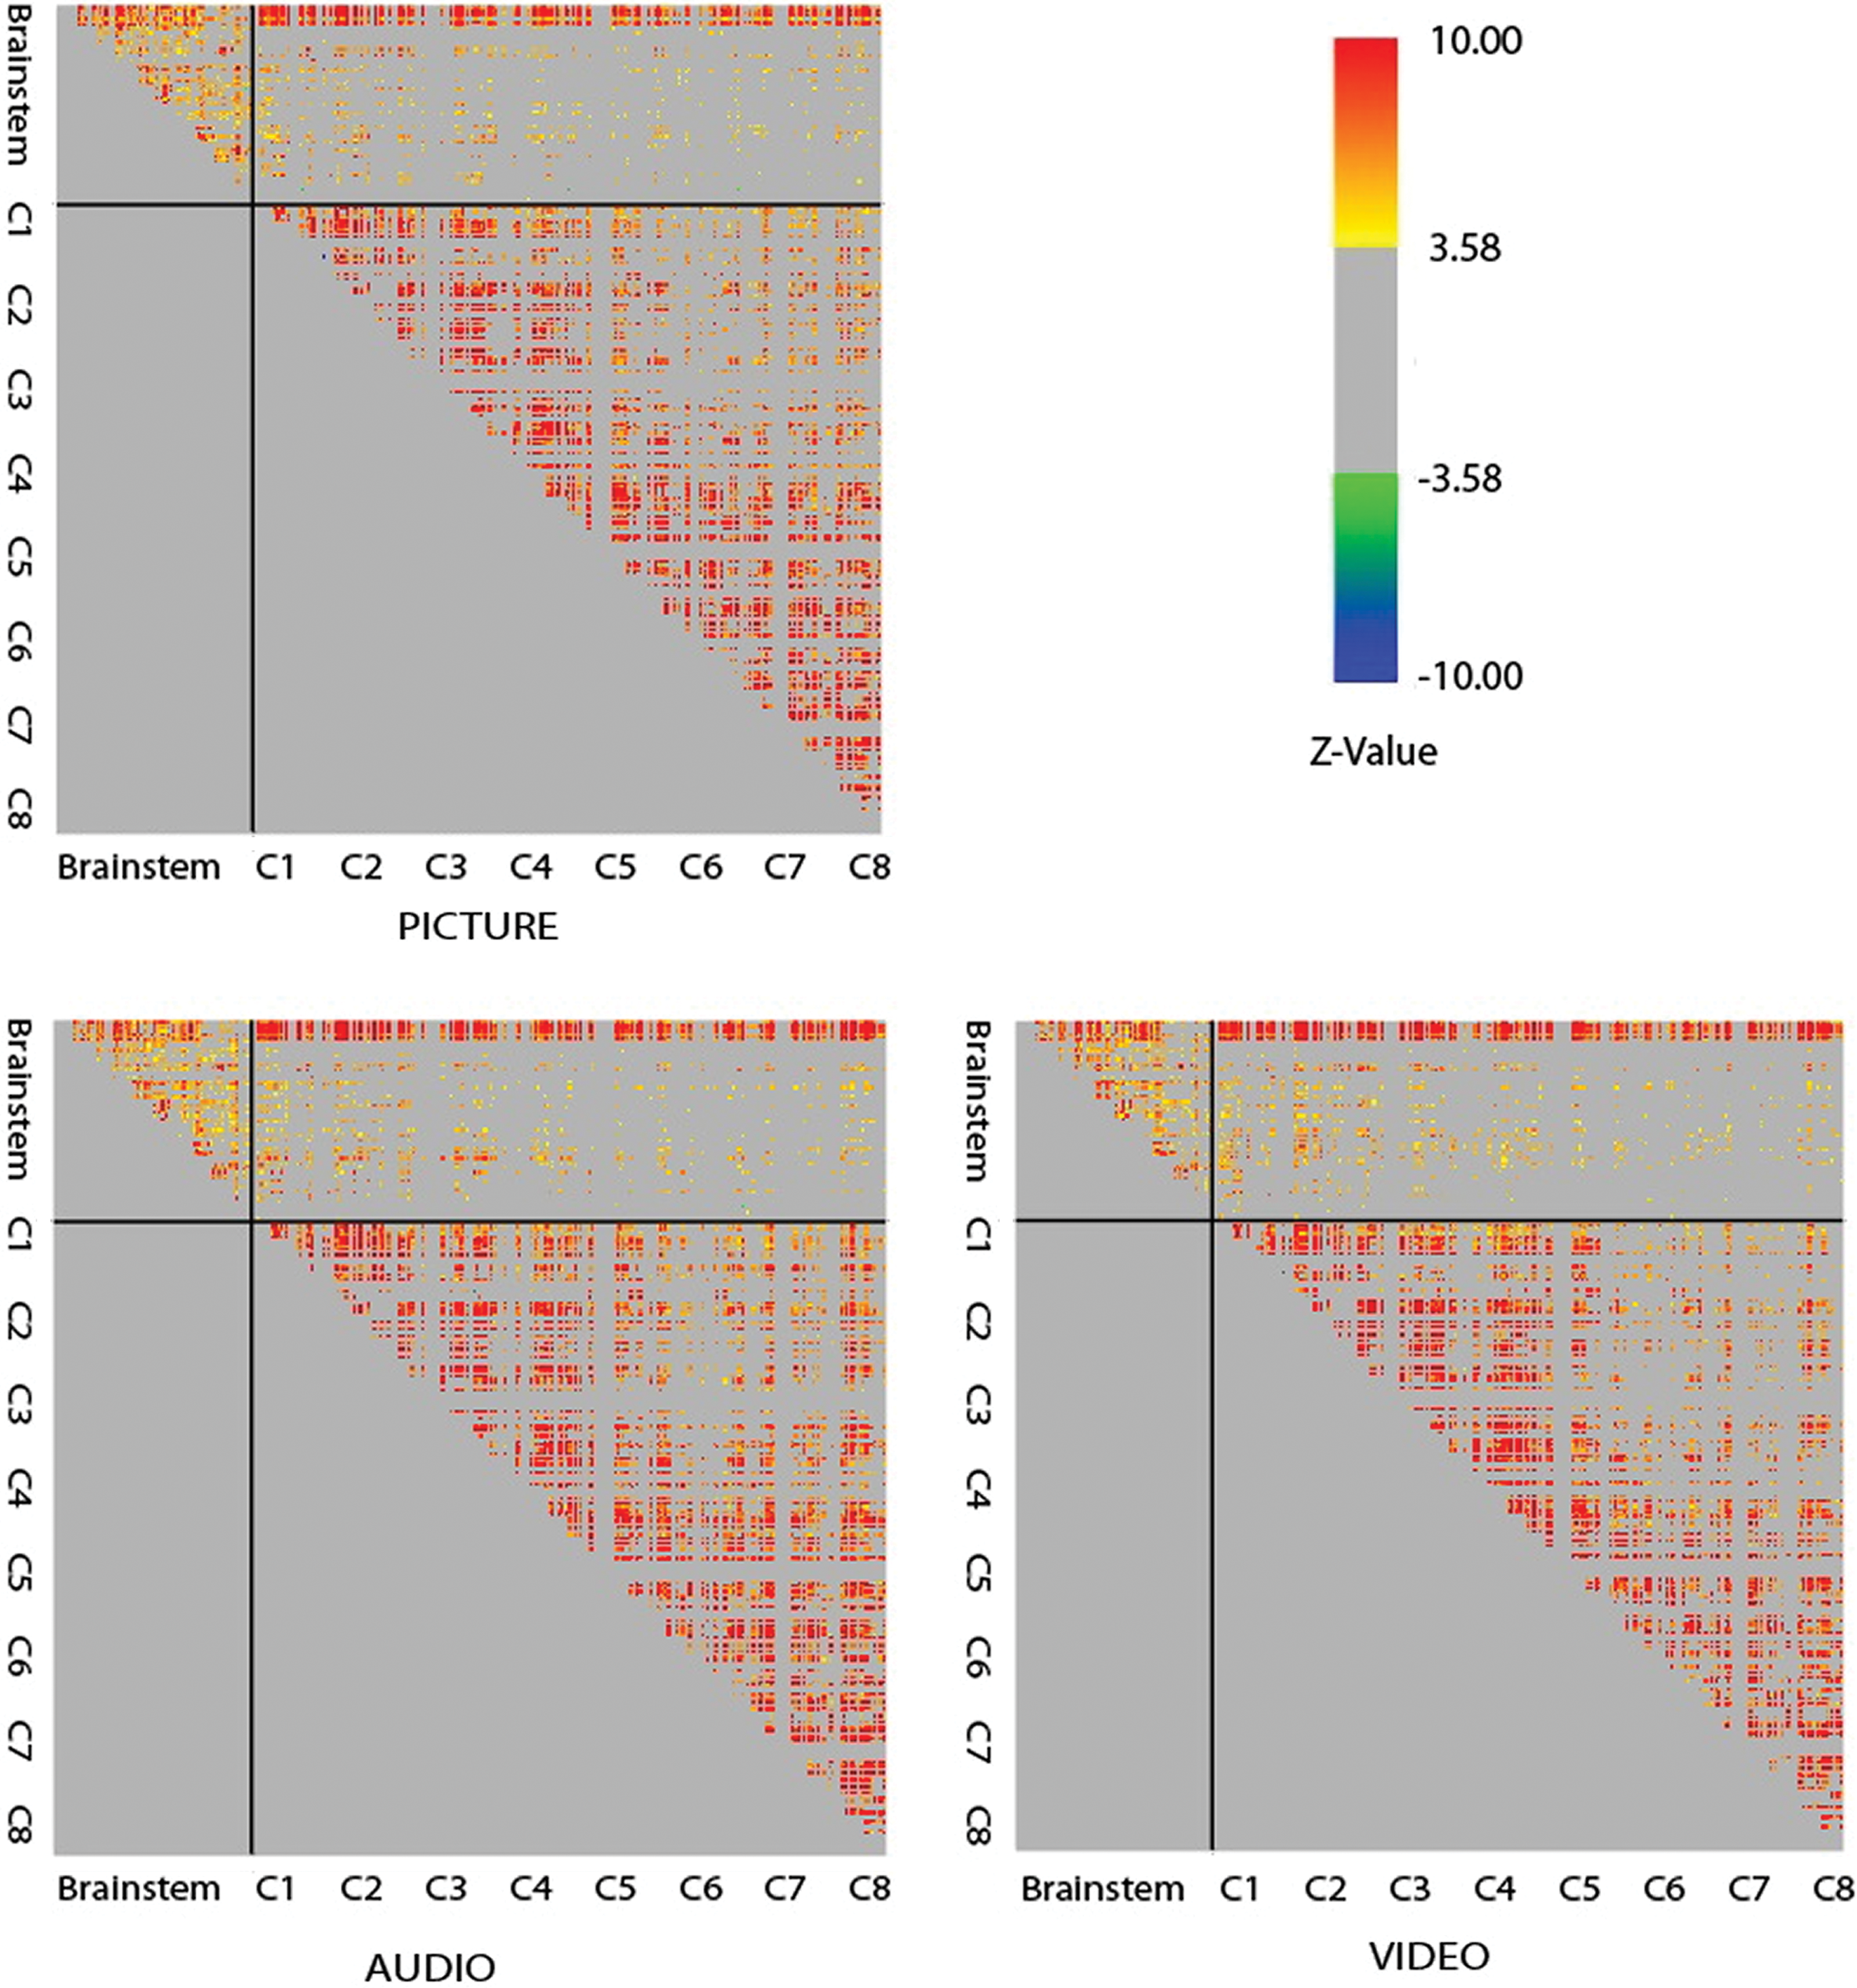
Grids of correlation values (shown here as Z-values) between all pairs of clusters across the BS and SC for Audio, Video, and Picture run types. Cluster pairs that are immediately adjacent are excluded, as are clusters that contain more than 25% of voxels adjacent to the CSF. Z-values are limited to |Z| > 3.58 (corresponding with a family-wise error corrected p-value of p fwe < 0.05). BS regions include (in order): thalamus, hypothalamus, NTS, PAG, LC, PBN, NRM, NGc, DRt, and PRF. Each SC segment includes all quadrants (RV, LV, RD, LD). Each of these regions is further divided into seven clusters based on the voxel time-course properties. One colored pixel in the grid therefore represents the correlation between one pair of clusters. Note that while the majority of correlations identified are positive, significant negative correlations are also present but may be more difficult to discern as represented here. BS, brainstem; CSF, cerebrospinal fluid; LV, left ventral; LD, left dorsal; PRF, pontine reticular formation; RD, right dorsal; RV, right ventral; SC, spinal cord. Color images are available online.
Summary of Similarities Between the Connectivity Networks Found in the Audio, Video, and Picture Run Types
Consistency was inferred when the average Z-value of a connection differed less than 0.5 of a pooled standard error of the mean between study groups (determined with a paired sample t-test, p fwe < 0.05).
Significant differences in connectivity between the Picture, Audio, and Video runs were also detected (Table 2), as determined by paired-sample t-tests. Connectivity between the LC and NRM and segments of the cord differed significantly between the Video and Picture groups. Connectivity between BS areas such as the hypothalamus, NRM, and NGc to cord segments differed significantly between the Audio and Picture groups. The NGc-mid cervical cord and PRF-upper cervical cord connections showed differences when comparing Audio to Video runs. Furthermore, significant differences in connectivity between segments of the cord also existed between all three run types as shown in Table 2.
Summary of Statistically Significant Differences in the Connectivity Networks Between Audio, Video, and Picture Stimuli, Using the Paired Sample t-test to Account for Individual Differences
All listed differences were determined to be significant at p fwe < 0.05 (determined with a paired sample t-test).
LC, locus coeruleus; LV, left ventral; LD, left dorsal; NGc, nucleus gigantocellularis; NRM, nucleus raphe magnus; PRF, pontine reticular formation; RV, right ventral; RD, right dorsal.
Structural equation modeling
The SEM analysis identified RSNs spanning across the BS and SC for the C5 and C6 SC regions that were tested for each of the three study conditions. The best-fit models for each of the Picture, Audio, and Video conditions are shown in Figure 3. A list of identified connections for each condition is available in Supplementary Tables S1, S2, S3. All three study conditions showed an extensive network of connectivity between BS areas and between the BS and C5 and C6 SC regions.
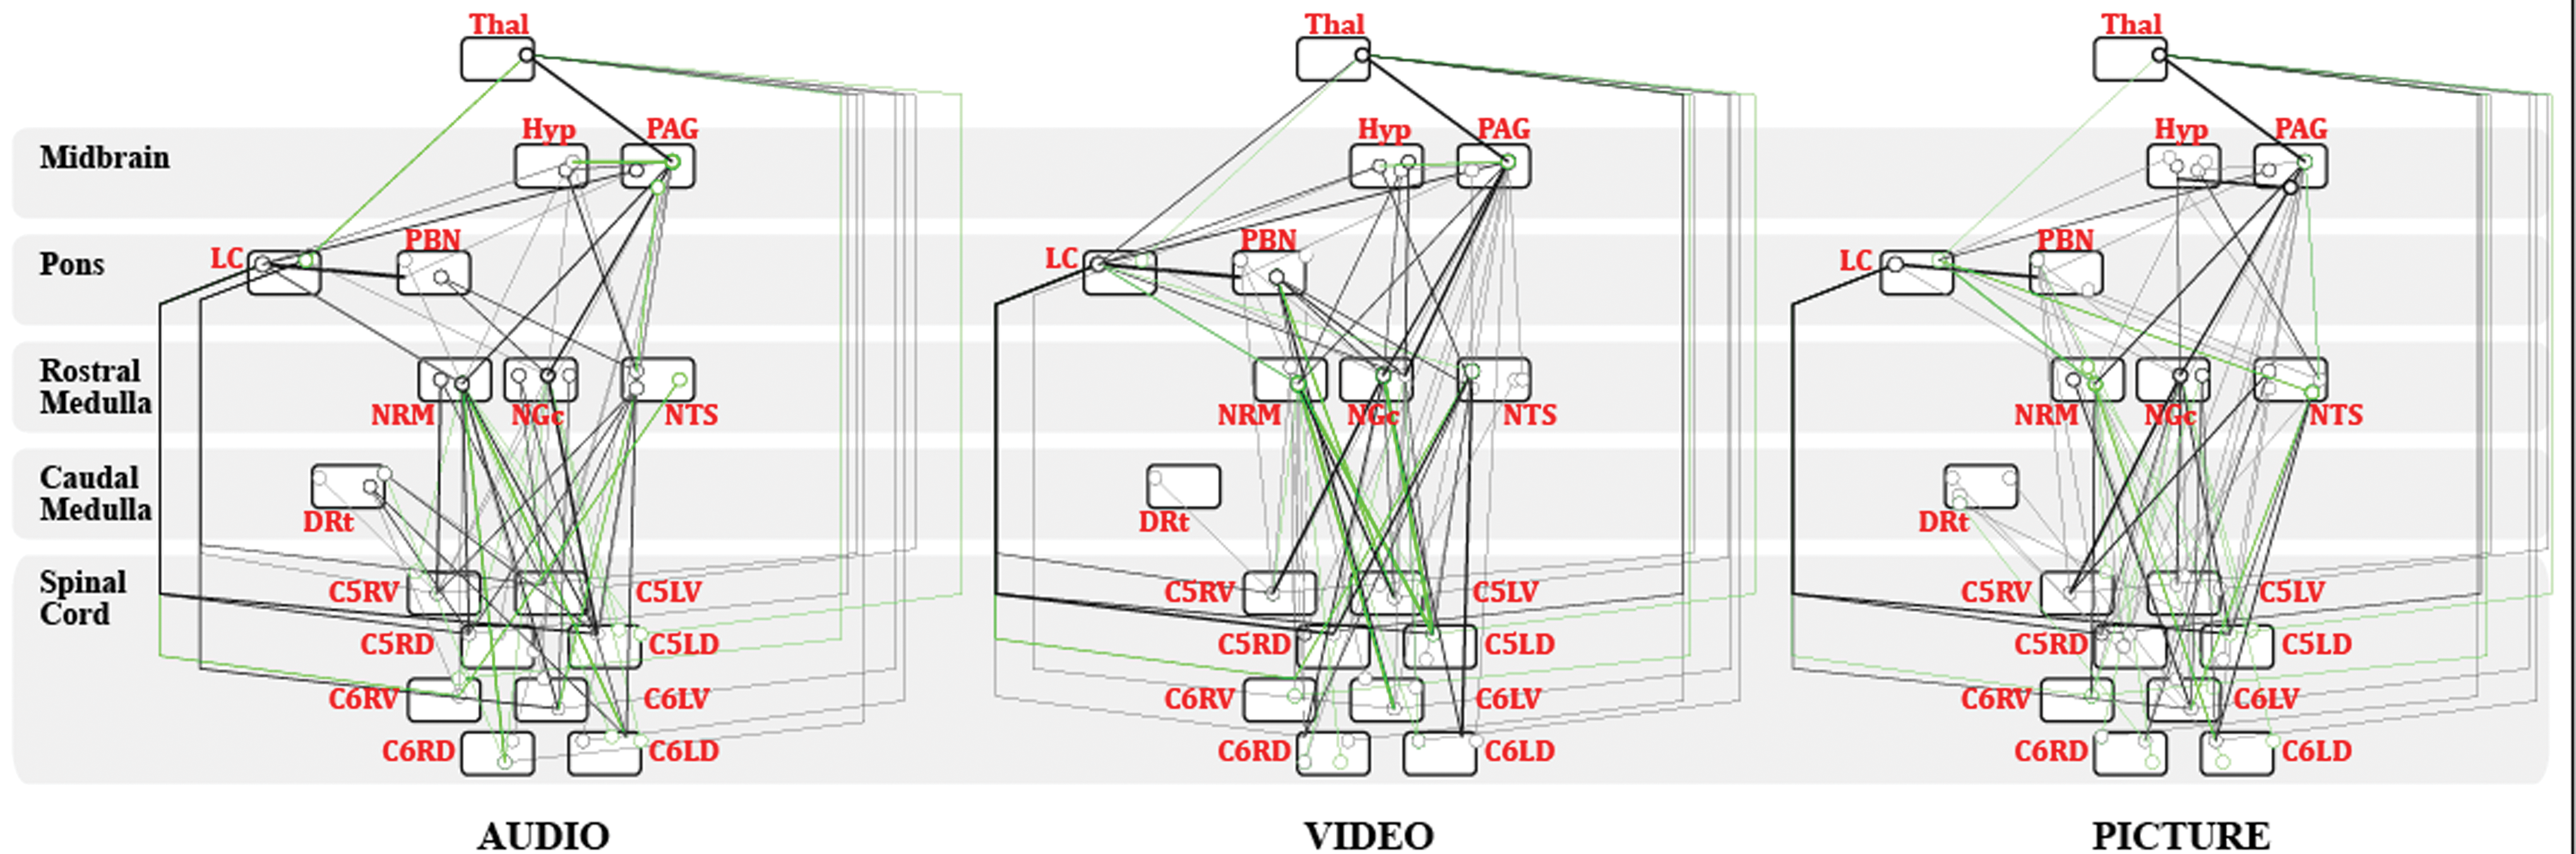
Identified networks in the Audio, Video, and Picture conditions at regional level (for each source region, the cluster with the highest Z-value was chosen). Network components were inferred to be significant at a family-wise error corrected p fwe < 0.05. Connections that accounted for less than 5% of the variance in the network component are not shown. Open circles represent the source region of the connection, while the line ending represents the target region. Solid lines indicate positive β-values, while dashed lines indicate negative β-values. Details of identified connections are available in Supplementary Tables S1, S2, S3. Source and target locations within a region bubble in the figure correspond to the anatomical location of the cluster within the region. Connections marked in green indicate significant differences in connectivity when comparing the resting-state (Picture) condition to the Audio and Video conditions, using a paired sample t-test with a significance threshold of p fwe < 0.05. Color images are available online.
Significant differences in connectivity across study conditions, as determined with SEM, are listed in Tables 3 –5, for connections that are significant in the Audio, Video, and Picture conditions, respectively. In each condition there are a number of significant connections identified that change significantly with the study conditions. The connections identified include a number of DRt, NTS, NRM, PBN, and LC to cord connections, and connections from the cord to the thalamus and the NRM, and the differences depend on which study conditions are being compared. In addition, a number of within-BS connections are identified as varying with the study conditions, including Hypothalamus to PAG and NGc, connections between the PAG and NTS, as well as NTS to LC, PAG to NRM, NTS to PBN, PBN to NGc, and LC to thalamus.
Significant Differences in the Structural Equation Modeling-Identified Network Connections for the Audio Condition Compared to the Video and Picture Conditions
All listed differences were determined to be significant at p fwe < 0.05 using a paired sample t-test. Bold β values indicate significant differences.
DRt, dorsal reticular nucleus of the medulla; NTS, nucleus tractus solitarius; PAG, periaqueductal gray matter; PBN, parabrachial nucleus.
Significant Differences in the Structural Equation Modeling-Identified Network Connections for the Video Condition Compared to the Audio and Picture Conditions
All listed differences were determined to be significant at p fwe < 0.05 using a paired sample t-test. Bold β values indicate significant differences.
Significant Differences in the Structural Equation Modeling-Identified Network Connections for the Picture Condition Compared to the Audio and Video Conditions
All listed differences were determined to be significant at p fwe < 0.05 using a paired sample t-test. Bold β-values indicate significant differences.
Discussion
Significant connectivity was detected between regions in the Picture condition (i.e., RS) and in the Audio and Video conditions (Fig. 3). Consistent with results from previous studies, a large number of cord to cord connections were detected in the RS (Barry et al., 2014; Bushnell et al., 2013; Harita and Stroman, 2017). The connections span a range of distances, and while the majority of the connections occurred between cord regions, there were a number of significant connections identified between BS regions and fewer connections identified between BS and cord regions (Fig. 3). Although the purpose of this study was to investigate whether RSNs were modified by listening to audio or watching video presentations, we also aimed to identify the consistent features across the networks. Out of the unique connections that were tested (23,770 in total, excluding edge regions), ∼38% of the connections had equivalent distributions across study groups. If only connections with average Z-values that are significantly different than zero are considered, then ∼40% of the connections had equivalent distributions (Table 1). Given that the data obtained under the different study conditions (Picture, Audio, and Video) were completely independent, the consistency of the connectivity distributions shows that the networks of connected regions are robust in the BS and SC.
The results of the cluster-cluster correlation analysis show predominantly cord-cord connections, and BS-BS connections, with a much smaller number of BS-cord connections. The steps taken to remove physiological noise and avoid edge clusters support the expectation that the results cannot be attributed to physiological noise. Moreover, the results show different features of connectivity across the BS/cord boundary. The observed cord-cord connections are also nonuniformly distributed, having clusters of connectivity within the upper cord segments (C1 to C3) and within the lower cord segments (C5 to C8). There are also a similar number of significant connections in upper and lower cord segments, even though the lower portions of the SC are subject to greater physiological noise (Figley and Stroman, 2007). The fact that we observed systematic variations in connectivity values, for specific connections, between the three study conditions further supports the conclusion that the connections are driven by BOLD signal variations.
This conclusion is further supported by the SEM analysis, in which networks of connectivity were identified for all three study conditions (Fig. 3). While cluster-to-cluster correlations showed sparse coordination between BS and cord regions, SEM analyses that allow for a combination of inputs to a given region show extensive connectivity between these regions. This result indicates that coordination of activity between BS and cord regions is complex and cannot be fully identified by means of correlations between pairs of regions. The networks identified with SEM are also demonstrated to be consistent across the three study conditions. This evidence again supports the conclusion that the observed networks are robust and are driven by BOLD signal variations.
Having established that coordinated networks exist and are robust across the BS and SC for the three study conditions, the results demonstrate that some specific connections were indeed altered by the Audio and Video presentations. Paired t-tests showed significant changes in connectivity values between specific regions in the cluster-to-cluster analysis (Table 2). Comparing the Audio and Video conditions, there were significant differences in connectivity between the NGc and mid-cervical cord segments and between the PRF and the cervical cord. With Video compared to Picture, there were significant differences in connectivity between both the LC and NRM and cord regions. With Audio compared to Picture the significant differences were between cord regions and each of the hypothalamus, NRM, and NGc. In addition, in every comparison there were differences in connectivity between a small number of SC regions. The SEM networks identified in the three conditions demonstrated that multiple cord→Thalamus connections were involved in all differences between conditions (Tables 3 –5). The results also show that there is significant signaling from the SC to the thalamus and from BS areas to the cord during RS and that this signaling is significantly different when participants are paying attention to Audio or Video presentations.
The thalamus contributes to a number of functions such as autonomic regulation of sensory and pain function. It is therefore possible that some of these differences are due, in part, to a more synchronized maintenance of muscle tone and eye position across participants while watching the same engaging video or listening to the same engaging music compared to simply viewing a static image. Past research has localized some sensory-motor functions, including eye movement and facial muscle tone to specific areas of the BS and SC in humans (Komisaruk et al., 2002). However, as participants are asked to lie still and relaxed, sensory and proprioceptive receptors are likely to adapt and provide little continuous input to the SC (Dubin and Patapoutian, 2010; Gonzales and Goble, 2014). Given that integration between BS areas and signaling from BS areas to the cord are also involved in these differences, it is more likely that they are related to autonomic regulation and are part of a larger network of integrated functions that maintain homeostasis (Craig, 2003; Critchley, 2009; Hugdahl, 1996). This conclusion is consistent with differences in participants' attentiveness across study conditions being linked to differences in connectivity, given that cognitive processes such as attention and motor control can influence autonomic activity (Hugdahl, 1996).
The results of this study also indicate that BS to cord signaling is significantly altered in Audio and Video presentations, with PBN→cord and NRM→cord connections being involved in differences between the Picture condition and Audio and Video conditions (but not in differences between Audio and Video conditions), the DRt→cord connection being involved in differences between the Video condition and Audio and Picture conditions, and NGc→cord and LC→cord connections being involved in differences between the Audio and Video and Picture conditions.
Differences in connectivity involving the DRt, NGc, and PBN during the Audio and Video presentations suggest the involvement of the ascending reticular activating system (ARAS). This system includes the thalamus, hypothalamus, NGc, PBN, and DRt, all of which were involved in specific differences between the three run types. Past research has found this network to be involved in the maintenance of consciousness, attention, and some abstract cognition (Edlow et al., 2012). A PET study found activity of the ARAS to be particularly strong when participants moved from a relaxed state to a task that demanded a high degree of attention (Kinomura et al., 1996). This is similar to how the present results show involvement of BS areas associated with the ARAS (specifically the DRt, NGc, and PBN) when comparing the more relaxed Picture presentation to that of the engaging Video or Audio presentations.
Limitations
While the results further confirm the presence of RSNs in the BS and SC and show that these can be influenced by a person's cognitive state, we selected the ROIs included in the SEM that are known to be involved with sensory and pain processing and autonomic regulation. This selection of regions does not include all of the anatomical regions that exist in the BS and SC. It is possible that additional regions which demonstrate RS BOLD signal variations were not identified by our analysis.
To achieve good spatial fidelity in BS and SC fMRI data, our methods have a minimum TR of 6.75 sec, which is longer than typical brain fMRI methods. RS fMRI analysis methods commonly use band-pass filters to keep only frequencies in the range of 0.01–0.1 Hz, and the aliasing in our data prevents us from removing frequencies higher than 0.074 Hz [the Nyquist frequency, 1/(2 × TR)] because they are aliased and appear as lower frequency signal variations. Our prior analysis of physiological noise contributions has shown that respiratory-related motion does not significantly affect our data acquired with a HASTE sequence and that our method for removing physiological noise is highly effective (Harita and Stroman, 2017). Thus, compared to a TR of 2–3 sec, as is more commonly used for brain fMRI, our TR of 6.75 sec is not expected to have significantly affected the sensitivity of our results. The more important effect of the TR in RS data is on the total number of volumes that are sampled to detect relationships between regions (Murphy et al., 2007).
Conclusions
A consistent RSN across the BS and SC has been identified in RS (i.e., Picture), Audio, and Video conditions. Moreover, significant differences in connectivity between the RS and Audio or Video presentations were also observed with both cluster-to-cluster analyses and SEM. While we cannot pinpoint why specific differences exist between study conditions, the agreement of these results with prior studies lends support to the conclusion that these observed RSNs may play a role in the integration of homeostatic autonomic functions and that connectivity within these networks is influenced by a person's cognitive/emotional state.
Footnotes
Acknowledgments
This work was supported by the Natural Sciences and Engineering Research Council (NSERC) of Canada. The authors also thank Don Brien for his help with acquiring the data.
Author Disclosure Statement
No competing financial interests exist.
Supplementary Material
Supplementary Table S1
Supplementary Table S2
Supplementary Table S3
References
Supplementary Material
Please find the following supplemental material available below.
For Open Access articles published under a Creative Commons License, all supplemental material carries the same license as the article it is associated with.
For non-Open Access articles published, all supplemental material carries a non-exclusive license, and permission requests for re-use of supplemental material or any part of supplemental material shall be sent directly to the copyright owner as specified in the copyright notice associated with the article.