
Abstract
Resting-state connectivity, for example, based on magnetoencephalography (MEG) or electroencephalography (EEG), is a widely used method for characterizing brain networks and a promising imaging biomarker. However, there is no established standard as to which method, modality, and analysis variant is preferable and there is only limited knowledge on the reproducibility, an important prerequisite for clinical application. We conducted an MEG-/high-density (hd)-EEG-study on 22 young healthy adults, who were measured twice in a scan/rescan design after 7 ± 2 days. Reliability of resting-state (15 min, eyes-closed) connectivity in source space was calculated via intraclass correlation coefficient (ICC) in classical frequency bands (delta-gamma). We investigated the reliability of two commonly used connectivity metrics, namely the imaginary part of coherency and the weighted phase-lag index and the influence of frequency band, vigilance, and the number of trials. We found a strong increase of reliability with more trials and relatively mild effects of vigilance. Reliability was excellent in the alpha band for MEG, as well as hd-EEG (ICC >0.85); in the theta band, reliability was good for MEG and poor for EEG. Other frequency bands showed lower reliability, with delta band being the worst. Furthermore, we investigated the spatial reliability of resting-state connectivity in a vertex-based approach, which reached fair to good reliability (ICC up to 0.67) with 5 min of data. Our results indicate that excellent reliability of global connectivity is achievable in alpha band, and vertex-based connectivity was still fair to good. Moreover, electrophysiological resting-state studies could benefit from more data than used previously. MEG and hd-EEG were similar in their overall performance but showed frequency band-specific differences.
Introduction
Analysis of functional brain connectivity is an increasingly used method in present neuroscientific research and the application of such methods as imaging biomarkers is attractive (Drysdale et al., 2017; Hohenfeld et al., 2018). To this end, it is important to understand the reliability over time (test/retest reliability) and the technical and methodological influencing factors.
Since functional connectivity is a measure of interaction of oscillatory signals, functional magnetic resonance imaging (fMRI) and magneto- or electroencephalography (MEG/EEG) are commonly used, however, studies analyzing reliability of resting-state connectivity typically focus on each single modality (Colclough et al., 2016; Hardmeier et al., 2014; Li et al., 2018). Recently, new EEG systems with a higher number and denser distribution (high density [hd]) of electrodes (256 instead of routinely used 20–32) are made available that have a comparable channel number and distribution to MEG-systems, making it possible to compare reliability between MEG- and hd-EEG-derived connectivity metrics head-to-head.
Although reliability can be analyzed with many different metrics, most studies on test/retest reliability used either the intraclass correlation coefficient (ICC) or nonparametric Spearman correlation. For the analysis of reliability, usually the values between 0 (indicating no reliability) and 1 (indicating complete reliability) are considered. Previous studies have already identified factors that influence the reliability of resting-state connectivity in MEG or EEG. This includes the following. (a) Type of measure: directed (e.g., Granger causality) or nondirected (e.g., coherency) metrics probe different aspects of functional connectivity and reliability differs among them (Bastos and Schoffelen, 2015). Spatial leakage artifacts and volume conduction can influence measures of functional connectivity and can, thus, artificially inflate reliability (Colclough et al., 2016; Holler et al., 2017a,b). Hence, metrics that are less susceptible to this phenomenon are recommended. In the present work, we focused on imaginary part of coherency (imCoh) (Nolte et al., 2004) and wPLI (Stam et al., 2007), both being rather insensitive to volume conduction/leakage. (b) Frequency band: connectivity in the alpha band was reported to be most reproducible, whereas reproducibility in gamma and delta band was reported to be lower (Deuker et al., 2009; Jin et al., 2011). (c) Measurement duration/data amount: the influence of the duration of measurement on reliability has been investigated in several fMRI studies (Noble et al., 2017; Tomasi et al., 2017) and reliability seems to increase logarithmically with longer scans (Andellini et al., 2015). To our knowledge, there has been so far no study that systematically evaluates the effect of data amount for MEG/EEG across multiple time intervals.
In the present study, we wanted to comprehensively assess how vigilance, data amount/number of trials, and the selection of frequency band influence reliability in resting-state MEG/EEG connectivity, as a prerequisite for clinical usage of resting-state connectivity based on these methods. Moreover, we wanted to compare EEG- and MEG-based analysis head-to-head.
Materials and Methods
Participants
Twenty-two healthy controls participated in this study after written informed consent. The study protocol was approved by the local ethics committee (University of Tubingen). Three subjects had to be excluded due to noise in the MEG data (n = 2, likely due to ferromagnetic dental material) and claustrophobia leading to a termination of the MRI scan (n = 1), leaving 19 healthy participants for the analysis (6 females, age 26.4 ± 2.8 years).
Data acquisition
All subjects were measured using a whole-head 275 channel MEG system (CTF, Inc., Vancouver, Canada) and 256 channel EEG system (GES400; EGI, Inc./Philips-Neuro, Eugene) for 15 min each. Both measurements were done sequentially on a single day in randomized order (10 subjects received MEG first, 9 subjects EEG first). Subjects were instructed to relax but not to fall asleep, not to think of anything specific, not to move, and to keep their eyes closed (“resting-state” paradigm). The experiment was repeated on a different day within an interval of 7 ± 2 days in a scan/rescan design. In total, the acquisition consisted of 38 data sets from 19 subjects with MEG and EEG each. Furthermore, a high-resolution (1 mm, isotropic) 3D T1-weighted and 3D FLAIR whole-head structural image was acquired for each participant, with a Siemens Magnetom Prisma 3T scanner (Siemens, AG, Erlangen, Germany) and a 64-channel head coil. The anatomical MRI was only acquired once for each subject.
Data preprocessing
The MEG/EEG processing was done using the Fieldtrip toolbox (Donders Institute, the Netherlands) (Oostenveld et al., 2011) and MATLAB version 9.0 R2016a (the MathWorks, Inc.). In the first step, MEG and EEG data were high-pass filtered at 1 Hz and low-pass filtered at 70 Hz (first-order Butterworth filter). To remove line noise, a band-stop filter was applied (using three harmonics at 50, 100, and 150 Hz). Data were then downsampled to 150 Hz and cut into 10-sec segments = “trials” (i.e., from 15-min continuous recording into 90 nonoverlapping trials). We chose to use the term “trial” for the data segments in this work. As in all resting-state studies, temporal synchrony of the data points in these trials cannot be assumed. All trials were visually inspected to identify and discard bad trials due to biological, for example, movement, muscle artifacts or excessive eye blinks, or technical artifacts, for example, sensor jumps, electrode artifacts. After rejecting trials, electrodes/sensors showing artifacts were removed, if needed. The visual review was done using the summary function of “ft_rejectvisual” and an additional visual inspection of all trials using a custom EEG/MEG viewer programmed in MATLAB. Finally, an independent component analysis was done (100 components) and components that were visually identified as cardiac (balistocardiogram/electrocardiogram) and eye blinks were rejected.
Vigilance scoring and final study population
Since we also wanted to study the influence of vigilance fluctuations on the reliability of the electrophysiological metrics, we performed another visual analysis of all trials (not rejected for technical reasons) according to the sleep stage scoring criteria of the American Academy of Sleep Medicine using the levels “wake,” “sleep stage 1,” “sleep stage 2,” “sleep stage 3,” and “REM.” For further analysis, we required at least 30 trials scored as “wake” in both sessions (scan and rescan). All subjects not meeting at least this number of trials in both sessions were excluded from further processing.
Anatomical processing
Each subject's anatomical volume was processed with the software package FreeSurfer v6.0.0, yielding, among others, cortical surfaces sampled at the pial and the gray/white interface. We used the “smoothwm” surface, that is, a slightly smoothed version of the surface at the gray/white interface as the main analysis space. The processed images and surfaces were then subjected to the software program SUMA with a mesh density factor (ld) of 10, yielding a cortical surface of 2004 vertices sampled from a common icosahedron for each hemisphere. The SUMA processing allows for cortical correspondence of each vertex between subjects using the curvature-based spherical mapping of FreeSurfer with the “fsaverage” subject as reference. In addition, the anatomical images (both T1 and FLAIR) were segmented into six tissue classes using SPM12s unified, multispectral segmentation (Lindig et al., 2018). Next, we used DARTEL normalization to generate a transformation from the individual to the MNI template space. Based on the FreeSurfer “fsaverage” subject (
Head model and lead field
The cortical surface (from FreeSurfer/SUMA) and the SPM segmentation were also used to build realistically shaped head models and derived lead fields for each subject. For MEG, the volume conduction model was obtained with the “singleshell” method (Nolte, 2003) using the individual cortical and subcortical surface. Alignment of the MEG sensor positions was achieved via the fiducial points marked in the individual MRI and three coils placed at these reference points during the MEG measurement. For EEG, we used a three-layer boundary element head model based on the SPM12 segmentation using the “dipoli” method implemented in Fieldtrip and standard conductance values of 0.33 (scalp), 0.0041 (skull), and 0.33 (brain). Canonical EEG sensor positions provided by the manufacturer were coarsely aligned using the fiducial points marked on the MRI (see Anatomical processing) and then projected on the individual scalp mesh using Fieldtrip functions. All head models/meshes and sensor/electrode positions were finally visualized in 3D and inspected for correctness.
Repeated random trial selection and calculation of connectivity and power
We randomly selected 5, 10, 15, 20, 25, or 30 trials (each 10-sec length) for each subject, each session (scan and rescan), and each modality (EEG and MEG) using two further options: either restricted to trials scored as “wake” only or without considering the vigilance level (“any”). This process was repeated 10 times for each session. Hence, we generated 10 sets of randomly chosen trials for each subject, each session, each modality, and each number of trials. We then used all possible permutations of these 10 sets per replicate to yield 100 (10 × 10) scan/rescan combinations. Thus, we could generate 100 replicates of the statistical metrics (see below for details on the metrics). This procedure can be seen as a bootstrapping approach (random sampling with replacement). Using this trial selection, we initiated an automated connectivity analysis, using an approach previously described by our group (Elshahabi et al., 2015; Li Hegner et al., 2018). In brief, we performed a spectral analysis in six predefined frequency bands (delta: 2 ± 2 Hz, theta: 6 ± 2 Hz, alpha: 10 ± 2 Hz, beta1: 16 ± 4 Hz, beta2: 25 ± 4 Hz, and gamma: 40 ± 5 Hz) using a multitaper fast Fourier time/frequency transformation approach with frequency-dependent, discrete, prolate spheroidal sequence tapers. Power and cross-spectral density matrices were computed and a frequency domain beamformer (dynamic imaging of coherent sources) was used to project the sensor-level data to the source space (2338 source space vertices = dipoles). This process also yielded power estimates at the source positions. Next, we calculated coherency (complex number, real and imaginary part) and the wPLI (Stam et al., 2007) with debiasing (Vinck et al., 2011) for each combination of source positions/vertices (2338 × 2338) averaged for all selected trials. For real (realCoh) and imCoh, we took the absolute values to yield undirected connectivity; wPLI is already absolute. However, due to the debiasing step (wPLI has positive bias), small negative values are possible. The 2D matrices (vertex × vertex) for imCoh, realCoh, and wPLI were then averaged for each vertex/source point individually, that is, all the links/connections to all other vertices were summed and divided by the number of vertices. In this way, we eventually obtained one value per vertex/source of (a) power, (b) realCoh, (c) imCoh, and (d) wPLI. imCoh and wPLI were our metrics of special interest since both are commonly used markers of neuronal connectivity.
Assessment of reliability and variability
To analyze the reliability of the four metrics, we calculated the ICC using the “1-1” variant (Shrout and Fleiss, 1979). The ICC is defined as an inter-rater agreement measure ranging from 0 to 1, where 1 indicates perfect agreement between the raters. In our case, each session (scan and rescan) is considered a rater. In the parametric implementation, it was defined as follows:
where Var raters = variance between the raters, that is, scans and rescan, Var subjects = variance between the subjects, k = number of raters (two in our case).
Although not part of the original definition, the ICC can become negative, if Var raters is greater than Var subjects signifying a very poor reliability. We regarded 0–0.4 as poor, 0.4–0.59 as fair, 0.6–0.74 as good, 0.75–1 as excellent agreement, according to proposed guidelines (Cicchetti, 1994).
We performed the calculations on two different levels: Global level: a mean value (across all subject vertices) was generated for scan and rescan and one ICC was calculated. Vertex-wise: ICCs were calculated for each vertex separately. ICC values were (i) displayed per vertex and (ii) averaged across vertices to yield one global value.
The global level can be seen as an overview metric without spatial information. As long as the global network state is the same, the spatial distribution of the connectivity/power metric does not matter. On the vertex level, the anatomical position is also relevant. Hence, this metric is expected to convey a combination of global and spatial information. We can expect that vertex-wise ICCs will be lower than ICCs on the global level since they include an additional source of variation.
Since the ICC is a relative measure based on the ratio of between-subject and between-measurement variance, it can be influenced by differences in both domains. To further scrutinize the influence of between-subject and between-session variability, we additionally calculated the between-subject standard deviation (StdDsubjects) and the between-session standard deviation (StdDsessions) on the global level. Using all metrics (ICC gobal/vertex, StdDsubjects, and StdDsessions), we aimed to further quantify the performance of the connectivity measures. An ideal biomarker should be able to differentiate subjects/conditions and, at the same time, be reproducible and stable.
Statistical analysis
Finally, we assessed the effect of the main analysis factors (number of trials, vigilance, and frequency band) and the difference between connectivity metrics (imCoh and wPLI), as well as the modality (EEG vs. MEG), on the reliability as measured by the global ICC. First, we analyzed the equality of variance distributions between the different groups using Levene's tests. Since this indicated nonequal variances between several groups, we performed a series of nonparametric Kruskal–Wallis tests for each group comparison. To correct for multiple comparison, the p-value was multiplied by the total number of tests (N = 125) and considered significant if below 0.05 (Bonferroni correction). For factors with more than two levels (number of trials, frequency bands), we performed post hoc multiple comparison tests, again applying Bonferroni correction, to differentiate the effects of the levels against each other. Statistical analysis was also done in MATLAB using the Statistics toolbox.
Results
Subjects and vigilance
After artifact rejection, we had 57.8 ± 9.0 trials available for MEG and 77.8 ± 8.4 for EEG. On average, 40.8 ± 17.3 MEG trials were scored as “wake,” 17.0 ± 16.2 trials were scored as “sleep1,” and no trials as deeper sleep or REM. For EEG, 59.2 ± 23.5 trials were marked as “wake,” 17.8 ± 20.7 as “sleep1,” 0.8 ± 2.7 as “sleep2,” and no trials as “sleep3” or REM. Fourteen subjects had at least 30 “wake” trials for both sessions available in MEG, and 12 subjects fulfilled this predefined criterion in the EEG stream. To allow full comparability between modalities, two subjects were randomly removed from the MEG analysis, leaving 12 subjects each for further analysis. If we had chosen 20 “wake” trials as a cutoff, 16 or 17 subjects would have been available for MEG and EEG, respectively. With a 10-trial cutoff, all subjects would have passed for both modalities.
Global reliability
The global ICCs of imCoh were excellent (ICC = 0.95, 30 trials) for EEG data in the alpha band as well as for MEG data (ICC = 0.87, 30 trials). For wPLI, the ICCs at these conditions were similar (ICC = 0.91 and 0.83, EEG and MEG data, respectively). ICCs generally declined with lower number of trials and were only good to fair (ICC = 0.64 and 0.56, EEG and MEG) for imCoh and fair for wPLI (ICC = 0.48 and 0.31) for five trials. Power showed excellent agreement (all ICCs >0.8, most >0.9) in all frequency bands for EEG data, and as well as good to excellent agreement (ICC = 0.64–0.94) for MEG data. Slightly lower ICCs were found for realCoh in comparison with power, but these were still excellent (ICC >0.8) for EEG data and poor to fair (ICC = 0.39–0.74) for MEG data.
Details of ICCs for all frequency bands and number of trials are shown in Table 1 (imCoh and wPLI) and Supplementary Table S1 (for all metrics). Overview plots of the global ICCs are shown in Figure 1 for EEG data and Figure 2 for MEG data (Table 2).
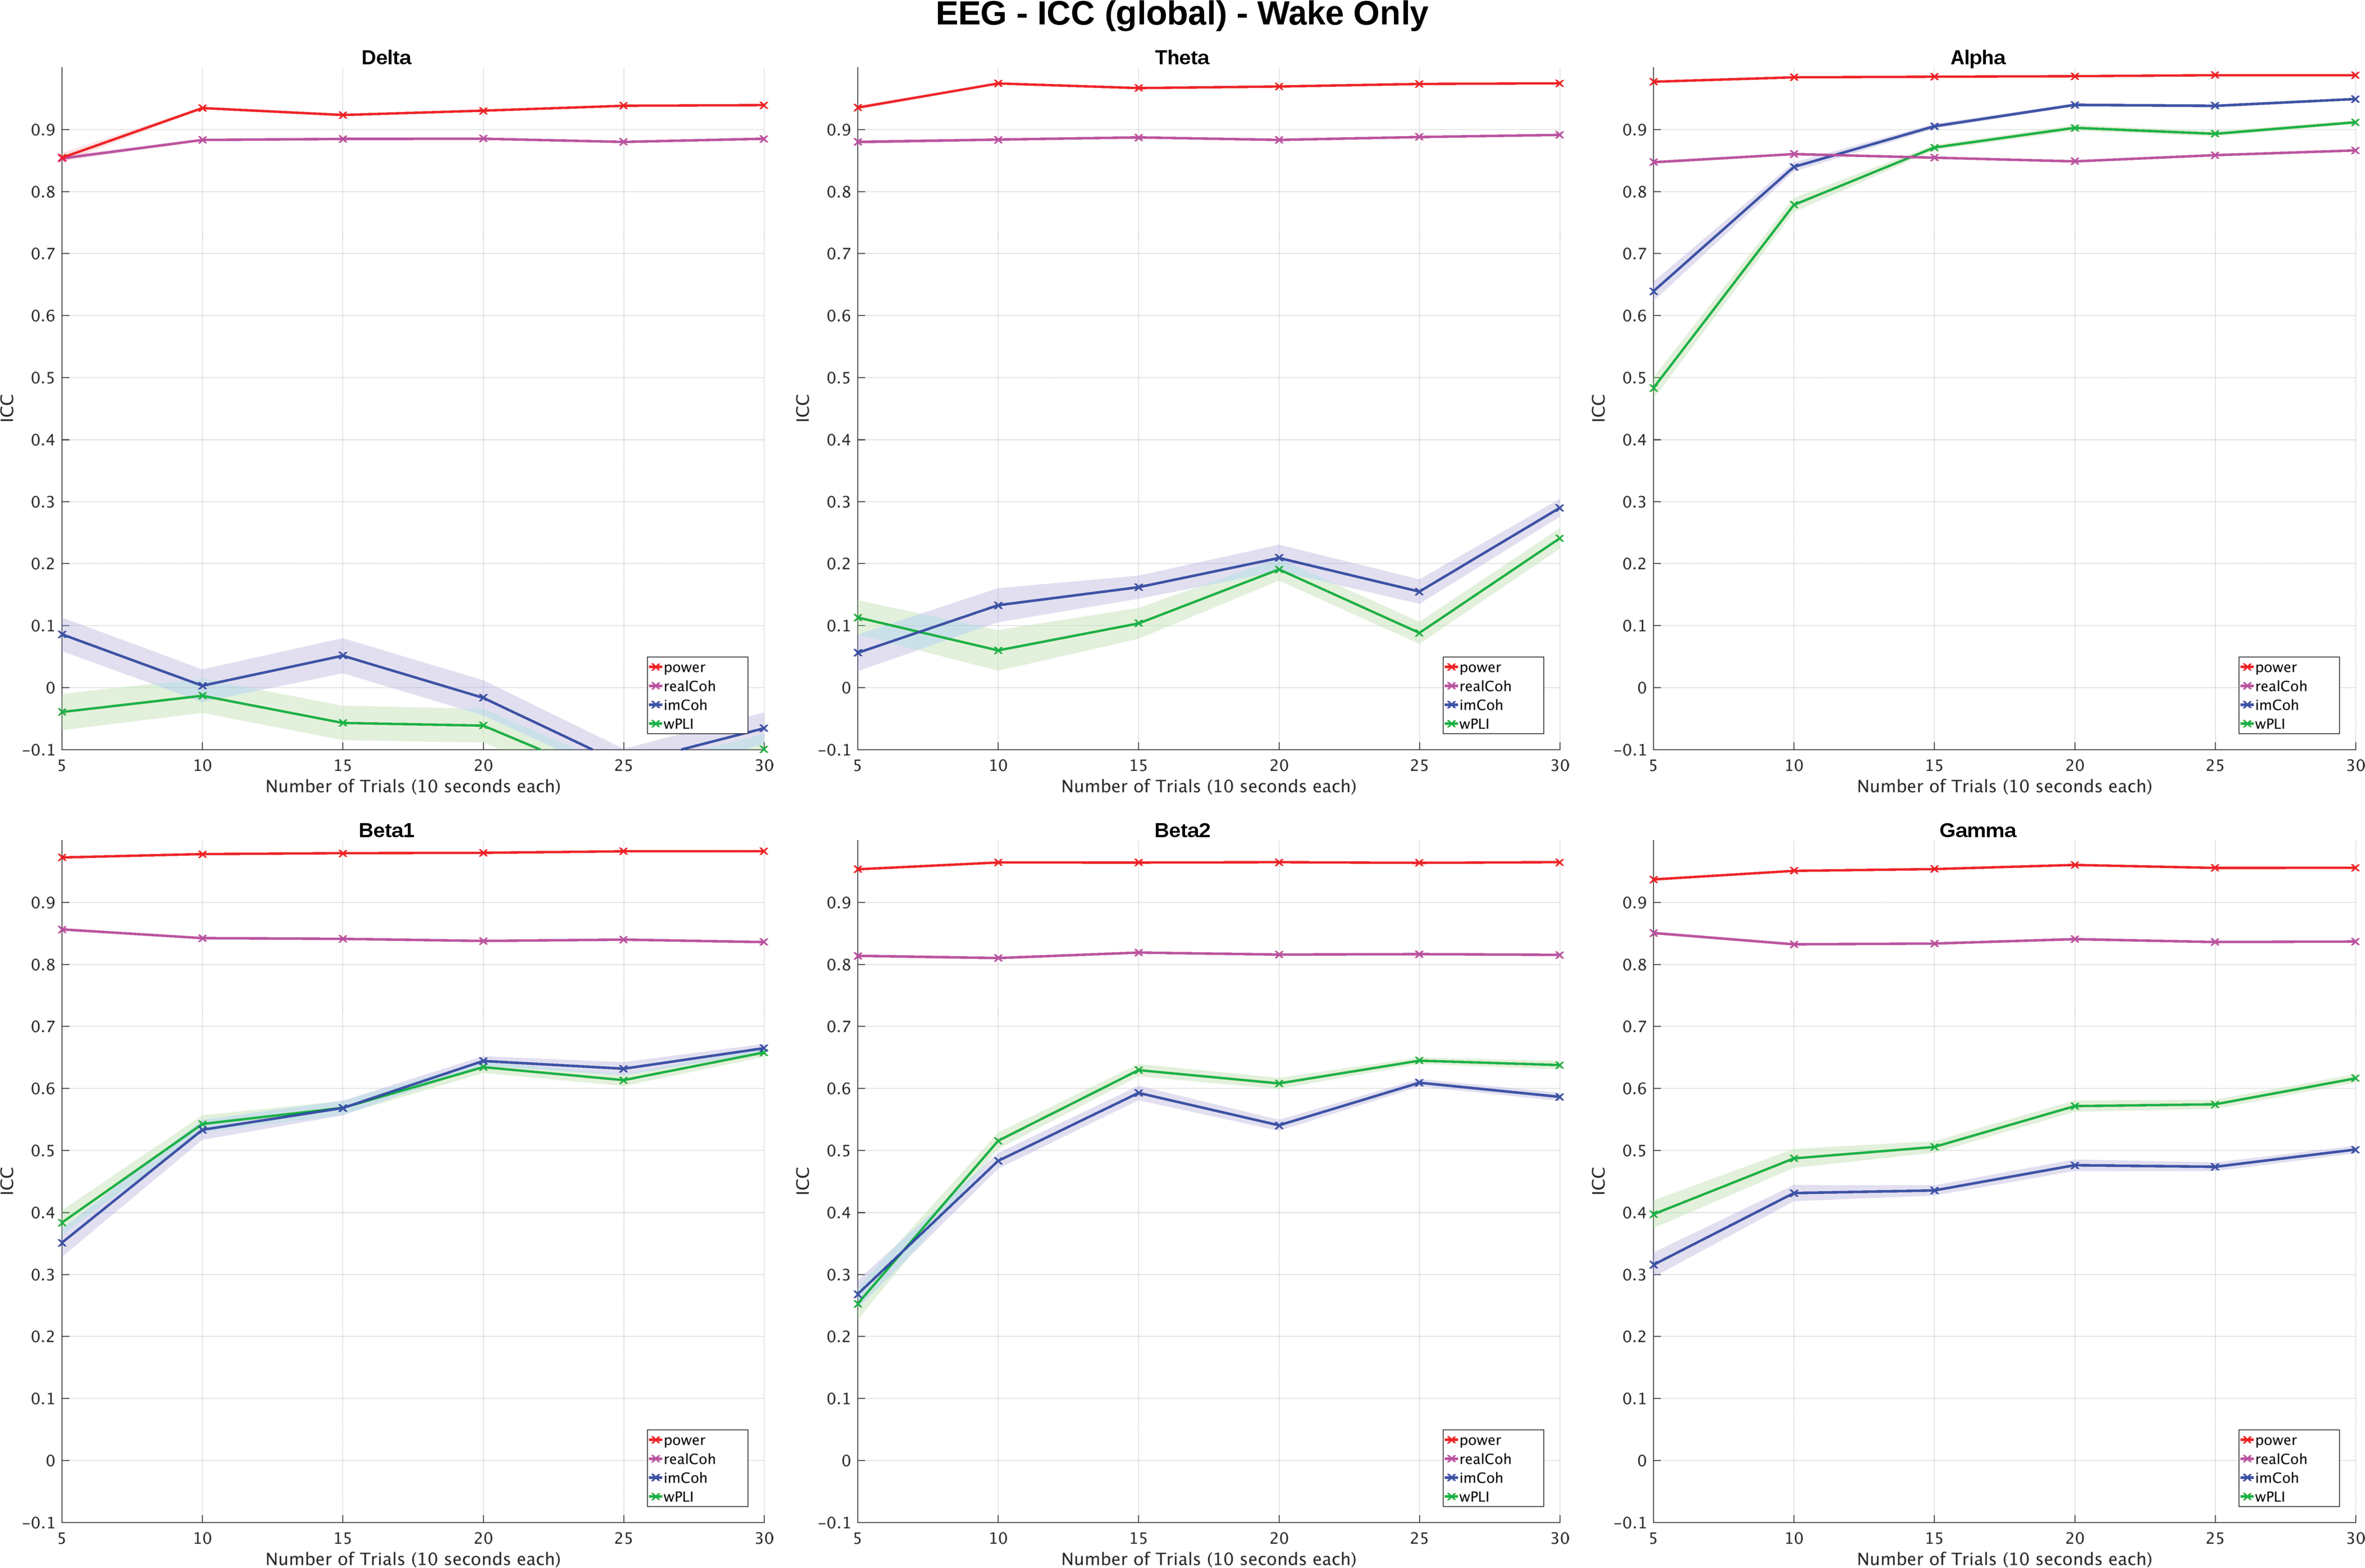
EEG global ICC (wake-only condition). Global ICCs based on the EEG experiment are plotted for each metric (color), frequency band, and number of trials for the “wake-only” condition (shaded area = standard error of the mean). In the delta band, reliability was extremely low and in the theta band also poor for the metrics of special interest (imCoh and wPLI). In gamma, beta1 and beta2 band agreement was poor to good and in the alpha band fair to excellent. Note the clearly increasing ICCs (exception delta band) with number of trials for imCoh and wPLI. Power and realCoh had excellent agreement largely independent of the number of trials studied here. wPLI and imCoh had similar ICCs with imCoh>wPLI in alpha and theta bands and wPLI>imCoh in beta2 and gamma. ICCs of realCoh were always lower than power. EEG, electroencephalography; ICC, intraclass correlation coefficient; imCoh, imaginary part of coherency; wPLI, weighted phase-lag index. Color images are available online.
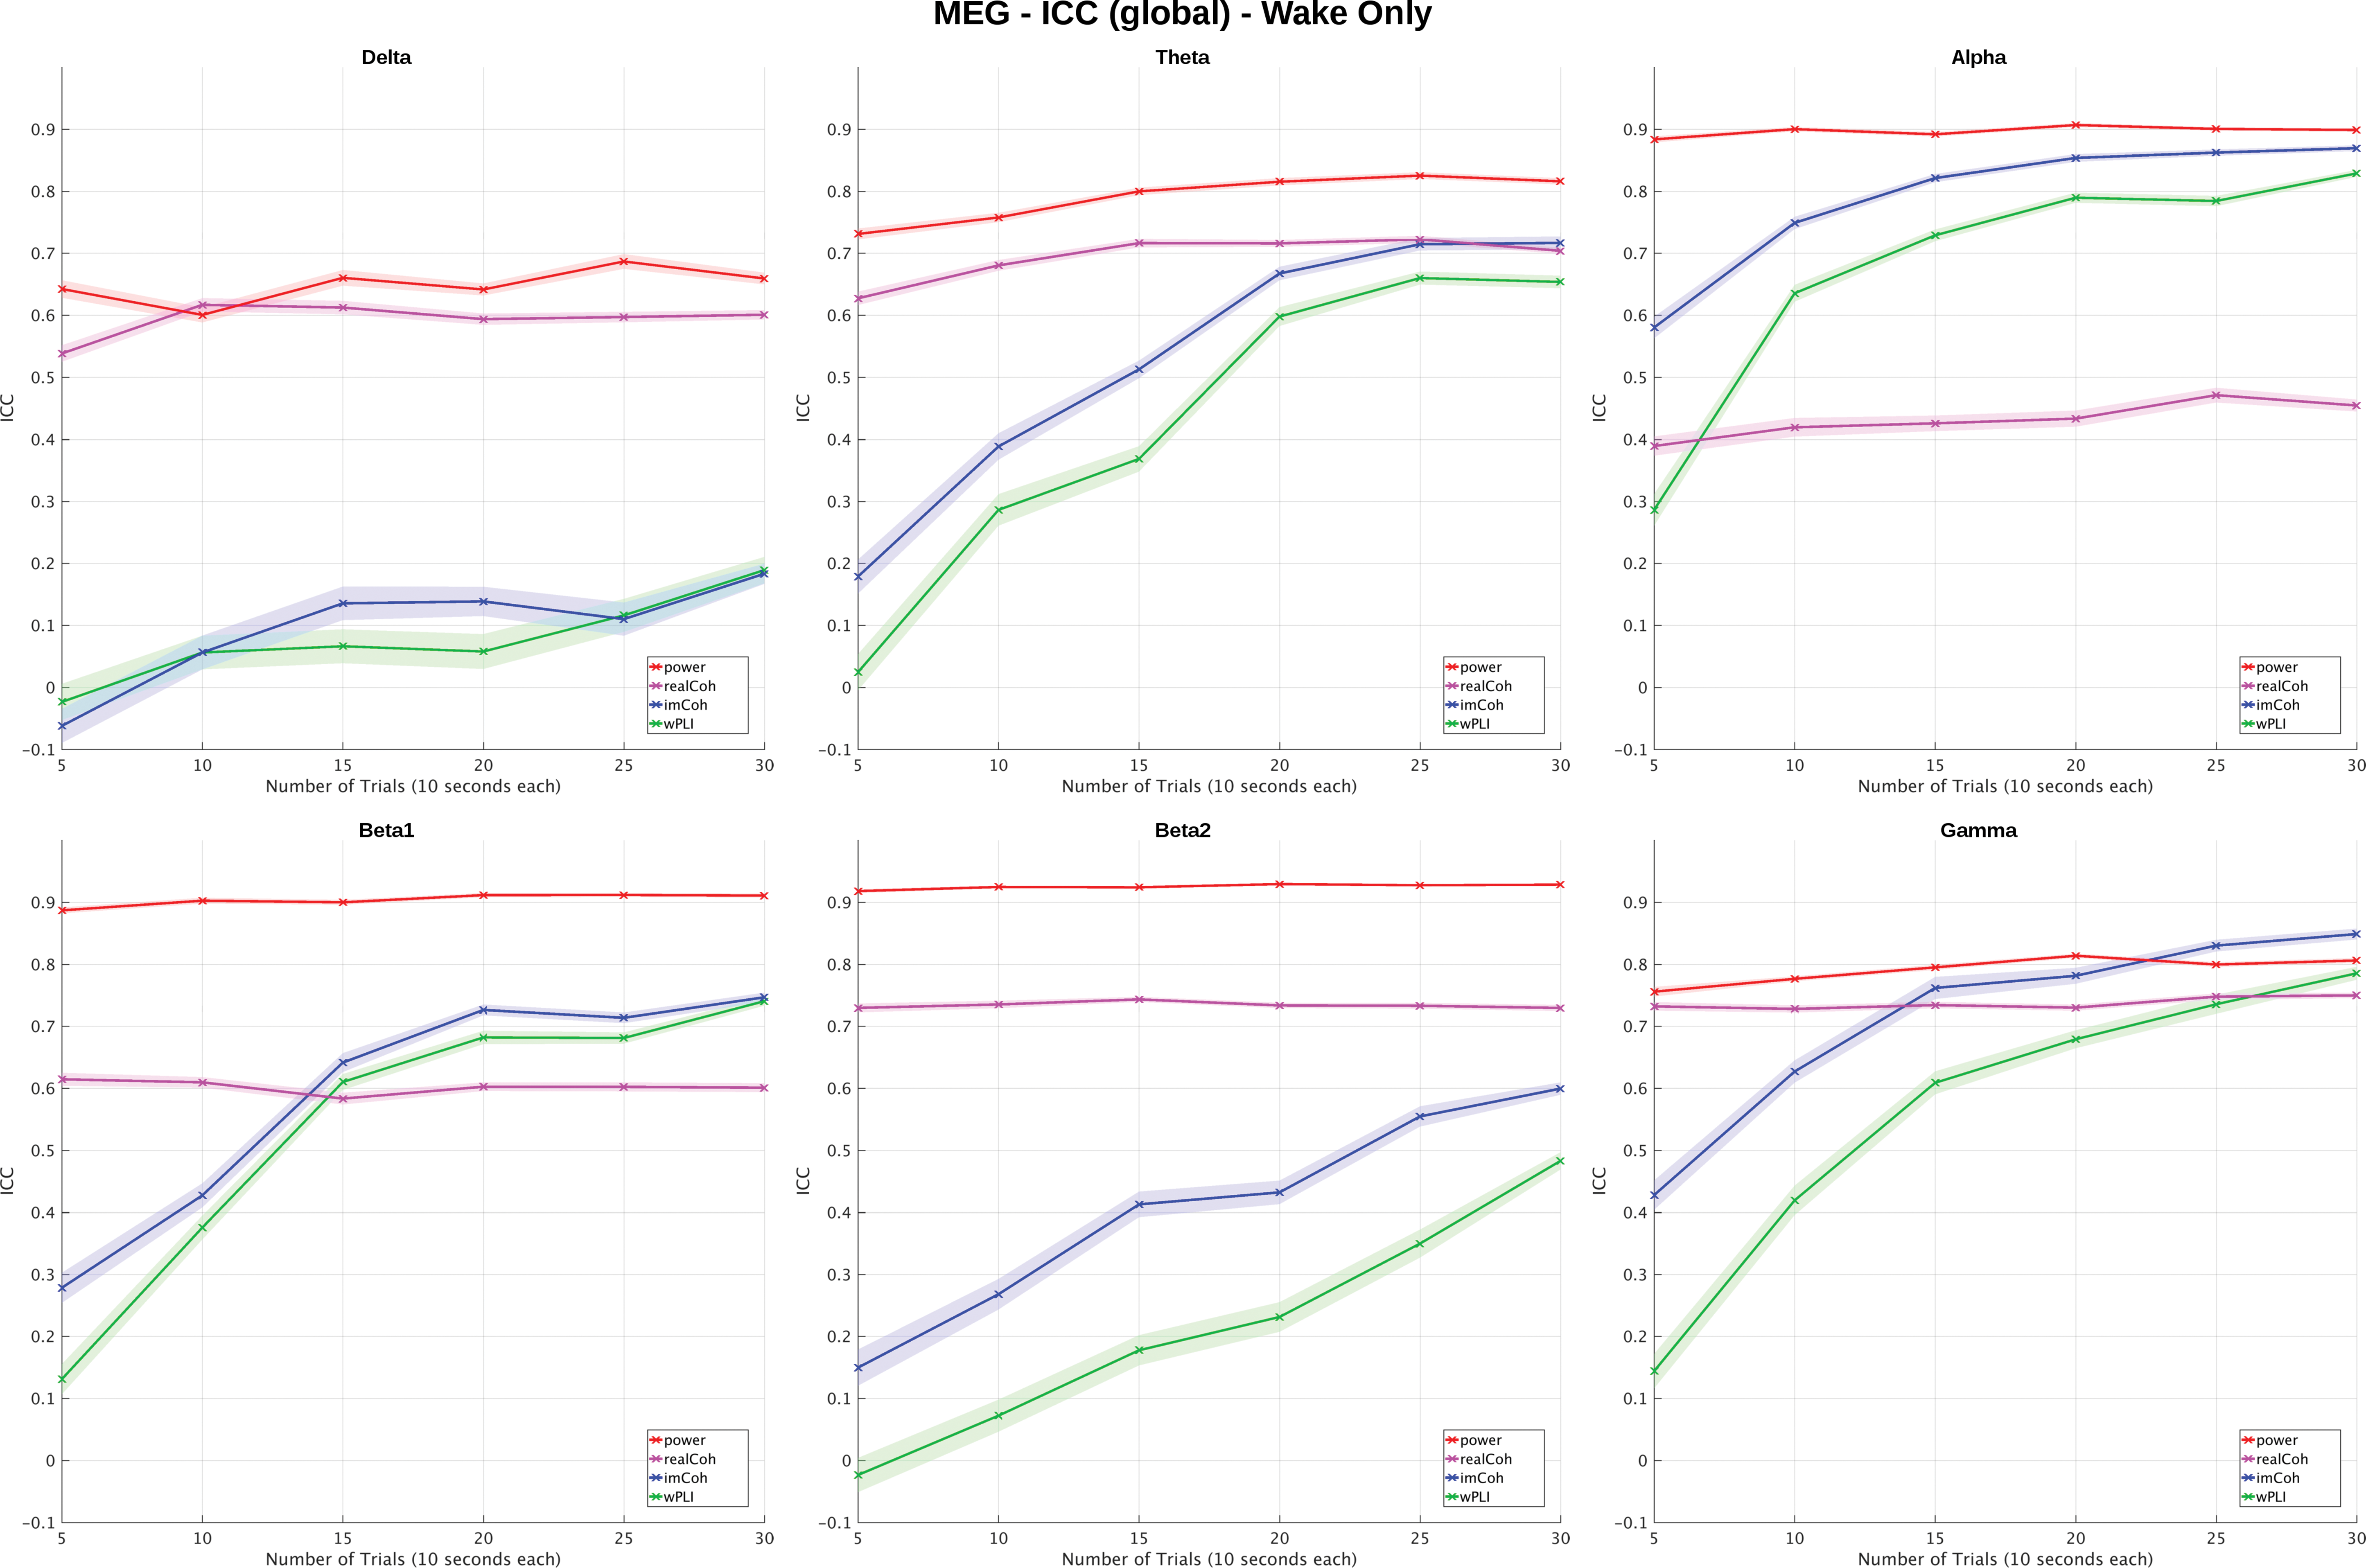
MEG global ICC (wake-only condition). Global ICCs based on the MEG experiment are plotted for each metric (color), frequency band, and number of trials for the “wake-only” condition (shaded area = standard error of the mean). Delta band reliability was poor and in the theta band poor to good for the metrics of special interest (imCoh and wPLI). In gamma, beta1 and beta2 band agreement was distributed across a wide range from poor to excellent and fair to excellent in the alpha band. Note the clearly increasing ICCs with number of trials for imCoh and wPLI. Power had good to excellent and realCoh good agreement, with the exception of alpha, where it was fairly largely independent of the number of trials studied here. wPLI showed almost always lower ICCs than imCoh, and realCoh lower than power. MEG, magnetoencephalography. Color images are available online.
ICC Metrics for EEG
This table summarizes the EEG-based mean intraclass correlation (ICC) over 100 random permutations and the 95% confidence intervals (in brackets) for each frequency band and the different numbers of trials. The values are based on the “wake only” epochs. ICC (global) is the global average for each subject, ICC (vertex) the ICC calculated for each vertex. Results for “any” vigilance epochs and the detailed ICCs for power and coherency (real part) are available in the supplement.
EEG, electroencephalography; ICC, intraclass correlation coefficient; wPLI, weighted phase-lag index.
ICC Metrics for MEG
This table summarizes the MEG-based mean intraclass correlation (ICC) over 100 random permutations and the 95% confidence intervals (in brackets) for each frequency band and the different numbers of trials. The values are based on the “wake only” epochs. ICC (global) is the global average for each subject, ICC (vertex) the ICC calculated for each vertex. Results for “any” vigilance epochs and the detailed ICCs for power and coherency (real part) are available in the supplement.
MEG, magnetoencephalography.
In the analysis of StdDsession, we could clearly confirm decreasing between-session variability for imCoh and wPLI with more trials for both EEG and MEG (Supplementary Figs. S1 and S3). StdDsubject was less influenced by the number of trials in most frequency bands and even slightly increasing between-subject variability for imCoh in the alpha to gamma bands (Supplementary Figs. S2 and S4). When comparing StdDsession and StdDsubject directly (Supplementary Table S4), StdDsubject was higher than StdDsession throughout, but the ratio StdDsession/StdDsubject decreased for more trials in most frequency bands and both metrics.
Analysis of influencing factors and group comparisons
A detailed overview of influencing factors is shown in Table 3, the differences between imCoh and wPLI in Table 4. The strong positive effect of number of trials on ICC was confirmed performing Kruskal–Wallis tests for all frequency bands (all p < 0.001), with the exception of the delta band, where ICCs were even declining with more trials in EEG. In the detailed analysis of different factors, there were significantly higher ICCs for all increases of 10 trials or more (all p < 0.001) when comparing across all frequencies and all modality levels (Supplementary Tables S2 and S3). The increase from 25 to 30 trials did not show a significant difference in ICC (p > 0.5).
Influence of Factors on Global Intraclass Correlation Coefficient
This table summarizes the results of multiple Kruskal–Wallis tests to assess the effect of modality (EEG vs. MEG), vigilance level (wake vs. any), the number of 10s trials and frequency bands on the global ICC values, where higher ICC indicates better reproducibility. The p-value is Bonferroni corrected for the total number of tests (N = 125) and considered significant if below 0.05 (*). In case of a two-group comparison, the direction of the difference between factor levels shown is indicated with “<” or “>,” in case of no significant difference “∼” is shown. For the analysis of number of trials and frequency (with six levels each), only the main effect of the factor is listed.
Comparison of Reliability of Functional Connectivity Metrics
This table shows the results of multiple Kruskal-Wallis tests to assess if coherency (imaginary part, imCoh) or wPLI (debiased) have different reliability as measured by intraclass correlation (ICC). For MEG, imCoh was always better than wPLI. For EEG, the difference was frequency specific with imCoh being better for alpha and delta band and wPLI better for beta and gamma band.
imCoh, imaginary part of coherency.
The factor frequency band also had a highly significant impact on ICC (p < 0.001), with ICCs in the alpha band being significantly higher than for all other frequency bands (all p < 0.001) in EEG, MEG, and the combined analysis both for imCoh and wPLI. A complete comparison of all frequency band differences is also shown in Supplementary Tables S2 and S3.
Restricting the trial selection to wake-only trials had no significant overall effect (p > 0.5). In specific frequency band/modality combinations, effects with different directionality could be found. In EEG, wake-only trials showed higher ICCs in the alpha band for imCoh (p = 0.006) and wPLI (p < 0.001), whereas there was no significant effect in MEG (both p > 0.5). In some frequency bands, there were even higher ICCs when not considering the vigilance, for example, beta2 for MEG (p < 0.001, both imCoh and wPLI), whereas EEG had higher ICC for wake-only trials (p < 0.0001 in imCoh).
When comparing the two modalities (EEG and MEG) directly, ICCs in imCoh were higher for MEG data than for EEG data across all frequency bands (p < 0.001); no global differences for wPLI (p > 0.5) were found. When comparing ICCs for the frequency bands separately, EEG was significantly better in alpha (p < 0.001 for both imCoh and wPLI) and in beta2 band for wPLI (p < 0.001). MEG was better in delta, theta, and gamma bands (both imCoh and wPLI) and beta1 band for wPLI (all p < 0.001).
In the comparison of imCoh and wPLI with each other, imCoh had significantly higher ICCs across all frequency bands and modalities (p < 0.001). For EEG data alone, this was not significant on the global level (p > 0.5) with a differential pattern between the frequency bands: in alpha and delta bands, imCoh was better, and in beta2 and gamma bands, wPLI was better (p < 0.001 for all) and not significantly different for theta and beta1 bands (p > 0.5). For MEG data alone, imCoh was always better than wPLI (p = 0.014 for delta, p < 0.001 for all other bands).
Vertex-wise ICC analysis
As expected, vertex-wise ICCs were lower throughout in comparison with the global ICCs (compare Table 1 and Supplementary Table S1). For power, these were still good to excellent (>0.8) and for real coherency, these were fair to good (0.5–0.7); in both cases, without strong differences between frequency bands and only mild effects of the number of trials. The metrics of special interest (imCoh and wPLI) generally showed the same pattern as global ICCs in terms of the increase with trial number and differences between frequencies. Maximal vertex-based ICCs were found for the alpha band with ICCs reaching 0.67 (95% confidence interval: 0.61–0.71) for EEG/imCoh, 0.62 (0.55–0.67) for MEG/imCoh, 0.63 (0.57–0.67) for EEG/wPLI, and 0.58 (0.52–0.63) for MEG/wPLI in the wake-only condition and 30 trials. These fulfilled the criteria for fair up to good agreement. With lower number of trials (5 trials = 50 sec of data), these were markedly lower: 0.31 (0.17–0.43) for EEG/imCoh, 0.17 (0.08–0.28) for MEG/imCoh, 0.19 (0.07–0.31) for EEG/wPLI, and 0.10 (0.001–0.17) for MEG/wPLI, respectively, which would be poor agreement.
When visualizing the ICCs as a parametric map for the different number of trials, the increase of ICC with higher number of trials was also evident. In addition, these maps show that ICCs are not homogeneously distributed. For imCoh and wPLI, there were lower ICCs for the alpha band in areas typical for the “default mode” networks (precuneus, temporoparietal junction/angular gyrus, mesial frontal areas) and also differences between the modalities. Interestingly, the topography of wPLI and imCoh ICC maps within the modalities was very similar (compare Figural Supplement section). For other frequency bands, the topography was different; for example, for beta2 and gamma, clearly lower ICCs were found in the central regions/sensorimotor areas (compare Figural Supplement section) (Figs. 3 and 4).
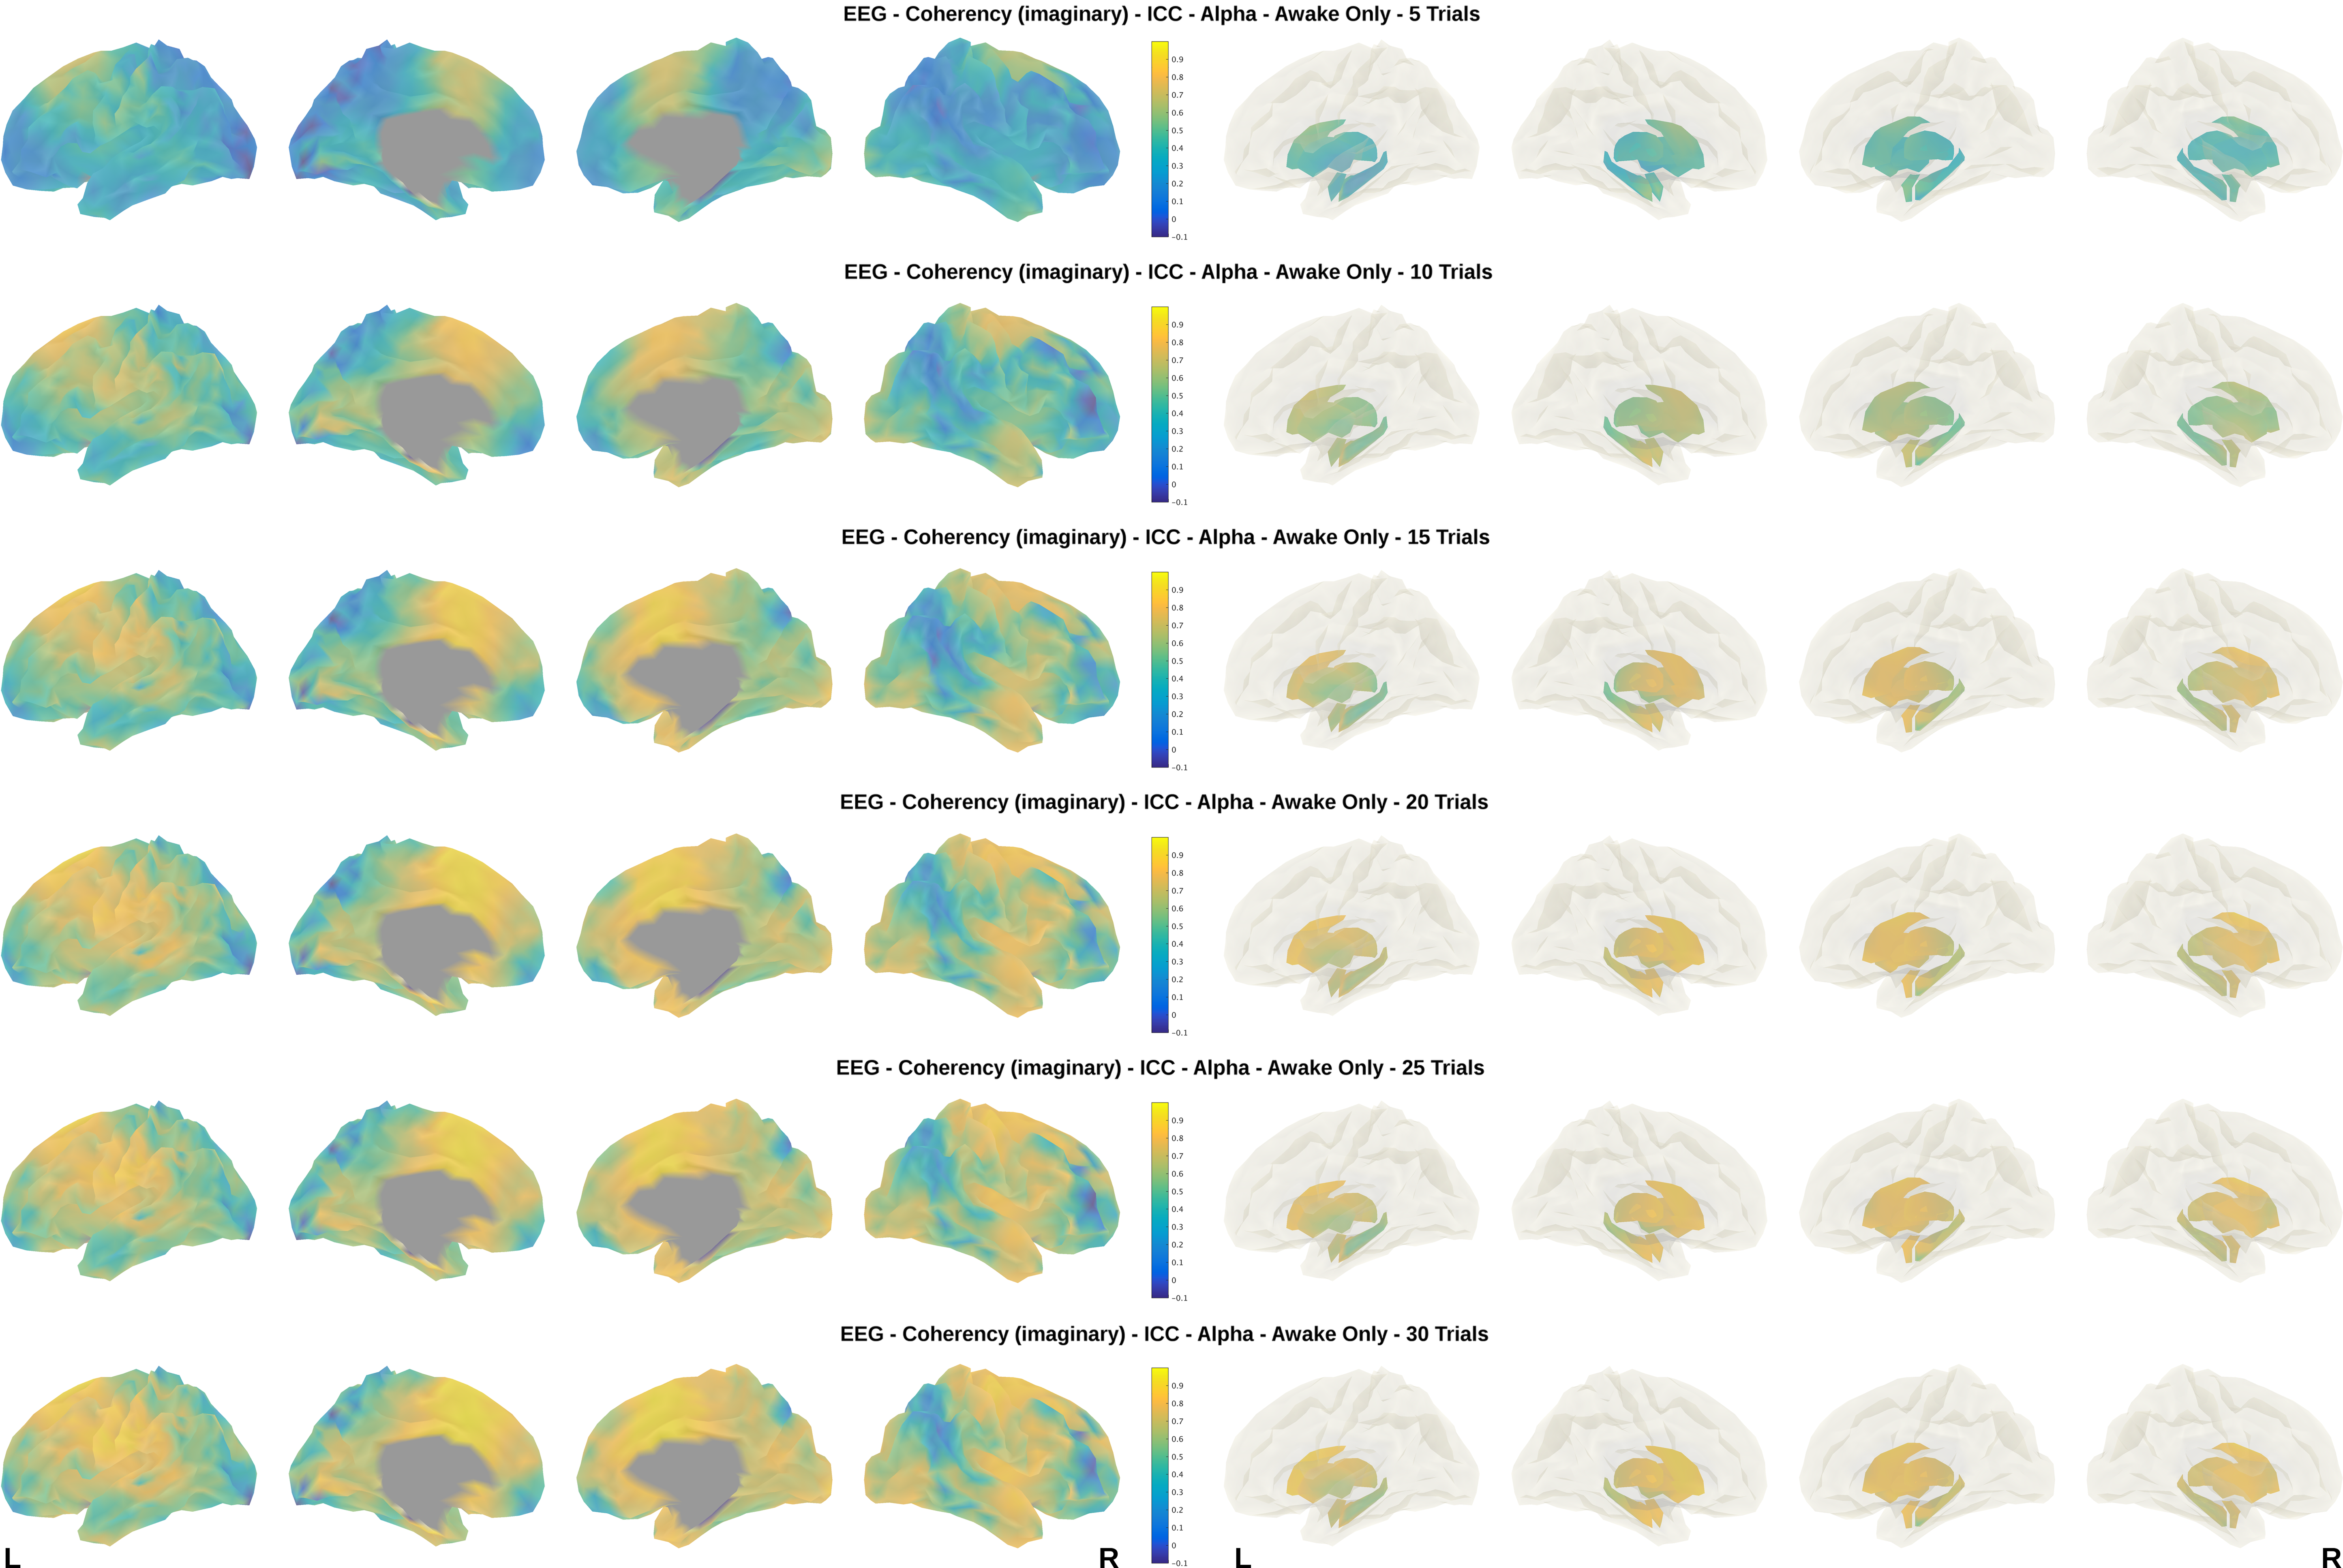
imCoh vertex-wise ICCs for EEG. Vertex-wise ICCs for imCoh are shown overlaid on the “fsaverage” subject to EEG, alpha band, wake-only, and different number of trials. Results for cortex are on the left side, subcortical nuclei are shown on the right. Note the increase of ICCs with more trials and the regional differences with relatively lower ICCs in “default mode” areas. Also note some laterality differences (right<left side). Although the general pattern is similar, there are differences in the topology between EEG and MEG (compare Fig. 4). Color images are available online.
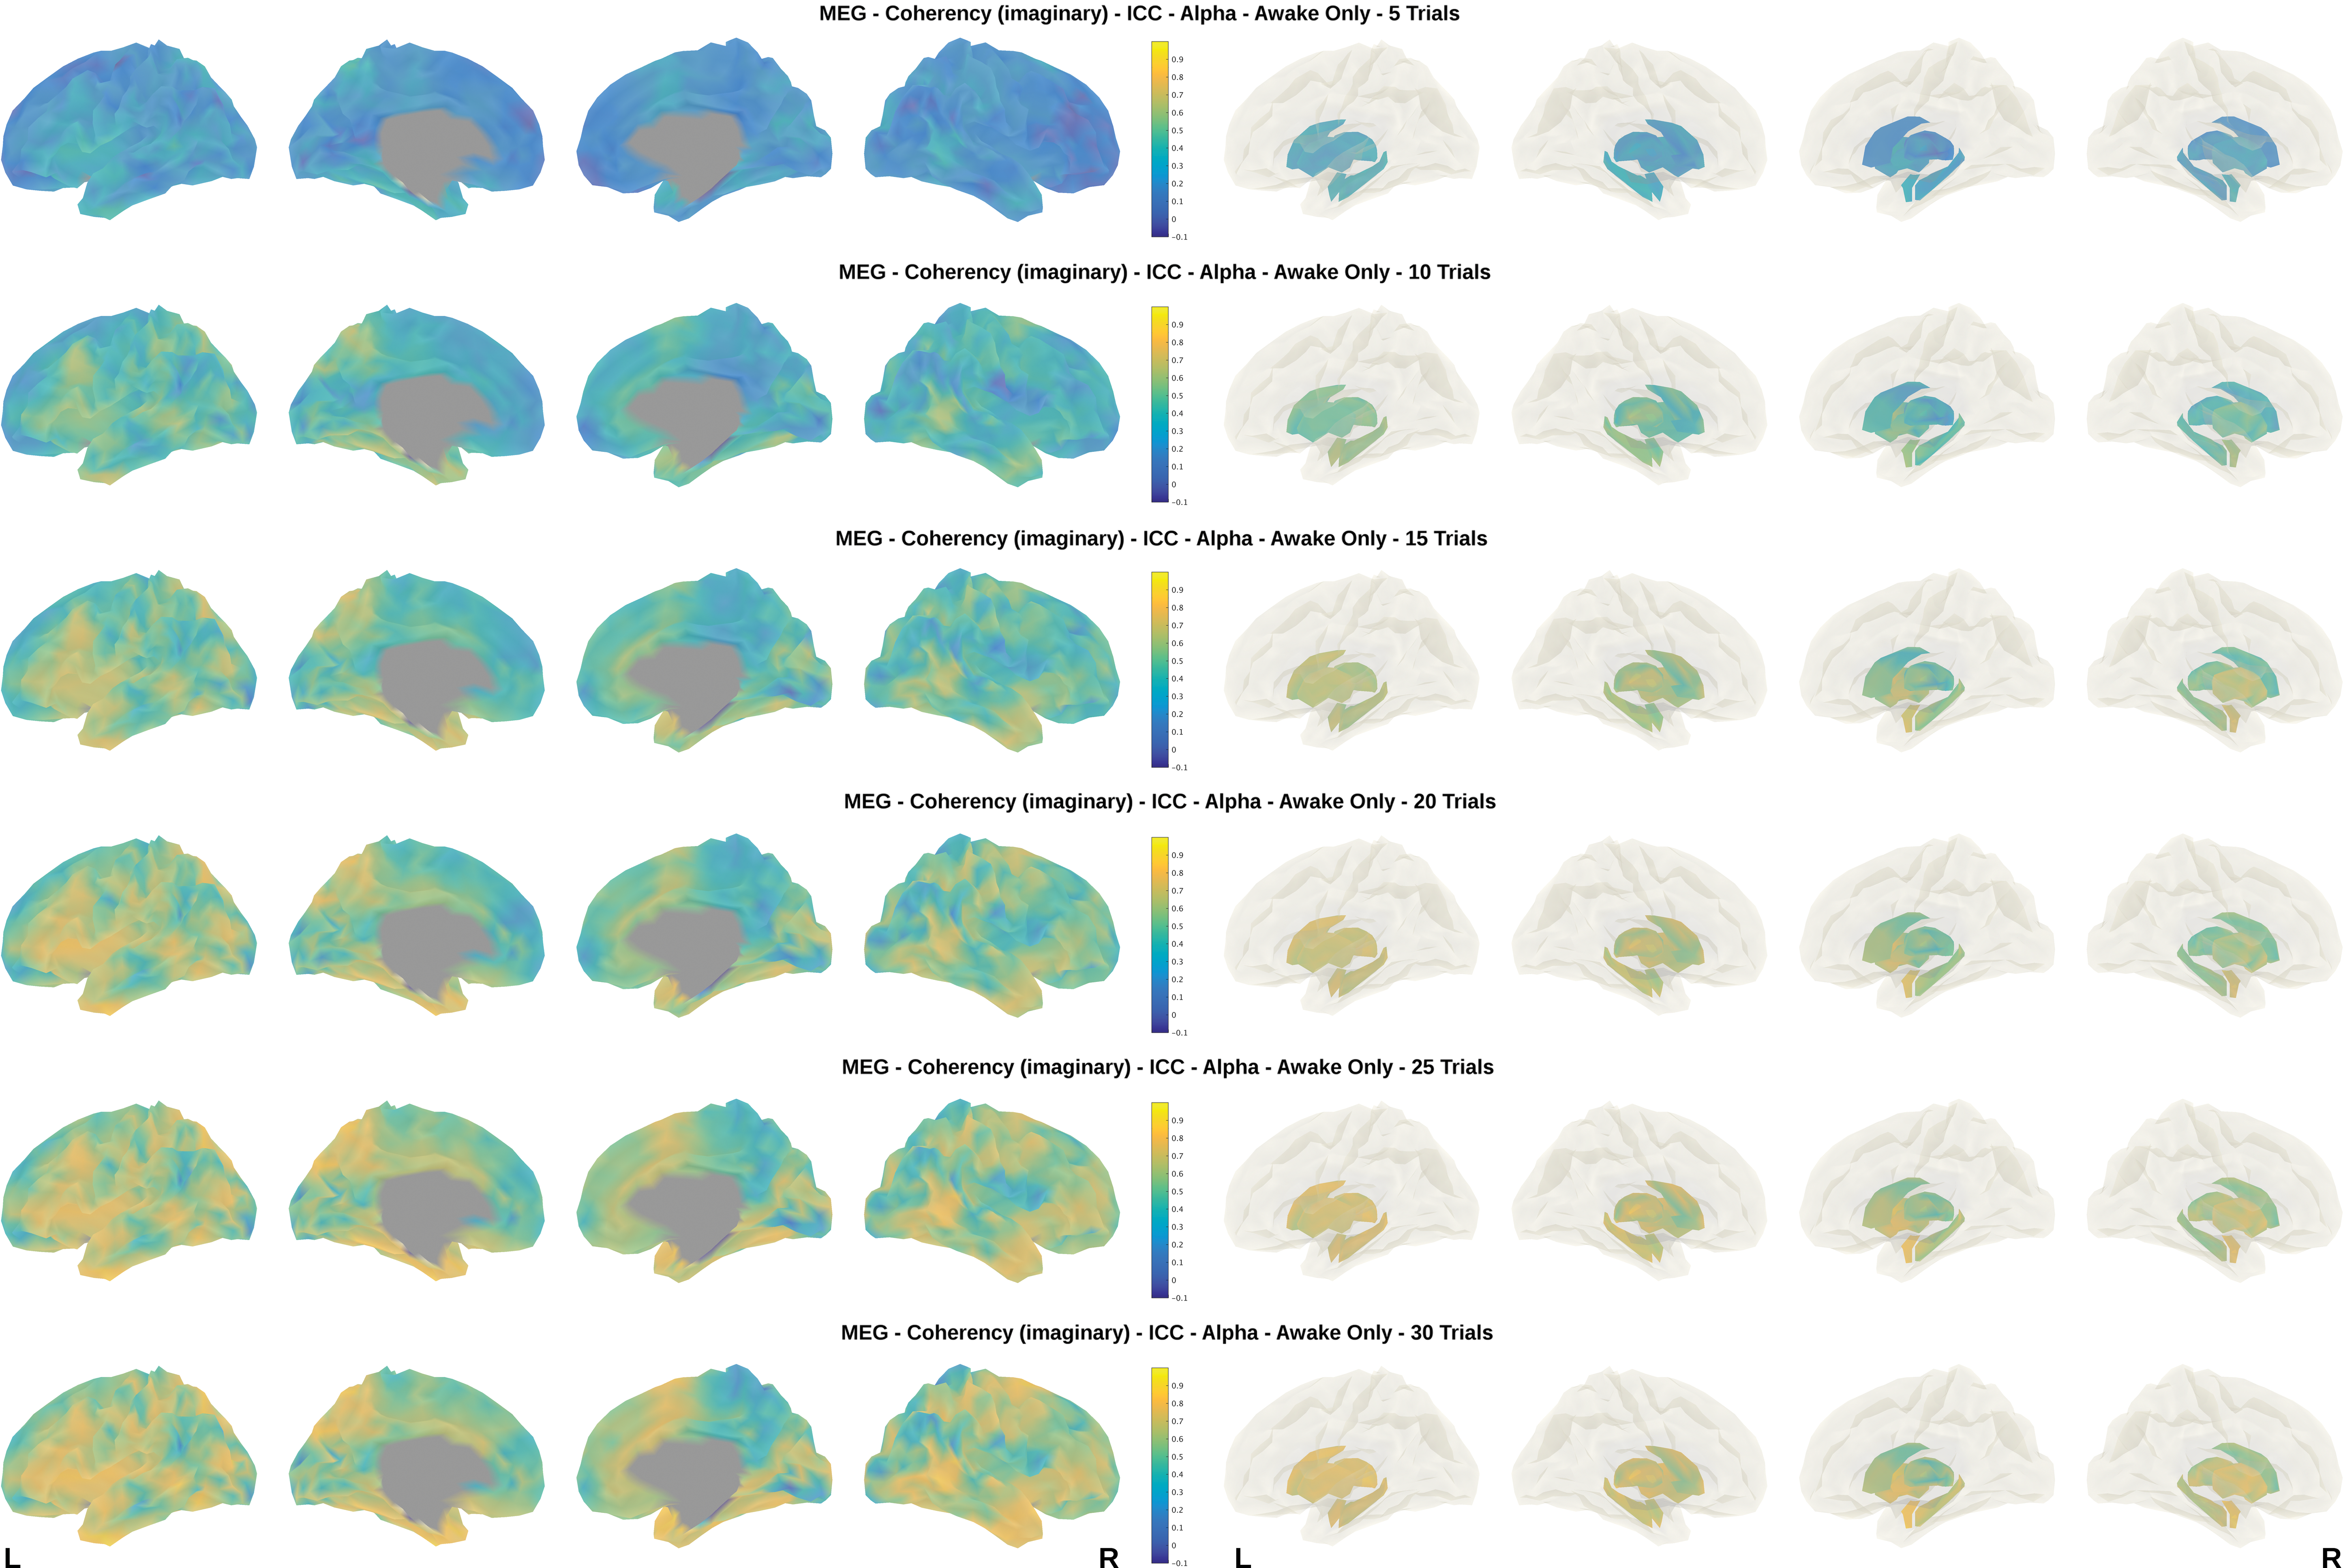
imCoh vertex-wise ICC for MEG. Vertex-wise ICCs for imCoh are shown overlaid on the “fsaverage” subject to MEG, alpha band, wake-only, and different number of trials. Results for cortex are on the left side, and subcortical nuclei are shown on the right. Note the increase of ICCs with more trials and the regional differences with relatively lower ICCs in “default mode” areas. Also note some laterality differences (right<left side). Although the general pattern is similar, there are differences in the topology between EEG and MEG (compare Fig. 3). Color images are available online.
Discussion
This study presents a comprehensive evaluation of reliability of resting-state connectivity in MEG and hd-EEG. We focused on two commonly used measures of brain connectivity, namely, the imaginary part of coherency (imCoh) and the debiased, wPLI that are both relatively insensitive to volume conduction/leakage (Nolte et al., 2004; Stam et al., 2007; Vinck et al., 2011). Both metrics performed generally similar, with slight advantages for imCoh, when using MEG in particular.
Effect of data/number of trials
The most important finding is the clear increase of measurement reliability with more trials, exceeding the data amount used in other previous studies on EEG/MEG connectivity (Englot et al., 2015; Hinkley et al., 2012). We examined the range from 50 sec (5 trials) to 5 min (30 trials) of artifact-free resting-state data and found a relevant improvement of ICCs, as a marker of reliability, throughout this range. There was some saturation, with the last steps from 25 to 30 trials not being statistically significantly different at the strict Bonferroni-corrected significance level. In comparison with the literature, our ICCs are similar to what has been described previously for the respective amount of data. One study reported ICCs of 0.56 in the alpha band using 60 sec of data for MEG/imCoh (Hinkley et al., 2012), almost identical to our 0.53 at five trials ( = 50 sec of data). Another study reported an ICC of 0.80 for the alpha band in an EEG experiment using wPLI in sensor space after an elaborate selection (including manual and automated steps) of 48 sec of data from a 12-min resting-state recording (Hardmeier et al., 2014). We found a similar ICC (0.81) for 20 trials ( = 200 sec of data) in our source space EEG/wPLI experiment. ICCs of MEG power in source space are reported between 0.82 and 0.94 for ∼120 sec of data (Martín-Buro et al., 2015), comparable with our estimate of 0.90 for 10 trials ( = 100 sec). We are not aware of any previous study that systematically assessed ICCs for different amounts of EEG/MEG data in a resting-state design.
When considering the sources of between-session variability, there are two fundamentally different possibilities: first, there is technical/method-related variability, that is, due to noise or artifacts, but there is also the possibility of biological variation, that is, the brain state not being stable during the time of measurement. Both factors could benefit from more data. Technical noise and (sporadic) artifacts would have less influence on the results. Noise can lead to alterations of amplitude, phase, and so on of oscillatory signals, consequently affecting reliability (Golestani and Goodyear, 2011; Holler et al., 2017b; Miskovic and Keil, 2014). An unstable biological brain state would also be less influential as long as a certain set of states appears repeated and allows generating a “representative pattern.” From our results, we cannot differentiate these two effects since we, as in all resting-state studies, did not know the “ground truth” of the brain state and did not have external control on what the subject was doing or thinking. However, given the very high temporal resolution of EEG and MEG in the order of <10 ms/>100 Hz, there are plenty of data points even in few seconds of data. Both imCoh and wPLI could be estimated well with few seconds of data in real and simulated data sets (∼10 × 4096 samples) (Stam et al., 2007). Hence, it is unlikely that the increase of ICC is mediated mainly by technical/methodological undersampling of the electrophysiological signal. Variability of the underlying brain state, as a feature of resting state per se, should be similarly present in other imaging modalities. For resting-state fMRI, there is abundant literature confirming relevant temporal fluctuations, for example, one recent study recommends using at least 7–15 min of data to achieve acceptable stability of MRI-based connectivity metrics (Tomasi et al., 2017). Other studies recommended to use even more data in the order of >30 min (Noble et al., 2017). Although temporal dynamics of resting-state fMRI is controversial at conventional TRs of 2–3 sec (Hindriks et al., 2016), there are indications that faster sampling, for example, using multiband fMRI, may be beneficial in this regard (Sahib et al., 2016, 2018).
Modality-specific differences
EEG and MEG are often seen as similar methods given that they sample the neuronal signals with different physical means. In our study, there was no overall difference (p > 0.5) in the reliability between EEG and MEG for wPLI and moderate superiority for MEG when using imCoh. The main effects, for example, increase of ICC with more trials, were identical. Still, there are differences in certain frequency bands with EEG being more reproducible in the alpha band and MEG being better in most other bands, theta in particular. Also, the topology of the ICCs was different between the modalities, which could be further influenced by the need for more complex head models in EEG. In the present analysis, we have used realistically shaped, individual head models for both MEG (single-shell) and EEG (three-layer boundary-element model), but EEG could probably further benefit from more elaborate methods such as six or seven class finite-element models. We and others have previously shown that the choice of the head model is of particular relevance for EEG (Fiederer et al., 2016; Klamer et al., 2015). Nevertheless, our results indicate that even with relatively simple head models, hd-EEG (with 256 channels) has globally similar reproducibility to MEG (with 275 channels) for the analysis of resting-state connectivity.
Effect of vigilance-based trial selection
It has been shown that vigilance affects measures of BOLD functional connectivity (Haimovici et al., 2017), but little is known how it might affect reliability. Changes in vigilance and sleep are a common problem in resting-state studies (Tagliazucchi and Laufs, 2014), particularly with eyes-closed paradigms. Even in eyes-open studies, vigilance can fluctuate and subject compliance needs to be controlled by video/eye-tracker. Thus, changes in vigilance could be one of the sources of biological fluctuations of resting-state connectivity. In our study, the effect of restricting the analysis to wake-only trials was marginal, for example, increasing the ICC from 0.94 to 0.95 of imCoh/EEG in alpha for 30 trials. The overall effect of vigilance-based trial selection (“wake-only” vs. “any”) was not significant (p > 0.5), however, in some frequency bands there was a significant effect, for example, higher reliability in alpha and theta for EEG. This is reassuring for interpreting EEG/MEG studies; however, it is important to point out that we only assessed the reliability, not the influence of vigilance and sleep on connectivity metrics per se, that is, we did not compare the connectivity of wake and not-wake epochs directly. Nevertheless, if vigilance had a strong effect in our cohort, one would expect that the ICCs, particularly for low number of trials, would be lower when not considering this information. ICC differences for the “wake-only” and “any” conditions were similarly low with fewer trials, for example, 0.64 versus 0.63 for imCoh/EEG in alpha for five trials. Of note, the majority of our subjects had only light sleep stages (stage 1), if any. It is well possible that deeper sleep could have a different and more pronounced impact on reliability, especially when much longer measurement times are used. We only used 15 min of acquisition; healthy subjects rarely achieve deep sleep stages in this limited time.
Frequency band differences
Analysis in the alpha band clearly had the highest ICCs for both modalities, which is in keeping with previous studies (Hardmeier et al., 2014; Hinkley et al., 2012; Martín-Buro et al., 2015). Reliability of delta band data was generally poor, even when using more data. Analysis in the theta band showed still good reliability for MEG and less good reliability for EEG. Our results offer guidance in selecting data amount/measurement time, modality, and connectivity metric for further studies that are interested in studying specific frequency bands and areas.
Anatomical distribution
In the vertex-based analysis, we found clearly lower ICCs (compared with global ICCs) reaching only fair to good levels (maximum 0.67) for the metrics of special interest (imCoh and wPLI). This is expected, given that spatial variation over the ∼2300 vertex points adds to the global variability of the metrics and both EEG and MEG have limited spatial precision. Interestingly, fMRI-based spatial ICCs from 36 min of data were also regionally different and even somewhat lower than our electrophysiology-based metrics when comparing with the alpha band vertex-based ICCs (Noble et al., 2017). From the spatial ICC distribution, we can infer that the default-mode areas are behaving differently from other areas. Further studies are needed to clarify the temporal dynamics, the involved networks, and the biological reason behind this observation. Anatomy-related differences in reliability were found in structural connectivity (derived from diffusion imaging) (Bonilha et al., 2015). It would be interesting to combine such methods in future studies and assess if these can complement each other also in terms of reliability.
Limitations
Our study was done on healthy subjects only. It is possible that in patient cohorts, effects of vigilance, age, and the type of resting-state (eyes-open vs. eyes-closed) are more pronounced (e.g., via sedating medication) and that pathological conditions can cause changes of connectivity that react differently to data amount/number of trials. Moreover, although we showed that reliability is improved substantially by more data, this does not invalidate studies using shorter data segments. If an effect is strong enough, it could still be detectable and relevant, but the effect size may have been underestimated by the lower reliability/higher variability. To statistically evaluate the influence of different factors, we used a bootstrapping approach. As such, the different replicates are not fully independent, which may impact on the higher level statistics (Kruskal–Wallis). To reduce potential type-1 error inflation, we applied a strict Bonferroni correction before assuming significance. Finally, we only tested up to 5 min of data. Global ICCs were already excellent in the alpha band for this amount of data, but vertex-based ICCs were clearly lower. It is possible that even more data (>5 min) could lead to a further improvement also for vertex-based ICCs. However, given the unavoidable dropout of trials due to artifacts and sleepiness, this would need longer acquisition times, would expand the device usage, and could affect subject compliance. Nevertheless, our results suggest to use >15 min of acquisition, if technically and logistically feasible.
In summary, we show that reliability of resting-state connectivity studies can be substantially increased when using more data (up to 5 min of artifact-free data). In this way, good to excellent ICCs could be obtained in most classical frequency bands with the exception of the delta band. The performances of imCoh and wPLI were very similar. Power and realCoh were less influenced by the data amount studied here (50 sec–5 min). EEG and MEG, with a similar amount of sensors/channels, generally seem equally well suited. Our results argue to increase the measurement times for electrophysiology-based resting-state experiments, if feasible, with subject's compliance. Accepting trials with light sleep had only minor effects on reliability in our cohort.
Footnotes
Acknowledgment
We thank Raviteja Kotikalapudi for assisting in the acquisition of the anatomical MRI.
Authors' Contributions
J.M.: design and conceptualization of the study, acquisition of data, analysis of the data, and drafting and revision of the article. S.V.: acquisition of data, analysis of the data, and drafting and revision of the article. M.C.: acquisition of data and revision of the article. Y.L.H.: analysis of the data and revision of the article. C.S.: analysis of the data, acquisition of data, and revision of the article. C.B.: design and conceptualization of the study, revision of the article, and project supervision. N.F.: design and conceptualization of the study, analysis of the data, drafting and revision of the article, and project supervision.
Author Disclosure Statement
N.F. received honoraria and travel support from Bial, Eisai, UCB, and EGI. All other authors report no disclosures.
Supplementary Material
Supplementary Data
Figural Supplement section
Supplementary Figure S1
Supplementary Figure S2
Supplementary Figure S3
Supplementary Figure S4
Supplementary Table S1
Supplementary Table S2
Supplementary Table S3
Supplementary Table S4
Supplementary Table S5
References
Supplementary Material
Please find the following supplemental material available below.
For Open Access articles published under a Creative Commons License, all supplemental material carries the same license as the article it is associated with.
For non-Open Access articles published, all supplemental material carries a non-exclusive license, and permission requests for re-use of supplemental material or any part of supplemental material shall be sent directly to the copyright owner as specified in the copyright notice associated with the article.