
Abstract
Well-established structural abnormalities, mostly involving the limbic system, have been associated with disorders of emotion regulation. Understanding the arrangement and connections of these regions with other functionally specialized cortico-subcortical subnetworks is key to understanding how the human brain's architecture underpins abnormalities of mood and emotion. We investigated topological patterns in bipolar disorder (BD) with the anatomically improved precision conferred by combining subject-specific parcellation/segmentation with nontensor-based tractograms derived using a high-angular resolution diffusion-weighted approach. Connectivity matrices were constructed using 34 cortical and 9 subcortical bilateral nodes (Desikan-Killiany), and edges that were weighted by fractional anisotropy and streamline count derived from deterministic tractography using constrained spherical deconvolution. Whole-brain and rich-club connectivity alongside a permutation-based statistical approach was used to investigate topological variance in predominantly euthymic BD relative to healthy volunteers. BP patients (n = 40) demonstrated impairments across whole-brain topological arrangements (density, degree, and efficiency), and a dysconnected subnetwork involving limbic and basal ganglia relative to controls (n = 45). Increased rich-club connectivity was most evident in females with BD, with frontolimbic and parieto-occipital nodes not members of BD rich-club. Increased centrality in females relative to males was driven by basal ganglia and fronto-temporo-limbic nodes. Our subject-specific cortico-subcortical nontensor-based connectome map presents a neuroanatomical model of BD dysconnectivity that differentially involves communication within and between emotion-regulatory and reward-related subsystems. Moreover, the female brain positions more dependence on nodes belonging to these two differently specialized subsystems for communication relative to males, which may confer increased susceptibility to processes dependent on integration of emotion and reward-related information.
Introduction
Bipolar disorder (BD) affects approximately 1–3% of the population (Merikangas et al., 2011) and is characterized by intermittent episodes of depression and (hypo)mania proposed to be due to dysconnectivity within the illness brain circuitries. Although the underlying neurobiology of BD remains unclear, there is evidence for distinctive anatomical and functional patterns of abnormalities in the neural system involving emotion and reward-related circuitries (Blond et al., 2012; Perry et al., 2018; Strakowski et al., 2012) that may elucidate functional impairments of the illness. However, due to substantial heterogeneity across the literature, a structural neuroanatomical pattern of BD using protocols of magnetic resonance imaging (MRI) is yet to be fully defined and understood. The partial overlap in symptoms and neuroanatomical abnormalities for bipolar and other mood disorders emphasizes the need for a deeper understanding of the different neurobiological mechanisms that characterize these disorders. This is key to identifying novel and tailored treatment targets to improve life quality of patients suffering from BD.
Diffusion tensor imaging (DTI) studies have implicated white matter deficits in major fibers carrying impulses to and from the cortical areas that regulate emotional, cognitive, and behavioral aspects of the illness (reviewed in Emsell and McDonald, 2009; Nortje et al., 2013; Vederine et al., 2011). These findings suggest that changes in BD extend beyond the white matter microstructural organization of frontolimbic connections that support emotion regulation in the brain to include posterior and interhemispheric projections. In addition, deficits in gray matter measures have been reported across cortico-subcortical regions in BD with the strongest effects seen across frontal and inferior temporal cortices and limbic system structures, with associations identified for illness duration and medication exposure (Hallahan et al., 2011; Hibar et al., 2016, 2018). However, there are inconsistencies among DTI and gray matter volumetric studies on the anatomical location and direction of findings.
With the aim to investigate BD connectivity using a more anatomically comprehensive approach, structural and diffusion MRI scans can be combined together in connectome analyses to extend beyond focal gray and white matter investigations that would be provided by examining structural and diffusion scans alone. This approach of network analysis allows for brain circuits to be represented in a network-like pattern, using the science of complex networks—graph theory—through which gray matter regions are represented as “nodes” and their axonal bundles linking these nodes as “edges.” By mapping the brain as a graph, topological features of a network can be inferred to describe features of integration and segregation at the whole-brain and nodal level. This has facilitated investigation of neurobiological changes and consequent cognitive impairments of psychiatric illnesses such as BD (O'Donoghue et al., 2015).
BD has been increasingly considered a “dysconnection syndrome” as a result of the complex interplay between gray and white matter components involving emotion-regulatory circuitries (O'Donoghue et al., 2017a). Although scarce, structural connectivity analyses in BD (reviewed elsewhere; O'Donoghue et al., 2017a) (Table 1) presented disrupted whole-brain integration, left/right decoupling, and dysconnectivity of the brain's frontolimbic and posterior neuroanatomical circuits underpinning emotional dysregulation (Collin et al., 2016; Forde et al., 2015; Gadelkarim et al., 2014; Leow et al., 2013; O'Donoghue et al., 2017b). Disrupted whole-brain integration is consistent with widespread anisotropy reductions seen in BD (Emsell and McDonald, 2009; Nortje et al., 2013; Vederine et al., 2011). Furthermore, connectivity of centrally located brain regions (hubs) responsible for global integration and coordination of higher cognitive processes within the brain appears preserved (Collin et al., 2016; O'Donoghue et al., 2017b; Roberts et al., 2018; Wang et al., 2018), with evidence of altered rich-club membership in BD (Table 1).
Overview of Network Reconstruction, Weights, and Findings Considered by Today's Structural Connectivity Studies
No study to date has used cortico-subcortical mapping (FreeSurfer) in combination with complex fiber arrangement (CSD-tractography) to investigate BD anatomical networks.
↓, Decrease; ↑, increase; AAL, automated anatomical labeling; BD, bipolar disorder; CC, clustering coefficient; CSD, constrained spherical deconvolution; DMN, default mode network; DTI, diffusion tensor imaging; Eg, global efficiency; FA, fractional anisotropy; Global, global measure; HC, healthy controls; L, characteristic path length; MD, mean diffusivity; NBS, network-based statistics; NOS, number of streamlines; n.s., not studied; PLACE, path length associated community estimation; RC, rich-club; SFG, superior frontal gyrus.
Functional connectivity studies support these anatomical changes in BD, reporting stability of large-scale resting-state networks and regional dysconnectivity mostly involving the amygdala, thalamus, and anterior cingulate and prefrontal cortices, alongside abnormalities involving default mode and frontoparietal networks in BD (Ajilore et al., 2015; Anand et al., 2009; Perry et al., 2018; Syan et al., 2018; Wang et al., 2017). Functional analyses in BD have been informative, although they have restricted their a priori observations to local patterns of connectivity. A preferential pattern of neuroanatomical dysconnectivity is yet to be defined for BD, and it remains unclear whether the illness' impairments result from uniform widespread changes in network topology or if these are just the result from abnormalities within specified subnetworks (Perry et al., 2018). The precise relationship between neuroanatomical changes and functional deficits is unclear (Friston, 2011), and investigation of the structural substrate underpinning BD dysconnectivity may elucidate distinctive neuroanatomical patterns underpinning the disorder and contribute toward a greater understanding of its etiology and functional impairments.
Despite today's advances in anatomical network reconstruction in vivo, obtaining an optimum trade-off between sensitivity and specificity remains challenging (Zalesky et al., 2016); however, the balance between these must be sought if macroscale mapping of the brain is to be anatomically meaningful and useful in deriving reliable measures of topological organization. At present, nodal definition for connectivity studies remains unresolved (Zalesky et al., 2016). Studies have availed of a common template (e.g., automated anatomical labeling [AAL] atlas), namely an identical cortico-subcortical parcellation scheme across all subjects (Forde et al., 2015; O'Donoghue et al., 2017b; Roberts et al., 2018; Wang et al., 2018), which reduces intersubject anatomical variability and, although reproducible, lacks anatomical accuracy. Subject-specific parcellation schemes such as FreeSurfer (Fischl, 2012) may improve anatomical accuracy of findings by accounting for individual coordinates and volumes. However, studies that have used subject-specific node definition have limited their observation to cortico-cortical mapping (Collin et al., 2016; Gadelkarim et al., 2014) or regions of interest (Ajilore et al., 2015; Leow et al., 2013). The established importance of the limbic system in BD argues for the inclusion of cortico-subcortical connections in the analyses.
Heterogeneity of findings across structural connectivity studies in BD is largely influenced by the tractography algorithms used to reconstruct axonal fiber bundles (Bastiani et al., 2012). Connectome sensitivity can be substantially increased by using algorithms accounting for crossing fibers within a voxel (Tournier et al., 2007). Although deterministic approaches have been recently shown to be well suited for reconstructions of fiber complexity in vivo diffusion MRI, comparisons between different tractography approaches (probabilistic versus deterministic) at mapping connectomes highlight the trade-off between sensitivity and specificity in connectome reconstruction (Sarwar et al., 2018).
With our connectome approach (Fig. 1), we explored the topology of previously implicated neuroanatomical dysconnectivity in BD while comparing connectivity across both cortical and subcortical regions and connections involving complex fiber arrangements relative to controls. We examined whole-brain connectivity, most connected subsections of the network (rich-club), and used a statistical approach (network-based statistics [NBS]) to describe the topological arrangement, features of integration, and connectivity strength of BD networks. We anticipate that individuals with BD, relative to psychiatrically healthy controls, will exhibit changes in whole-brain structural connectivity measures and aberrant patterns of structural connectivity involving specified subsystems that implicate nodes belonging to emotion-regulatory circuit systems, as previously highlighted by the literature (Perry et al., 2018). With this study, we sought both to shed light on BD neuroanatomical deficits and to develop the application of graph theory metrics in psychiatry research.
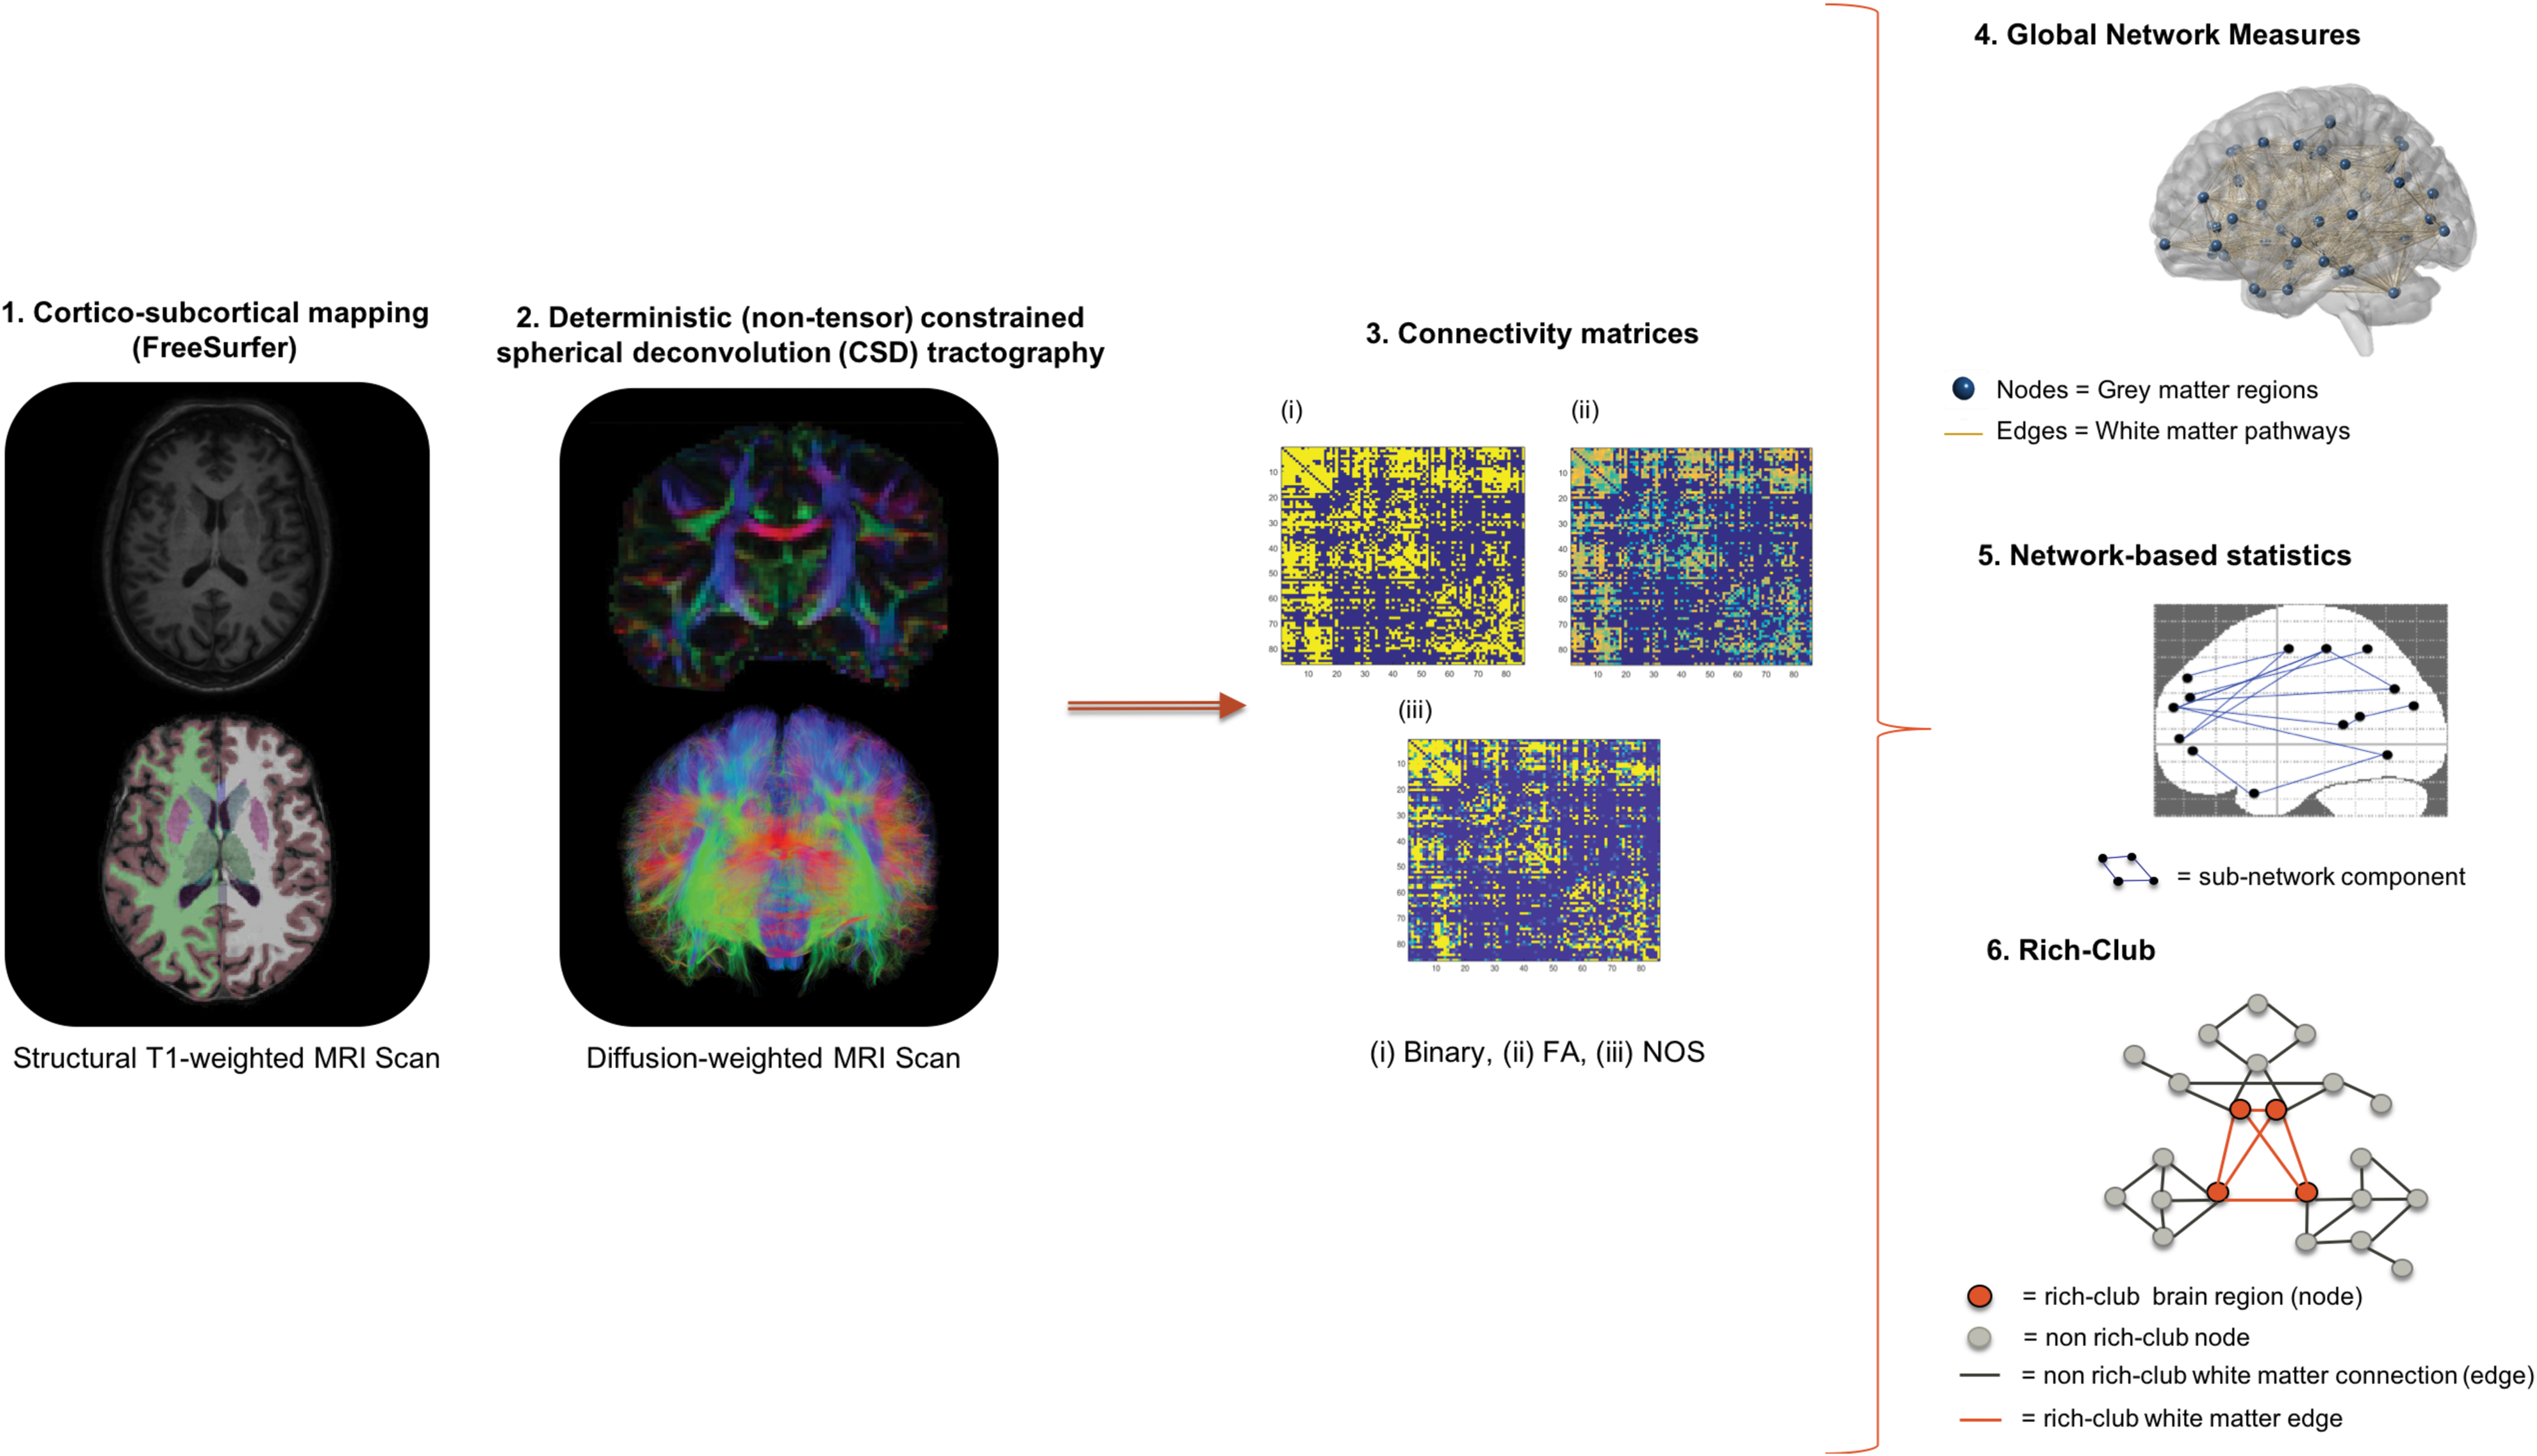
Human connectome reconstruction.
Methods
Participants
This analysis is based on an independent sample from the previously published bipolar study from our research group (O'Donoghue et al., 2017b), with a small overlap between controls (N = 13) and patients (N = 6, 15%). Participants, ages 18–65, were recruited by referral or public advertisement from the western regions of Ireland's Health Services. A diagnosis of BD was confirmed using the Diagnostic and Statistical Manual of Mental Disorders, 4th edition (DSM-IV-TR) Structured Clinical Interview for DSM Disorders (American Psychiatric Association, 2013) conducted by an experienced psychiatrist. Mood and anxiety symptom severity were assessed using the Hamilton Depression Rating Scale (HDRS-21), Hamilton Anxiety Rating Scale (HARS), and Young Mania Rating Scale (YMRS) at MRI scanning, and in BD a diagnosis of euthymia was defined by HDRS <8, YMRS <7, and HARS <18 scores. Exclusion criteria included neurological disorders, learning disability, comorbid misuse of substances/alcohol, other Axis-1 disorders, history of head injury resulting in loss of consciousness for >5 min, along with a history of oral steroid use in the previous 3 months. Healthy controls had no personal history of a psychiatric illness or history among first-degree relatives, defined using the Structured Clinical Interview for DSM-IV Non-patient edition (American Psychiatric Association, 1994). Ethical approval was granted by the University College Hospital Galway Clinical Research Ethics Committee. Participants gave written fully informed consent before participating.
Image acquisition and processing
MRI scanning was performed at the Welcome Trust Health Research Board National Centre for Advanced Medical Imaging (CAMI) at St. James's Hospital Dublin, Ireland, using a 3 Tesla Achieva scanner (Philips). High-resolution three-dimensional T1-weighted turbo field echo magnetization-prepared rapid gradient-echo (MPRAGE) sequence was acquired using an eight-channel head coil (parameters: repetition time [TR]/echo time [TE] = 8.5/3.046 ms, 1 mm3 isotropic voxel size). Diffusion-weighted images were acquired at b = 1200 s/mm2 along with a single nondiffusion-weighted image (b = 0), using high-angular resolution diffusion imaging (HARDI) involving 61 diffusion gradient directions, 1.8 × 1.8 × 1.9 mm voxel dimension, and field of view 198 × 259 × 125 mm. Structural MR images were visually inspected before/after processing for accuracy of cortico-subcortical parcellation and segmentation inspecting gray/white matter boundaries. A probabilistic approach was used to map subject-specific cortico-subcortical brain networks—34 cortical and 9 subcortical brain regions bilaterally, including the cerebellum (FreeSurfer v5.3.0) (Fischl, 2012), based on the Desikan-Killiany atlas (Desikan et al., 2006) given any T1-weighted image, for a total of 86 regions.
Diffusion MR images were corrected for subject motion, including rotating the b-matrix and eddy-current distortions (ExploreDTI v4.8.6; Leemans et al., 2009). Diffusion images were inspected for potential artifacts, subject head motion, signal dropout, eddy-current-induced distortion, and partial volume effects. To account for crossing fibers within voxels, we used a deterministic (nontensor) constrained spherical (Lmax = 6) deconvolution (CSD) algorithm (ExploreDTI v4.8.6) (Jeurissen et al., 2014; Tournier et al., 2007). Diffusion eigenvector estimation was performed using the robust estimation of tensor by outlier rejection (RESTORE) approach (Chang et al., 2005). Fiber tracking commenced in each voxel, continued with 1 mm step size, 2 mm3 seed point resolution, >30° angle curvature threshold, and 20–300 mm length, and terminated at a minimum fractional anisotropy (FA) of 0.2.
Structural connectome matrices
Whole-brain tractography maps were subsequently used with the parcellated T1 (labels) to generate individual (86 × 86) undirected connectivity matrices (Fig. 1) (ExploreDTI v4.8.6). Connectivity matrices were weighted by FA, representing the average FA between two nodes in the network, and by number of streamlines (NOS) representing the number of reconstructed trajectories between two nodes.
Global measures derived from the connectome
Global parameters summarizing whole-brain connectivity properties of BD networks were derived from unweighted and weighted matrices and including global density, characteristic path length, global efficiency, global degree/strength, clustering coefficient, calculated as the mean of the respective 86 regional estimates. Furthermore, a global measure of influence and centrality, global betweenness, was investigated (Brain Connectivity Toolbox v1.52) (Rubinov and Sporns, 2010). Statistical analysis of whole-brain measures was carried out using multivariate analysis of covariance (MANCOVA) tests with the fixed factors, including diagnosis and gender, covarying for age (IBM SPSS v23).
Statistical analysis of the structural connectome
A nonparametric statistical analysis, the network-NBS (v1.2) (Zalesky et al., 2010), was used to perform mass univariate hypothesis testing at every (FA and NOS-weighted) connection comprising the graph to identify a weaker subgraph component, meanwhile controlling for the family-wise error rate (FWER). A test statistic (analysis of covariance [ANCOVA], covaried for age and gender) was computed to test for group connectivity strength differences (M = 5000, p < 0.05). Connections were threshold, T, (1.5–3) to obtain a set of suprathreshold connections, namely only those connections that exceeded the set value; FWER-correction was used regardless of the threshold choice (Zalesky et al., 2010).
Rich-club definition and analyses
To identify group differences in rich-club connectivity and organization, we carried out an exploratory rich-club analysis (van den Heuvel and Sporns, 2011). We investigated the contribution of FA and NOS to the rich-club coefficient and membership. A weighted rich-club coefficient (Opsahl et al., 2008) was determined by ranking nodes by their connection strength (nodal degree, Wranked), and thus, nodes and connections were threshold to define a subgraph (W > r). Furthermore, edge weights (NOS and FA) were summed up for those connections within the subgraph and summed up again for the most highly weighted connections with rank greater than k (E > k). The ratio between W > r and E > k defined the weighted rich-club coefficient. Rich-club analysis permutation testing used 9999 Monte Carlo resamples (R Studio v1.0.143), and false discovery rate (FDR) correction (Benjamini and Hochberg, 1995) was used to correct for 28 possible densities.
Normalization was carried out for the weighted rich-club coefficient, as ϕ increases as a function of k in random networks (Colizza et al., 2006). To show that rich-club nodes were more highly interconnected than chance alone, a normalized rich-club coefficient was calculated by randomly reshuffling weights (M = 500, standard deviation <0.001) (O'Donoghue et al., 2017b) while preserving network topology (Maslov and Sneppen, 2002). The number of obtained rich-club coefficients was then used to compute an empirical null distribution of ϕrandom(k), which was used to estimate the statistical significance of each observed measure. Hence, ϕnorm(k) was computed as ϕ(k)/ϕrandom(k). Rich-club members were identified at statistically significant ϕnorm for both diagnostic groups across a range of k, at 60% and 70% group thresholds (O'Donoghue et al., 2017b).
Images were obtained using BrainNet Viewer (
Results
Participants' clinical and demographic characteristics
BD participants and controls were matched for age, gender, and education level attained and did not differ in age across diagnosis-by-gender subgroups [F(3,81) = 1.936, p = 0.130)] (Table 2). The majority (67.5%) of the BD group were euthymic at the time of scanning with 13 (32.5%) displaying mild anxiety and depressive signs and symptoms, and all but three were medicated (Table 2). Participants with BD type I (N = 34) and type II (N = 6), ages 19–64, were considered in this analysis.
Clinical and Sociodemographic Details of Participants
Participants were age- and gender-matched across groups. N = 13 with HDRS >7.
Age of onset and illness duration are available for N = 37 subjects with BD.
p < 0.05.
HARS, Hamilton Anxiety Rating Scale; HDRS, Hamilton Depression Rating Scale; SD, standard deviation; SES, socioeconomic status; YMRS, Young Mania Rating Scale.
Whole-brain measures of integration
Global brain topological (unweighted) organization in BD was disrupted relative to controls [F(15,67) = 2.298, p = 0.011)] (Fig. 2 and Table 3), detected as reduced global density, degree, and efficiency. When weighting these measures by either FA or NOS, no difference was detected between groups (Table 3). We investigated whether lithium might be driving effects on global organization and no difference was observed for degree or strength of connectivity between on- and off-lithium BD subjects, noting that the off-lithium group may be on other mood stabilizers. Gender comparison across global measures (Table 3) showed a main effect of gender [F(15,66) = 1.829, p = 0.049] and a main effect of diagnosis [F(15,66) = 2.385, p = 0.008], but no diagnosis-by-gender interaction [F(15,66) = 1.350, p = 0.199]. Gender differences were recorded across (FA-weighted) clustering coefficient and characteristic path length and (NOS-weighted) betweenness centrality (Table 3), the latter driven by fronto-temporo-limbic nodes in females relative to males [post hoc MANCOVA across 86 nodes, F(82,2) = 0.73, p = 0.74].

Global network measures affected in BD. BD group exhibited greater dysconnectivity compared with healthy controls across unweighted networks. Dysconnectivity was defined by reduced global density, degree, and global efficiency. Bars represent mean ± SD. BD, bipolar disorder; SD, standard deviation.
Global Network Measures Across Unweighted and Weighted Networks
Measures are shown across (i) unweighted networks, with diagnostic group differences in global density, degree, and efficiency; (ii) weighted networks, with gender differences in FA-weighted CC and characteristic path length; NOS-weighted betweenness centrality, at *p < 0.05. Statistical comparison between diagnostic groups: MANCOVA [Wilk's Λ F(15,67) = 2.298, p = 0.011]. Gender comparison showed (a) main effect of diagnosis [Wilk's Λ Pillai's F(15,66) = 2.385, p = 0.008], (b) main effect of gender [Wilk's Λ Pillai's F(15,66) = 1.829, p = 0.049], but no (c) interaction between gender and diagnosis was detected [Wilk's Λ Pillai's F(15,66) = 1.350, p = 0.199].
MANCOVA, multivariate analysis of covariance.
Permutation-based subnetwork analysis
Edge-level analysis identified a weaker subnetwork connected component (FA-weighted) for BD relative to controls (t > 1.5, p = 0.031) comprising 16 structural disconnections (Supplementary Table S1 and Fig. 3). Subcortical hypoconnectivity encompassed limbic and basal ganglia connections; specifically, edges between the caudate, putamen, pallidum, hippocampus, amygdala, nucleus accumbens, and several brain structures of the ventral diencephalon area (hypothalamus, mammillary bodies, subthalamic nuclei, substantia nigra, and red nucleus). No significant differences were identified when NOS was used as the edge-weight. No increased connectivity was recorded (FA- and NOS-weighted) in BD. Gender comparison across FA-weighted (but not NOS) connections showed hypoconnectivity in females compared with males (t = 1.5–3.5) (Supplementary Table S1) for connections within basal ganglia, and between basal ganglia and limbic and temporal nodes. No hyperconnectivity was noted in females, compared with males (FA- and NOS-weighted). No weaker/stronger subnetwork was identified when we tested for diagnosis-by-gender interaction (FA- and NOS-weighted).
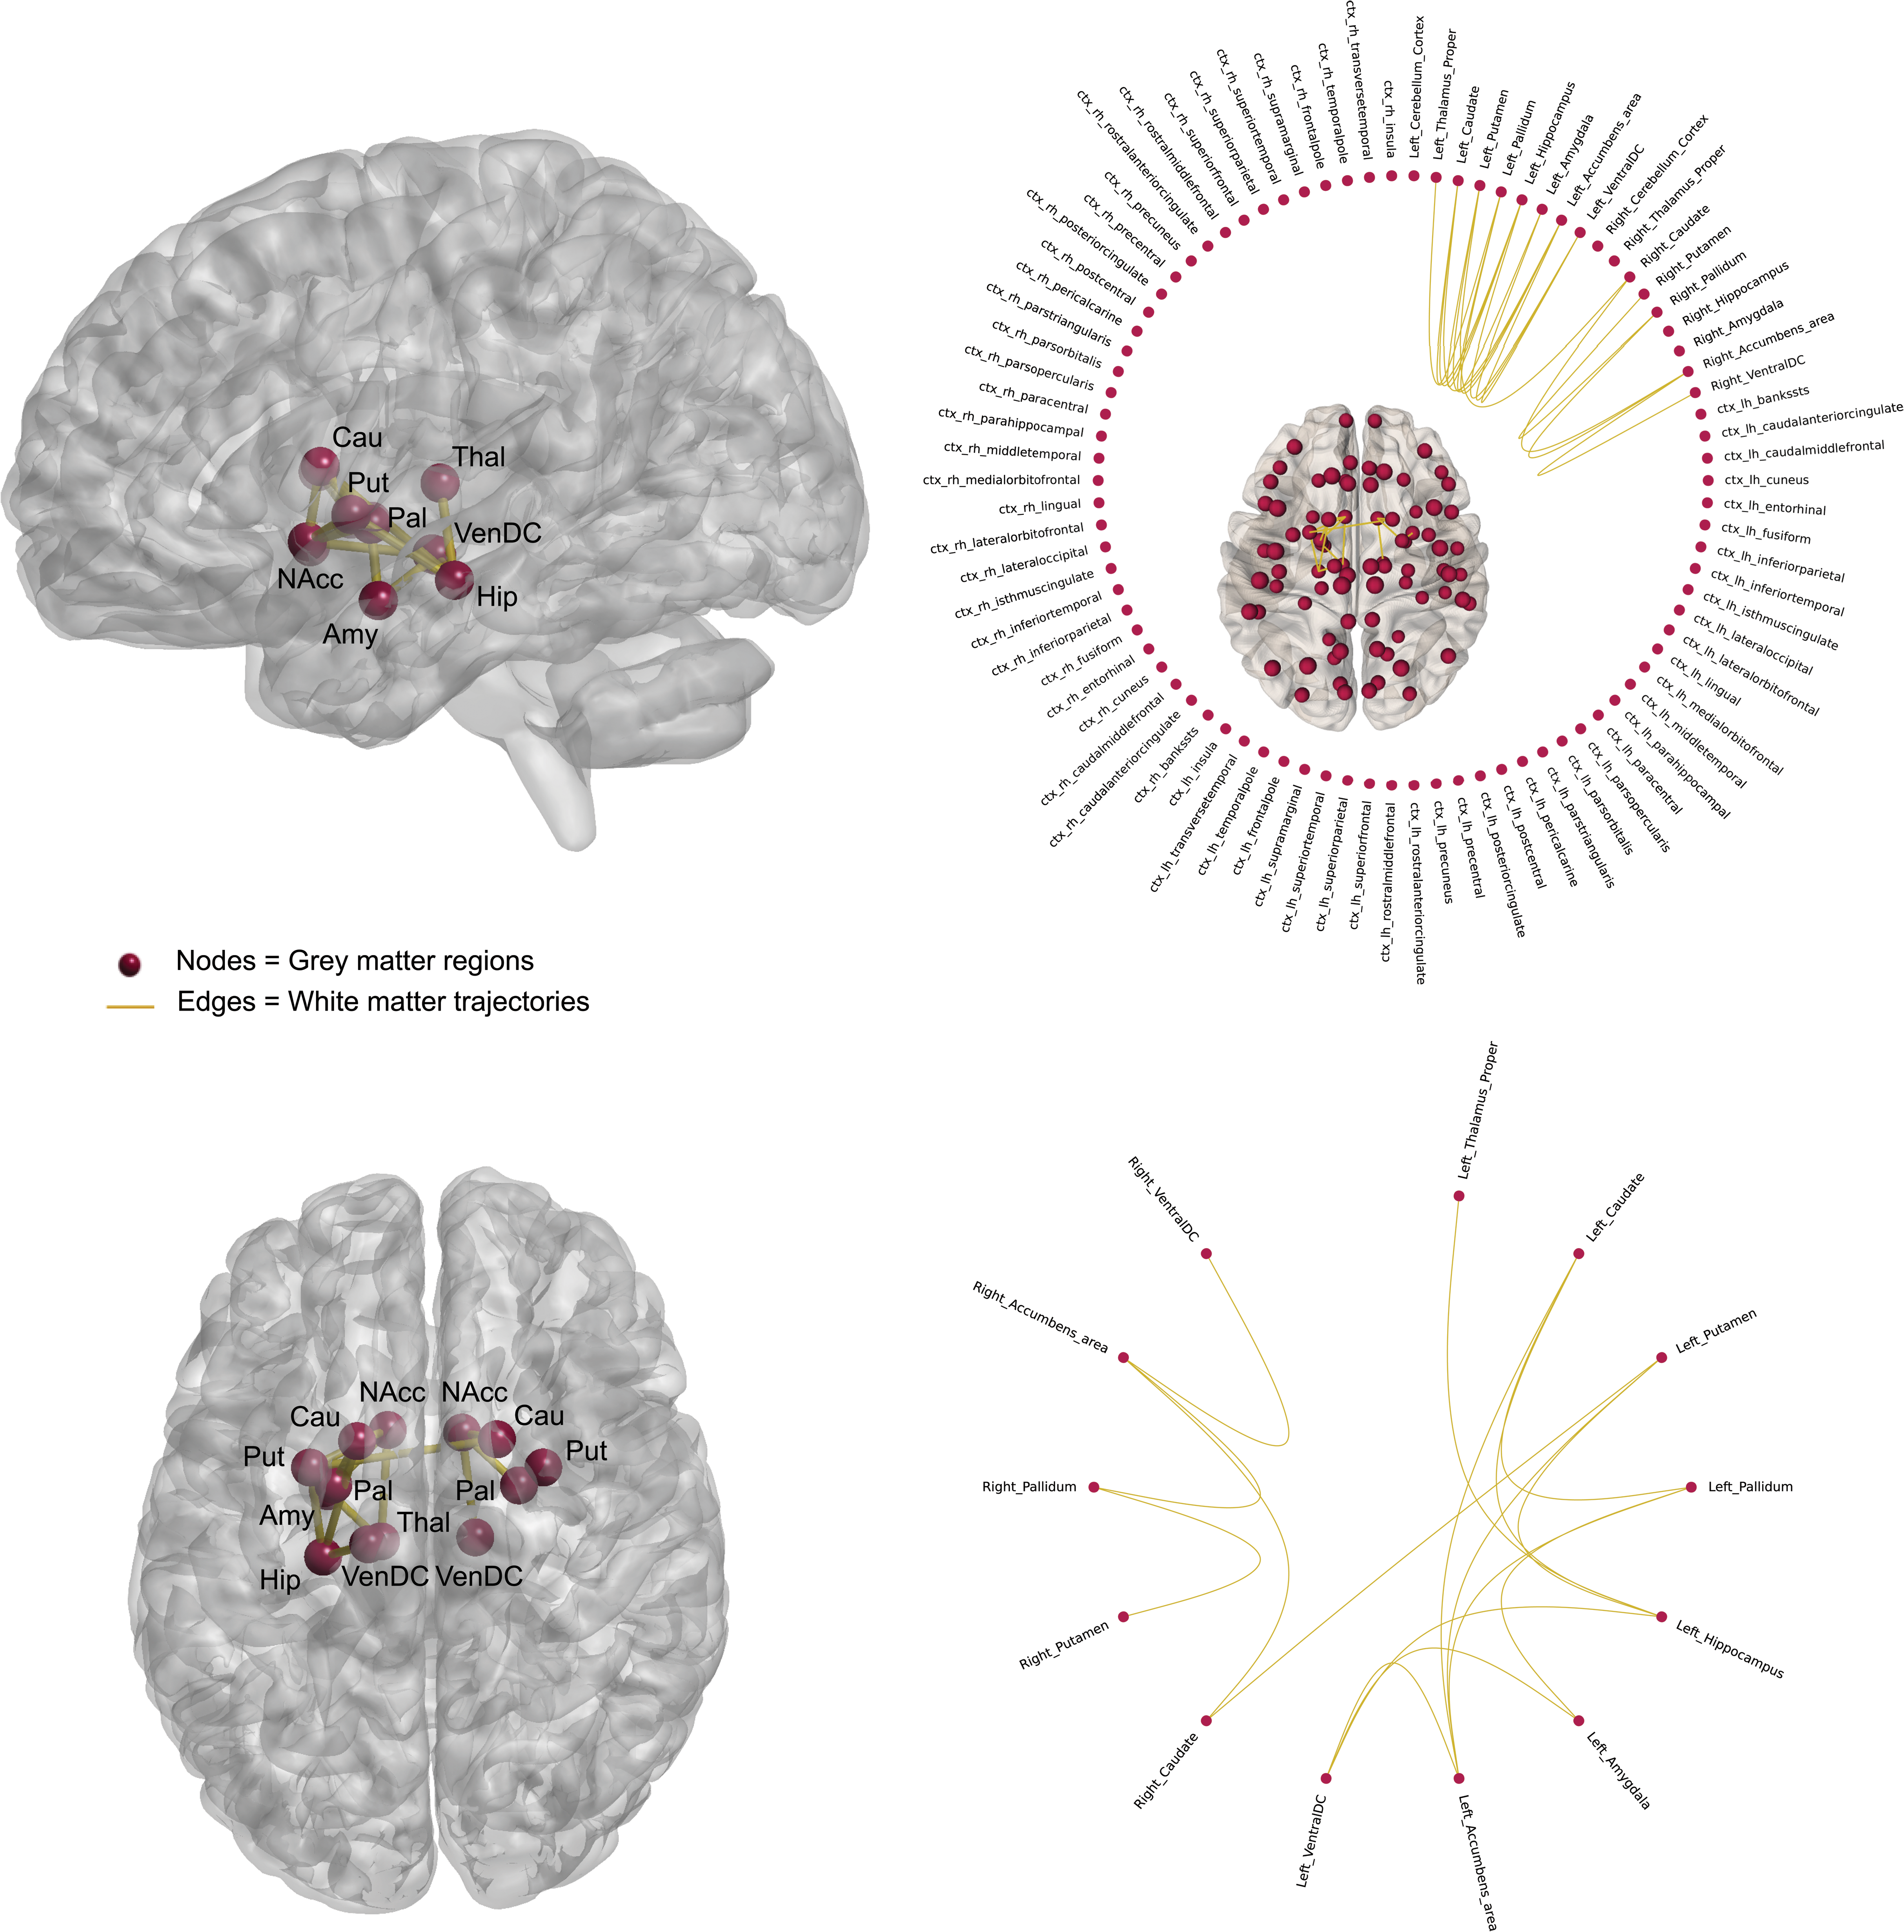
FA-weighted subnetwork graph component showing decreased connectivity in BD. This network showed reduced connection strength associated with FA-edge weighting in BD versus control, with the highest effects within the basal ganglia and between basal ganglia and limbic connections (T > 1.5, p = 0.031). ctx, Cortex; FA, fractional anisotropy; ventral DC, ventral diencephalon. Color images are available online.
Normalized rich-club coefficient
Rich-club organization was observed for FA- and NOS-weighted networks (Fig. 4A), with weighted rich-club coefficient ranging from k11 to k40 possible densities, and normalized weighted coefficient from k11 to k38 densities. Across FA-weighted rich-club coefficients, we did not detect a main effect of diagnosis using permutation testing or ANCOVA [F(1,80) = 0.081, p = 0.777], no main effect of gender [F(1,80) = 1.965, p = 0.165], or diagnosis-by-gender interaction [F(1,80) = 0.070, p = 0.791] (Fig. 4B–D). Across the range of NOS-weighted rich-club coefficients, there was a main effect of diagnosis detected using permutation testing (k > 30, Z = 3.78, p < 2.2e-16) or ANCOVA [F(1,80) = 16.653, p = 0.0000106], no main effect of gender [F(1,80) = 0.020, p = 0.888], but a diagnosis-by-gender interaction [F(1,80) = 6.038, p = 0.016] (Fig. 4B–D). Female controls had significantly lower rich-club coefficients compared with males (p = 0.012), or females with BD (p = 0.000016), but were not significantly different from male controls (Fig. 4C).

Normalized rich-club coefficients (Phi) and gender. FA-weighted coefficients (left) and NOS-weighted coefficients (right).
Rich-club membership
In NOS-weighted networks (Fig. 4E), rich-club membership was defined at the statistically significant network between patients and controls (k > 30, Z = 3.78, p < 2.2e-16) after multiple comparison correction across the range of rich-club densities, for connections common to more than 60% and 70% of participants. Nodes not involved in the rich-club in BD relative to controls included frontolimbic and posterior nodes: bilateral nucleus accumbens and (right isthmus and rostral anterior) cingulate and left lingual gyri (Fig. 4E). At a higher threshold (70%), BD membership did not involve further brain regions, namely left precuneus, bilateral medialorbitofrontal, and left superiorfrontal gyri (Fig. 4E).
Clinical associations
Age of onset and illness duration did not relate to the significant graph theory measures (age of onset: r = −0.15 to 0.20, p = 0.24–0.55; illness duration: r = −0.13 to 0.14, p = 0.20–0.93).
Discussion
We identified impairments across whole-brain topological arrangements in BD, defined by reductions in global density, degree, and efficiency. Furthermore, we observed a differentially connected subnetwork involving limbic and basal ganglia connections when accounting for the microstructural organization of the underlying fiber bundle. We detected increased density of connections within rich-club nodes when weighting the network for streamline count, and that frontolimbic and posterior-parietal nodes were less frequently members of BD rich-club. We did not detect differences in rich-club connectivity when weighting by the microstructural organization of the fiber bundle. While no interaction between diagnosis and gender was evident for global or subnetwork analyses, it was clear that rich-club connectivity was driven by females with BD. Interestingly, females displayed increased whole-brain betweenness centrality relative to males, driven by fronto-temporo-limbic nodes.
In BD, overall binary topological organization deficits were observed without weighting by any measure of the strength of the connection, including lower global density, degree, and efficiency relative to controls (Table 3). As degree of a node relates to the number of connections present in a network, this reduced density may directly impact global communication between regional nodes and the rest of the network (Bullmore and Sporns, 2012). Whole-brain effects revealed different arrangements of connections for BD compared with controls but not when weighting a network by FA or NOS, suggesting that changes in whole-brain communication in BD may be driven by abnormalities in the brain's architectural arrangement or wiring patterns rather than in at least the examined connectivity strengths. These structural differences in BD did not appear to relate to differences in function (cognitive measures) in an overlapping clinical sample (McPhilemy et al., 2019), suggesting that in BD this rewiring may be necessary to maintain a comparable functional outcome to that of controls.
Preserved global connectivity is consistent with two studies using a comparable tractography algorithm and edge-weight (Forde et al., 2015), and investigating connection density via measures of cortical thickness using a subject-specific parcellation (Wheeler et al., 2015). Despite evidence of preserved weighted degree and density in BD using a subject-specific cortico-subcortical mapping and NOS-weighting (Leow et al., 2013), the majority of studies to date provide network-level evidence for disrupted whole-brain integration mostly defined by reduced clustering coefficient efficiency globally and longer paths and interhemispheric dysconnectivity (Collin et al., 2016; Gadelkarim et al., 2014; Leow et al., 2013; O'Donoghue et al., 2017b; Roberts et al., 2018; Wang et al., 2018). These abnormalities support our topological findings in BD and could relate to the interhemispheric dysconnectivity and reduced regional connectivity previously reported (O'Donoghue et al., 2017a).
Differences across whole-brain findings between this and other analyses are very likely to depend on different methodological approaches used (Table 1). Topological properties of a network are largely determined and thus vary depending on the tractography algorithm used (Bastiani et al., 2012); a major strength of the present study includes the nontensor-based algorithm to reconstruct complex fiber pathway arrangements combined with a subject-specific parcellation scheme, including cortical and subcortical nodes to increase anatomical meaningfulness and sensitivity of the findings. However, despite the methodological advantages of using subject-specific node definition schemes, and crossing fiber definitions for the edges, these methods remain approximations of true anatomical subdivisions and their connection in the brain as a network (Fornito et al., 2013).
Our findings suggest that when we consider crossing fibers in the weighting, which we posit confers increased anatomical specificity, these are not globally impaired in connectivity, in contrast to what has been previously proposed by tensor-based studies (Collin et al., 2016; Gadelkarim et al., 2014; Leow et al., 2013; Wang et al., 2018), or by those not availing of a subject-specific parcellation scheme (O'Donoghue et al., 2017b; Roberts et al., 2018; Wang et al., 2018).
Recently, nine different edge-weights were integrated into a single graph to demonstrate improvements in the characterization of patient/control differences in structural connectivity analysis, and higher sensitivity, specificity, and accuracy of NOS over FA (Dimitriadis et al., 2017). This highlights a distinction between edge-weights and their utility at examining topological variance, however, further research is needed to fully understand which edge-weight may be the most biological informative estimate of anatomical connectivity. Furthermore, investigation of connectivity via both weighted and unweighted networks can inform the relationship between network weights and topology while minimizing biases introduced by tractography (Fornito et al., 2016).
Our whole-brain effects appeared to be driven by a network of subcomponents determined statistically through which BD showed dysconnectivity in a subnetwork involving connections between basal ganglia nuclei and between limbic nuclei, as well as connections between these systems relative to controls when weighted for microstructural organization, but unchanged when weighted by streamline count. Although numerous volumetric and voxel-based gray and white matter neuroimaging studies have implicated these two subsystems regionally and separately in BD pathophysiology (Hibar et al., 2016, 2018; O'Donoghue et al., 2017a), we revealed changes in connectivity strength in a network involving both the basal ganglia and limbic systems. These two functionally related subsystems appear concomitantly altered in terms of how they vary in topological arrangement in BD relative to controls and are consistent with existing regional studies. Localized dysconnectivity, along with reductions in whole-brain connectivity, supports the hypothesis that neuroanatomical deficits of BD may be confined to specific anatomical subnetworks.
Anatomically, the striatum acts as a relay station of inputs coming from several limbic motor and sensory areas such as the amygdala, hippocampus, and frontal cortex (Emsell and McDonald, 2009). Considering the functional role of these anatomical connections (Wessa et al., 2009), it is possible that these changes in connectivity strength contribute to BD emotion dysregulation. Diffusion-tensor studies have implicated the anterior limb of the internal capsule (ALIC) in BD pathophysiology (O'Donoghue et al., 2017a). This is significant considering the ALIC sits adjacent to several prominent emotion-regulatory circuits forming a crucial anatomical link between the basal ganglia and the limbic system. Several white matter tracts coordinate impulses coming and leaving these two subsystems, such as the uncinate fasciculus connecting frontolimbic structures, the ventral amygdala/striatal tract linking basal ganglia and limbic nodes, and the fornix connecting regions belonging to the limbic system and the inferior diencephalon area. There is network-level evidence of frontolimbic dysconnectivity in BD (Ajilore et al., 2015; Forde et al., 2015; Leow et al., 2013), and comparable statistical analyses have extended frontolimbic findings presenting dysconnectivity across parieto-occipital connections (O'Donoghue et al., 2017b), and more recently in connections involving frontotemporal nodes in BD (Roberts et al., 2018). Dysconnectivity within temporal networks might be a characteristic of young individuals with BD (mean age = 23.9) (Roberts et al., 2018) and thus explains why we failed to detect such an effect in our cohort (mean age = 42.7) (Table 2).
We detected increased connection density in a rich-club involving frontolimbic, basal ganglia, and parieto-occipital connections in BD relative to controls. However, this difference was not reflected when rich-club coefficients were weighted by FA. This increase in rich-club density in BD may represent a compensatory mechanism to dysconnectivity observed in a subnetwork involving basal ganglia and limbic connections when weighted by microstructural organization. Our findings contrast previous reports of preserved structural “backbone,” or anatomical infrastructure, of BD connectome (Collin et al., 2016; Roberts et al., 2018; Wang et al., 2018). A plausible explanation for this may be the increased specificity of our connectome approach relative to other observations. Furthermore, one study has shown marginal reductions in rich-club connectivity in BD (O'Donoghue et al., 2017b), whereas two have described an increase in NOS-weighted rich-club coefficients compared with controls (O'Donoghue, et al., 2016; Zhang et al., 2018). Comparisons of rich-club findings are limited by the different rich-club network mappings used across studies, specifically if these have confined their rich-club observations to cortical connections (Collin et al., 2016) or have not defined rich-club nodes in a subject-specific manner (O'Donoghue et al., 2017b; Roberts et al., 2018; Wang et al., 2018).
We cannot exclude the possibility of medication effects on our findings, although we did not detect an effect of lithium on FA and NOS strength similarly to previous investigations (Collin et al., 2016; O'Donoghue et al., 2017b); however, we may have been underpowered to investigate this outcome (BD: on-lithium = 13, off-lithium = 27, noting that all but 3 BD on-lithium were taking other medications). Although clinically challenging, future studies should focus on medication-naive patients and longitudinal studies after commencing or switching medication, and account for medication dosage, to rule out potential medication effects on neuroanatomical measures.
We detected differential hub involvement in BD rich-club relative to controls, with the greatest effects observed within limbic and parieto-occipital nodes. These effects were indicated by the lack of participation of the anterior and posterior portions of the cingulate gyrus, nucleus accumbens, and lingual gyrus to the rich-club membership at the lower group threshold (60%). Nodes less frequently included in BD membership are consistent with neuroanatomical changes reported in the disorder (Emsell et al., 2013; Forde et al., 2015; Leow et al., 2013; Linke et al., 2013; Nortje et al., 2013; O'Donoghue et al., 2017b; Vederine et al., 2011), and anatomically overlap with brain areas involved in emotion regulation and reward—two subsystems that are of considerable interest in mood disorder pathophysiology such as BD. The cingulate cortex was not included in BD membership, which is significant considering the functional role this cortex and its projections play in cognitive and emotional processes (Emsell and McDonald, 2009). Nodes anatomically connecting with this structure, namely the precuneus, medial orbitofrontal, and superior frontal gyri, were also not participating in BD rich-club membership, as seen when the group threshold was increased to 70%. A 70% group threshold allows for more pathways to be compared across groups; thus, these nodes may be implicated to a lesser degree in BD relative to those that were less frequently included at 60%.
Frontolimbic dysconnectivity is consistent with a previous membership investigation (O'Donoghue et al., 2017b), although other studies have reported preserved rich-club membership in young BD (Roberts et al., 2018) and BD with depression (Wang et al., 2018); this may suggest a differential rich-club organization in symptomatic patients relative to patients in remission, and an age effect on connectivity within rich-club nodes (Dennis et al., 2013). Nodes belonging to the corticostriatal reward system, namely nucleus accumbens and medial orbitofrontal cortex, were less frequently involved in the BD rich-club membership relative to controls. An increase in connectivity within corticostriatal regions has been associated with mania in BD (Damme et al., 2017). Posterior parietal and occipital nodes such as the posterior cingulate and lingual gyri, and precuneus were less frequently involved in BD membership. This finding is consistent with network analyses presenting dysconnectivity within the parieto-occipital and default mode network loops in BD (Gadelkarim et al., 2014; Nortje et al., 2013; Vederine et al., 2011).
Collectively, BD is dysconnected both globally and at the highest connected subnetwork, and when defined in an anatomically precise manner reveals the involvement of the basal ganglia in addition to frontolimbic components. These changes were confirmed when subjects with BD type II (N = 6) were removed. Furthermore, findings were confirmed in a euthymic cohort when removing BD subjects with moderate-to-severe HDRS/HARS scores; thus, they may be considered trait features of BD. These findings suggest a neuroanatomical model of BD dysconnectivity that preferentially involves communication within and between emotion-regulatory and reward-related subsystems, both independently associated with BD previously (Perry et al., 2018).
There is a degree of correspondence (85%) between nodes involved in the significant subnetwork (FA-weighted) and the rich-club members (NOS-weighted), further highlighting the distinction between edge-weights and their utility at examining brain topological variance. This was supported by a negative relationship observed between edge-weights in BD (Supplementary Fig. S1). Furthermore, a rich-club is not solely defined by connection strength but also accounts for connection density.
Increased rich-club connectivity in BD appeared to be driven by the female population, although this was not the case for the significant whole-brain measures and the differently connected subcomponent. Despite evidence of modulation of structure and function within cortico-subcortical regions in BD, particularly within limbic and prefrontal nodes (Jogia et al., 2012), the effect of gender on BD neuroanatomical networks has not yet been thoroughly investigated. We observed gender differences at the whole-brain and nodal level. Lower clustering and longer paths within females' anatomical networks may relate to dysconnectivity in a subnetwork encompassing frontolimbic, basal ganglia, and temporal connections seen in females but not in males. In addition, females exhibited higher global betweenness centrality compared with males. A positive relationship has been identified between centrality measures such as degree and betweenness centrality for highly connected nodes (Oldham et al., 2019), and thus, females high betweenness centrality scores may contribute to the increased rich-club connectivity seen in females with BD. Collectively, these network differences may suggest alternative pathways for communication within the female brain, and a female-specific trade-off within networks in the direction of increased integrative capacity (high betweenness centrality) at the expense of wiring and metabolic costs (Bullmore and Sporns, 2012). Furthermore, the female brain is dependent on nodes belonging to two differently specialized subsystems for communication (highlighted by increased centrality scores, betweenness centrality, and rich-club) relative to males, which may confer increased susceptibility to processes dependent on integration of emotional information in females generally, and perhaps more in females with BD. Collectively, these changes support neuroanatomical evidence of gender-specific trajectories at the human connectome level (Sun et al., 2015) and may relate to different cognitive performances seen between genders in BD (Suwalska and Łojko, 2014). Our topological findings may suggest different levels of susceptibility to BD, although further research would benefit from including further clinical measures alongside increased power to fully understand whether being female and having a diagnosis of BD lead to gender-specific connectivity changes and clinical deficits.
Conclusion
Using a graph theoretical connectome approach, we provide preliminary evidence of BD neuroanatomical dysconnectivity overlapping a subnetwork involving limbic and basal ganglia connections together and a female-driven increase in rich-club connectivity. We also report abnormalities in whole-brain integration in BD. Our findings imply a differentially dysconnected subnetwork in BD and further research should clarify the functional interplay between the two subsystems involved in relation to specific trait features of BD. This study highlights the need to account for gender differences in future analysis, which may advance our understanding of any different clinical course for women and men presenting with BD. Our data support the application of nontensor-based graph theory analyses that include cortical and subcortical brain regions defined in a subject-specific manner to optimally investigate the brains' topological arrangement and subnetwork connectivity underpinning BD, demonstrating the necessity to use more anatomical meaningful connectome reconstructions.
Footnotes
Acknowledgments
We gratefully acknowledge the participants and the support of the Wellcome-Trust HRB Clinical Research Facility and the CAMI, St. James Hospital; Andrew Hoopes, Research Technician I, MGH/HST Martinos Center for Biomedical Imaging, for FreeSurfer software support, Christopher Grogan, MSc, for his contribution to data processing, and Jenna Pittman, BSc, and Fiona Martyn, BSc, for their contribution to data handling.
Author Disclosure Statement
No competing financial interests exist.
Funding Information
This research is supported by the Irish Research Council (IRC) Postgraduate Scholarship, Ireland, awarded to Leila Nabulsi, and by the Health Research Board (HRA-POR-324) awarded to Dr. Dara M. Cannon.
Supplementary Material
Supplementary Table S1
Supplementary Figure S1
References
Supplementary Material
Please find the following supplemental material available below.
For Open Access articles published under a Creative Commons License, all supplemental material carries the same license as the article it is associated with.
For non-Open Access articles published, all supplemental material carries a non-exclusive license, and permission requests for re-use of supplemental material or any part of supplemental material shall be sent directly to the copyright owner as specified in the copyright notice associated with the article.