
Abstract
Traditional diagnostic systems for neurodevelopmental disorders define diagnostic categories that are heterogeneous in behavior and underlying neurobiological alterations. The goal of this study was to parse heterogeneity in a core executive function (EF), cognitive flexibility, in children with a range of abilities (N = 132; children with autism spectrum disorder, attention-deficit/hyperactivity disorder [ADHD], and typically developing children) using directed functional connectivity profiles derived from resting-state functional magnetic resonance imaging data. Brain regions activated in response to a cognitive flexibility task in adults were used to guide region-of-interest selection to estimate individual connectivity profiles in this study. We expected to find subgroups of children who differed in their network connectivity metrics and symptom measures. Unexpectedly, we did not find a stable or valid subgrouping solution, which suggests that categorical models of the neural substrates of cognitive flexibility in children may be invalid. Exploratory analyses revealed dimensional associations between network connectivity metrics and ADHD symptomatology and EF ability across the entire sample. Results shed light on the validity of conceptualizing the neural substrates of cognitive flexibility categorically in children. Ultimately, this work may provide a foundation for the development of a revised nosology focused on neurobiological substrates as an alternative to traditional symptom-based classification systems.
Introduction
Autism spectrum disorder (ASD) and attention-deficit/hyperactivity disorder (ADHD) are prevalent neurodevelopmental disorders most commonly diagnosed in the United States according to a symptom-based classification system, the Diagnostic and Statistical Manual (DSM) of Mental Health Disorders 5 (American Psychiatric Association, 2013). Although these disorders are characterized by separate core deficits (in ASD, social communication deficits and restricted and repetitive behaviors [RRBs]; in ADHD, primarily inattentive and/or hyperactive and impulsive symptoms), overlap in behavioral presentation and biological substrates obfuscate the distinctions between these diagnostic categories.
Mixed evidence for distinct diagnostic categories suggests that an alternative diagnostic system focusing on the full range of variation in behavior (i.e., Research Domain Criteria [RDoC]) (Cuthbert and Insel, 2013) may be better-suited to identify individuals with a common biological pathway to abnormality. The RDoC framework opts to model behavior dimensionally, but moves away from focusing on DSM symptoms and toward neurobiologically validated functional constructs (Garvey et al., 2016). As a first step toward developing an improved nosology for neurodevelopmental disorders, this study aims to use individual connectome mapping to identify subgroups of children based on the functional construct of cognitive flexibility. We start with the hypothesis that there should in principle be a way to work toward developing a nosology of neurodevelopmental disorders that is based on biological underpinnings, rather than clinician observation alone.
Traditional diagnostic systems for mental disorders are limited in that they define diagnostic categories that have high biological and behavioral heterogeneity and cannot always accurately predict treatment responsiveness or prognosis. In addition, there are high rates of comorbidity between diagnostic groups, with rates of comorbid ADHD in children with ASD ranging from 37% to 85% (Leitner, 2014). Numerous studies have demonstrated the detrimental impact of comorbidity between ASD and ADHD diagnoses, citing poorer adaptive functioning and health-related quality of life (Sikora et al., 2012). Furthermore, there is strong evidence for shared heritability of ASD and ADHD (Ghirardi et al., 2018; Rommelse et al., 2010) as well as shared brain endophenotypes (Rommelse et al., 2011).
An alternative nosology based on neurobiologically homogeneous subgroups will aid in the ultimate goal to identify children who stand to benefit from targeted treatments specific to their brain network connectivity alterations (Cuthbert, 2014). Due to the controversies surrounding the separability of ASD and ADHD diagnostic categories based on both biological and behavioral characteristics, we propose that children with one disorder or the other should be considered together in an effort to develop an alternative nosology. This conceptualization is in line with the RDoC approach, which advocates for single studies to span multiple diagnostic groups (Cuthbert, 2014).
Within the RDoC framework, neurobiologically validated functional constructs such as executive function (EF) are prioritized. There is significant variability among children with ASD and ADHD concerning deficits in a specific subdomain of EF—cognitive flexibility (Dajani et al., 2016). Cognitive flexibility is the readiness with which one can switch between mental processes to appropriately respond to environmental stimuli (Scott, 1962). Cognitive flexibility is typically measured in the laboratory with set-shifting or task-switching behavioral paradigms, and requires reconfiguration of one's response set to a new goal [see Dajani and Uddin (2015) for review].
Cognitive flexibility undergoes protracted development across childhood to young adulthood (Anderson et al., 2008), supporting a wide range of behaviors that impact life outcomes (Diamond and Lee, 2011). In childhood, effective cognitive flexibility predicts better math and reading abilities (Bull et al., 2008) and social/emotional development such as false belief understanding (Farrant et al., 2012). Deficits in cognitive flexibility can occur in healthy children and adults without accompanying mental illness, but deficits are more prevalent in almost every psychiatric population (Diamond and Lee, 2011; McTeague et al., 2016). ASD/ADHD comorbidity has been associated with higher rates of clinically impaired cognitive flexibility than children with either disorder alone (Dajani et al., 2016; Yerys et al., 2009).
Person-centered studies, which take into account within-population heterogeneity, substantiate evidence that the majority of (but not all) children with ASD and ADHD exhibit severe cognitive flexibility deficits (Fair et al., 2012a; Gioia et al., 2002). Deficits in cognitive flexibility are particularly concerning because they are related to higher levels of core symptomatology in both ASD and ADHD: elevated RRBs in children with ASD and worse hyperactive/impulsive symptoms, oppositional defiant disorder symptoms, and lower intelligence in children with ADHD (D'Cruz et al., 2013; Lopez et al., 2005; Roberts et al., 2017). Furthermore, behavioral interventions that improve cognitive flexibility have shown to also ease associated psychiatric symptoms (Tamm et al., 2014). Established flexibility-specific interventions exist that improve deficits in children with ASD and ADHD (Kenworthy et al., 2014; Tamm et al., 2014). EF and cognitive flexibility deficits that are left untreated may persist and impact social competence and friendship quality in adolescence (Lieb and Bohnert, 2017; Rosenthal et al., 2013). Thus, it is imperative that researchers develop a reliable method to identify children who exhibit the most severe cognitive flexibility deficits.
As a basis for an alternative diagnostic nosology, we leverage the strength of neurobiological variables due to the many limitations of behavior-based classifications (Waterhouse and Gillberg, 2014). Most notably, behavior does not map one-to-one to underlying neurobiology (Pessoa, 2014), meaning that many disparate brain alterations may manifest as a singular phenotype [e.g., redundancy, see Licinio and Wong (2013)]. This is especially problematic if treatments only benefit subgroups of children with similar underlying neurobiological deficits (Loth et al., 2016).
Our group recently demonstrated that subgrouping approaches applied only to behavioral variables do not map well onto neurobiologically defined metrics. We developed an EF-based classification system based on parent report and behavioral measures collected from a mixed group of typically developing (TD) children and children with ASD, ADHD, and comorbid ASD and ADHD. This behavior-based classification system identified three classes of children with “above average,” “average,” and “impaired” EF (Dajani et al., 2016). Importantly, these three EF classes did not represent neurobiologically distinct subgroups, as assessed by functional connectivity metrics indexing the integrity of large-scale functional brain networks important for cognition (Dajani et al., 2019). These data underscore the importance of moving beyond behavioral observations and focusing to a greater extent on differences in underlying neurobiological mechanisms of these disorders. Here, using the same data set as that utilized in our previous work (Dajani et al., 2016, 2019), we focus on resting-state functional connectivity among brain regions important for cognitive flexibility. Focusing on this highly heterogeneous sample of children with a wide range of EF abilities, we investigate whether a data-driven clustering method can reveal meaningful categories using brain-derived features. The goal was to explore whether alternate categories derived from brain functional connectivity metrics (rather than DSM diagnosis or behavioral profile) might better parse the data, and to identify subgroups of children with similar brain network connectivity profiles or “connectomes.” Our study applies a cutting-edge method called Group Iterative Multiple Model Estimation (GIMME) (Gates and Molenaar, 2012) to construct individual-level connectomes by combining structural equation modeling (SEM) and unsupervised machine learning.
Most studies intending to characterize the neurobiological underpinnings of ASD and ADHD do not aim to understand the heterogeneity inherent to each disorder, but instead effectively treat this variability as noise (Lenroot and Yeung, 2013). As a result, only two published studies have investigated subgroups of children with ADHD based on functional connectivity metrics, and no study has examined brain network connectivity-based subgroups in ASD. In ADHD, five subgroups have been found that differ in connectivity of frontoparietal regions (Gates et al., 2014), whereas three subgroups emerged that differed in connectivity of reward-related networks [i.e., nucleus accumbens/whole-brain connectivity (Costa Dias et al., 2015)]. We previously showed that three subgroups exist among children with ASD, ADHD, and TD children differing in their levels of cognitive flexibility (Dajani et al., 2016). As no prior work on network connectivity-based clustering of such a heterogeneous sample exists, we speculate based on the available scant literature that three clusters might emerge that differ on network connectivity profiles important for implementing cognitive flexibility.
Following the results of our previous study (Dajani et al., 2016), we hypothesize that one subgroup will include predominantly older TD children with average to above average EFs and low levels of psychopathology. This subgroup may exhibit network connectivity that resembles mature, adult-like networks, characterized by strong, positive connectivity within the frontoparietal network (FPN), negative functional connectivity between the default mode network (DMN) and FPN (Fair et al., 2012b; Satterthwaite et al., 2013), and integration between the salience network (SN), FPN, and subcortical nodes (Marek et al., 2015; Morgan et al., 2018). We expect another subgroup to include predominantly younger TD children with less mature network profiles, including weaker within-network connectivity (Bassett et al., 2018), stronger between-network connectivity, and weaker integration between task-positive networks. In line with the delayed maturation hypothesis (van Rooij et al., 2018), we expect this group to also include older children with ADHD who have intact EFs. Children with ASD without elevated comorbid ADHD symptomatology may also comprise this subgroup. Finally, we expect a third subgroup will include children with ADHD and ASD with impaired EFs, elevated general psychopathology (Martel et al., 2017), and aberrant modular architecture of brain networks (Xia et al., 2018), which may present as weak connectivity within the FPN and higher FPN-DMN connectivity (Stevens et al., 2018; Zhong et al., 2014). Note that we do not aim to formally test categorical versus dimensional models in the current work. Rather, we wish to explore whether features derived from brain functional connectivity metrics yield meaningful categories that might improve upon traditional diagnostic categories.
Methods
Participants
Participants ages 8 to 13 years (N = 132) included a subset of children used in our previous study investigating heterogeneity in EF ability in TD, ADHD, and ASD groups (Dajani et al., 2016). Written informed consent was obtained from all legal guardians and written assent was obtained from all children. All procedures were approved by the Institutional Review Board at the Johns Hopkins School of Medicine and all methods were carried out in accordance with the approved guidelines.
Diagnostic and neuropsychological measures
Community diagnoses of ASD were confirmed with the Autism Diagnostic Observation Schedule-Generic (ADOS-G) (Lord et al., 2000) or Autism Diagnostic Observation Schedule, Second Edition (ADOS-2) (Lord et al., 2012), based on study enrollment date, and the Autism Diagnostic Interview-Revised (ADI-R) (Lord et al., 1994). All participants with ASD scored ≥7 on the total score on the ADOS-2 or the communication and social interaction score on the ADOS-G. All participants with data for the ADI-R (n = 34, 94% of ASD sample) met criteria for ASD based on established cutoffs on the ADI-R (≥10 for social interaction, ≥8 for communication/language, and ≥3 for RRBs) except for one ASD participant. This participant was still included in the ASD group because he or she met the criteria based on the ADOS-G (communication and social interaction score: 13).
The Diagnostic Interview for Children and Adolescents IV (DICA-IV) (Reich et al., 1997) was used to confirm community ADHD diagnoses, determine whether children with ASD had comorbid ADHD, and for exclusionary purposes. Community diagnoses of ADHD were also confirmed with the Conners' Parent Rating Scales -Revised, Long Version (CPRS-R:L) (Conners, 1997) or Conner's Parent Rating Scales-Third Edition, Full-length (CPRS-3) (Conners, 2008), based on study enrollment date and the ADHD Rating Scale IV, Home version (DuPaul et al., 1998). All participants with ADHD met criteria based on the DICA-IV, except for one child who had missing data. This child met the criteria based on both the CPRS-3 and the ADHD Rating Scale IV. TD participants all had T-scores <65 on both the Hyperactive/Impulsive or Inattentive scales of the Conners' and only met criteria for ≤3 symptoms on either the Hyperactive/Impulsive or Inattention scales of the ADHD Rating Scale IV. See Tables 1 and 2 for detailed diagnostic information.
Sample Demographics and Diagnostic Information (Low Motion Subsample)
Numbers for each of the following racial categories presented in the following order: African American, Asian, Biracial, Caucasian.
WISC-IV full-scale IQ.
Mean framewise displacement for raw resting-state functional magnetic resonance imaging data calculated in FSL.
Number of children with left, ambidextrous, right handedness.
Handedness is presented in the following order: left, ambidextrous, right. TD group was older than ADHD group (p = 0.037).
ADHD, attention-deficit/hyperactivity disorder; ADHD-C, ADHD-Combined; ADI, Autism Diagnostic Interview; ADHD-I, ADHD-Inattentive; ADOS-2, Autism Diagnostic Observation Schedule, Second Edition; ADOS-G, Autism Diagnostic Observation Schedule-Generic; ASD, autism spectrum disorder; CD, conduct disorder; CS, communication and social interaction; GAD, generalized anxiety disorder; H/I, hyper/impulsive; Hyp, hyperactivity; Inatt, inattention; MDD, major depressive disorder; OCD, obsessive-compulsive disorder; ODD, oppositional defiant disorder; RRB, restricted and repetitive behavior; TD, typically developing.
Regions of Interest Used in Group Iterative Multiple Model Estimation Analysis
All regions in the FPN, SN, and SUB were active in response to flexibility trials during the Flexible Item Selection Task. Regions within the DMN were more active for control trials compared with flexibility trials. Specific coordinates were chosen from the Power et al. (2011) atlas.
dACC, dorsal anterior cingulate cortex; DMN, default mode network; FEF, frontal eye fields; FPN, frontoparietal network; lFEF, left FEF; lIFJ, left inferior frontal junction; lSPL, left SPL; MNI, Montreal Neurological Institute; PCC, posterior cingulate cortex; rFEF, right FEF; ROI, region of interest; rSPL, right SPL; SN, salience network; SPL, superior parietal lobule; SUB, subcortical network; vmPFC, ventromedial prefrontal cortex.
Measures
Autism Diagnostic Interview-Revised
The ADI-R (Lord et al., 1994) is a parent clinical interview that assesses key diagnostic features of autism in the categories of reciprocal social interaction, communication, and repetitive/stereotyped behaviors.
ADOS-G and ADOS-2
The ADOS-G (Lord et al., 2000) and ADOS-2 (Lord et al., 2012) are child semistructured interactions that focus on social and communicative behaviors in children. Participants recruited before the release of the ADOS-2 received the ADOS-G.
Conners' Parent Rating Scales
The CPRS-R:L (Conners, 1997) and the CPRS-3 (Conners, 2008) are parent reports of their child's symptoms of ADHD, oppositional defiant disorder, and conduct disorder. T-scores of 60 or higher on the DSM-IV (for the Revised version) and DSM-IV-TR (for the Third Edition) Hyperactive/Impulsive or Inattentive scales were used to confirm community ADHD diagnoses. TD participants who had T-scores >65 on either the Hyperactive/Impulsive or Inattentive scales were excluded from the study.
ADHD-RS-IV, Home version
The ADHD Rating Scale-IV, Home version (DuPaul et al., 1998) is a parent report of their child's ADHD symptoms over the previous 6 months. Community diagnoses of ADHD were confirmed if children met six out of nine DSM-IV symptoms on either the Hyperactive/Impulsive or Inattention scales. TD participants who met four out of nine symptoms on either the Hyperactive/Impulsive or Inattention scales were excluded from the study.
Diagnostic Interview for Children and Adolescents IV
The DICA-IV (Reich et al., 1997) is a structured parent interview to evaluate current psychiatric diagnoses in the child. The Attention Deficit Disorder subscale was used to (1) confirm community ADHD diagnoses and (2) to determine whether the children with community ASD diagnoses also had comorbid ADHD. Any child who met criteria for conduct disorder, mood disorder, generalized anxiety disorder, or obsessive-compulsive disorder was excluded from the study. TD children who met criteria for any disorder were excluded. Scores on the DICA-IV and clinical judgment by a child neurologist (S.H.M) determined ADHD subtype.
Child Behavior Checklist
The Child Behavior Checklist (CBCL) (Achenbach, 1991) is a parent report of children's emotional and behavioral problems. The social problems subscale was used to index social communication and interaction symptoms that are a hallmark of ASD. This subscale is internally consistent (a = 0.82), test/retest reliable (r = 0.90), and validly distinguishes between children with and without an ASD diagnosis (Achenbach and Rescorla, 2001; Mazefsky et al., 2011). T-scores between 67 and 69 represent the borderline clinical range; T-scores ≥70 are considered clinically elevated.
Repetitive Behavior Scale-Revised
The Repetitive Behavior Scale-Revised (RBS-R), Bodfish et al., 2000) is a parent report of six domains of RRBs: rituals, sameness, self-injurious behavior, stereotypic behavior, compulsive behavior, and restricted interests. The subscales have poor to good inter-rater reliability (0.55–0.78) and test/retest reliability (0.52–0.96). Total RRBs and a subdomain of RRBs, insistence on sameness, have been shown to be correlated with deficits in cognitive flexibility in ASD (Lopez et al., 2005; Miller et al., 2015), and therefore, the total score and sameness indices were used in this study. Higher scores indicate greater impairment.
Behavior Rating Inventory of Executive Function
The Behavior Rating Inventory of Executive Function (BRIEF) (Gioia et al., 2000) is a parent report of EF impairment of children 5–18 years of age. All T-score subscales were used to assess EF impairment: Inhibit, Monitor, Shift, Emotional Control, Initiate, Working Memory, Plan/Organize, and Organization of Materials. To avoid redundant analyses, we did not analyze the composite scores, which are combinations of the subscales (Behavioral Regulation Index, Metacognition Index, and Global Executive Composite). The subscales are reliable in normative (r = 0.76–0.85) and clinical samples (r = 0.72–0.84) and can distinguish clinical populations from TD children (Gioia et al., 2000). Higher scores indicate greater impairment, with T-scores ≥65 indicating clinical impairment.
Neuroimaging data acquisition
Children completed a mock scanning session before magnetic resonance imaging (MRI) data collection to acclimatize them to the scanning environment. Resting-state functional MRI (rs-fMRI) data were acquired for participants on a Phillips 3T scanner using an 8-channel head coil (repetition time [TR] = 2.5 sec, flip angle = 70°, sensitive encoding acceleration factor = 2, 3 mm slices, voxel size = 2.7 × 2.7 × 3 mm, 156 volumes). The first 10 volumes were immediately discarded to account for magnet stabilization. For the rs-fMRI data acquisition, children were asked to relax with their eyes open and focus on a crosshair while remaining as still as possible. High-resolution T1-weighted scans were also acquired to facilitate registration of the functional image to standard space (TR = 8.0 msec, echo time [TE] = 3.7 msec, 1 mm isotropic voxels).
Participants were asked to withhold stimulant medication (e.g., Adderall) on the day of MRI scanning, similar to prior neuroimaging studies comparing children with ASD and ADHD (Dennis et al., 2014; Di Martino et al., 2013). Nonstimulant medications were continued as prescribed (e.g., antidepressants, allergy medication). TD children were not taking any psychotropic medications. Complete information regarding medication status is provided in Supplementary Table S1. As nonstimulant medications have been shown to affect functional connectivity of the prefrontal cortex (Fischer et al., 2016; Rae et al., 2016; Wu et al., 2007), we note that this confound represents a limitation of the current study.
Preprocessing
There were systematic differences in the length of rs-fMRI scans by diagnostic group (n = 16 ASD children were scanned using a 128-volume protocol, while only n = 1 TD and n = 1 ADHD child were scanned using this shorter scan length protocol). To maximize power to estimate connectivity maps, which is dependent on the length of the time course, only participants with the longer protocol (156 volumes) were included in this study. Participants with maximum absolute motion in any of the six rigid directions >3 mm/degrees were excluded. Preprocessing was conducted using a combination of FMRIB Software Library (FSL) 5.0.9 (
Region-of-interest selection
The ideal set of regions-of-interest (ROIs) for this study would be regions that are consistently activated when engaging cognitive flexibility in children, identified by a meta-analysis of neuroimaging studies that used cognitive flexibility tasks. Unfortunately, no current meta-analyses of cognitive flexibility tasks exist that are specific to middle childhood. Furthermore, the meta-analyses of cognitive flexibility that do exist for adults include a mix of explicit and inductive tasks (e.g., Kim et al., 2012). Individual neuroimaging studies of cognitive flexibility in children report inconsistent results regarding regions engaged, and are therefore not ideal to guide ROI selection (Dajani and Uddin, 2015). Due to the numerous advantages of the Flexible Item Selection Task (FIST), including its established reliability and validity, we opted to use the activation-based results of a study of the FIST in adults to inform ROI selection for this study (Dajani DR, et al., 2019, Cognitive flexibility: from task validity to individual connectome mapping. In review). Further supporting the use of the FIST in guiding ROI selection, the laboratory-based version of this task has been validated in children (Dick, 2014) and has previously been used in a study of children with ASD (Yerys et al., 2012).
A full description of the FIST study from which we selected ROIs is available in a forthcoming publication (Dajani DR, et al., 2019, Cognitive flexibility: from task validity to individual connectome mapping. In review). First, we identified cortical and subcortical brain regions that were activated over-and-above basic visual and motor processes associated with the task (Flexibility > Control contrast, see Supplementary Data and Supplementary Fig. S1). In addition, to define regions within the DMN, which generally deactivate when engaging in cognitive flexibility, we identified regions that were more active during the visual motor control than for the flexibility trials (Control > Flexibility contrast). Next, to facilitate network analyses and interpretations, we used an atlas (Power et al., 2011) to identify specific ROI coordinates and assign ROIs to networks. Nodes within four large-scale networks integral to cognitive flexibility were included: FPN, SN, DMN, and the subcortical network (SUB) (Niendam et al., 2012; Vatansever et al., 2016). We chose a subset of nodes within each network of interest by prioritizing nodes with the greatest activation or deactivation magnitudes in response to the FIST and excluding nodes located in the same anatomical region (Fig. 1 and Table 2). For example, if two ventromedial prefrontal cortex (vmPFC) nodes in the parcellation fell within the DMN, we selected the node that corresponded with the one exhibiting the highest z magnitude in our FIST study. Within the FPN, we included the left inferior frontal junction (lIFJ), bilateral frontal eye fields (FEF), and bilateral superior parietal lobule (SPL). Within the SN, we included bilateral anterior insula (AI) and the dorsal anterior cingulate cortex (dACC). Within the DMN, we included the vmPFC, posterior cingulate cortex (PCC), and bilateral temporal poles. Finally, within SUB, we included bilateral globus pallidus and thalamus.
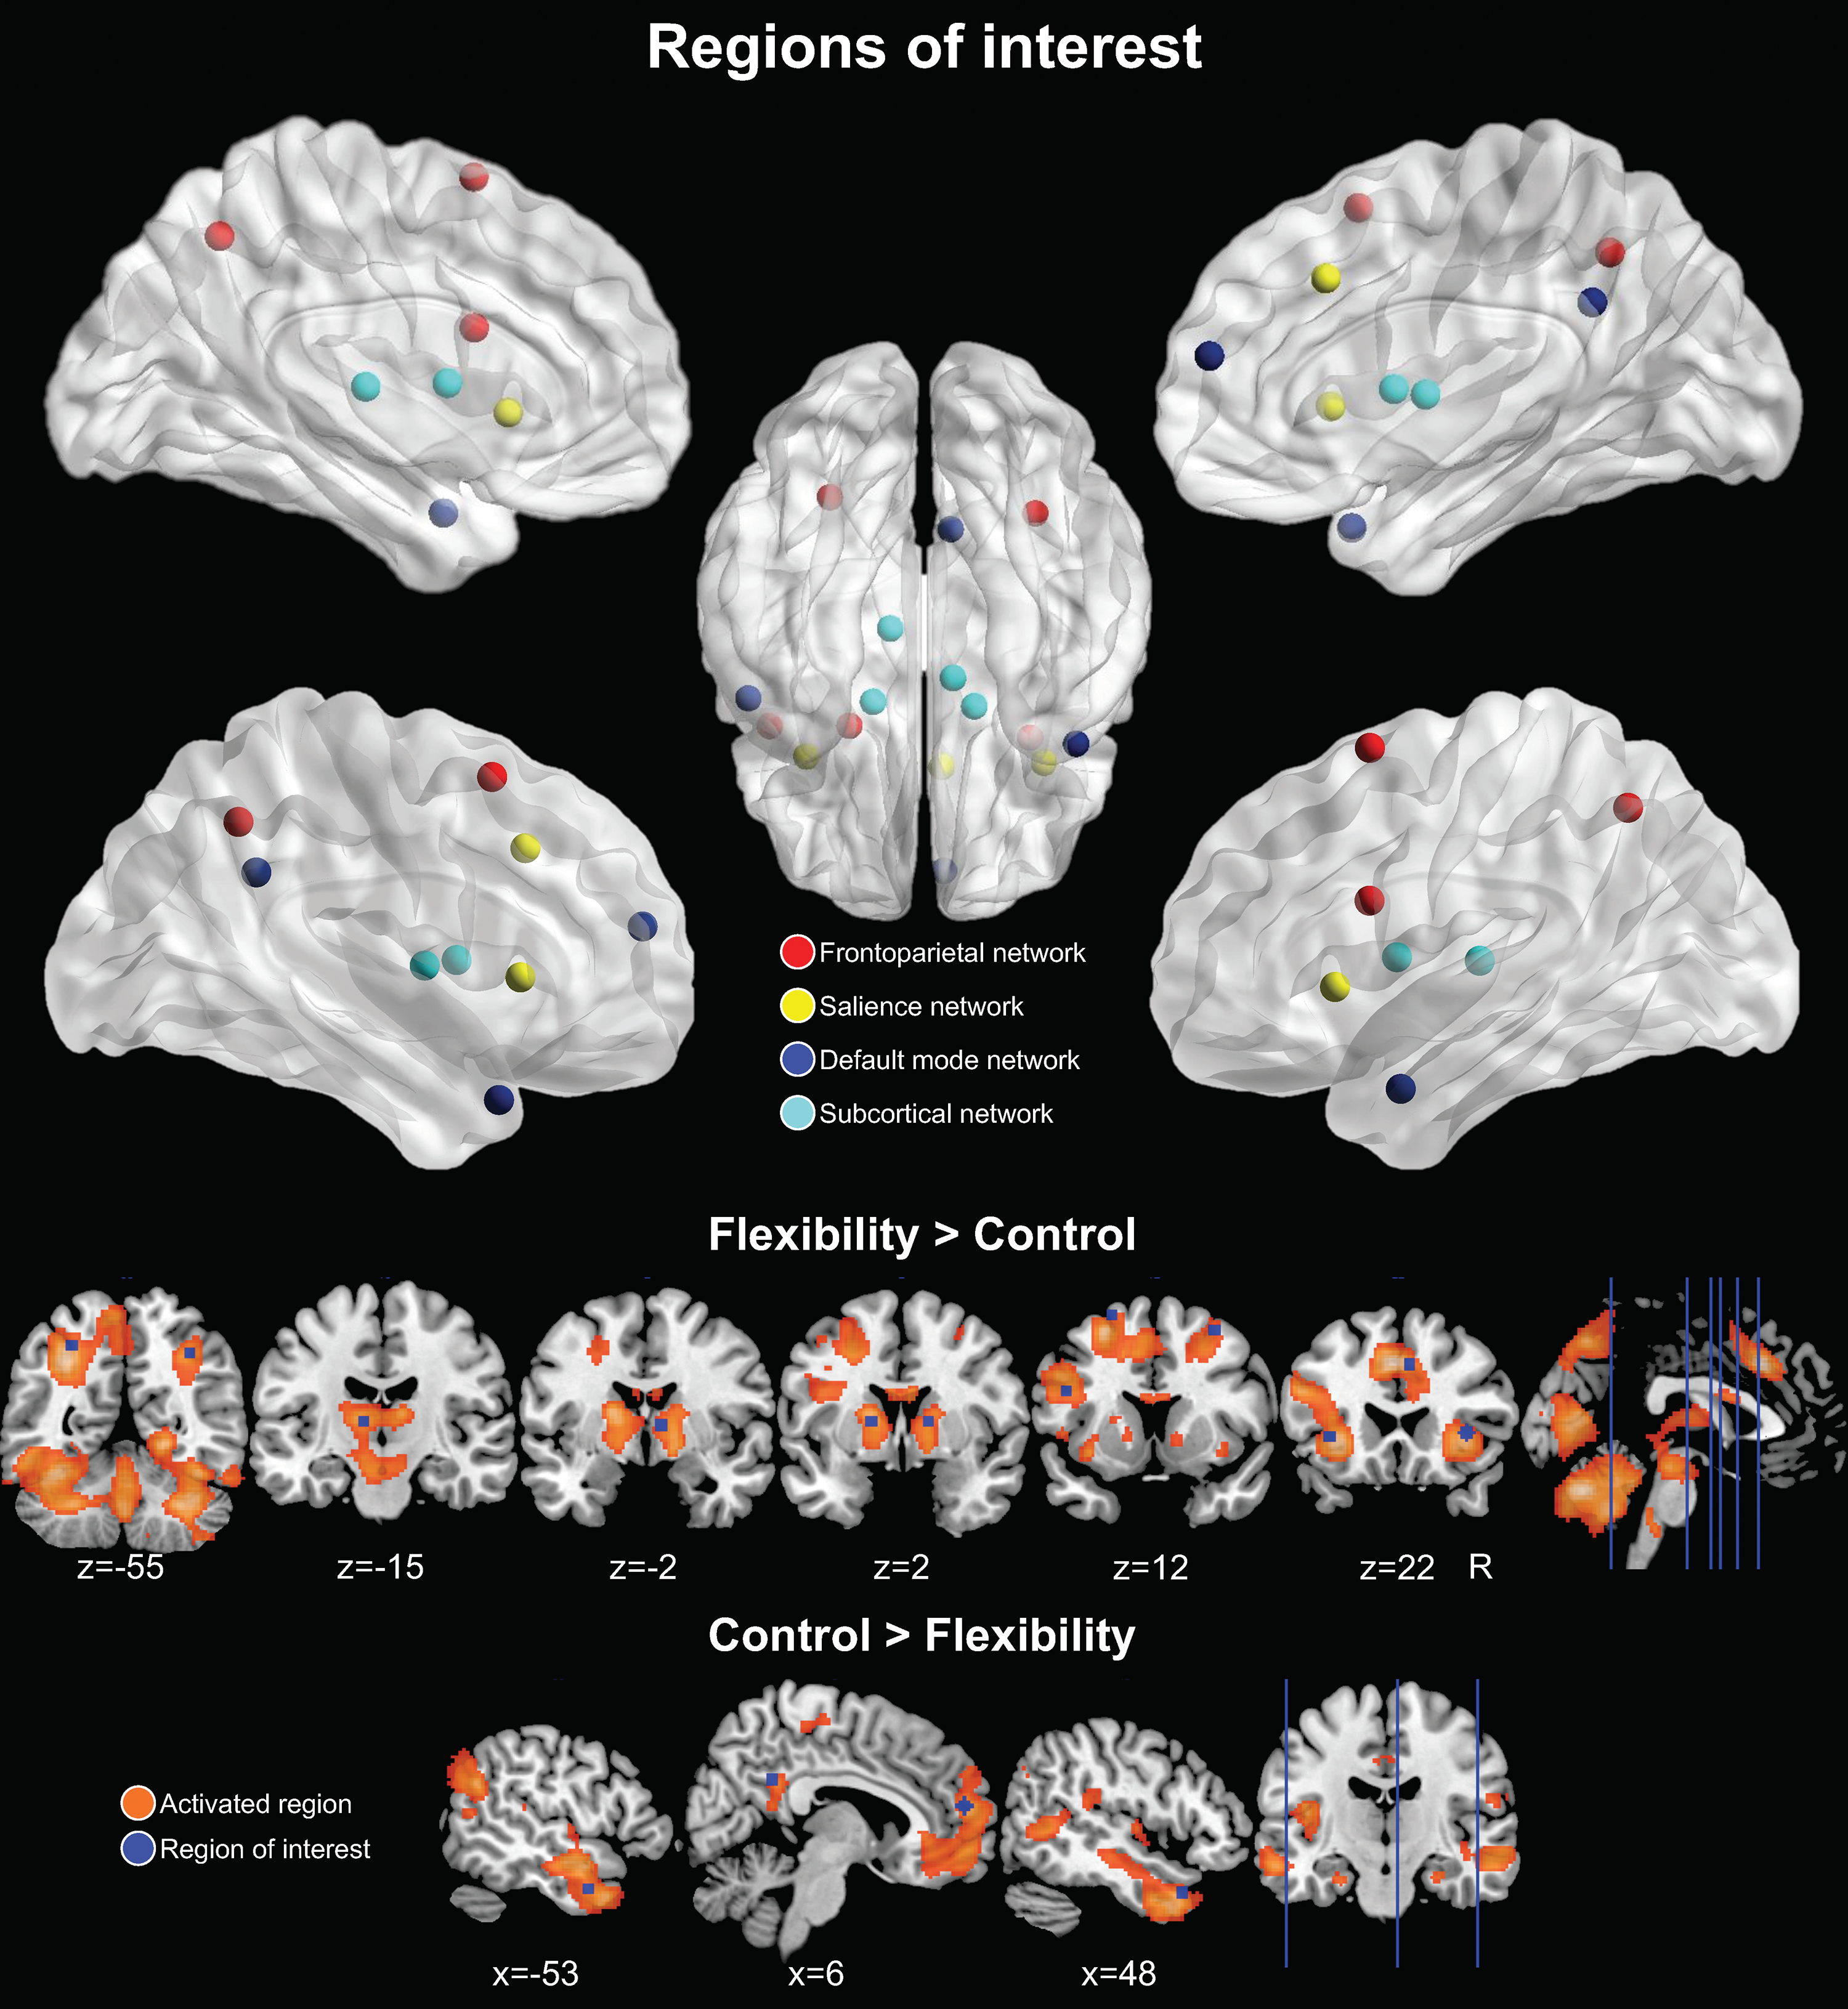
ROIs. Sixteen ROIs used in the GIMME network connectivity analysis. Regions were chosen based on their activation (Flexibility > Control) or deactivation (Control > Flexibility) in response to the Flexible Item Selection Task. Specific coordinates were based on the Power et al. (2011) atlas to facilitate categorization within large-scale brain networks (frontoparietal, salience, default mode, and subcortical). Brain nodes in upper panel were visualized with BrainNet Viewer (
The SEM-based connectivity analysis utilized here (GIMME) does not perform well with large numbers of ROIs. Accordingly, to reduce the total number of ROIs included, cingulo-opercular, dorsal attention, ventral attention, primary sensory, and cerebellar networks were excluded from this analysis. The analysis thus included 16 ROIs centered on the coordinates listed in Table 2 with a 4-mm-radius sphere. Time courses were averaged within each ROI and carried forward for estimation of network connectivity maps using the “GIMME” package (version: 0.4) in R (version: 3.3.1) (Gates et al., 2017; Lane and Gates, 2017).
Group-, subgroup-, and individual-level connectivity map estimation
GIMME (Gates et al., 2017) capitalizes on the strengths of the unified SEM (uSEM) framework (Gates et al., 2011; Kim et al., 2007), which is an extension of SEM to time series applications. As part of GIMME, uSEM is used to estimate effective connectivity between prespecified ROIs on the group, subgroup, and individual levels. The uSEM framework incorporates both contemporaneous (t) and time-lagged (t − 1) information between brain regions, which reliably recovers both the existence of a connection and its directionality (Kim et al., 2007). Directed connections are estimated contemporaneously, controlling for lagged and autoregressive (AR) effects. AR effects indicate the relationship between activity in a single region at time t and t − 1. The benefit of including AR effects, in addition to aiding in reliable estimation of contemporaneous effects for a given brain region, is the ability to estimate path directionality. Using a Granger causality framework (Granger, 1969), a brain region η
1 is said to Granger-cause activity in another region η
2 if η
1 explains variance in η
2 beyond the variance explained in η
2 by its AR term. Lagged directed connections are also estimated to reduce the chance for spurious contemporaneous effects, but these are not considered to represent underlying neural signals as the temporal resolution of fMRI data is much lower (i.e., seconds) compared with that of neural activity (i.e., milliseconds) (Smith et al., 2011). Instead, when using fMRI data, directional information due to underlying neural signal is best captured in contemporaneous effects. For this reason, we focus our analysis of network features on contemporaneous effects. The uSEM model is illustrated below, where A is a matrix of contemporaneous effects, F is the matrix of lagged effects with AR effects along the diagonal, η is the observed time series for a given ROI, and ζ is the residual for each point in time t.
The GIMME algorithm begins by first conducting a group-level search starting with an initial null model, and paths are iteratively added contributing to better model fit according to multiple modification indices for the majority of participants in the sample, as defined by the user (here, set at 75%). Specifically, GIMME iteratively counts the number of participants whose model would significantly improve if that path were freely estimated, and the path with the highest count is then added to the group-level model. Typically, this process begins by estimating all AR effects first, as this leads to the best performing model search procedure (Gates et al., 2017). The search procedure continues until there are no paths that would significantly improve the majority of individuals' models. Next, if the subgroup option is enabled, subgroups consisting of individuals with similar network connectivity patterns are identified using the Walktrap community detection algorithm computed on a sparse count similarity matrix that takes into account the presence of a path and its sign (i.e., positive or negative). The sparse count similarity matrix decidedly outperforms correlation-based similarity matrices according to simulation studies (Gates et al., 2017). Subgroup-level maps are constructed using an iterative path-adding approach similar to the group-level approach, using the group-level effects as a prior. GIMME adds paths that improve the model for the greatest number of individuals in the subgroup, which must be at least the majority of the sample (here, 51%). Simulation studies demonstrate that given a sample size of at least 75 participants, GIMME accurately recovers up to four subgroups even in cases where subgroup size is unequal (Gates et al., 2017). The final step estimates individual-level models by adding any additional paths to the group- and subgroup-level paths to best explain that individual's data. The individual-level model search procedure stops after meeting criteria for excellent model fit for two of four fit indices: comparative fit index (CFI ≥0.95), non-normed fit index (NNFI ≥0.95), root-mean-square error of approximation (RMSEA ≤0.05), and the standardized root-mean-square residual (SRMR ≤0.05) (Brown, 2006). These criteria were also used to identify good individual-level model fit in the current study.
Cluster validation
To determine the validity of the cluster solution arrived at using the Walktrap hierarchical clustering algorithm within the GIMME framework, stability and validity of the cluster solution were evaluated using the R package perturbR (Gates et al., 2019). This algorithm incrementally introduces noise to network edges while maintaining the original graph's overall properties and compares resulting cluster solutions with the solution for the original network (i.e., using the full sample). A stable solution will not change drastically given small changes to the network. Quantitatively, a cluster solution is said to be stable if the graph had 20% or more of its edges perturbed before the cluster solution for the rewired graph is as different as when 20% of the nodes are randomly placed into different clusters. This is quantified by two distinct, but complementary, metrics that describe the degree to which two community solutions differ: Hubert-Arabie Adjusted Rand Index (ARI) and Variation of Information (VI). To ensure that the subgrouping solution is not simply capitalizing on chance where no true subgroups exist, a relative measure of cluster solution quality (i.e., modularity) was used to compare the original cluster solution's quality with a solution obtained from a random graph that contains no clusters. The cluster solution was considered valid if modularity for the original solution is greater than or equal to the 95th percentile of modularity obtained from random graphs.
Subgroup characterization: network features
Several network metrics were calculated for each individual derived from the connectome data produced by GIMME. Since any subgroup-level inferences are predicated on the assumption that the subgroups are indeed different, we only assessed subgroup differences in network metrics if at least two stable and valid subgroups emerged from the GIMME analyses (note that this did not turn out to be the case: see Results). Otherwise, a dimensional approach was taken to assess relationships between network features and behavioral variables across the full sample.
For dimensional analyses, we explored network features for which we could make a priori hypotheses based on our previous work (e.g., rAI) (Uddin, 2015), and for which the majority of participants exhibited positive estimates of connectivity. We also examined participation coefficient (PC) for each network, which involved all ROIs. Thus, the following network features were examined: out- minus in-degree of all ROIs, total number of contemporaneous connections (based on the entire set of ROIs), and connections emerging at the group level. This included 25 total network features: (1) total number of contemporaneous connections, (2) number of paths between DMN ROIs (within DMN), (3) number of paths between SN ROIs (within SN), (4) number of paths between FPN ROIs (within FPN), (5) number of paths between SUB ROIs (within SUB), (6) number of paths between DMN and SN ROIs, (7) number of paths between DMN and FPN ROIs, (8) number of paths between DMN and SUB ROIs, (9) number of paths between SN and FPN ROIs, (10) number of paths between SN and SUB ROIs, (11) number of paths between FPN and SUB ROIs, (12–19) out/in degree for rAI and nodes that interacted with rAI (lAI, dACC, PCC, vmPFC, lIFJ, rSPL, lSPL), (20–23) DMN, SN, FPN, and SUB PC, (24) group-level connection—lSPL to rSPL, and (25) group-level connection right pallidum to right thalamus (see Results).
Prior work implicates the rAI as a hub of causal outflow, interacting with the dACC, dorsolateral prefrontal cortex, ventrolateral prefrontal cortex, and posterior parietal cortex (Supekar and Menon, 2012; Uddin et al., 2011). Therefore, we assessed relationships with out-degree of the rAI normalized by the in-degree (i.e., the number of nodes with which the rAI has an “outward” contemporaneous connection minus the number of contemporaneous connections that terminate on the rAI). Out- and in-degree was calculated using the R package “igraph” (Csardi and Nepusz, 2006).
To characterize “hyperconnectivity” and “hypoconnectivity,” the total number of contemporaneous connections was compared. Within- and between-network connectivity was calculated as the number of contemporaneous ROI-ROI connections within- and between-networks, respectively. Integration was indexed with a graph metric called the PC, which describes the relative distribution of between- and within-network connections for a given node (Guimera and Amaral, 2005). A PC approaching 1 indicates that the node's connections are evenly distributed among all networks and a PC of 0 indicates that all of a node's connections are within-network. PC was calculated for each node and averaged within network, resulting in a mean PC value for each network, following the methods of a recent network development study (Marek et al., 2015). PC was calculated using the R package “brainGraph” (Watson, 2018).
All network features were normal (skew and kurtosis <3) except for mean PC for the SUB network and connectivity strength of the right pallidum → right thalamus path, which were both leptokurtic (skew: −1.70, kurtosis: 3.84; skew: 1.37, kurtosis: 5.28, respectively).
We included the following 15 behavioral variables: age, gender, EF measures (eight subscales of the BRIEF: Inhibit, Monitor, Shift, Emotional Control, Initiate, Working Memory, Plan/Organize, and Organization of Materials), ASD (CBCL social problems, RBS sameness, and total scores), and ADHD (Conners inattentive and hyperactive/impulsive) symptom measures. As these were all exploratory analyses and the variables examined were not independent of each other, we did not correct for multiple comparisons.
All behavioral features were normal except for the RBS-R measures (skew: 2.57–2.72, kurtosis: 7.63–8.48) and the social problems measure (skew: 1.67, kurtosis: 3.08). The RBS-R measures were severely non-normal because they were zero-inflated, and therefore, relationships with RBS-R measures were examined with a zero-inflated negative binomial model with a log link using the “pscl” R package. Negative binomial models fit better than Poisson models, confirmed with likelihood ratio tests (p's < 0.001). For significant predictors in negative binomial models, exponentiated beta estimates and p-values are reported. For all other behavioral variables, associations with network features (e.g., “out-degree”) were assessed with Pearson's correlations.
Results
Preliminary analyses of head motion
To quantify the relationship between in-scanner head motion and demographic variables of interest, we characterized the relationship between mean framewise displacement (FD) (Power et al., 2012) for data following ICA-AROMA, age, and diagnostic group. A 2 × 1 repeated-measures analysis of variance demonstrated a significant decrease in mean FD following preprocessing, demonstrating the efficacy of this preprocessing pipeline, F(1, 260) = 33.00, p < 0.001 (raw: M(SD) = 0.20 (0.11), AROMA: M(SD) = 0.04 (0.02), Supplementary Fig. S2). There was no difference between the ASD, ADHD, and TD groups in mean FD for ICA-AROMA-preprocessed data (F(2,129) = 0.57, p = 0.57). Similarly, there was no association between age and motion following preprocessing (r(124) = 0.01, p = 0.89). Using the full sample (N = 132), the GIMME-derived subgroups (which did not align with diagnostic subgroups) differed significantly in mean FD for preprocessed data (F(1,130) = 16.23, p < 0.001). Therefore, GIMME with subgrouping was rerun using a low motion subsample (Table 1) to reduce potential confounding effects of motion on subgroup formation. This subsample (n = 99) included participants who were at or below the sample's 75th percentile of mean FD (≤0.239). This analysis resulted in subgroups that did not differ on motion for preprocessed data (F(2,96) = 0.14, p = 0.87). Below are the results of subgroup-GIMME with the low motion subsample (n = 99) (Fig. 2).
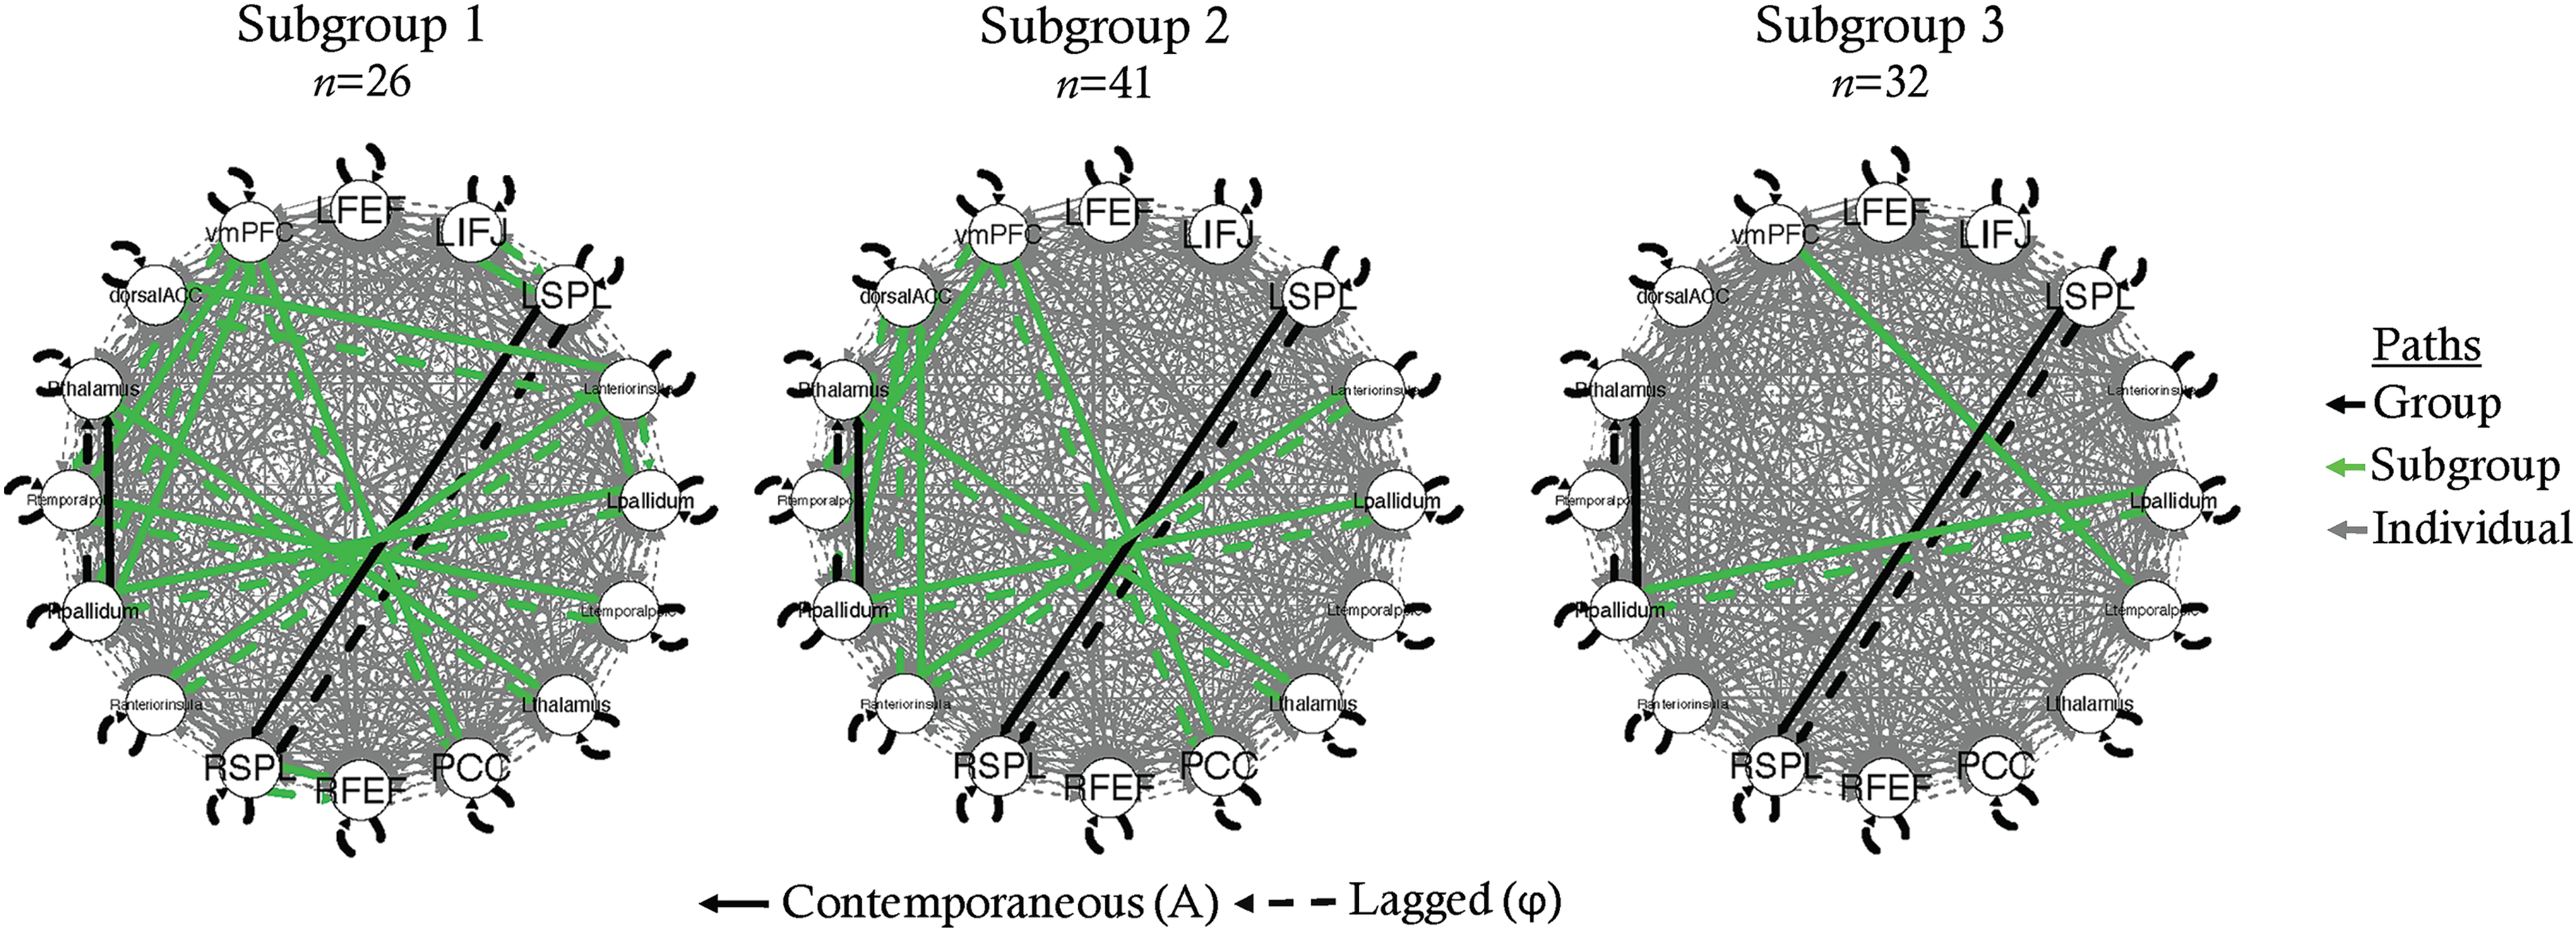
Subgroup-GIMME network models for each subgroup. dACC, dorsal anterior cingulate cortex; FEF, frontal eye fields; FPN, frontoparietal network; lFEF, left FEF; lIFJ, left inferior frontal junction; lSPL, left SPL; PCC, posterior cingulate cortex; rFEF, right FEF; ROI, region of interest; rSPL, right SPL; SPL, superior parietal lobule; vmPFC, ventromedial prefrontal cortex. Color images are available online.
Subgroup-GIMME results using low motion sample
Model fit
According to approximate fit indices, 98 out of 99 participants' models had good model fit (CFI: M(SD) = 0.95 (0.004), NNFI: M(SD) = 0.92 (0.007), RMSEA: M(SD) = 0.08 (0.007), SRMR: M(SD) = 0.03 (0.004)). The one remaining participant's model had excellent model fit according only to SRMR, demonstrating an overall acceptable model fit (CFI = 0.91, NNFI = 0.86, RMSEA = 0.11, SRMR = 0.05).
Cluster validation
Using the Walktrap hierarchical clustering algorithm, three subgroups emerged (n = 26, n = 41, n = 32; Fig. 2). According to VI, ARI, and modularity, the cluster solution attained was not stable nor valid (Fig. 3). Based on VI and ARI, only 1% of edges had to be perturbed before 20% of participants were placed into different clusters than the original solution, demonstrating that minor perturbations to the data caused large changes in the clustering solution. Modularity attained (0.02) was not better than expected by chance (95th percentile of random graphs = 0.063), suggesting that clusters are not well defined and participants in different clusters may have more in common than expected if clusters were truly distinct. Based on these results, we concluded that the clustering solution was untrustworthy. Therefore, we do not report subgroup differences in network nor behavioral features.
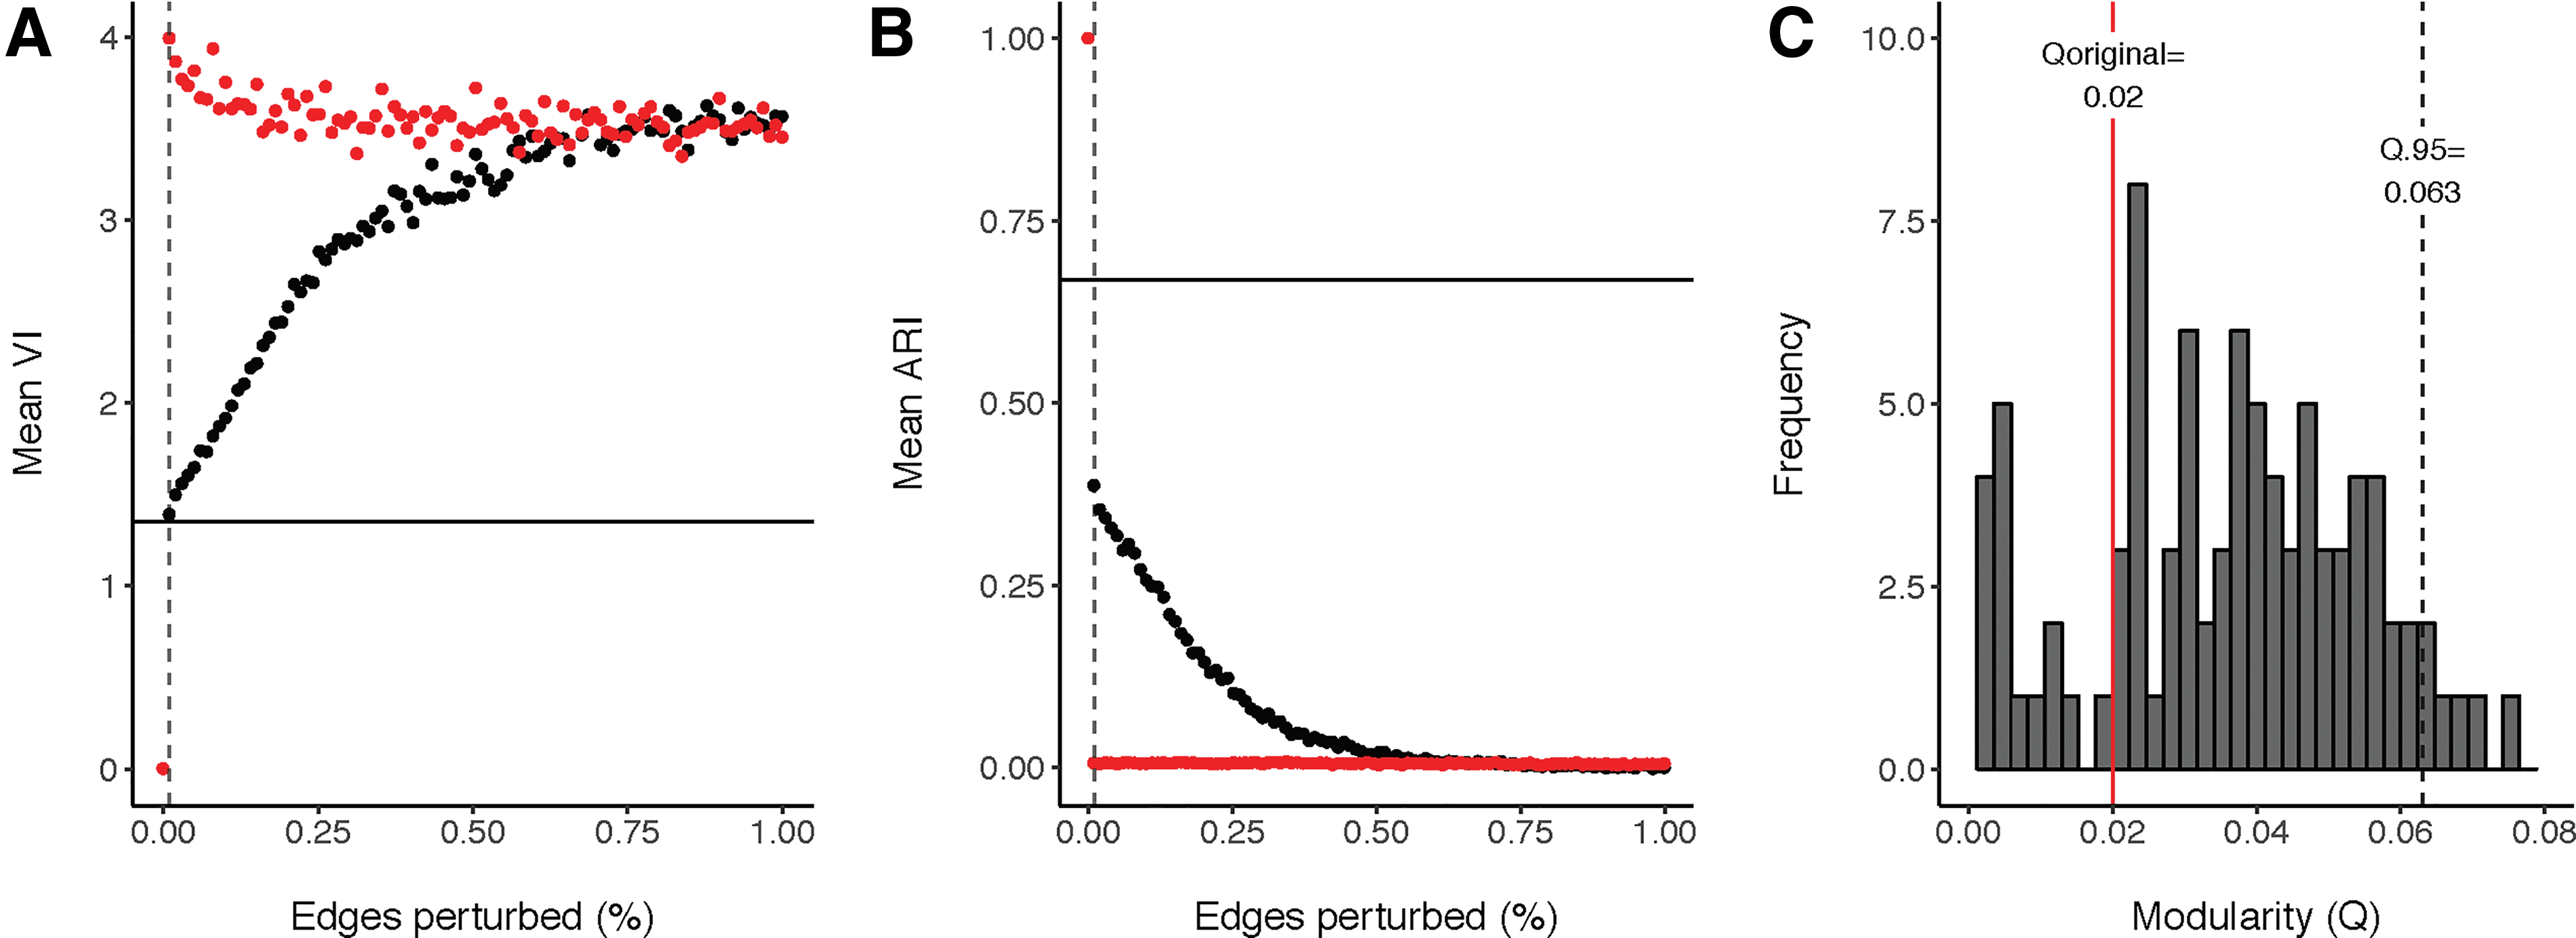
Cluster validation. Results from both VI and ARI demonstrate that the clustering solution is not stable.
GIMME results without subgrouping
As our clustering solution was not stable, we proceeded to conduct a series of exploratory dimensional analyses on the full data set (Supplementary Table S2) to follow up these null results and better interpret the findings.
Model fit
One hundred thirty out of 132 participants' models had model fit according to at least two of four approximate fit indices (CFI: M(SD) = 0.95 (0.004), NNFI: M(SD) = 0.92 (0.006), RMSEA: M(SD) = 0.08 (0.006), SRMR: M(SD) = 0.03 (0.004)). The two remaining participant's models had model fit according only to SRMR, but not in consideration of all four fit indices (CFI = 0.93, 0.92; NNFI = 0.89, 0.86; RMSEA = 0.11, 0.10; SRMR = 0.04, 0.05).
Network characterization
The group-level model included AR effects for all ROIs, one lagged effect from the right pallidum to the right thalamus, and two contemporaneous effects: right pallidum → right thalamus and lSPL → rSPL (Fig. 4). The majority of participants (n = 130) had positive estimates of connectivity from the lSPL to rSPL (M(SD) = 0.54 (0.24). Similarly, almost all participants (n = 131) had positive connectivity estimates from the right pallidum to right thalamus (M(SD) = 0.59 (0.28). An additional 476 unique lagged and contemporaneous paths were estimated at the individual level.
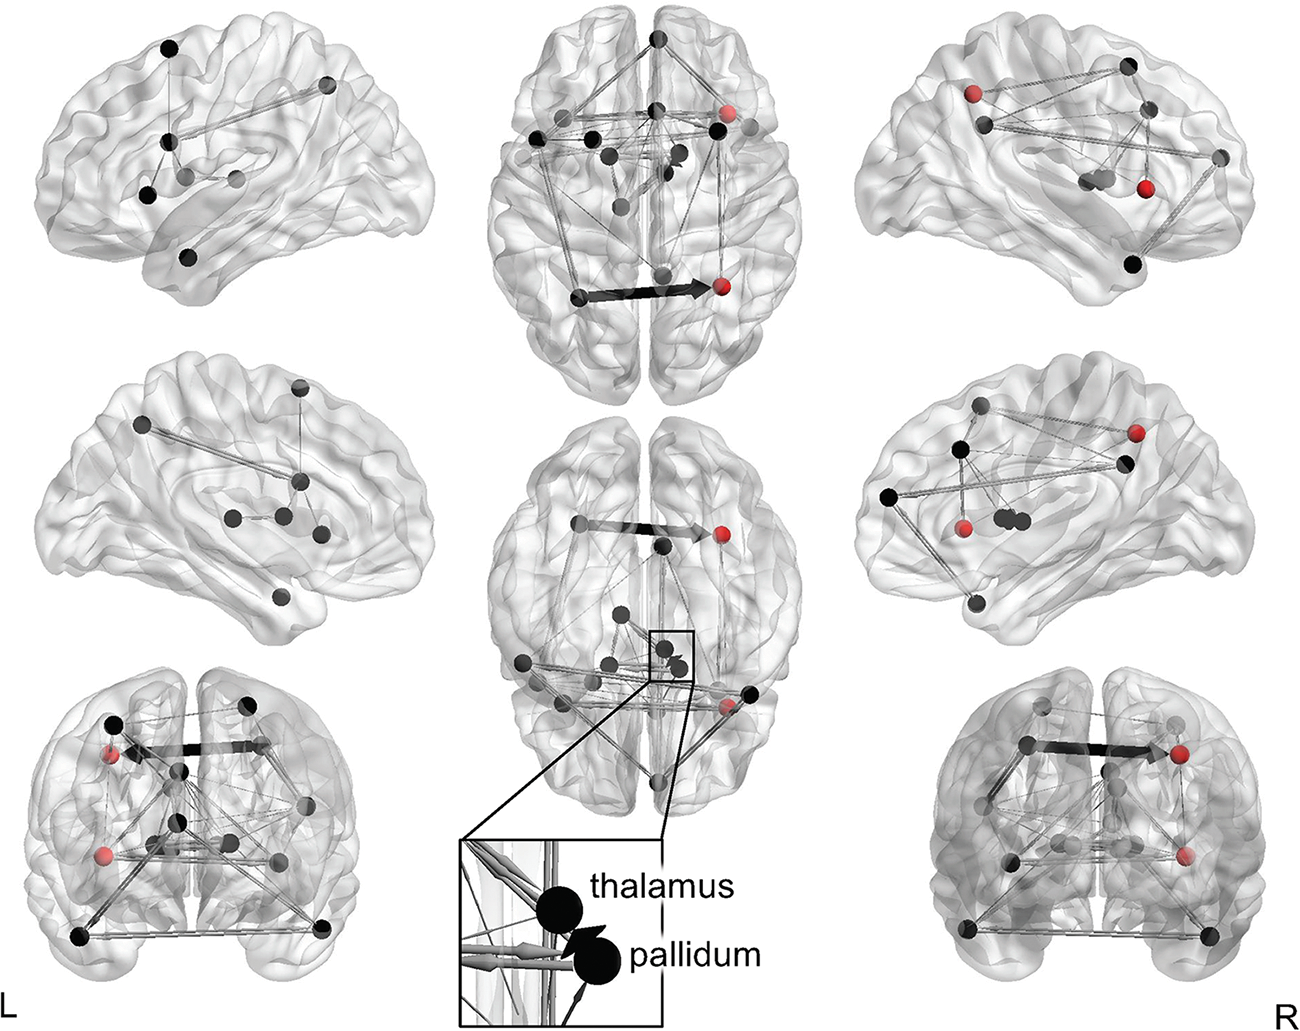
GIMME results without subgrouping. Group-level paths are in black (right pallidum → right thalamus and lSPL → rSPL) and individual-level paths are in gray. Paths that were estimated for at least 20% of participants are shown for visualization purposes. Path weights are directed and weighted according to the number of participants who had that path estimated. Nodes in red (rSPL and rAI) showed relationships between out/in degree and behavioral measures. Visualized with BrainNet Viewer (
Motion network feature associations
Motion following preprocessing was related to only one network feature: between FPN-SUB path counts, r(130) = 0.18, p = 0.043. No other network measure was related to motion after preprocessing (p's > 0.08).
Behavioral network feature associations
Next, we explored the associations between network features and behavioral features, including demographic variables, EF measures, and ASD and ADHD symptom measures.
There were a number of associations between path counts for specific regions and EF and symptom measures. Individual differences in out/in degree of the rAI were related to inattentive symptoms, r(102) = 0.20, p = 0.045 (Fig. 5). To determine whether this relationship was specific to the rAI, we also tested the out/in degree of other nodes that interact with rAI (Uddin et al., 2011): lAI, dACC, PCC, vmPFC, lIFJ, rSPL, and lSPL. The rSPL demonstrated a similar relationship with the rAI, where net inflow to the rSPL was related to lower inattentive symptoms, r(102) = 0.26, p = 0.007 (Fig. 5). To determine whether the out/in degree of the rAI and rSPL each contribute unique information to predict inattentive symptoms, a multiple regression was run including both regions as predictors. Once the rSPL was included in the model, the rAI no longer significantly predicted inattentive symptoms (B = 1.18, se = 0.66, p = 0.075), but the rSPL was still a significant predictor (B = 1.83, se = 0.71, p = 0.011). This shows that, in children, the out/in degree of the rSPL is related to inattentive symptoms above and beyond the information contributed by the rAI out/in degree. Finally, we tested whether the relationship between out/in degree of the rSPL and behavioral features was specific to inattentive symptoms. Correlation analyses revealed that out/in degree of the rSPL was also related to the EF subdomains of inhibition (r(124) = 0.18, p = 0.040), initiation (r(124) = 0.19, p = 0.037), working memory (r(124) = 0.20, p = 0.026), planning and organization (r(124) = 0.21, p = 0.020), organization of materials (r(124) = 0.21, p = 0.019), and hyperactive/impulsive symptoms (r(102) = 0.25, p = 0.011). The out/in degree of the rSPL was also related to both the logit (exp(b) = 1.22, p = 0.025) and count models (exp(b) = 1.52, p = 0.033) for RBS-R sameness behaviors. Precisely, for each unit increase in rSPL out/in degree, the odds of having zero sameness behaviors increased by 1.22. Thus, a higher rSPL out/in degree was related to the absence of parent-reported sameness behaviors. Interestingly, the result of the count model demonstrated the opposite effect, where a higher rSPL out/in degree was related to more severe sameness behaviors (for children of parents who reported the presence of sameness behaviors). Inconsistent signs across logit and count models indicate that different relationships between network features and sameness behaviors existed for the categorical case of modeling the presence or absence of sameness behaviors (logit model) and the dimensional case of modeling the severity of sameness behaviors given they were present in the first place (count model).
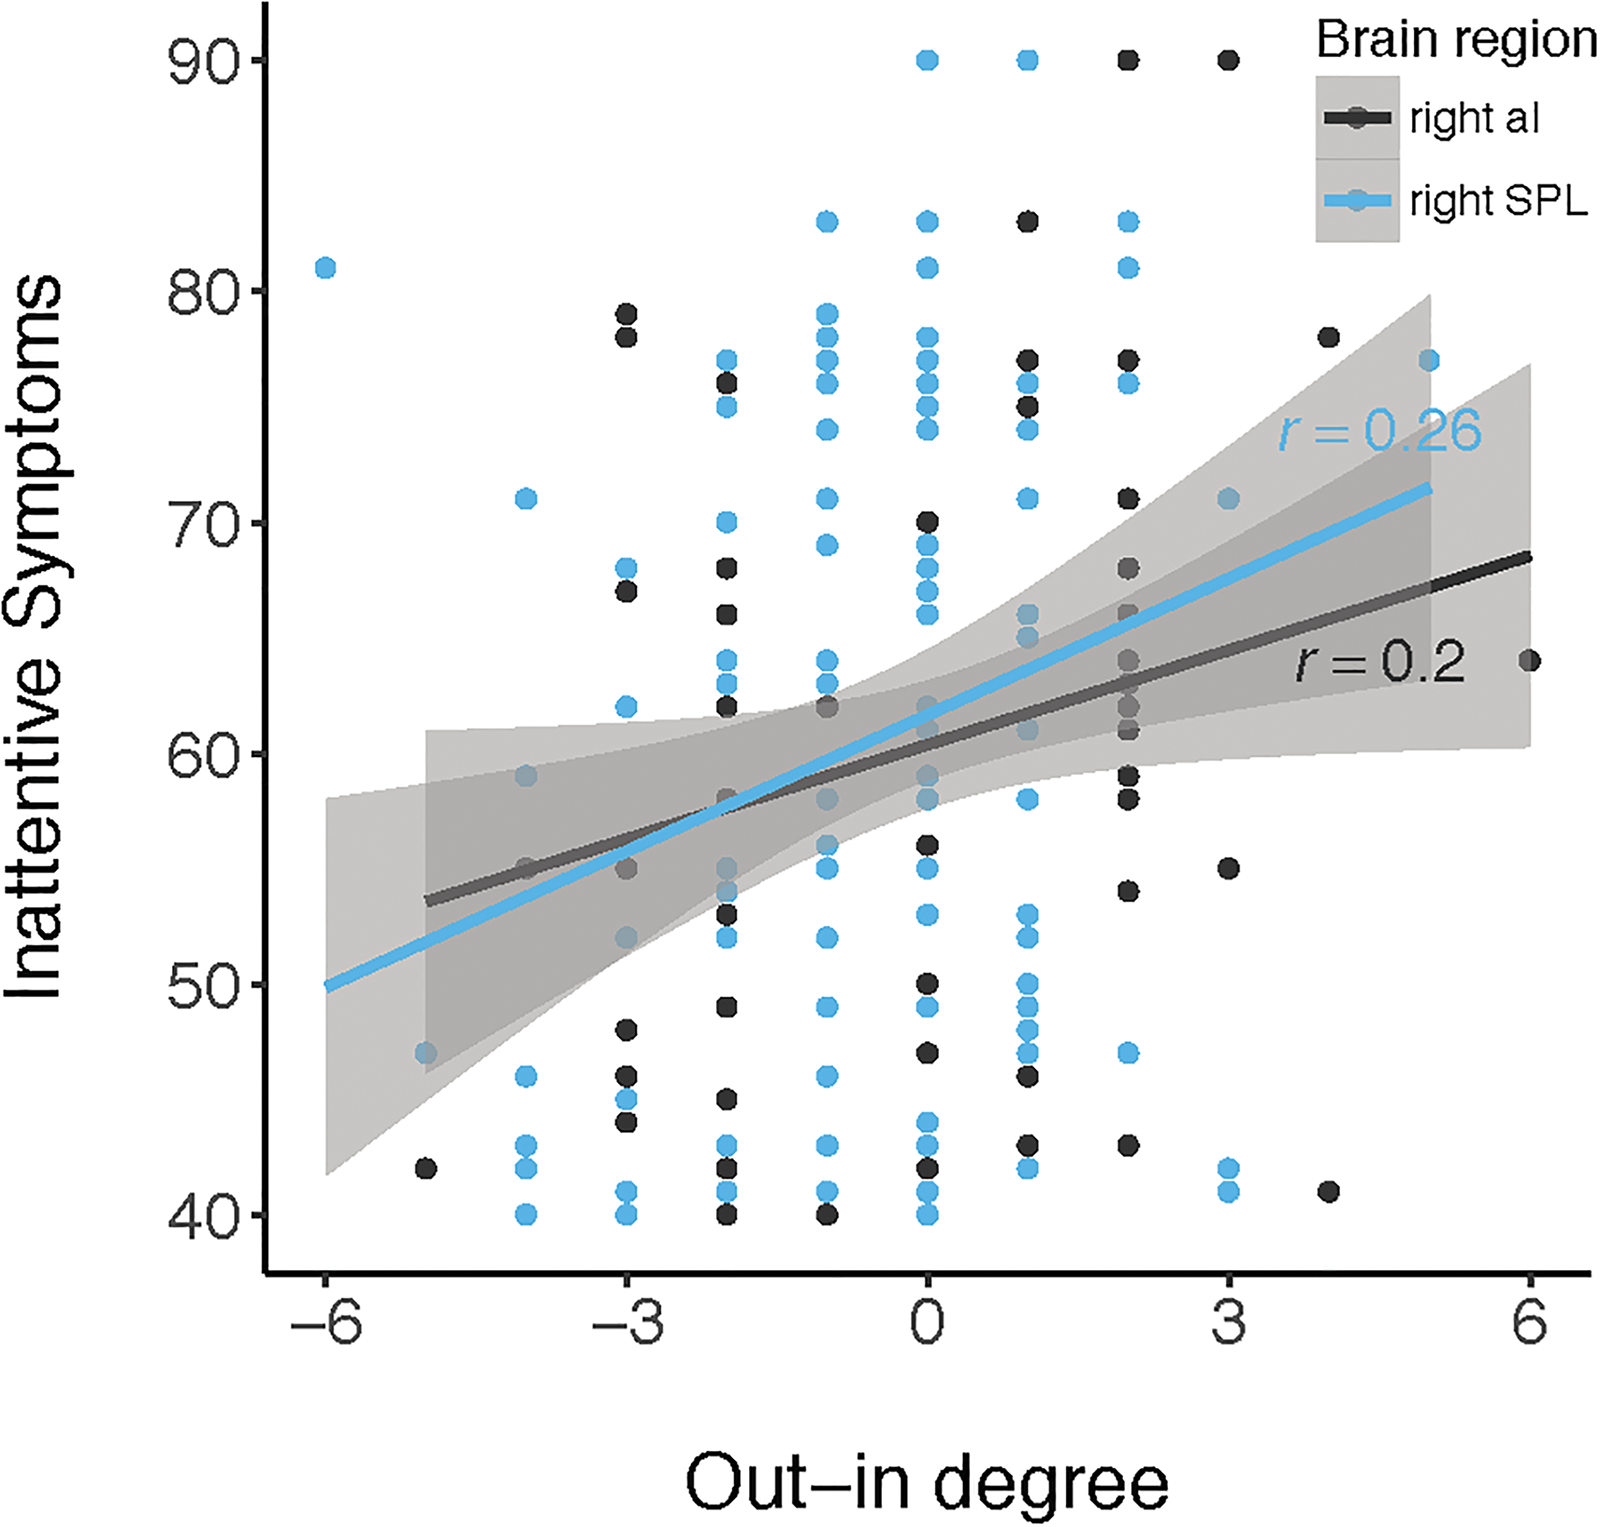
Out/in degree relates dimensionally to inattentive symptoms. Net inflow to the rAI and rSPL is related to fewer inattentive symptoms across children in clinical and nonclinical samples (N = 132). Color images are available online.
Whether parents endorsed zero RBS-R sameness behaviors was related to between SN-FPN paths (exp(b) = 1.40, logit model: p = 0.014). The total number of paths (exp(b) = 1.19, logit model: p = 0.029) and lSPL → rSPL connectivity (exp(b) = 34.46, logit model: p = 0.035) were related to RBS-R total scores. Odds ratios (exponentiated estimates) >1 indicate that higher between SN-FPN path counts, higher total path counts, and stronger lSPL → rSPL connectivity increased the odds of zero parent-reported RRBs (Fig. 6).
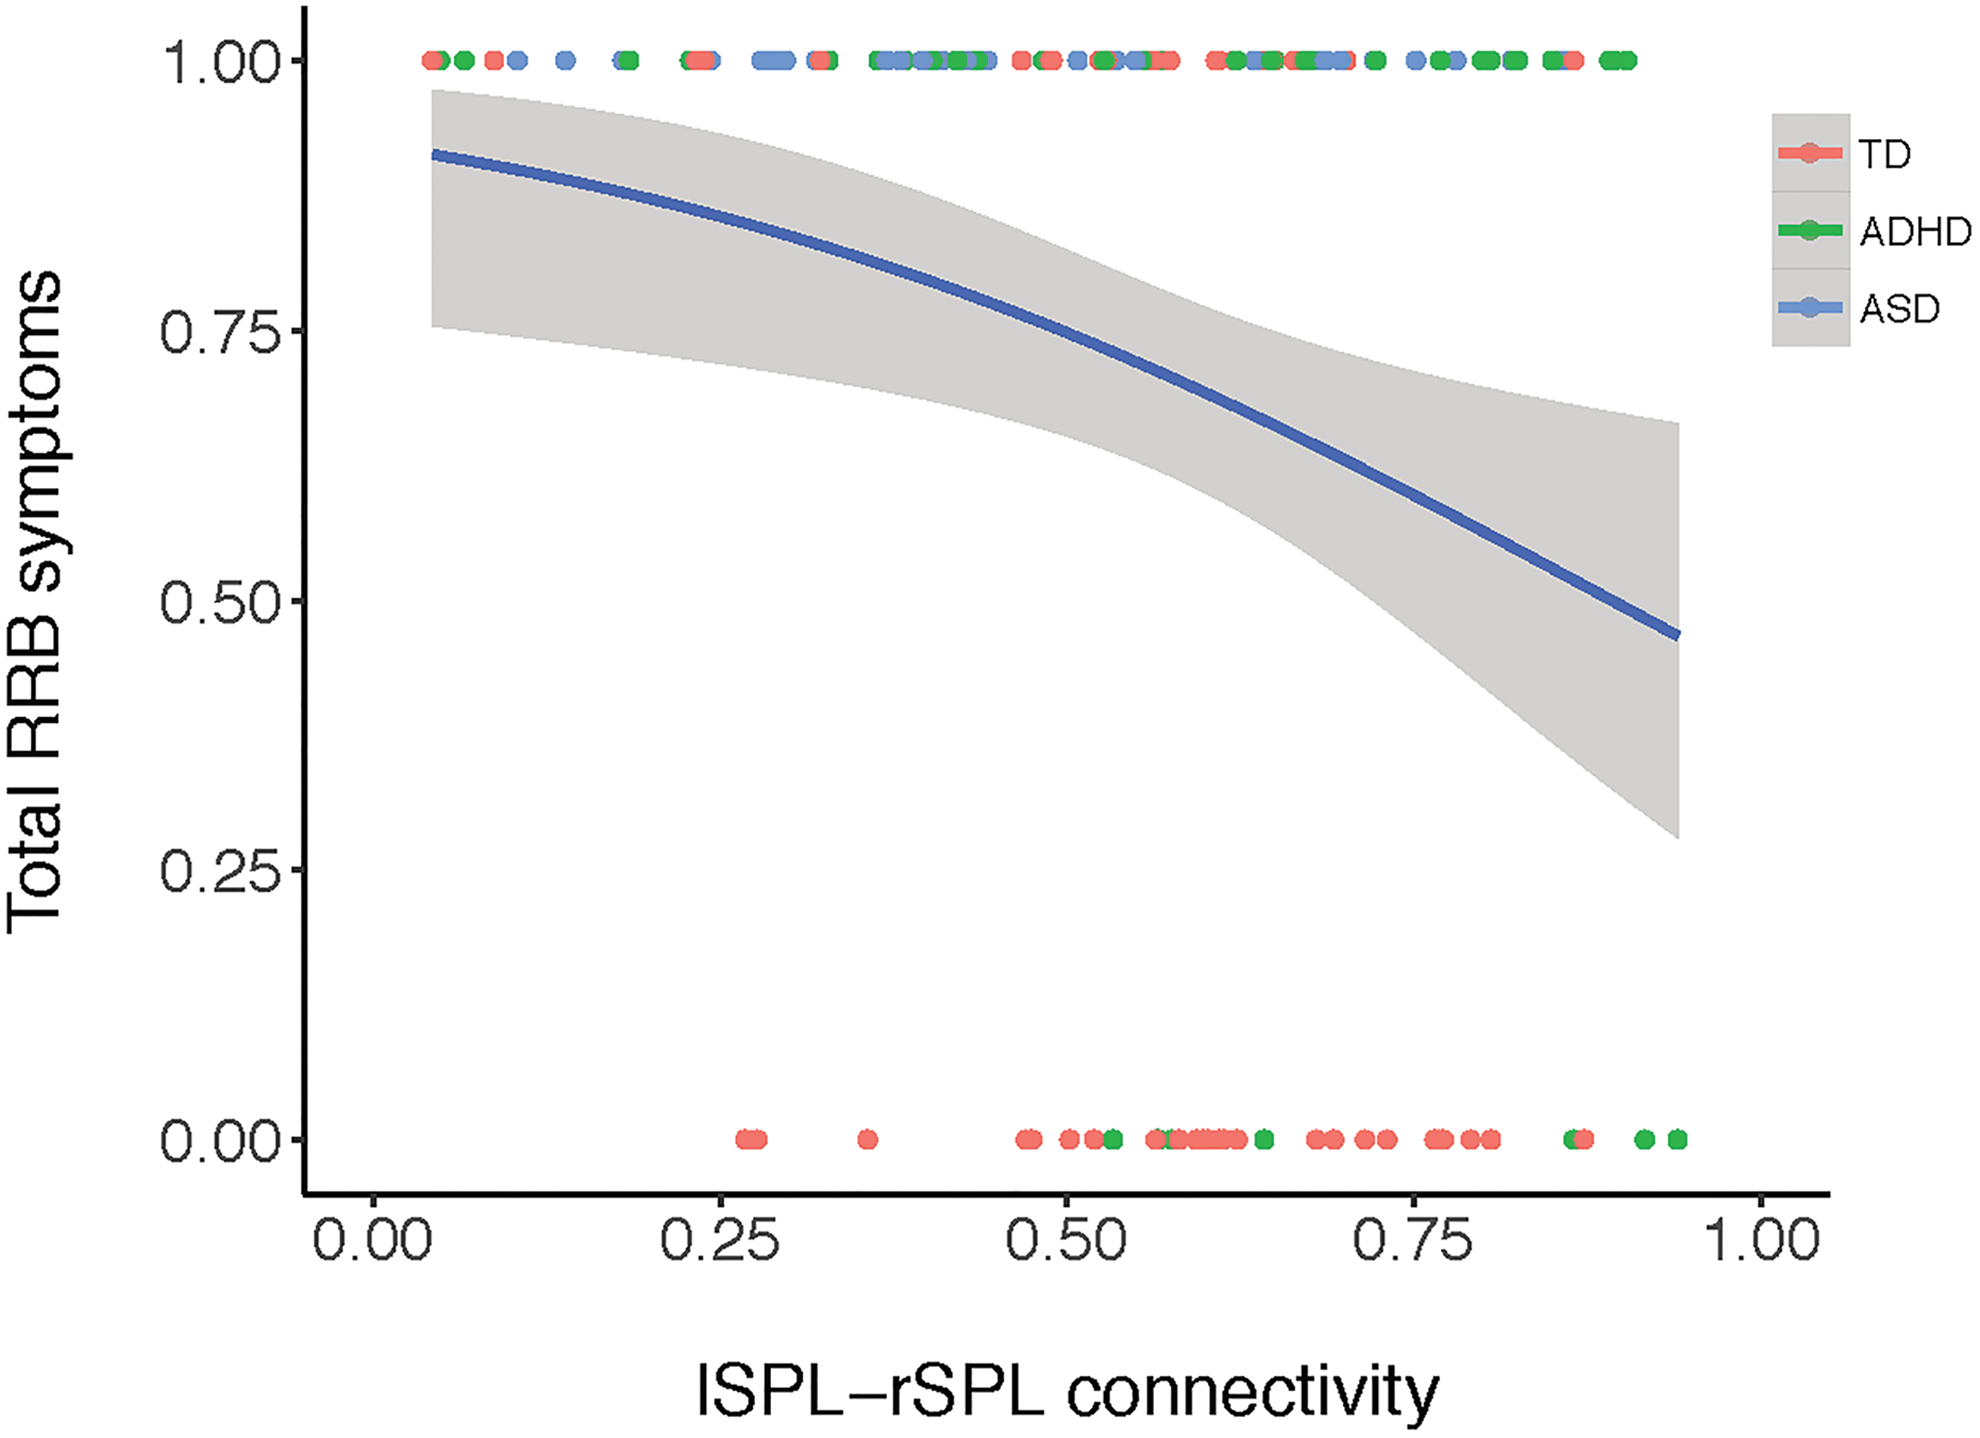
Stronger lSPL → rSPL connectivity is associated with greater odds of having zero parent-reported total restricted and RRBs. Measured with the total score of the Repetitive Behavior Scale-Revised across children in clinical and nonclinical samples (N = 132). Total RRB symptoms: 0 represents no symptoms reported, 1 represents a score of 1 or more. Estimated logit function presented in blue. ADHD, attention-deficit/hyperactivity disorder; ASD, autism spectrum disorder; RRB, repetitive behavior; TD, typically developing. Color images are available online.
Higher within-FPN path counts were associated with worse BRIEF initiation scores (r(124) = 0.23, p = 0.009) and worse inattentive symptoms in children (r(102) = 0.24, p = 0.013, Fig. 7).
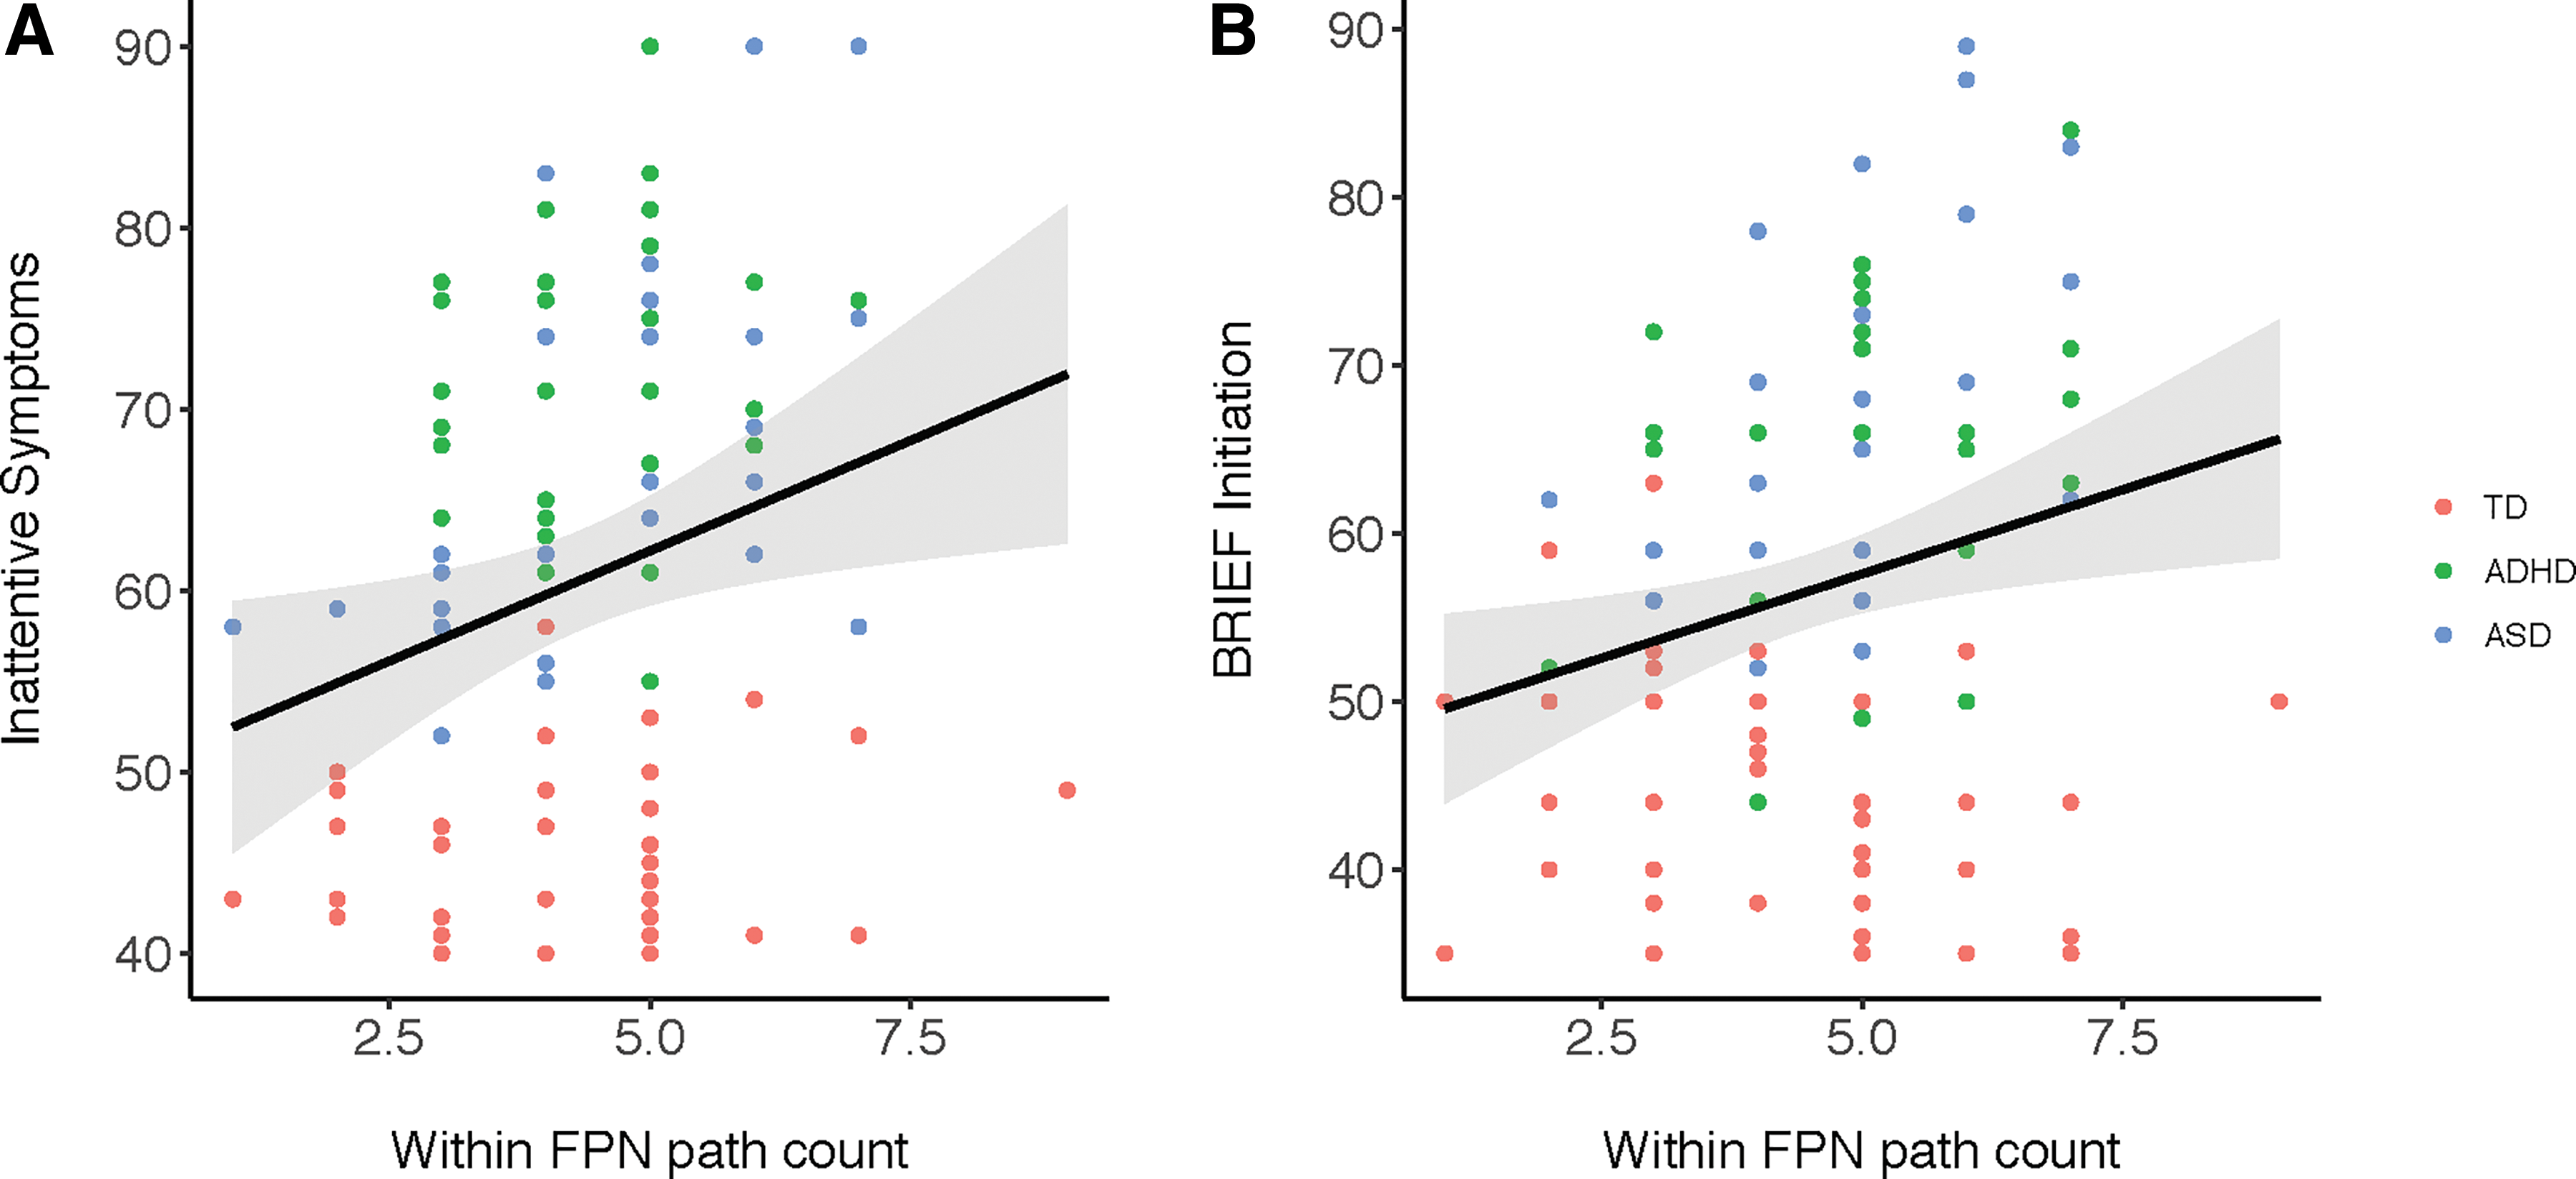
Higher within-FPN path count was related to worse initiation and inattentive symptoms. Measured with the BRIEF and Conners across children in clinical and nonclinical samples (N = 132). BRIEF, Behavior Rating Inventory of Executive Function; FPN, frontoparietal network. Color images are available online.
Relationships between connectivity strength of the contemporaneous group-level paths (lSPL → rSPL and R pallidum → R thalamus) and behavioral features were examined. We found that connectivity between the rSPL and lSPL was negatively correlated with executive dysfunction in the domains of Shift and Emotional Control (shift: r(124) = −0.30, p = 0.0008; emotional control: r(124) = −0.18, p = 0.041; Fig. 8). In other words, stronger lSPL-rSPL connectivity, specifically flowing from the left to right, is related to better cognitive flexibility and emotional control in children. There was no association between the subcortical group-level path and behavioral features (p's > 0.12).

lSPL → rSPL connectivity relates dimensionally to EF. Stronger effective connectivity from lSPL to rSPL is related to better shift and emotional control across children in clinical and nonclinical samples (N = 132). EF, executive function. Color images are available online.
Discussion
To contribute to an improved nosology for neurodevelopmental disorders, we characterized subgroups of children across ASD, ADHD, and TD groups differentiated by the topography of directed functional connectomes as an alternative to traditional, symptom-based diagnostic systems. Unexpectedly, we were unable to uncover a reliable or valid categorical scheme based on connectomes important for cognitive flexibility in a heterogeneous group of children who ranged from above average to clinical impairment in EF. These unanticipated results highlight the heterogeneity of the topology and strength of connectivity of connectomes important for cognitive flexibility in children with and without neurodevelopmental disorders. Furthermore, they suggest that the neural substrates of cognitive flexibility in children may not differ categorically.
In this study, we began with the assumption that a categorical structure would best parse heterogeneity in cognitive flexibility in children based on previous studies that identified subgroups present within ASD and ADHD diagnostic categories, which differed in functional connectivity and/or behavioral metrics. For example, subgroups have been shown to exist within children who have ADHD based on differences in functional connectivity of frontoparietal and reward-related networks (Costa Dias et al., 2015; Gates et al., 2014). Subgroups within both ADHD and ASD categories have been demonstrated based on disorder-specific symptoms (Georgiades et al., 2013), neuropsychological task performance (Feczko et al., 2018; Rommelse et al., 2016), and parent reports of children's EFs (Dajani et al., 2016). Moreover, neurodevelopmental disorders are traditionally characterized as distinct categorical entities, which is practical for clinical translation, where categorical decisions must be made to diagnose and provide treatment (Coghill and Sonuga-Barke 2012).
On the contrary, the traditional categorical approach has recently been challenged by mounting evidence for a dimensional taxonomy of psychopathology (Lahey et al., 2017). Studies focusing on parent report and neuropsychological measures of ADHD symptoms consistently conclude that inattention and hyperactivity/impulsivity are dimensional by nature (Frazier et al., 2007; Haslam et al., 2006; Lubke et al., 2009; Marcus and Barry, 2011). Furthermore, neuroimaging studies demonstrate that psychopathology, conceptualized as a transdiagnostic “p” factor, dimensionally relates to FPN hypoactivation during a working memory task (Shanmugan et al., 2016) and a loss of segregation between the DMN and the FPN and SN at rest (Xia et al., 2018). Xia and colleagues also found a specific relationship between externalizing symptoms (i.e., inattention, hyperactivity/impulsivity, and oppositional defiant symptoms) and stronger SN-FPN coupling at rest. Resting-state fMRI studies focusing on individual disorders have found support for a hybrid categorical/dimensional model in ASD and ADHD based on functional connectivity data (Chabernaud et al., 2012; Elton et al., 2014, 2016).
The results of the GIMME analysis, which included 16 ROIs and potentially 256 contemporaneous paths to be estimated, identified only two contemporaneous paths common to all 132 participants: from the lSPL to rSPL and from the right pallidum to right thalamus. These two paths are within-network connections (within the FPN and SUB, respectively), which strengthen from middle childhood to early adulthood (Fair et al., 2012b). Given this result occurred across a heterogeneous sample of children with ASD, ADHD, and TD children, these connections may be foundational to network topology in middle childhood, regardless of psychopathology present. The bilateral SPL group-level path is an example of functional homotopy, which is evident throughout the healthy brain and across the life span (Zuo et al., 2010). Surprisingly, functional homotopy was not observed for the majority of children in the other bilateral regions included in this study: FEF, AI, temporal poles, pallidum, and thalamus. This suggests that for regions outside the SPL, there is heterogeneity in functional homotopy in childhood that may be moderated by levels of psychopathology.
Strikingly, an additional 450+ subgroup- and individual-level paths were estimated. The paucity of group-level paths highlights the extreme heterogeneity in the neural substrates of cognitive flexibility among children with and without a diagnosed mental health disorder. Another possibility is that more group-level paths exist, but are masked due to residual effects of participant motion, inadequate power, or group differences left unaccounted for due to the fact that not all relevant measures were acquired. The network-level heterogeneity apparent here is in contrast with many group-based studies of the development of the undirected functional connectome, which conclude that network topology is stable by about 8 years of age (Fair et al., 2012b; Marek et al., 2015). Of note, this result cannot simply be attributed to the mixed diagnostic status of the sample. For example, had all TD children exhibited a similar network topology, a stable subgroup would likely have formed to reflect that. Using a novel individual-directed connectome estimation technique, we were able to identify large differences in both within- and between-network topology in middle childhood. These results echo recent calls to regard heterogeneity among healthy and patient populations as not only ubiquitous but also adaptive, due to evolutionary processes that result in many “optimal” brain network profiles (Holmes and Patrick, 2018).
The large amount of heterogeneity apparent in the directed functional topography of brain networks important for supporting cognitive flexibility across a mixed group of children may have impeded the formation of a stable clustering solution in this study. Simulation studies demonstrate that with a sample size of 75, subgroup recovery is good to excellent using GIMME for up to four subgroups (Gates et al., 2017). Unfortunately, we had to decrease our sample size from 132 to 99 subjects because the initial clustering solution on the full sample primarily led to clustering based on in-scanner motion. This highlights the importance of considering subgroup differences in nuisance variables such as motion to ensure unsupervised algorithms do not produce subgroups driven by artifacts (Bassett et al., 2018). Nonetheless, based on the previous simulation studies, it is unlikely that a larger sample size is needed to recover subgroups accurately unless the number of subgroups exceeds 4. This may certainly have been the case, given that two DSM-defined diagnostic groups were included, each of which may include multiple subgroups (Georgiades et al., 2013; Stevens et al., 2018). Therefore, the present results do not preclude the existence of five subgroups or more within this heterogeneous sample. If indeed five subgroups exist within samples such as the current one, this could only be uncovered in future studies with much larger sample sizes. We are aware of the previous GIMME study that used confirmatory subgroups to examine differences among TD, ASD, and ADHD subtypes (Henry et al., 2019); however, the current study is the first to use an exploratory subgrouping approach.
Another potential source of the large heterogeneity in functional connectomes observed is spatial variability in the precise location of network nodes across children (Dickie et al., 2018). Using templates derived from healthy, young adult samples, Dickie and colleagues showed that children show marked variation in the precise location of network nodes and that children with ASD deviate even more than children without a psychiatric diagnosis. We have also found that the spatial extent of the majority of functional networks exhibits linear decreases across the life span (Vij et al., 2018). Thus, applying ROI coordinates using an adult brain parcellation may have led to “missing” true connections due to poor ROI specification on an individual level, leading to fewer-than-expected group-level paths.
In follow up exploratory analyses of our null results, we used a dimensional approach to model brain/behavior relationships across the entire sample. Broadly, we found that individual differences in the outward flow of information from the rAI and SPL related to worse inattentive symptoms in a mixed group of children with and without neurodevelopmental disorders.
Furthermore, bilateral SPL connectivity strength related to better behavioral regulation aspects of EF and lower likelihood of exhibiting restricted and RRBs. These results, discussed in detail below, are consistent with a dimensional model of psychopathology (Insel et al., 2010; Zald and Lahey, 2017), in which brain network features relate dimensionally to functional constructs such as EF.
We found that higher net inward information flow to the rAI was related to lower parent-reported inattentive symptoms in children with and without diagnosed ADHD. This relationship was specific to the right hemisphere, and this metric did not relate to any other EF, ADHD, or ASD symptom measures. The rSLP displayed a similar relationship, and in fact exhibited unique relationships with inattentive symptoms above and beyond the information contributed by the rAI. We also found that lower out/in degree of the rSPL was related not only to inattentive symptoms but also to hyperactive/impulsive symptoms and a variety of EF subscales that primarily involved metacognitive indices such as working memory. Higher net inflow, often originating from regions such as the lSPL, rFEF, and lIFJ, related to fewer parent-reported inattentive and hyperactive/impulsive symptoms and better EFs. These regions comprise the FPN, which is reliably activated during a wide range of EF tasks, including working memory and planning (Niendam et al., 2012). From childhood to adulthood, within-FPN functional connectivity and long-range connections strengthen (Morgan et al., 2018), which facilitates increasingly sophisticated EF abilities across development. Higher inflow to the rSPL may represent a mature network profile that mimics adult-like functional brain networks that underlie better EFs in children. Considering that both ASD and ADHD are associated with executive dysfunction (Martel et al., 2011), it is possible that the relationship between out/in degree of the rSPL and diagnosis-specific symptoms is mediated by EFs such as working memory (Huang-Pollock et al., 2017).
A closely related, but distinct, finding was that the strength of inflow specifically from the lSPL to the rSPL was related to better behavior regulation indices of EF, including cognitive flexibility (as measured by the Shift and Emotional Control subscales). This result is in line with reports of connectivity strength within the executive control network, specifically between bilateral intraparietal sulci, relating to better cognitive flexibility performance in adults (Seeley et al., 2007). In adolescents and adults with ASD, reduced interhemispheric connectivity between bilateral SPL is not explained by severity of social impairment symptoms, suggesting that unaccounted for variables associated with ASD diagnosis may play a role in reduced lSPL-rSPL connectivity, such as executive dysfunction or RRBs (Anderson et al., 2011). In accord, we also observed relationships between SPL interhemispheric connectivity and the presence and severity of RRBs, suggesting stronger lSPL-rSPL connectivity relates to the absence of these core symptoms of autism. Distinct behavioral correlates of out/in degree and connectivity strength of the rSPL highlight the importance of assessing both connectivity direction and strength independently.
We also observed a positive relationship between within-FPN path counts and worse inattentive symptoms and poorer initiation abilities, an index of EF. Contrary to our results, stronger within-FPN connectivity is a hallmark of developmental maturity of functional network topology (Bassett et al., 2018), increasing across childhood into adolescence (Fair et al., 2012b; Satterthwaite et al., 2013). Furthermore, successful performance on EF tasks consistently elicits stronger activation of regions within the FPN (Niendam et al., 2012) and their hypoactivation is related to worse general psychopathology and specific symptoms of externalizing symptoms, including inattentive behaviors (Shanmugan et al., 2016). The discrepancy between our finding and past literature limits our confidence in the assertion that higher within-FPN connectivity is associated with worse symptoms. Instead, this result may reflect the limitations of our operationalization of within-network connectivity, which counted both positively and negatively weighted paths similarly. Alternatively, the FPN-symptom relationship may be explained by hyperconnectivity of this network, which has been observed in children with ASD (Nomi and Uddin, 2015; Uddin et al., 2013), and thus may represent a deviation from the typical development of the FPN. Another possibility is that previous studies that have averaged across all within-network connections in the brain have missed nuanced, specific within-network effects such as those we observed in the current study. A recent study investigating ADHD symptoms in children with ASD found that functional connectivity in FPN and SN was correlated with ADHD symptoms (Yerys et al., 2019). Additional investigations of dimensional associations between within-FPN connectivity and EF and ASD/ADHD symptom measures will be needed to further clarify the relationships between within-FPN connectivity and behavior.
Despite the fact that our dimensional findings were exploratory, they are bolstered by the fact that the majority of results presented are in accord with recent investigations into the dimensional nature of psychopathology and its neural substrates. Studies focusing on parent report and neuropsychological measures of ADHD symptoms consistently conclude that inattention and hyperactivity/impulsivity are dimensional by nature (Frazier et al., 2007; Haslam et al., 2006; Lubke et al., 2009; Marcus and Barry, 2011). Furthermore, neuroimaging studies demonstrate that psychopathology dimensionally and transdiagnostically relates to FPN hypoactivation during a working memory task (Shanmugan et al., 2016) and a loss of segregation between the DMN and FPN and SN at rest (Xia et al., 2018). Xia and colleagues also found a specific relationship between externalizing symptoms (i.e., inattention, hyperactivity/impulsivity, and oppositional defiant symptoms) and stronger SN-FPN coupling at rest, which implicate the same networks found to relate to inattention and hyperactivity/impulsivity in this study.
Assessment of both categorical and dimensional frameworks for modeling EF and psychopathology has important implications for clinical translation of neuroimaging and behavioral findings. If the neural substrates of EF dysfunction are similar across traditional diagnostic boundaries, as suggested by our results and others' previous work (Shanmugan et al., 2016), it is likely that an EF intervention that works for one diagnostic group will be helpful for others as well. This transdiagnostic model of EF in children implies that researchers should not expect to find disorder-specific causes or biomarkers for EF dysfunction (Lahey et al., 2017).
In addition, we demonstrate that ADHD symptoms can be represented dimensionally across several network metrics (e.g., out/in degree, connection strength) and nodes (e.g., rAI and rSPL). These results tentatively support a multifactorial account for ADHD etiology, where many causal factors contribute to produce impairment (Haslam et al., 2006), which may be associated with multiple functional network abnormalities. If these findings replicate in independent samples, results such as these may provide neurobiological targets for which novel precision treatments for EF and ADHD symptoms, such as drug or behavioral interventions, may be developed (Garvey et al., 2016).
To summarize, this study was one of the first to use functional connectome data estimated at the individual level for a heterogeneous group of children spanning TD, ASD, and ADHD diagnoses. Results demonstrated high levels of heterogeneity in the topography of directed functional connectomes important for cognitive flexibility in children with a range of EF abilities. Furthermore, our results did not support a categorical scheme. These results suggest that a dimensional model may better describe individual differences in the neural substrates of cognitive flexibility in children.
Limitations and Future Directions
There is support for both categorical and dimensional models of psychopathology at the behavioral and large-scale neurobiological levels. However, there is a major limitation of the majority of these studies presented, which use factor or cluster analyses. In these cases, a dimensional or categorical structure is assumed to fit the data well, without any formal quantitative tests to determine whether one model is superior to the other. Further complicating matters, clustering algorithms are prone to producing false positives, meaning clusters are produced even in cases where none truly exists. These shortcomings limit the validity of past factor- and cluster-based studies of psychopathology. Currently, the only methods that formally determine whether dimensional or categorical models best fit data are taxometric analyses and factor mixture models, which have never before been applied to neuroimaging data, limiting our understanding of how psychopathology should be modeled in consideration of the large-scale neural substrates of behavior. With advances in methodology, future studies may begin to tackle whether a dimensional or categorical model is supported at the brain network level by applying taxometric or factor mixture modeling studies to functional connectome data. Unfortunately, we are not aware of any available software that simultaneously obtains reliable patterns of connectivity while parsing individuals into probabilistic subgroups. Future directions for the field of biological psychiatry include the development of such methods to apply to brain connectivity data.
Limitations of the current work include the moderate sample size, the fact that only a single network involved in a very specific cognitive process (cognitive flexibility) was investigated, and only one particular type of functional connectivity analysis (GIMME) was applied. Furthermore, we are not able to conduct a replication at this time as no comparable, well-characterized data set exists. It is important to note that the unreliable and nonmodular clustering results presented here are specific to the a priori brain regions supplied to the GIMME algorithm. There are many advantages that the GIMME tool has to offer, including individual-level connectome estimation without contamination by group averaging and the estimation of path direction, but this method is not completely data driven in that only a limited number of ROIs can be used (Gates et al., 2017). Thus, researchers are required to use prior literature to guide ROI selection, possibly leading to missed information about functional network topology outside of the networks examined. It is possible that stable subgroups may have been identified using a different set of ROIs, and thus does not preclude the existence of a categorical structure of psychopathology in consideration of other regions and/or functional networks. Additional future directions should include investigation of networks that are thought to stabilize earlier than age 8, including sensorimotor networks (Gao et al., 2015). The FPN/SN are known to develop later, and thus, it is possible that exploration of other networks could yield stable subgroups.
Another limitation to note regarding the behavioral network feature associations is that corrections for multiple comparisons were not applied, as these analyses were exploratory and were not independent of each other. As such, these results should be interpreted with caution and require further replication.
Commonly studied EFs (e.g., inhibition, working memory, set shifting) are robustly correlated but separable when measured with latent variables (Friedman and Miyake, 2017). Thus, the use of a single task to assess cognitive flexibility does not allow one to separate whether the differences observed in the brain are due to a general EF component or flexibility-specific aspects. Future work will be required to further incorporate bifactor models of EF into brain imaging investigations.
Toward an effort to understand whether psychopathology is best represented categorically or dimensionally at the neurobiological level, several future directions are notable. First, to construct an alternative nosology that captures the full range of psychopathology, studies should opt to include a wider swath of diagnostic groups to identify relationships beyond ASD and ADHD symptoms, such as frequently comorbid internalizing symptoms (Zald and Lahey, 2017). By capturing multiple symptom types, researchers can test whether the neural substrates of psychopathology operate at multiple hierarchical levels from symptoms to the general “p” factor (Zald and Lahey, 2017). Considering that neurodevelopmental disorders unfold across age, it may be more fruitful to investigate developmental trajectories in place of cross-sectional studies (Morgan et al., 2018). Recent advances in neuroimaging allow for different modalities such as structural, functional, and diffusion-weighted images to be combined in multilayer networks, which may be more informative than one modality alone (Morgan et al., 2018).
Finally, we took precautions to analyze only a low motion group in the current work to alleviate concerns that group differences in head motion could be driving the results. Head motion is known to be a source of spurious between-group differences (Power et al., 2012), particularly in developmental and clinical samples (Satterthwaite et al., 2013). However, we acknowledge that in-scanner motion is a symptom of ADHD and ASD, and our sample is thus necessarily less heterogeneous as a result of our strict inclusion criteria. This choice represents a trade-off between attempting to maintain data quality versus attempting to analyze an appropriately heterogeneous clinical sample.
Footnotes
Author Disclosure Statement
No competing financial interests exist.
Funding Information
This work was supported by the National Institute of Health (R01MH107549), the Canadian Institute for Advanced Research, and a University of Miami Gabelli Senior Scholar Award to L.Q.U. K.M.G. is supported by the National Institute of Health (R01EB022904). S.H.M. is supported by Autism Speaks and the National Institute of Health (R01NS048527, R01MH085328, R01MH078160, R01MH106564), the Johns Hopkins University School of Medicine Institute for Clinical and Translational Research, and NIH/NCRR CTSA Program, UL1-RR025005.
Supplementary Material
Supplementary Data
Supplementary Figure S1
Supplementary Figure S2
Supplementary Table S1
Supplementary Table S2
References
Supplementary Material
Please find the following supplemental material available below.
For Open Access articles published under a Creative Commons License, all supplemental material carries the same license as the article it is associated with.
For non-Open Access articles published, all supplemental material carries a non-exclusive license, and permission requests for re-use of supplemental material or any part of supplemental material shall be sent directly to the copyright owner as specified in the copyright notice associated with the article.