
Abstract
Both functional connectivity (FC) and blood oxygen level-dependent (BOLD) signal variability (SDBOLD) are methods that are used for examining the physiological state of the brain. Although they are derived from signal changes and are related, a few studies have explored their relationship. Here, we examined the relationship between SDBOLD and FC within the default mode network (DMN) in healthy aging participants and those with Parkinson's disease (PD) ON and OFF dopaminergic medications. Dopaminergic medications had profound effects on both DMN FC and SDBOLD measured separately in PD. Analyzing DMN FC and SDBOLD in a joint independent component analysis, we identified joint components of DMN FC and SDBOLD that were separately associated with measurements of motor and cognitive impairment in PD and qualitatively similar to those in healthy aging. Dopaminergic medications had a differential effect on these components depending on these measures of disease severity, “normalizing” the relationships. Importantly, we show that dopaminergic medication status matters in imaging PD, and it can affect both connectivity and SDBOLD. Imaging PD ON may lead to inflated estimates of SDBOLD and diminish the ability to measure changes associated with declining motor and cognitive capacities.
Introduction
Parkinson's disease (PD) is a neurodegenerative disease that is characterized by the loss of dopaminergic nigro-striatal neurons. This dopaminergic cell loss is responsible for the characteristic and widely studied parkinsonian motor dysfunction, although other neurotransmitter systems, such as the cholinergic, serotonergic, adrenergic, glutamatergic, GABAergic, and adenosine-mediated systems, are also affected [see Barone (2010) for a review]. These changes influence the spontaneous fluctuations of the blood oxygen level-dependent (BOLD) signal in the brain, which is widely believed to reflect fluctuations in neurophysiological state (Raichle and Snyder, 2007). There is clear evidence to suggest that dopamine (DA) affects functional connectivity (FC) (Cole et al., 2013; Kelly et al., 2009), specifically regulating the default mode network (DMN) (Delaveau et al., 2010; Tomasi et al., 2009). Because of the centrality of the dopaminergic system to PD, we focus our analysis in this article on the DMN. We have previously studied the DMN during a task (Boord et al., 2017), which motivated this follow-on resting-state study. The combination of both depleted baseline DA and dopaminergic medications in PD is likely to alter FC (Bell et al., 2015). The cholinergic system is also affected in PD (Müller and Bohnen, 2013), interacting with the dopaminergic system (Kim et al., 2018) and influencing resting-state FC (Klaassens et al., 2018).
However, FC is only one way of using the BOLD signal to interrogate neurophysiological states. Higher moment-to-moment BOLD signal variability [SDBOLD, following the notation of Garrett et al. (2013)] has been linked to better performance in task-based paradigms (Garrett et al., 2010, 2013, 2014; Grady and Garrett, 2014). Decreases in BOLD signal variability have also been linked to other neurodegenerative disorders such as mild cognitive impairment and Alzheimer's disease dementia (Han et al., 2011; Liu et al., 2014; Xi et al., 2012; Zhao et al., 2015). In addition, SDBOLD has also been shown to increase in task-relevant regions with an external DA dose in young, cognitively normal people (Alavash et al., 2018).
Although both FC and SDBOLD are measurements that incorporate BOLD fluctuations and thus must be related to one another, we do not understand how changes in one measurement predict changes in the other. Specifically, there is evidence to suggest that both measures should change with administration of dopaminergic medications commonly taken in PD, such as carbidopa-levodopa. The DMN is disrupted in PD with mild cognitive impairment (Kletzel et al., 2015) and PD with normal cognition (Tessitore et al., 2012). Levodopa restored the incomplete deactivation of the DMN in a trial of nondemented, nondepressed PD (Delaveau et al., 2010), and another study found that levodopa normalized disrupted networks in the same PD subjects on medication versus off medication (Berman et al., 2016). This literature supports the idea that levodopa normalizes network activity.
In this article, we examine the effects of dopaminergic medications on DMN FC and SDBOLD throughout the brain in a sample of PD participants from whom we have functional imaging both on and off medication. We focus on FC from the posterior cingulate cortex (PCC) and the medial prefrontal cortex (mPFC), two key regions within the DMN. SDBOLD was computed across the brain. We use a joint independent component analysis (ICA) to examine components across both modalities (FC and SDBOLD), providing a link between the two. Our goal was to understand how changes to FC and SDBOLD are related to dopaminergic medication, and to understand whether these changes are further related to measures of disease severity in PD.
Materials and Methods
Participants
Participants received resting-state functional magnetic resonance imaging (fMRI) and structural imaging as part of a larger study to examine the effect of genetic subtypes on cognitive impairment in the Pacific Udall Center. The participants were recruited through the Washington State Parkinson Disease registry and physician referrals. Spouses and caregivers were recruited as healthy controls (HC).
Participants with PD were scanned in the morning at 10 a.m. after withholding PD-related medications (OFF) since 9 p.m. the previous night. Immediately after the OFF scan, participants took their normal medications and had lunch half an hour later. They were scanned again (ON) at 12:15 p.m., at least 1 h after taking their medications. The HC participants were scanned once at 12:15 p.m., also termed “ON” for convenience.
We analyzed an initial sample of 52 participants with PD who completed both scans and 36 HC participants. Four participants with PD were excluded based on mean absolute motion exceeding 3.5 mm in either the ON or OFF scan. One participant with PD was excluded for taking rivastigmine, an acetylcholinesterase inhibitor, and two participants with PD were excluded because they fell asleep during the ON or OFF scan. One additional subject with PD was excluded because of the poor quality of their structural scan, leaving a final sample of 44 PD participants. One HC participant was excluded based on mean absolute motion exceeding 3.5 mm, leaving a final sample of 35 HC participants; no other exclusions were necessary.
Nineteen participants with PD had no cognitive impairment, 19 had cognitive impairment with no dementia, 3 had dementia, and cognitive status was unknown for 3 individuals. Twenty-two HC participants had no cognitive impairment, 10 had cognitive impairment with no dementia, one had dementia, and cognitive status was unknown for two individuals. Demographic information for the sample is in Table 1. Participants differed only on mean absolute motion ON; PD participants had higher motion (p = 0.003). Montreal Cognitive Assessment (MoCA) (Nasreddine et al., 2005) scores and levodopa-equivalent daily dose (LEDD) were obtained during a separate visit conducted by the Pacific Udall Center Clinical Core. We evaluated PD participants on the Movement Disorders Society-revised unified Parkinson's disease rating scale (MDS-UPDRS) part III (Goetz et al., 2007; Ramaker et al., 2002). We collected MDS-UPDRS III OFF and ON in PD; scores were higher OFF (p < 0.001).
Demographics of Sample
Demographics for sample, for HC and PD ON and OFF medication. Statistical significance of ON/OFF differences within PD was tested with a paired t-test for all tests. We do not report PD-specific values (disease duration, LEDD, MDS-UPDRS, Hoehn and Yahr) for HC. There are no differences between PD and HC in age (p = 0.063) or MoCA (0.683). However, PD ON has significantly more motion than HC (p = 0.003). Significance of PD/HC difference was tested with unpaired t-tests. There is no difference gender ratio (p = 0.438), tested with a Chi-squared test.
HC, healthy controls; LEDD, levodopa-equivalent daily dose; MDS-UPDRS III, Movement Disorders Society-revised unified Parkinson's disease rating scale; MoCA, Montreal Cognitive Assessment; PD, Parkinson's disease.
Of the scanned PD participants, 40 (91%) took dopaminergic medications. Of these, 26 took only levodopa, and 14 (35%) took both levodopa and DA agonists. An additional four (10%) participants took only DA agonists. To facilitate comparison between heterogeneous medication regimens, we used LEDD, which is defined as the amount of a drug that produces the same level of symptomatic control as 100 mg of immediate-release levodopa (Tomlinson et al., 2010). The HC participants were excluded if they took medication that could affect their cognition.
APOE genotype was determined for all participants as previously described (Mata et al., 2014). Participants with PD genotypes were: 5 (11%) ɛ2/ɛ3, 26 (59%) ɛ3/ɛ3, and 13 (29%) ɛ3/ɛ4. The HC genotypes were: 0 (0%) ɛ2/ɛ3, 17 (49%) ɛ3/ɛ3, 15 (43%) ɛ3/ɛ4, 1 (3%) ɛ4/ɛ4, and 2 (6%) missing. These proportions align with racially similar samples previously published (Singh et al., 2006 [USA]; Teruel et al., 2011 [white]; Rasmussen et al., 2015 [Dutch]).
This study was approved by the University of Washington Institutional Review Board, and all participants provided written informed consent.
MRI acquisition
Data were acquired by using a Philips 3.0T X-Series Achieva MR System (Philips Medical Systems, software version 5.1.7) with a 32-channel SENSE head coil. For resting-state data, three echoes of whole-brain axial echo-planar images (37 sequential ascending slices, 3.5 mm isotropic voxels, field of view = 224 × 224 × 129.5, repetition time = 2500 msec, echo time = 9.5 msec, 27.5 and 45.5 msec, flip angle = 79, SENSE acceleration factor = 2.5, EPI factor = 25) were collected parallel to the AC-PC line. Each resting-state scan was 240 volumes (10 min). A T1-weighted 3D MPRAGE (237 axial slices, matrix size = 324 × 325, turbo-field echo factor = 181, repetition time = 9.9 msec, echo time = 4.5 msec, flip angle = 15, shot interval = 2684 msec) with 0.8 mm isotropic voxels was also acquired for registration and to construct a gray matter probability mask.
fMRI processing
HC and PD participants were processed identically. Data were processed by using a workflow developed with GNU Make (Askren et al., 2016), using software from FSL (Jenkinson et al., 2012), AFNI (Cox, 1996), and advanced normalization tools (ANTs) (Tustison et al., 2014). Multi-echo data were reconstructed by using AFNI ME-ICA (Kundu et al., 2012, 2013), which distinguishes BOLD and non-BOLD (artifact, including motion) components based on the characteristic linear echo-time dependence of BOLD T2* signals. This workflow yields both denoised time series that we used for calculating SDBOLD and BOLD component maps that we used for seed-based connectivity analyses.
Motion parameters, including mean absolute and mean relative motion, were calculated by using nipy's FmriRealign4d algorithm (Roche, 2011). Participants were excluded from fMRI analyses if the mean absolute motion exceeded 3.5 mm in any scan. In the remaining PD sample, mean absolute motion was nominally higher ON (M = 1.87, SD = 0.70 mm) than OFF (M = 1.63, SD = 0.58 mm; p = 0.057). Mean absolute motion in HC participants was 1.43 (0.54) mm.
Data were registered to the T1 image by using boundary-based registration based on a white matter segmentation of the T1 image (epi_reg in FSL), and then to the MNI152 template (Grabner et al., 2006) by using ANTs.
We used the BOLD component maps (“mefc”) from ME-ICA to calculate connectivity (Kundu et al., 2013) to the PCC and the mPFC, regions identified as important nodes in the DMN. We used spherical (10 mm diameter) regions of interest (ROI) for the PCC (x = 2, y = −52, z = 28) and the mPFC (x = 0, y = 60, z = 22), as reported in Raichle et al. (2001) and republished by Power et al. (2011). Whole-brain connectivity to each ROI was calculated by using 3dTcorr1D. We applied Fisher's r-to-z-transformation to the whole-brain correlations to approximate a normal distribution.
We used the denoised time series data (“medn”) from ME-ICA to calculate SDBOLD. We removed nonbrain voxels at the subject level by masking the registered functional data with a skull-stripped T1 brain mask. After masking, we normalized intensity at 100 and smoothed by using FSL susan at a sigma of 3 mm (Garrett et al., 2010). From the smoothed functional data, we calculated voxel-wise SDBOLD by using FSL fslmaths, using the formula
Using the normalized and masked maps, we calculated separately for PD and HC between-scan data masks of data that excluded voxels that were outside the brain in any scan. In addition, we averaged the subject-specific gray matter maps, computed by using FMRIB's Automated Segmentation Tool (FAST) (Zhang et al., 2001), smoothed with a 3-mm kernel, and binarized at >25% probability of gray matter to limit analysis to gray matter only. The group-level union of the data mask and the gray matter threshold mask was calculated and applied to both SDBOLD and connectivity data to equalize the dimensionality across modalities.
Statistical analysis: PD
To test for medication state differences separately within the SDBOLD data, and the PCC- and mPFC-seeded connectivity data, we performed paired two-sided t-tests by using AFNI 3dttest++ with cluster correction (α = 0.05, p = 0.05).
We then conducted a joint analysis of the SDBOLD and connectivity data. We combined ON and OFF scans within modalities to find components that were shared between medication states. Both the ON/OFF combined SDBOLD and ON/OFF combined connectivity data were separately normalized, dividing by the first singular value of each modality to normalize the variance across modalities (Abdi et al., 2013), so that one modality did not dominate the joint analysis. Second, each was standardized separately by the global standard deviation of the modality.
We ran a principal component analysis on the joint data to determine the number of components to extract from the subsequent ICA. This was repeated for both the PCC and mPFC analyses separately. Based on the individual scree plots (Supplementary Figs. S1 and S2), we selected components that explained 5% or more of the total variance. This resulted in two components for the PCC analysis and four for the mPFC. All statistical analyses were conducted in R (version 3.3.3) (R Core Team, 2017).
To identify joint components of SDBOLD and connectivity data, we ran a fastICA (Hyvarinen, 1999), implemented in the R package fastICA (Marchini et al., 2017), on each joint data matrix. The resulting joint components identify places where SDBOLD and connectivity change together across individuals and medication states. A fastICA estimates three matrices: the un-mixing matrix W, the mixing matrix A, and the source matrix S. The S matrix contains the statistically independent components. The A matrix quantifies the expression of each component in an individual scan as weights. Figure 1 gives a graphical representation of how we set up the joint ICA analysis so that we can estimate differences in the expression of components, specifically within-subject differences between medication states, ON-OFF. We split the source matrix according to input modality and exported them to the brain space to create 3D maps of where regions of SDBOLD and connectivity were related.
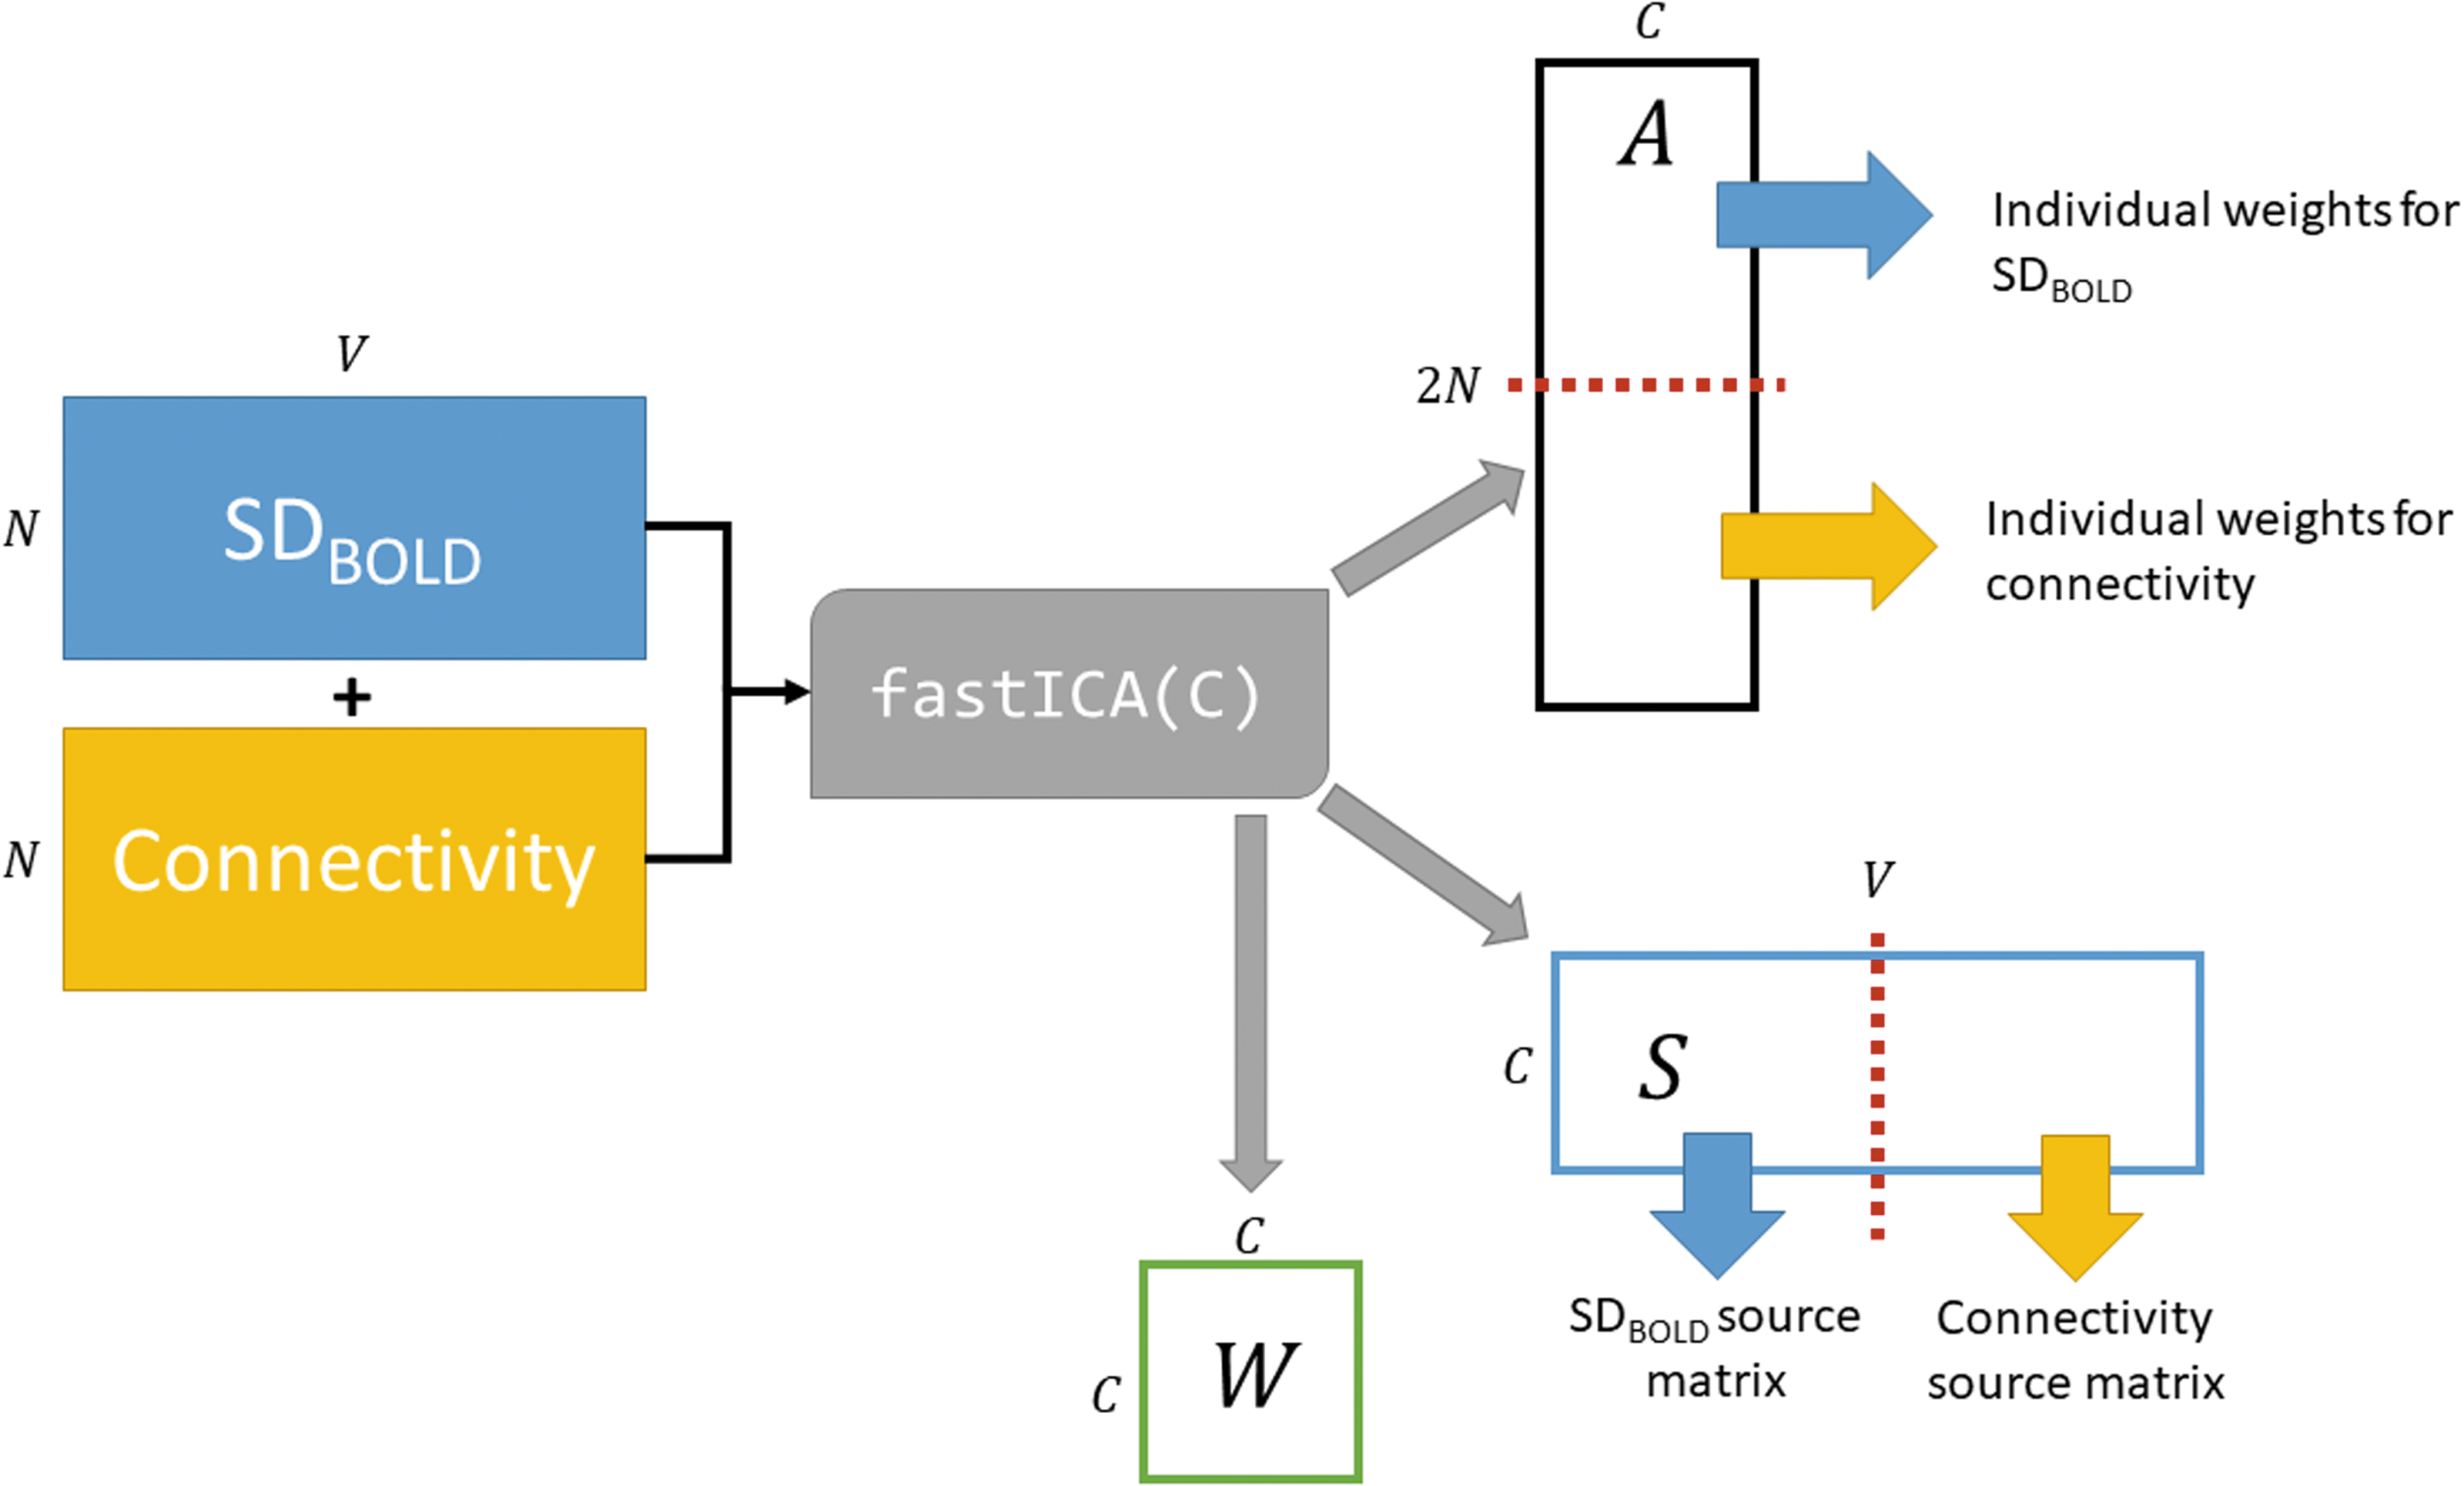
Illustration of the joint ICA analysis. N is the number of scans, V is the number of voxels analyzed from every scan, C is the number of components (selected by the user based on the results of a prior PCA), and A is the estimated mixing matrix that is divided into two to estimate the scan-level expression of the components. We use values from A to regress components against demographic and disease severity variables. S is the source matrix, which is divided into two to estimate the overall voxel-level effects of each component. We use the source matrix weights to create brain images of component expression. W is the estimated mixing matrix, with dimensions CxC. PCA, principal components analysis.
We examined the relationship between component weights, demographics, and measures of disease severity by using a staged regression. In the first stage, we included demographic variables: age at scan, and sex. In the second stage, we included disease severity variables: disease duration since diagnosis (DDDx), LEDD, MDS-UPDRS III (evaluated OFF), and MoCA score (evaluated ON). DDDx is highly correlated with disease duration since symptom onset (DDO; see Results section). In all analyses, we controlled for mean absolute motion ON and OFF by including them as nuisance covariates.
We also examined how the change in components ON-OFF is related to demographic and disease severity variables by using a staged regression.
The code to replicate all processing and analysis steps is available from the first author.
Statistical analysis: HC
The HC analysis was identical to the PD analysis, except that there were no group t-tests to perform. We extracted components that explained more than 5% of the variance: two components from the SDBOLD/PCC joint analysis and three from the SDBOLD/mPFC joint analysis.
We used the same staged regression against component scores (as there is no difference to calculate); however, the second stage included only the MoCA score. As earlier, we controlled for mean absolute motion by including it as a nuisance covariate.
Results
Demographic variables
Within the PD sample, we calculated correlations between our 11 continuous demographic and disease severity variables and used Bonferonni correction to account for multiple comparisons. MDS-UPDRS III ON and OFF scores were correlated (r = 0.862, p < 0.001), as were DDDx and DDO (r = 0.767, p < 0.001). Age and MoCA score were also correlated (r = −0.528, p < 0.001), as were DDO and MDS-UPDRS III OFF (r = 0.530, p < 0.001).
Within the HC sample, we calculated correlations between the three continuous demographic severity variables and MoCA score. Following Bonferonni correction, no measurements were correlated.
HC joint analyses
We present the HC results first to establish a baseline. For each joint analysis, we show the maps for each component as calculated for SDBOLD and connectivity (Fig. 2). Next, we provide the results of the staged regression, in which we determine whether ICA weights are related to demographic and disease severity variables. Based on the individual scree plots and our rule to extract components that explain 5% or more of the total variance (Supplementary Figs. S3 and S4), we extracted two independent components from the joint PCC analysis and three from the joint mPFC analysis.
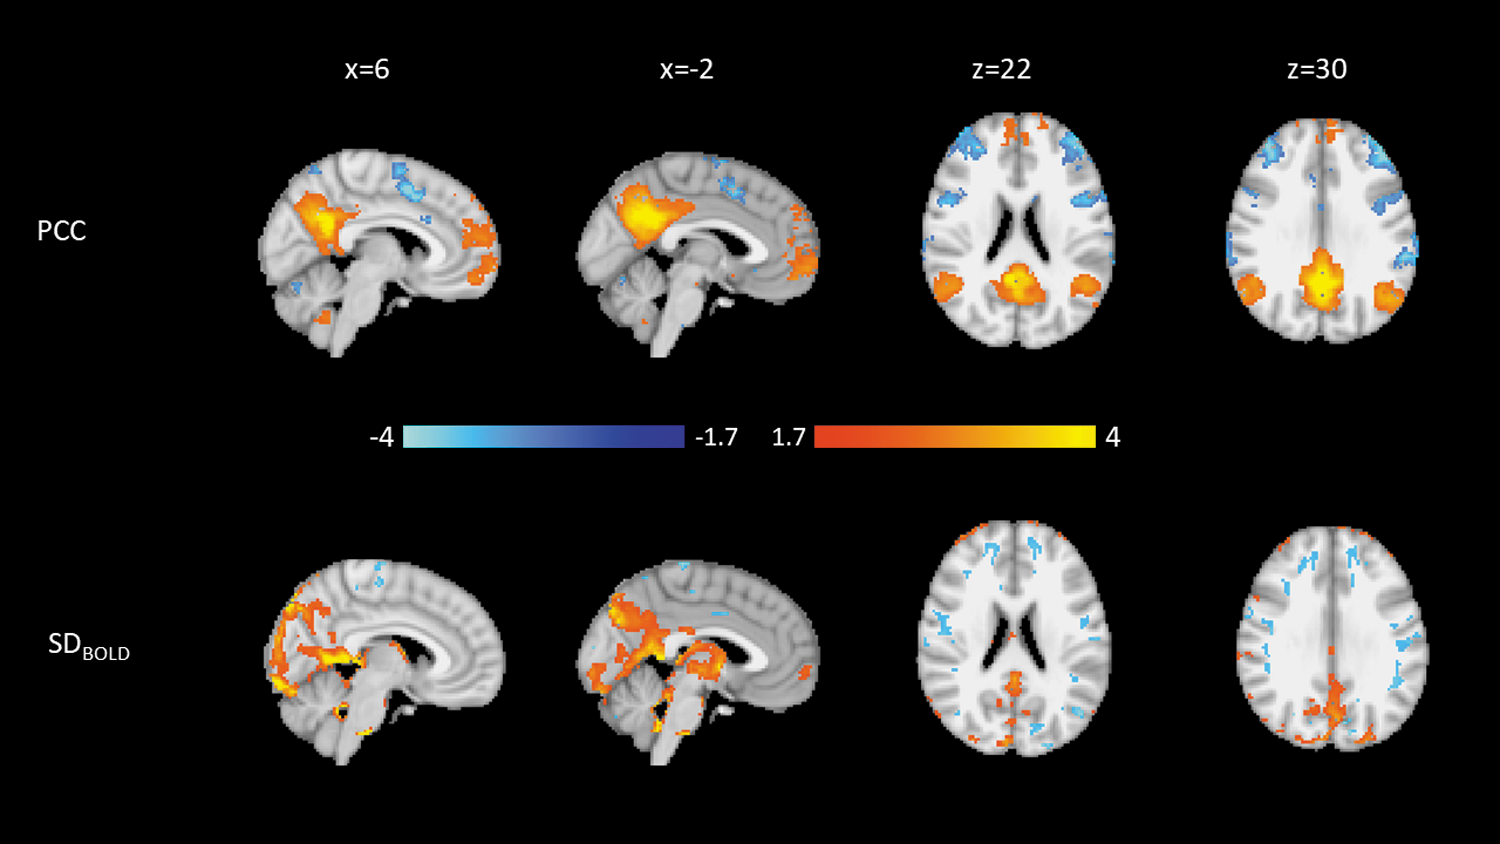
Weights for the second HC PCC component. Blue is negative, and orange is positive. Top: Connectivity to the PCC. Bottom: SDBOLD. Both modalities are normalized to a minimum of −4 and a maximum of 4. HC, healthy controls; PCC, posterior cingulate cortex.
Component figures are normalized to low and high z scores of −4 and 4.
Posterior cingulate cortex
The first HC PCC component (HC-PCC1; Supplementary Fig. S5), which explained 39.7% of the variance, shows that higher connectivity from the PCC to the posterior DMN is associated with higher SDBOLD in the inferior occipital lobe.
The second HC PCC component (HC-PCC2; Fig. 3), which explained 8.4% of the variance, shows that similar regions of connectivity from the PCC to the posterior DMN are associated with higher SDBOLD in regions peripheral to the occipital lobe.
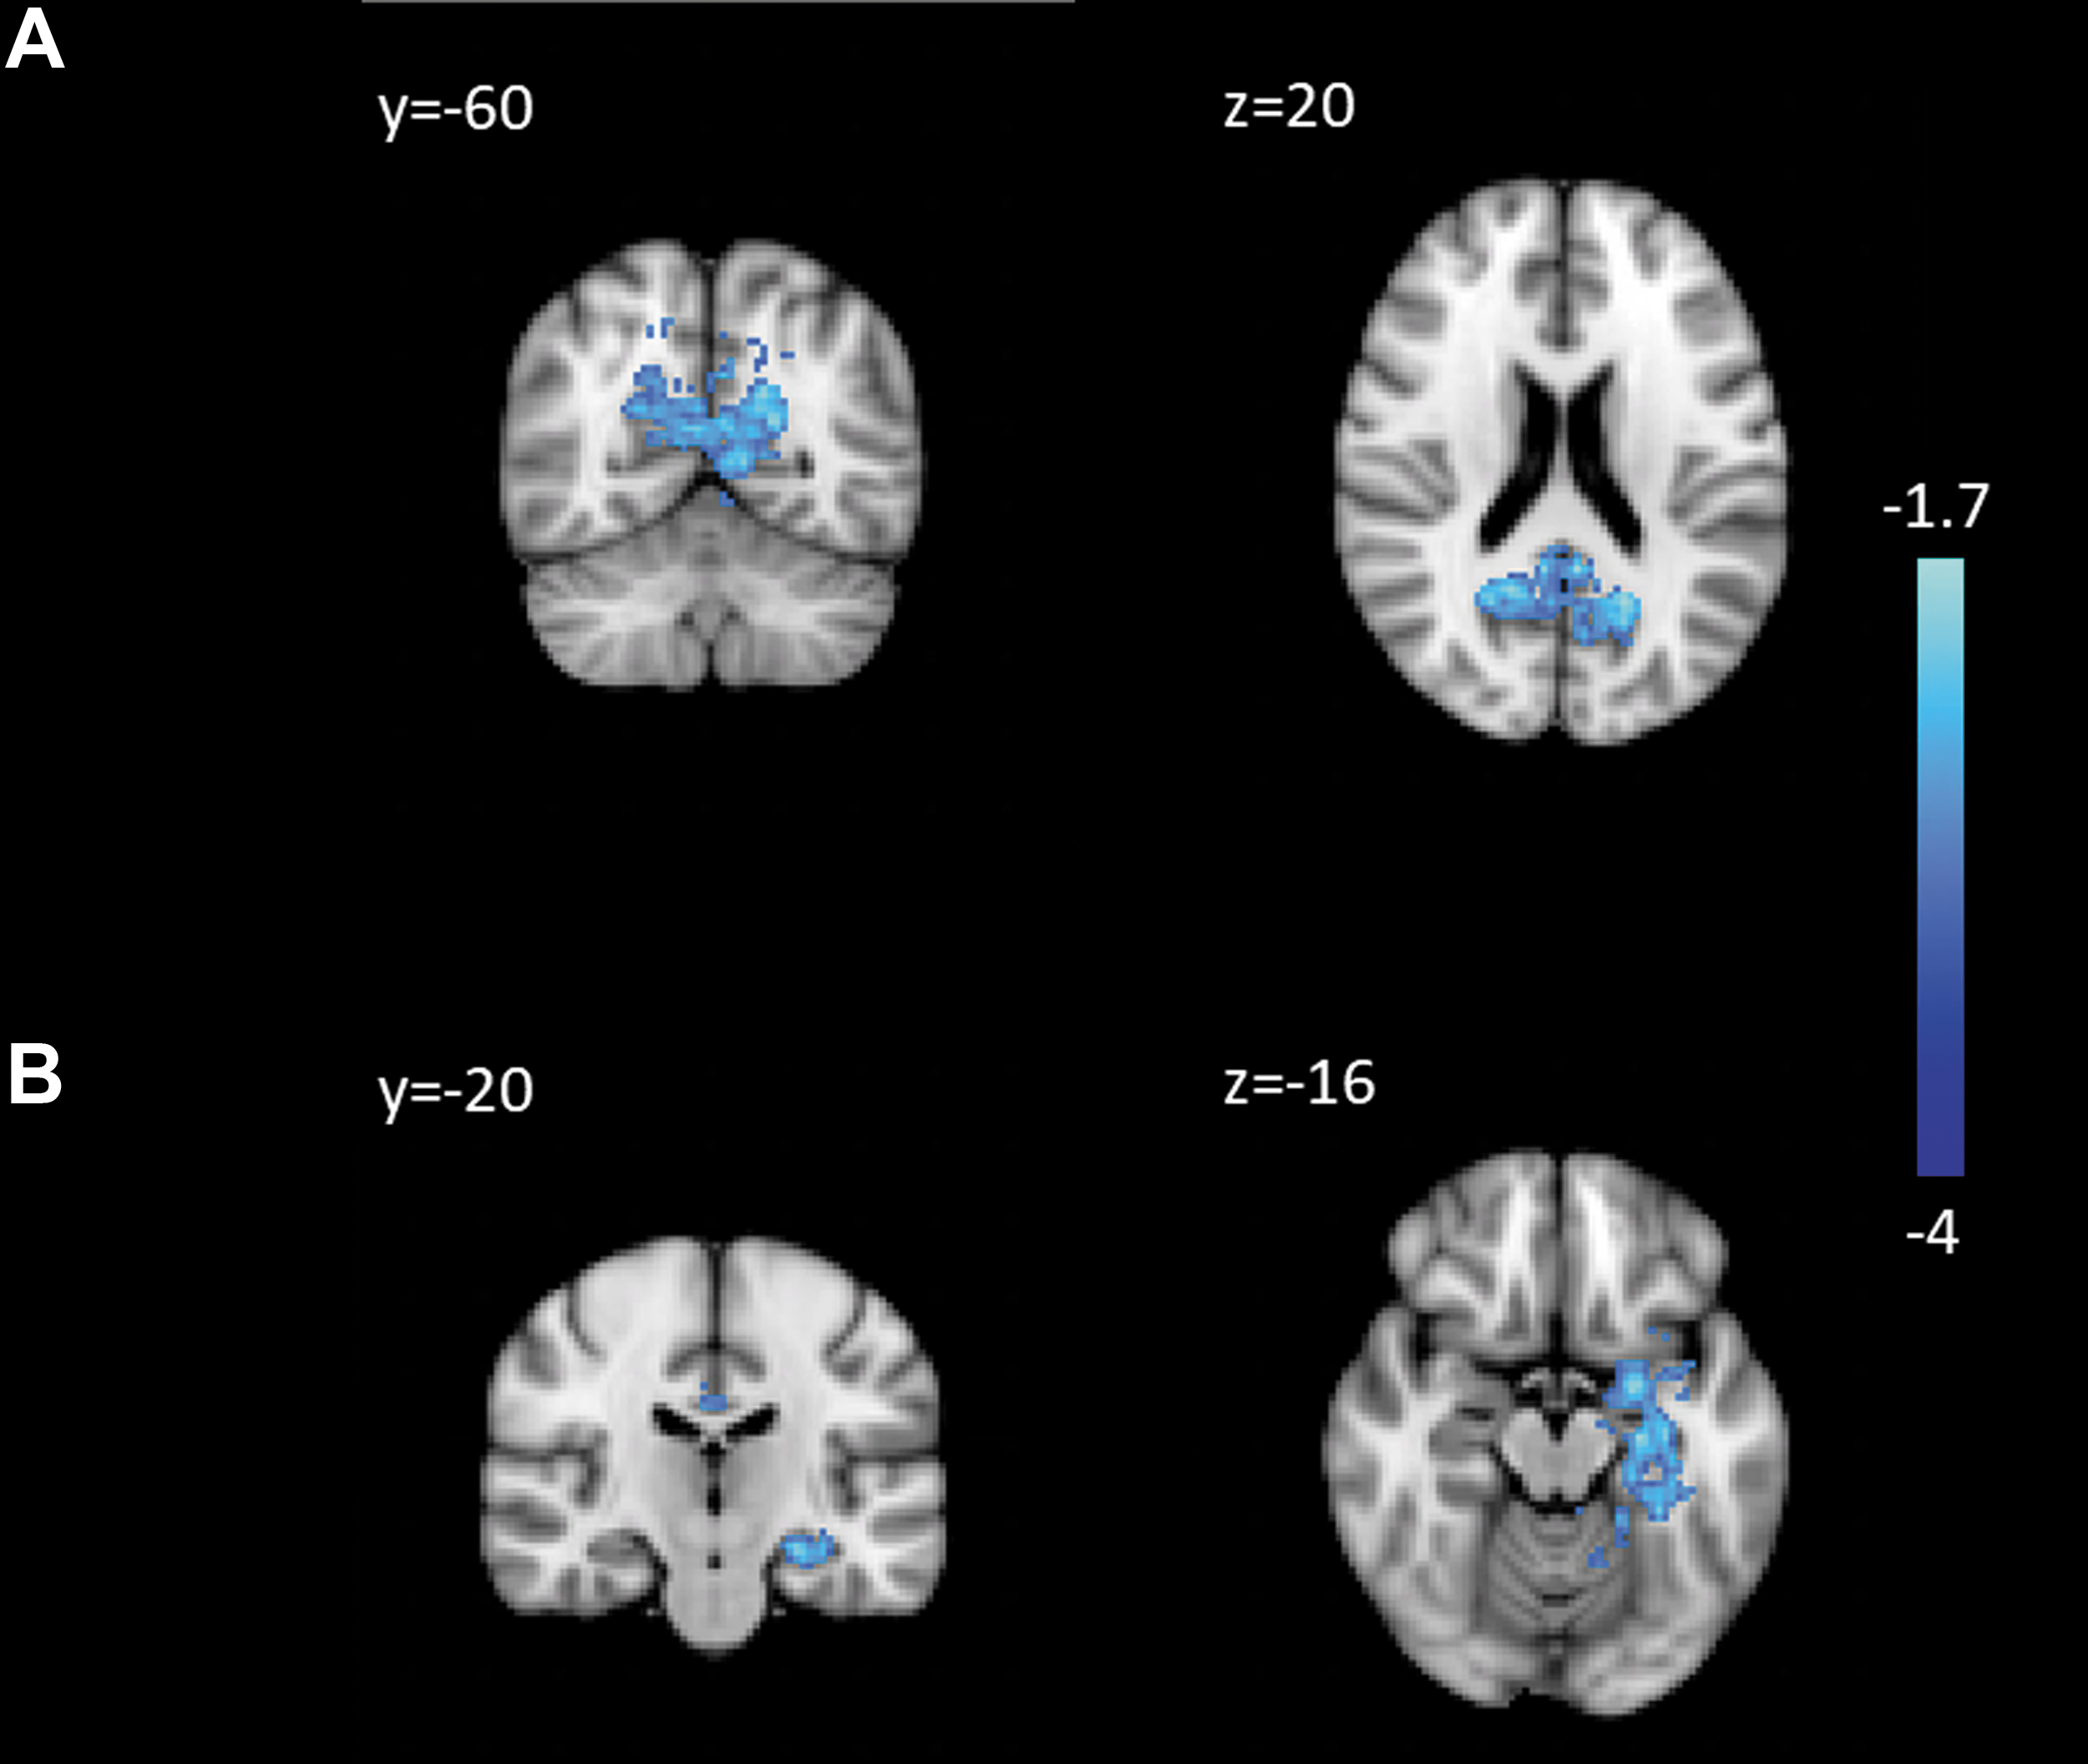
Regions of decreased connectivity in PD to the PCC ON dopaminergic medication: the PCC
Using a staged regression, we examined relationships between weights and demographic variables. HC-PCC1 component weights were not associated with any demographic variable (Supplementary Table S1). HC-PCC2 scores were associated with sex (women > men; β = −0.74, p = 0.036; Supplementary Table S2).
Medial prefrontal cortex
The first HC mPFC component (HC-mPFC1; Supplementary Fig. S6), which explained 33.4% of the variance, shows that lower connectivity from the PCC to the entire DMN is associated with lower SDBOLD in the occipital lobe.
The second and third HC mPFC components (HC-mPFC2, HC-mPFC2; Supplementary Figs. S7 and S8), which explained 8.2% and 5.1% of the variance, respectively, did not show any qualitatively important patterns.
Using a staged regression, we examined relationships between weights and demographic variables. No HC-mPFC component weights were associated with any demographic variable (Supplementary Tables S3–S5).
PD intra-modality
There were no differences in mPFC connectivity between medication states. However, PCC connectivity within the PCC and to the cingulate gyrus and left hippocampus was decreased ON relative to OFF (Fig. 3). There were no areas of higher PCC connectivity ON medication.
SDBOLD was higher ON medication across 40% of the mask, controlling for mean absolute motion in each scan (Fig. 4). SDBOLD increases were greatest in the posterior and superior portions of the brain, especially bilateral precuneus, sensorimotor cortex, and the cingulate cortex. There were no regions where SDBOLD was higher OFF compared with ON.
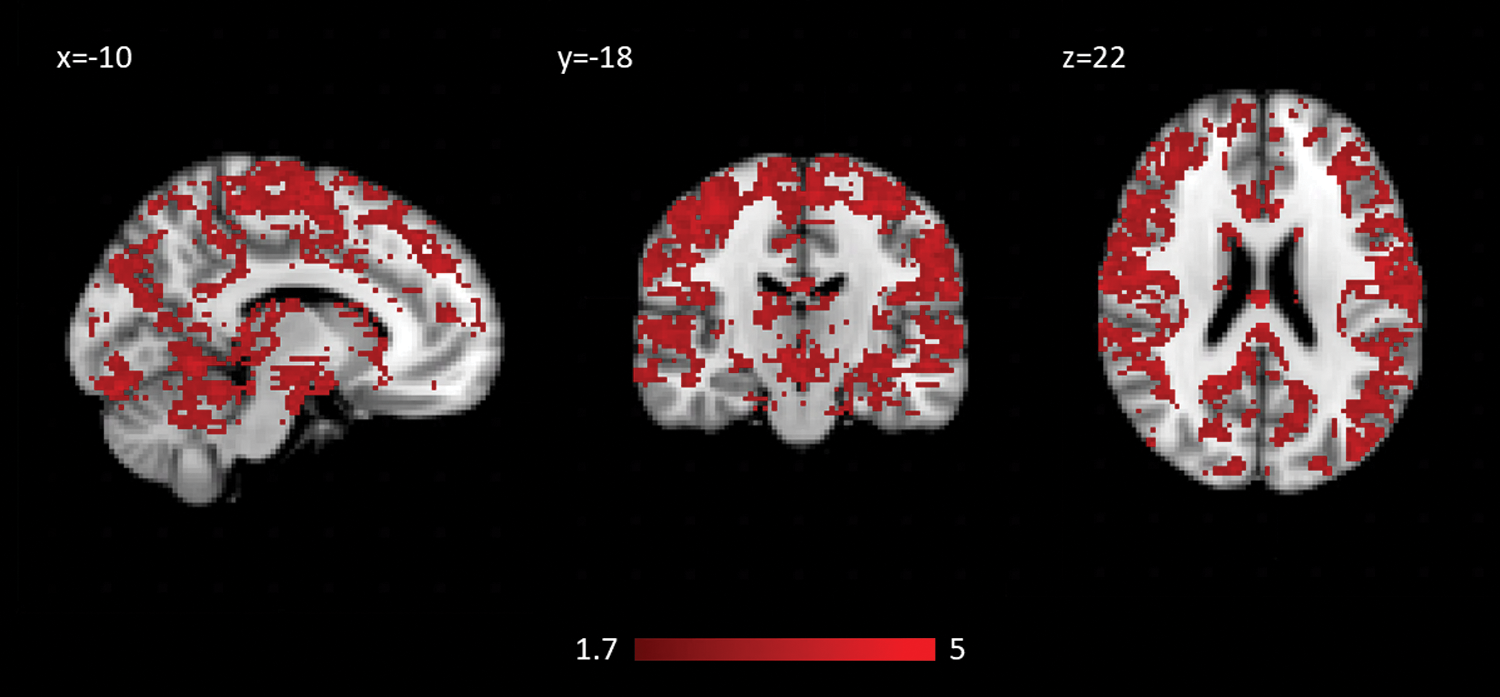
Regions of SDBOLD that increase ON dopaminergic medication in PD.
PD joint analyses
For each joint analysis we show the maps for each component as calculated for SDBOLD and connectivity. Connectivity maps for both modalities were thresholded at a Z score of ±1.7, to reflect 2 SDs above/below the mean, and are mainly used in an exploratory context. Next, we provide the results of the staged regression, in which we determine whether the differences between the individual weights of the components (ON-OFF) are related to demographic and disease severity variables. Based on the individual scree plots and our rule to extract components that explain 5% or more of the total variance (Supplementary Figs. S1 and S2), we extracted two independent components from the joint PCC analysis and four from the joint mPFC analysis.
Because the regressions operate on the whole-brain ICA, it is not necessary to correct for multiple comparisons, as we are not performing voxelwise analyses. We did not correct for multiple comparisons between the two seeds.
Component figures are normalized to low and high z scores of −4 and 4.
Posterior cingulate cortex
The first PD PCC component (PD-PCC1; Fig. 5), which explained 37.2% of the variance, shows that higher connectivity from the PCC to the DMN and lower connectivity to anterior attentional network regions are associated with higher SDBOLD in a large region surrounding the PCC and upper brainstem, with regions of lower SDBOLD in precentral and postcentral gyrus.
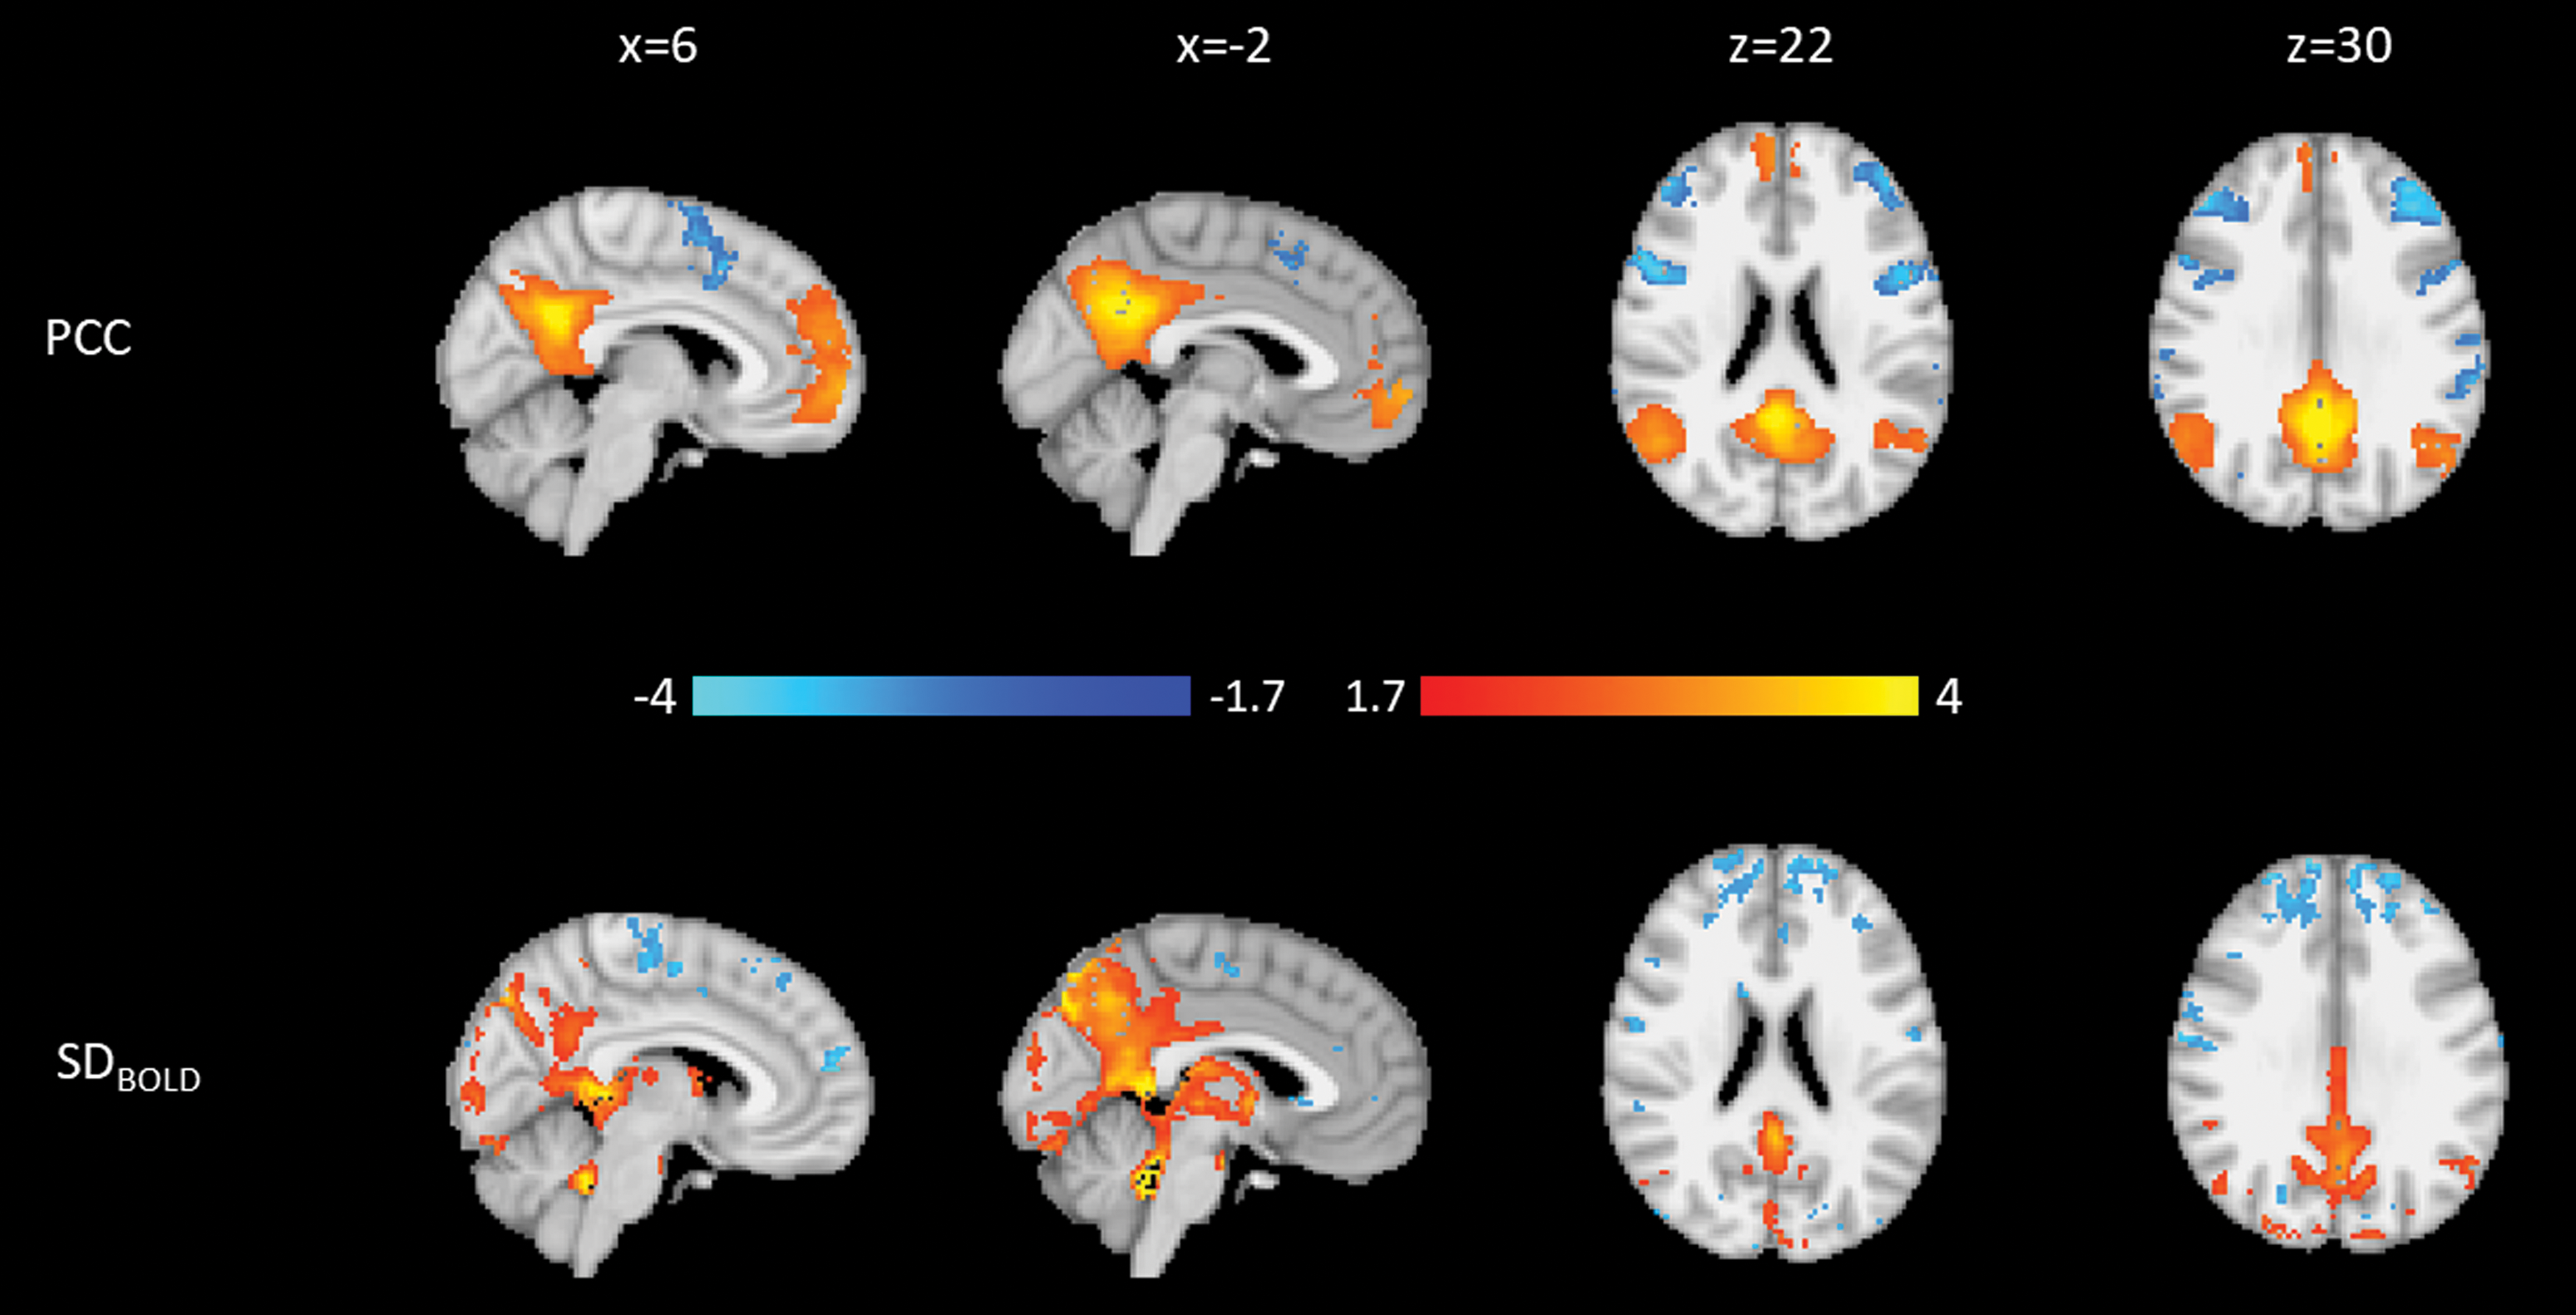
Weights for the first PD PCC component. Blue is negative, and orange is positive. Top: Connectivity to the PCC. Bottom: SDBOLD. Both modalities are normalized to a minimum of −4 and a maximum of 4.
The second PD PCC component (PD-PCC2; Supplementary Fig. S9), which explained 10.1% of the variance, shows higher connectivity within posterior elements of the DMN. These connectivity weights are associated with higher SDBOLD in the occipital lobe, posterior to regions that showed lower SDBOLD in PD-PCC1.
Using a staged regression, we examined relationships between medication state weights and demographic and disease severity variables. First, we used PD-PCC1 component weights associated with the ON scans as the outcome variable in our staged regression; then, we repeated the regression with component weights for the OFF scans as the outcome variable. No ON or OFF PD-PCC1 component weights were associated with demographic and disease severity. PD-PCC2 ON scores were associated with sex (women < men; β = 0.77, p = 0.042; Supplementary Table S11), and PD-PCC2 OFF scores were associated with MoCA score (β = −0.49, p = 0.014; Supplementary Table S10).
For each subject, we also regressed the medication state (ON-OFF) differences in their component weights against demographic and disease severity variables. No differences in component weights were associated with demographics or disease severity. The regression tables for the PCC components are available in Supplementary Data.
Medial prefrontal cortex
The first PD mPFC component (PD-mPFC1; Supplementary Fig. S10), which explained 20.9% of the variance, is a noisy component with lower connectivity to anterior cingulate cortex associated with higher SDBOLD in the precuneus cortex.
The second PD mPFC component (PD-mPFC2; Fig. 6), which explains 6.9% of the variance, shows that higher connectivity within the mPFC is related to a region of higher occipital SDBOLD, much like SDBOLD patterns in PD-PCC2 (Supplementary Fig. S8), which was characterized by high DMN connectivity and occipital SDBOLD.
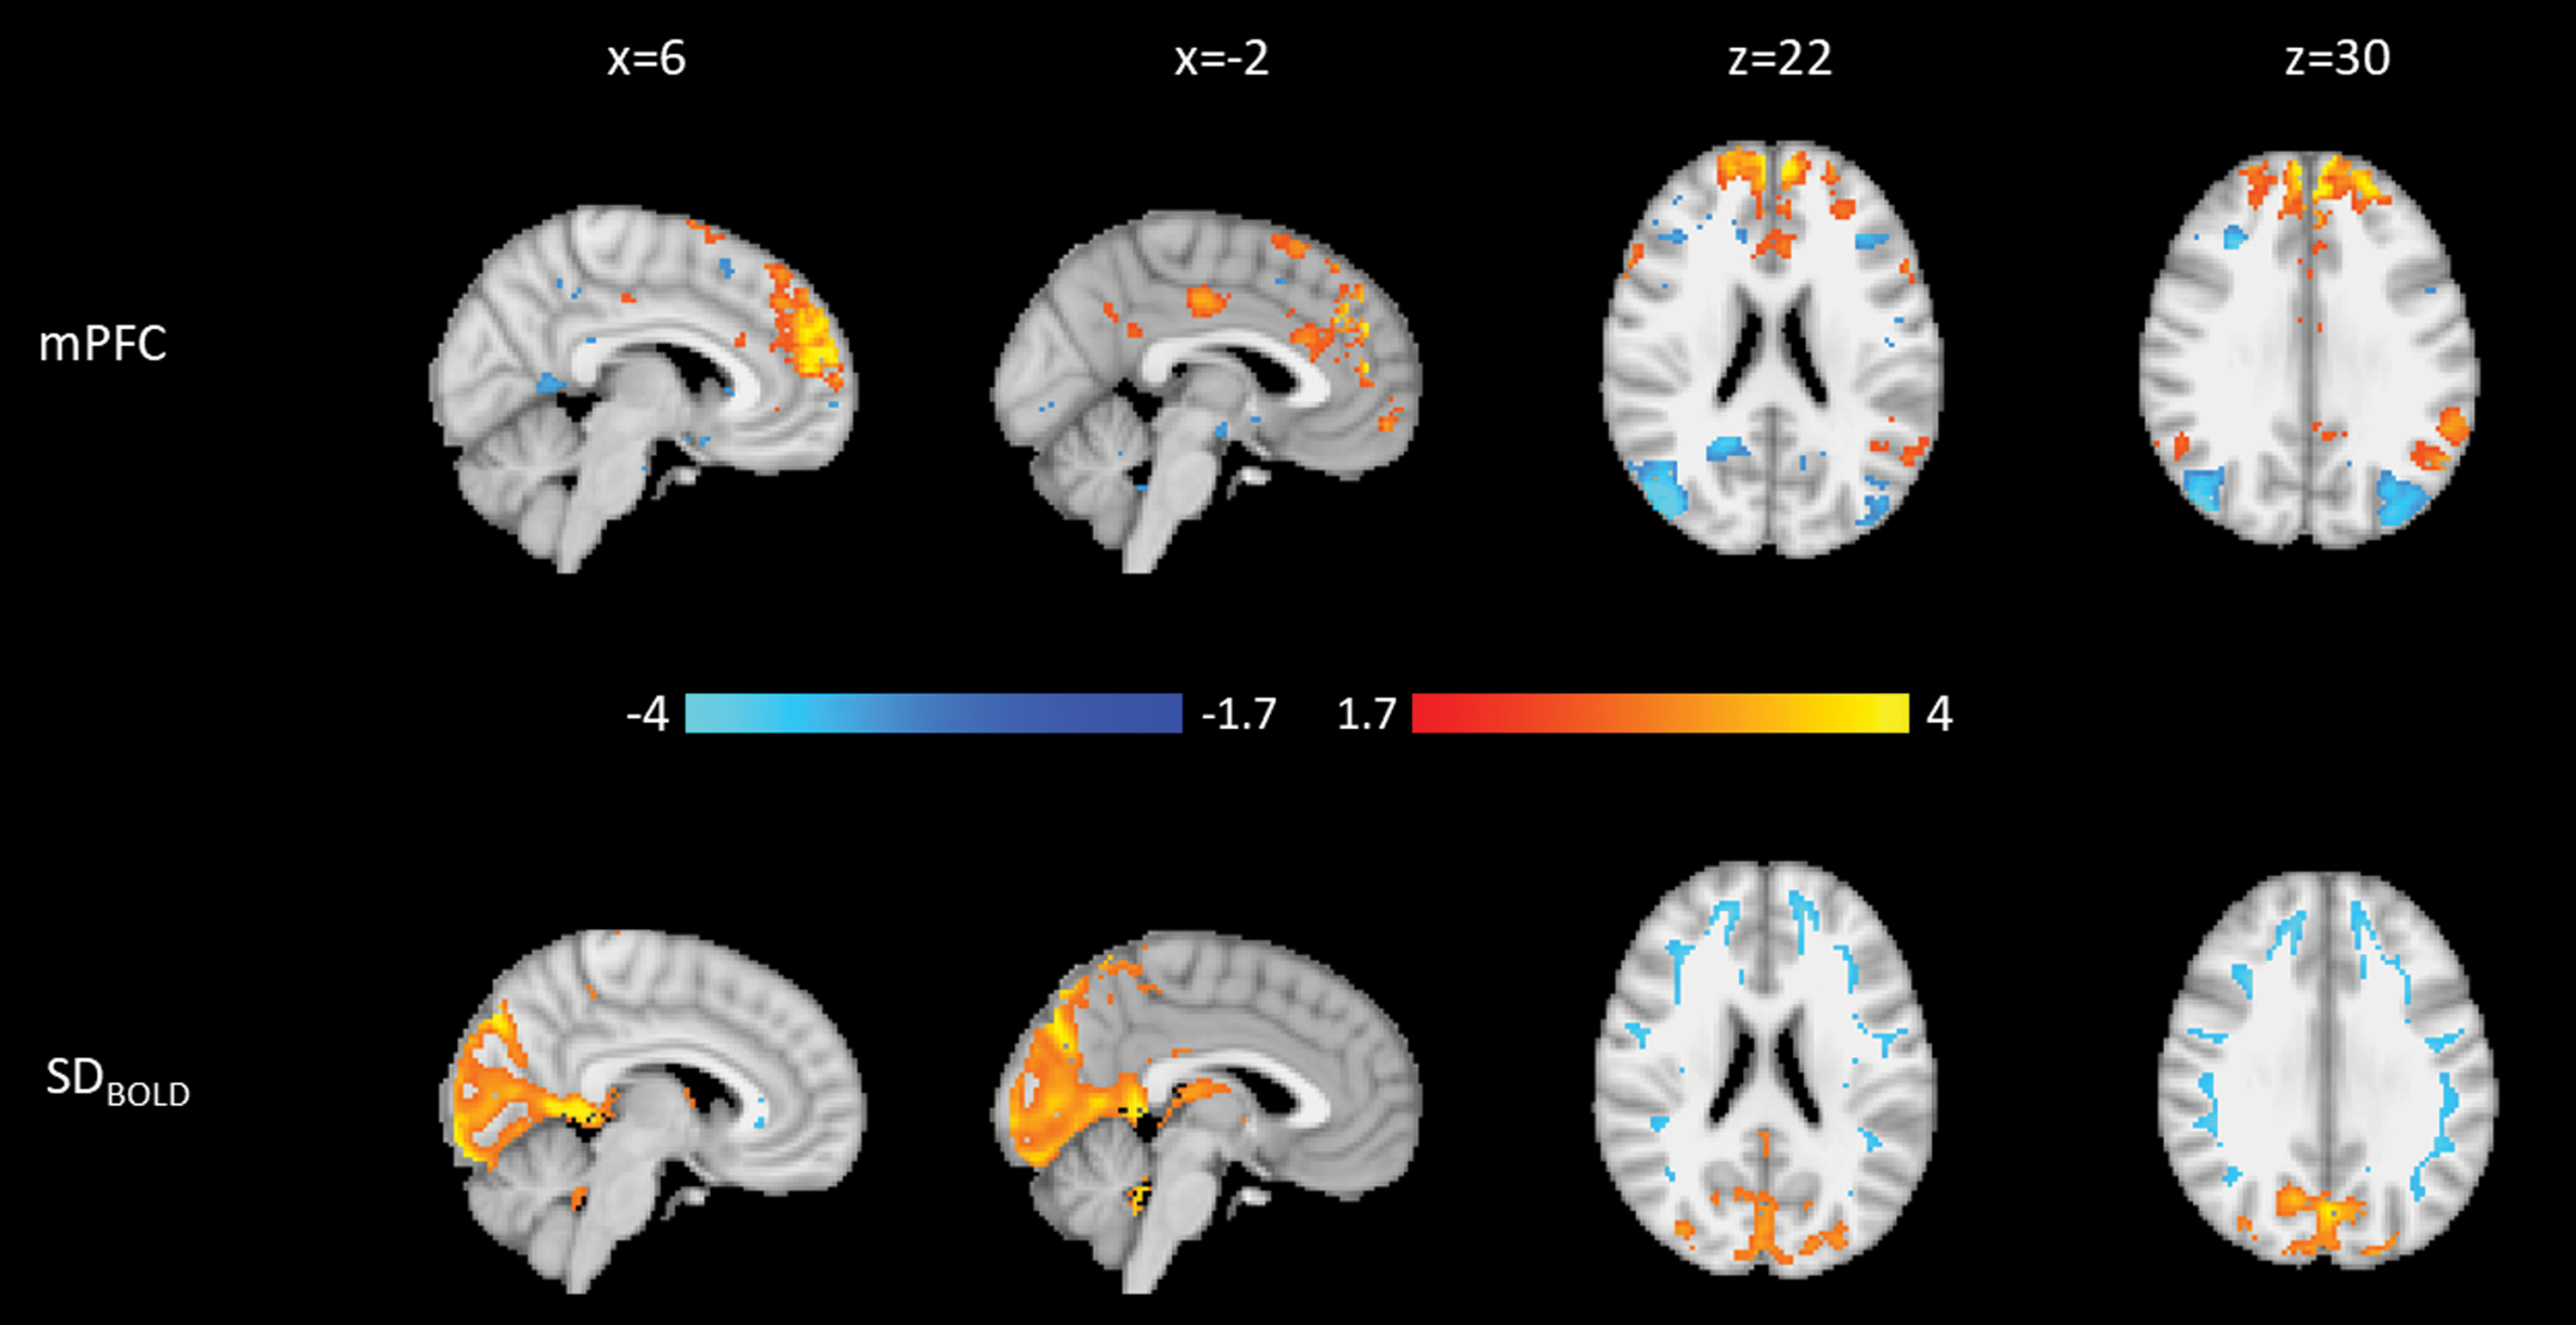
Weights for the second PD mPFC component. Blue is negative, and orange is positive. Top: Connectivity to the mPFC. Bottom: SDBOLD. Both modalities are normalized to a minimum of −4 and a maximum of 4.
The third PD mPFC component (PD-mPFC3; Fig. 7) explained 6.2% of the variance. PD-mPFC3 is consistent with PD-PCC1. Both components showed that higher DMN FC and lower FC to attentional regions are related to higher SDBOLD surrounding the PCC and upper brainstem. In addition, regions of lower SDBOLD are found surrounding the PCC and on the border of the occipital cortex anterior to regions of increases identified in PD-mPFC2, as well as in bilateral superior temporal gyrus.
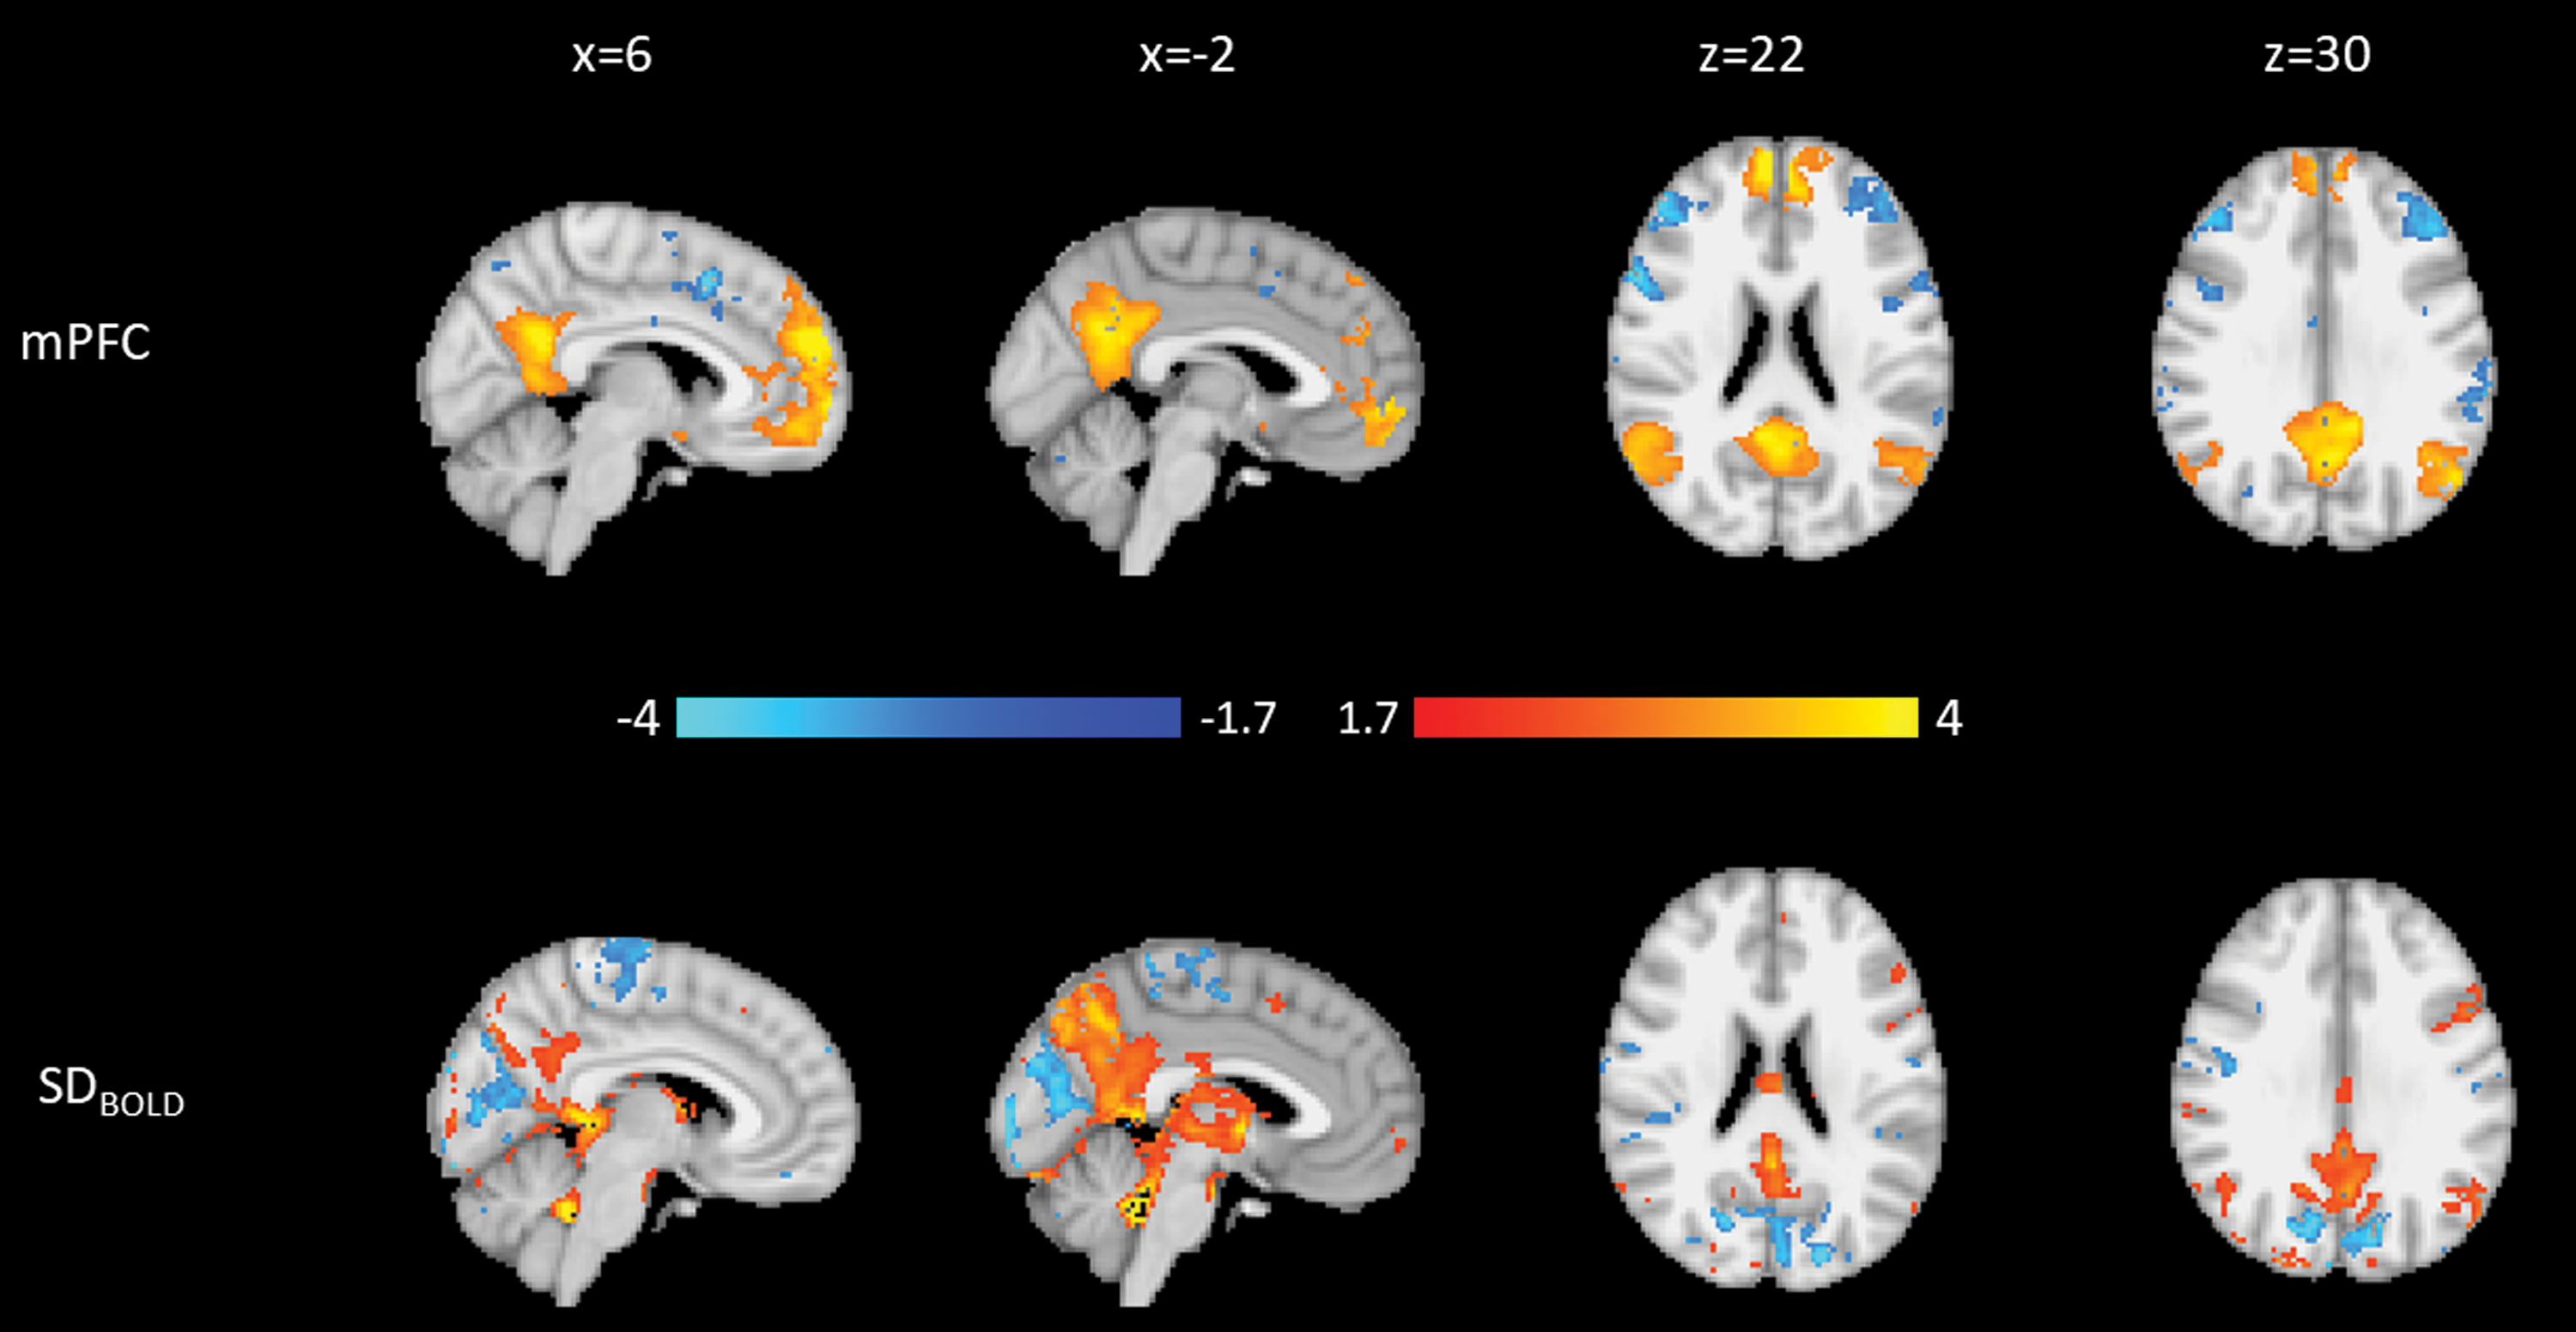
Weights for the third PD mPFC component. Blue is negative, and orange is positive. Top: Connectivity to the mPFC. Bottom: SDBOLD. Both modalities are normalized to a minimum of −4 and a maximum of 4.
The fourth PD mPFC component (PD-mPFC4; Supplementary Fig. S11), which explained 5.7% of the variance, shows small regions of higher connectivity to the PCC and scattered regions of lower connectivity in frontal regions of the cortex such as bilateral insular cortex and inferior frontal cortex. Lower SDBOLD is found in posterior regions of the brain, including occipital lobe and near the PCC.
In our regression analysis, the medication state weights alone for PD-mPFC1 and PD-mPFC4 were not associated with any demographic or disease severity variables. OFF weights for PD-mPFC2 were associated with MoCA score (β = −0.44, p = 0.02; Supplementary Table S15), as were OFF weights for PD-mPFC3 (β = 0.56, p = 0.002; Supplementary Table S16). ON weights for PD-mPFC2 and PD-mPFC3 were not associated with any demographic or disease severity variables.
For each subject, we regressed the medication state (ON-OFF) differences in their component weights against demographic and disease severity variables. Differences in component weights for PD-mPFC1 and PD-mPFC4 were not associated with demographics or disease severity; tables for these components are available in Supplementary Data.
Differences in weights for PD-mPFC2 (Table 2) are positively associated with MDS-UPDRS III OFF (β = 0.37, p = 0.026). Figure 7 shows the relationship of UPDRS III on the component score after accounting for the other regressors. Figure 8 indicates that the relationship between the MDS-UPDRS III OFF and PD-mPFC2 is stable ON, but it decreases with greater symptoms OFF. This means that the higher the MDS-UPDRS III motor symptoms, the greater the effect the dopaminergic medications have on increasing DMN connectivity to the mPFC and occipital SDBOLD within this joint component.
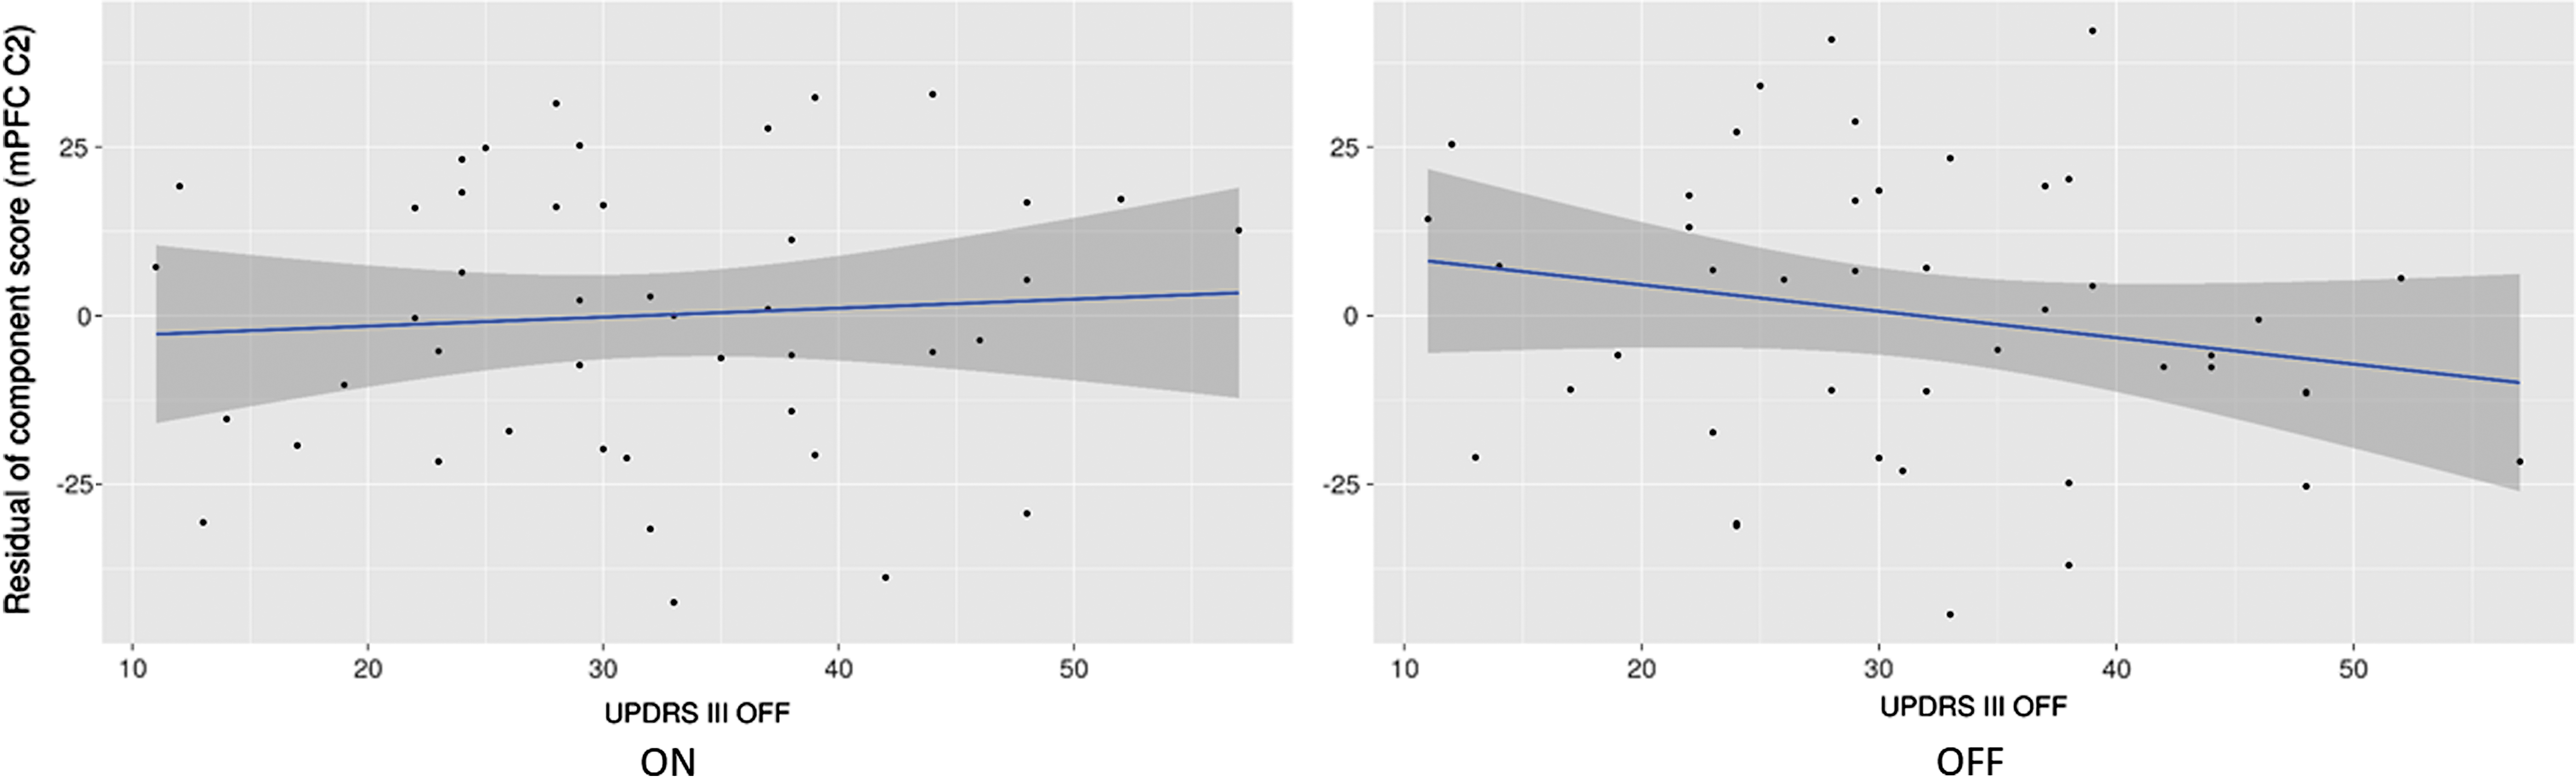
Residuals for the regression of mPFC C2 component scores versus UPDRS III OFF score, ON (left) and OFF (right) in PD.
Staged Regression for Differences in Scores for mPFC2
Rows in bold are significant at p < 0.05.
Difference in weights for PD-mPFC3 (Table 3) are associated with MoCA score (β = −0.41, p = 0.041). Figure 9 shows the effect of MoCA on the component score after controlling for the other regressors. Figure 9 shows that the relationship between PD-mPFC3 ON and MoCA is stable ON, but that OFF, PD-mPFC3 increases with cognitive ability. This means that the greater the cognitive impairment, the greater the effect of dopaminergic medications on increasing DMN FC and PCC/precuneus SDBOLD in this joint component.
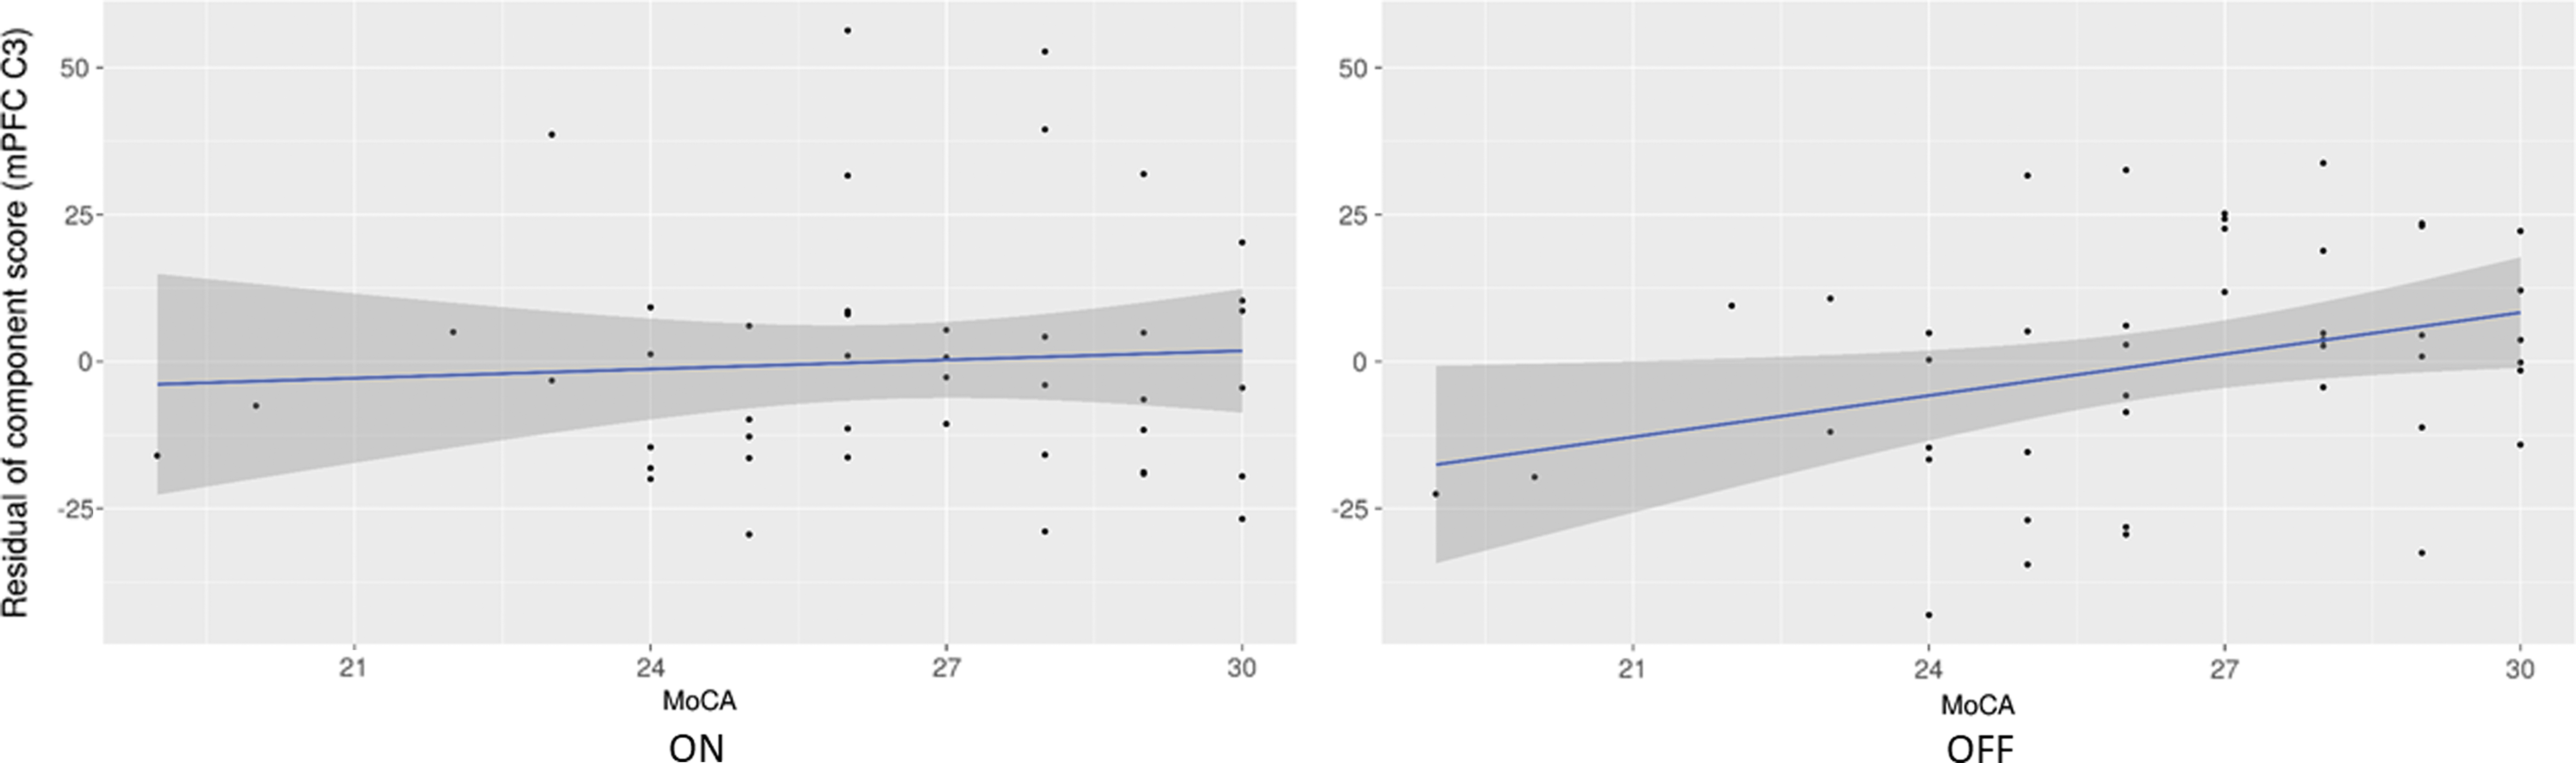
Residuals for the regression of mPFC C3 component scores versus MoCA score, ON (left) and OFF (right) in PD.
Staged Regression for Difference in Scores for mPFC3
Rows in bold are significant at p < 0.05.
Discussion
A few studies have investigated the relationship between SDBOLD and FC. Here, we examined the relationship between SDBOLD and DMN FC in healthy aging participants and those with PD, ON, and OFF levodopa. Among the healthy aging participants, we identified joint components of DMN FC and changes in occipital SDBOLD that we also show to be modified in PD. The most substantial HC finding was that some changes within the DMN are associated with gender, where women had higher DMN connectivity and occipital SDBOLD compared with men.
Among the participants with PD, we identified joint components of DMN FC and SDBOLD that were qualitatively similar to HC components, but separately associated with measurements of motor and cognitive impairment. Dopaminergic medications had a differential effect on these components depending on these measures of disease severity, “normalizing” the relationships. Importantly, we show that dopaminergic medication status matters in imaging PD; and it can affect both connectivity and SDBOLD. Imaging ON may lead to inflated estimates of SDBOLD and diminish the ability to measure changes associated with declining motor and cognitive capacities.
Dopaminergic medications also had profound effects on both DMN FC and SDBOLD measured separately. Dopaminergic medications reduced connectivity between the PCC and the left hippocampus, and they increased SDBOLD throughout much of the cortex. No regions had higher SDBOLD OFF medication. This is consistent with earlier findings that link higher cortical SDBOLD to healthier age-related cognition (Garrett et al., 2013, 2017; Guitart-Masip et al., 2016).
Joint analyses of both modalities identified DMN connectivity patterns associated with SDBOLD changes to occipital cortex and to a larger region of the precuneus/PCC. Higher component scores are related to higher SDBOLD in these regions along with higher connectivity within the DMN. Specifically, a component reflecting DMN connectivity and precuneus/PCC variability decreases with increasing cognitive impairment in the natural disease state, and a component reflecting DMN connectivity and occipital variability increases with increasing cognitive impairment.
Levodopa abolishes these relationships by increasing or decreasing these components differentially depending on the level of impairment. The precuneus component remained flat across the range of cognitive abilities ON. The occipital component is lowered for people with lower MDS-UPDRS III scores (representing less motor impairment) and increased for those with higher MDS-UPDRS III scores. The higher the MDS-UPDRS III, the greater the effect of dopaminergic medications on increasing the score of the component representing higher connectivity within the DMN and central occipital SDBOLD.
When MoCA scores are lower (representing worse cognitive performance), the larger the effect dopaminergic medications have on raising the score of the component that represents higher connectivity within the DMN and SDBOLD in the precuneus/PCC. We interpret our findings as meaning that the expression of the DMN changes in the unmedicated natural disease state, with stronger posterior DMN connectivity, higher precuneus/PCC SDBOLD, and greater anterior DMN connectivity and occipital SDBOLD being associated with greater cognitive impairment. Although there is no dose effect, levodopa and other PD medications “normalize” these aspects across the range of impairments.
Our study has some limitations. We controlled for motion at three levels: (1) in preprocessing with ME-ICA, which has been shown to be effective at removing gross motion-related artifacts, but not global signal changes related to respiratory action (Power et al., 2018); (2) at the level of joint analysis, by examining only components with anatomical structure; and (3) at the regression stage, by including gross motion parameters in the model. Differences in weights for multiple components were significantly associated with motion ON or OFF. We suggest that motion might be partially related to differences in the components caused by levodopa, which increases some forms of motion in PD and suppresses others, or to global signal changes that we were unable to remove. In addition, there were fewer HC (35) compared with PD (44). Finally, the PD cohort is somewhat homogenous in that they all are affected by the same condition; those with other pathologies were excluded. The HC cohort, on the other hand, though not affected by major conditions such as PD, may be more heterogenous in the underlying reasons for their cognitive impairment and/or dementia, affecting our ability to detect changes.
There was no effect of dopaminergic medication dose on change in component scores. This supports the idea of multiple systems changing the configuration of the brain, rather than solely being attributable to the action of levodopa. One such compensatory response may be the recruitment of the cholinergic system (Kim et al., 2018). In PD, the cholinergic system may interact with the dopaminergic system to produce a different effect of levodopa dependent on the level of impairment.
In summary, we demonstrate that joint analysis of fMRI analysis techniques can enrich the interpretation of FC alone. By examining the relationship between joint components and their alterations with dopaminergic medication state in PD, we observe that the physiologic effect of dopaminergic medications depended on disease severity, but not medication dosage. These findings emphasize the importance of assessing the physiologic impact of PD in the unmedicated (OFF) state.
Footnotes
Acknowledgments
This research was supported by grants from the National Institutes of Health P50NS062684 (PI: T.J.M.) and R01NS099199 (PI: T.M.M.).
Authors' Contributions
Design of study: T.K.M.D., T.M.M., A.L. Analysis of data: T.K.M.D., T.M.M., A.L. Interpretation of data: T.K.M.D., T.M.M., C.P.Z., T.J.M., T.J.G. Drafting article: T.K.M.D., T.M.M., A.L., C.P.Z., T.J.M., T.J.G.
Author Disclosure Statement
No competing financial interests exist.
Supplementary Material
Supplementary Data
References
Supplementary Material
Please find the following supplemental material available below.
For Open Access articles published under a Creative Commons License, all supplemental material carries the same license as the article it is associated with.
For non-Open Access articles published, all supplemental material carries a non-exclusive license, and permission requests for re-use of supplemental material or any part of supplemental material shall be sent directly to the copyright owner as specified in the copyright notice associated with the article.